Special Report
America's Best States to Live In

Published:
Last Updated:
Americans often evaluate their home states according to such subjective conditions as climate preference, the presence of friends and family, and personal history. In addition to these subjective measures, more objective socioeconomic factors also contribute to life satisfaction. It is such quantitative measures that can help assess the broader quality of life in a given state.
24/7 Wall St. reviewed three statewide social and economic measures — poverty rate, educational attainment, and life expectancy at birth — to rank each state’s living conditions. Socioeconomic outcomes vary greatly between states.
[in-text-ad]
Massachusetts, home to one of the nation’s wealthiest and most highly educated populations, leads the nation in quality of life. Mississippi, the poorest state in the country, trails the other 49 states.
Click here to see how all 50 states compare in quality of life.
While satisfactory living conditions are possible with low incomes, this is true only to a point. Once incomes fall below the poverty line, for example, financial constraints are far more likely to diminish quality of life. New Mexico and Mississippi report poverty rates of over 20%.
Education levels are another major contributor to a community’s living conditions — not just as a basis of economic prosperity, but also as a component of an individual’s quality of life. Due in part to the greater access to high paying jobs that often require a college degree, incomes also tend to be higher in these states. In all of the 15 best states in which to live, the typical household earns more than the national median household income of $55,775.
Many of these strong socioeconomic measures lead to better living conditions, which in turn help lead healthier and longer lives — also used in ranking states. The difference in life expectancy between Mississippi, where people tend to live the shortest lives, and Massachusetts, is 5.6 years. The likelihood of living a relatively long life as a resident of a particular state is closely associated with that state’s living conditions.
Housing markets are also indicative of quality of living. A high median home value, for instance, frequently means high demand for housing in the area. Nationwide, the typical home is worth $194,500. In most of the 25 top states, the median home value far exceeds the nationwide median.
Lower home values are indicative of and contribute to relatively affordable costs of living. Of course, low home values are also a product of a lack of demand in a housing market, which is often driven by poor living conditions. The average cost of goods and services in most of the best states to live is greater than the national average, while the average cost of living in all of the 25 states on the lower end of our list is less than the national average.
To identify the best and worst states in which to live, 24/7 Wall St. devised an index composed of three socioeconomic measures for each state: poverty rate, the percentage of adults who have at least a bachelor’s degree, and life expectancy at birth. The selection of these three measures was inspired by the United Nations’ Human Development Index. Poverty rates and bachelor attainment rates came from the U.S. Census Bureau’s 2015 American Community Survey. Life expectancies at birth are from the Centers for Disease Control and Prevention and are as of 2012, latest year for which data is available. Unemployment rates are from the Bureau of Labor Statistics, and are for October 2016, the most recent available month of data.
These are the best and worst states to live in.

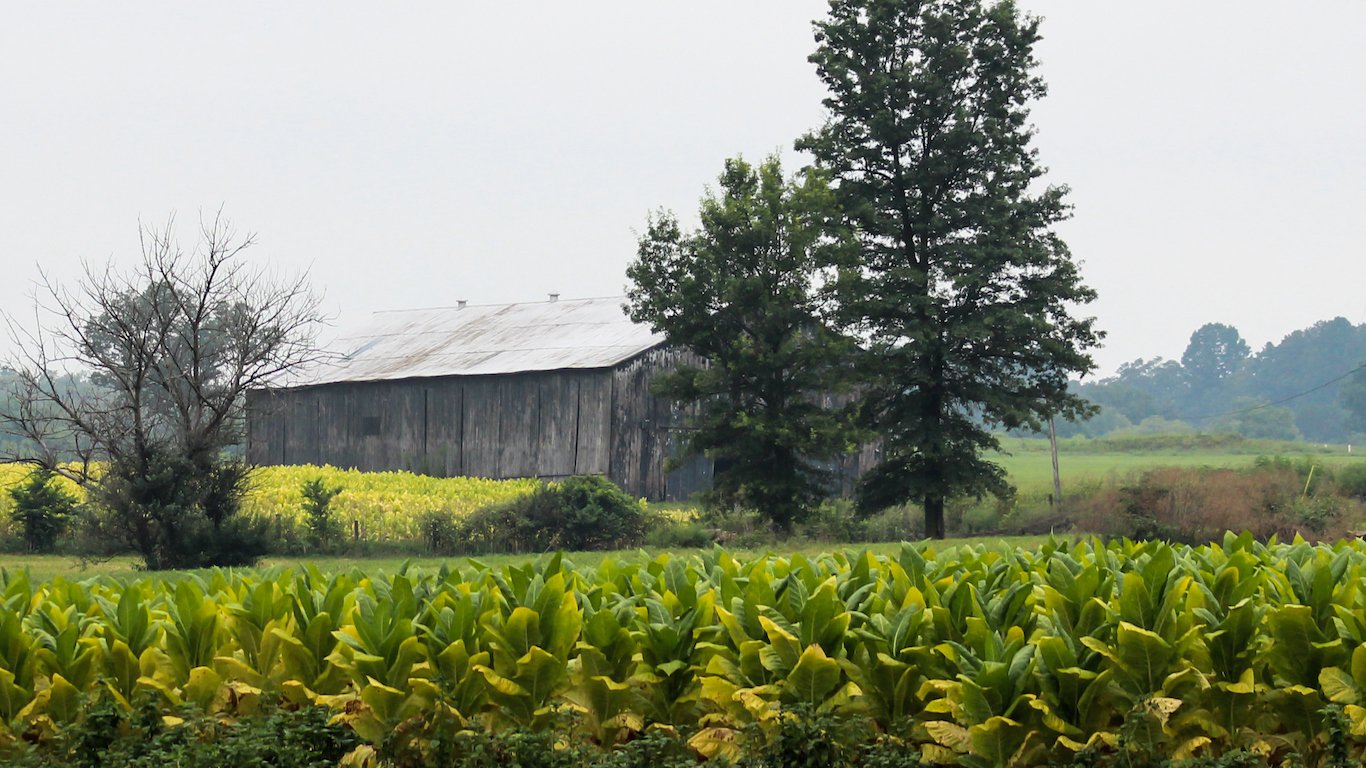
50. Mississippi
> 10-yr. population growth: 6.0% (11th lowest)
> Oct. unemployment rate: 5.9% (5th highest)
> Poverty rate: 22.0% (the highest)
> Life expectancy at birth: 74.5 years (the lowest)
Based on a range of social and economic factors, Mississippi is the worst state to live in. With the nation’s highest poverty rate of 22.0% and the lowest life expectancy of 74.5 years, economic factors have likely had an adverse effect on the quality of life of Mississippians. While health insurance coverage has increased dramatically across the nation in recent years, many Americans, especially those in low income families, remain uncovered. The typical household in Mississippi earns $40,593 annually, the lowest of all states and in stark contrast to the national annual household income of $55,775. The percentage of people without health insurance in Mississippi, at 12.7%, is sixth highest of all states.
[in-text-ad]
The cost of living in Mississippi is the lowest in the nation, yet for most people it is nowhere near enough to offset the low incomes. On average, goods and services cost about 13% less in the state than across the nation.

49. West Virginia
> 10-yr. population growth: 4.1% (6th lowest)
> Oct. unemployment rate: 6.0% (4th highest)
> Poverty rate: 17.9% (7th highest)
> Life expectancy at birth: 75.4 years (3rd lowest)
Population declines are typically due in large part to weak economic conditions. The vast majority of states, even ones ranked poorly on this list, have growing populations. West Virginia’s population, on the other hand, actually shrank slightly over the last five years. This appears to be the case in West Virginia, where the unemployment rate of 6.0% is fourth highest of all states, and the poverty rate of 17.9% is among the highest in the nation.
Unlike many states with a poorly-rated quality of life, West Virginia’s violent crime rate is below average. For every 100,000 state residents, 338 violent incidents were reported in 2015, lower than the national violent crime rate of 373 per 100,000 people.

48. Louisiana
> 10-yr. population growth: 6.4% (13th lowest)
> Oct. unemployment rate: 6.3% (3rd highest)
> Poverty rate: 19.6% (3rd highest)
> Life expectancy at birth: 75.4 years (4th lowest)
Roughly one in five Louisiana residents live at or below the poverty line, the third highest poverty rate of all states. Financial struggles across the state are likely exacerbated by an inadequate job market. Louisiana’s 6.3% unemployment rate is nearly the highest in the country and well above the 4.9% nationwide rate. Most Americans have health insurance through their employers, and a lack of jobs likely contributes to the higher than average uninsured rate. Nearly 12% of Louisiana residents are without health insurance, a far larger share than the 9.4% uninsured rate nationwide.
High crime rates across the state also detract from the overall quality of life. There were 540 violent crimes — such as rape, murder, and robbery — for every 100,000 state residents last year, a higher share than in all but four other states.

47. Arkansas
> 10-yr. population growth: 10.2% (25th lowest)
> Oct. unemployment rate: 4.0% (13th lowest)
> Poverty rate: 19.1% (4th highest)
> Life expectancy at birth: 75.8 years (7th lowest)
Incomes are low in Arkansas. The typical household in the state earns only about $42,000 a year, nearly $14,000 less than the typical American household. Partially offsetting the lower incomes is the relatively low cost of living. Goods and services cost about 12.5% less across the state than they do on average nationwide. Still, 19.1% of Arkansas residents live in poverty, a higher poverty rate than in all but three other states.
People living in poverty are less likely to be able to afford healthy food regularly. In Arkansas, one-third of adults are obese and more than one in five adults report being in fair or poor health, each among the highest shares in the country. Life expectancy is only 75.8 years in Arkansas, nearly three years less than the average life expectancy across the United States.

46. Alabama
> 10-yr. population growth: 9.4% (21st lowest)
> Oct. unemployment rate: 5.7% (7th highest)
> Poverty rate: 18.5% (5th highest)
> Life expectancy at birth: 75.2 years (2nd lowest)
Life expectancy at birth in Alabama is only 75.2 years, the lowest in the country after Mississippi. A low life expectancy is partially attributable to pervasive unhealthy habits. More than one in five adults in Alabama are smokers and more than a third are obese, each among the largest such shares in the country.
Alabama residents are also more likely to be facing financial hardship than most Americans. The typical household in Alabama earns only $44,765 a year, roughly $11,000 less than the national median income. Similarly, 18.5% of state residents live in poverty, far greater than the national poverty rate of 14.7%.
45. Kentucky
> 10-yr. population growth: 9.0% (18th lowest)
> Oct. unemployment rate: 5.1% (19th highest)
> Poverty rate: 18.5% (5th highest)
> Life expectancy at birth: 75.7 years (6th lowest)
Kentucky is one of the poorest states in the country. Median household income across the state is only $45,215 a year, about $10,600 less than the median income nationwide. Home values across the state are also among the lowest in the country. The typical Kentucky home is worth only $130,000, about $64,500 less than the median home value nationwide.
[in-text-ad]
Unhealthy habits likely contribute to some poor health outcomes in Kentucky. More than one in four adults in the state are smokers, nearly the highest smoking rate in the country. Because the habit is so common, it likely plays a role in the state’s average life expectancy, which at 75.7 years is one of the lowest in the country.
44. Oklahoma
> 10-yr. population growth: 13.9% (19th highest)
> Oct. unemployment rate: 5.2% (14th highest)
> Poverty rate: 16.1% (13th highest)
> Life expectancy at birth: 75.6 years (5th lowest)
Household income in Oklahoma is one of the lowest of all states, and the state’s poverty rate one of the highest. Earnings are closely tied to educational attainment, as postsecondary education yields greater opportunities for higher-paying jobs. In Oklahoma, just 24.6% of adults have a bachelor’s degree, the eighth lowest college attainment rate in the country.
Due to factors such as stress and a lack of access to healthier lifestyle choices and care, poverty is associated with a variety of negative health outcomes. About one in every five Oklahoma residents are in either fair or poor health, among the worst of all states.

43. Tennessee
> 10-yr. population growth: 13.6% (20th highest)
> Oct. unemployment rate: 4.8% (25th highest)
> Poverty rate: 16.7% (10th highest)
> Life expectancy at birth: 76.1 years (8th lowest)
Tennessee has one of the worst violent crime rates in the nation. There were more than 600 violent incidents reported per 100,000 residents last year, much higher than the national rate of 373 incidents per 100,000 Americans. The state also has among the highest poverty rates and lowest incomes in the country.
Living in conditions of poverty or in areas with high crime has been shown to have harmful effects on residents’ mental and physical well-being. This appears to have been a factor in Tennessee, where 22.9% of adults report being in less than optimal, the third highest proportion in the country and well above the national proportion of 14% of adults reporting such poor health.
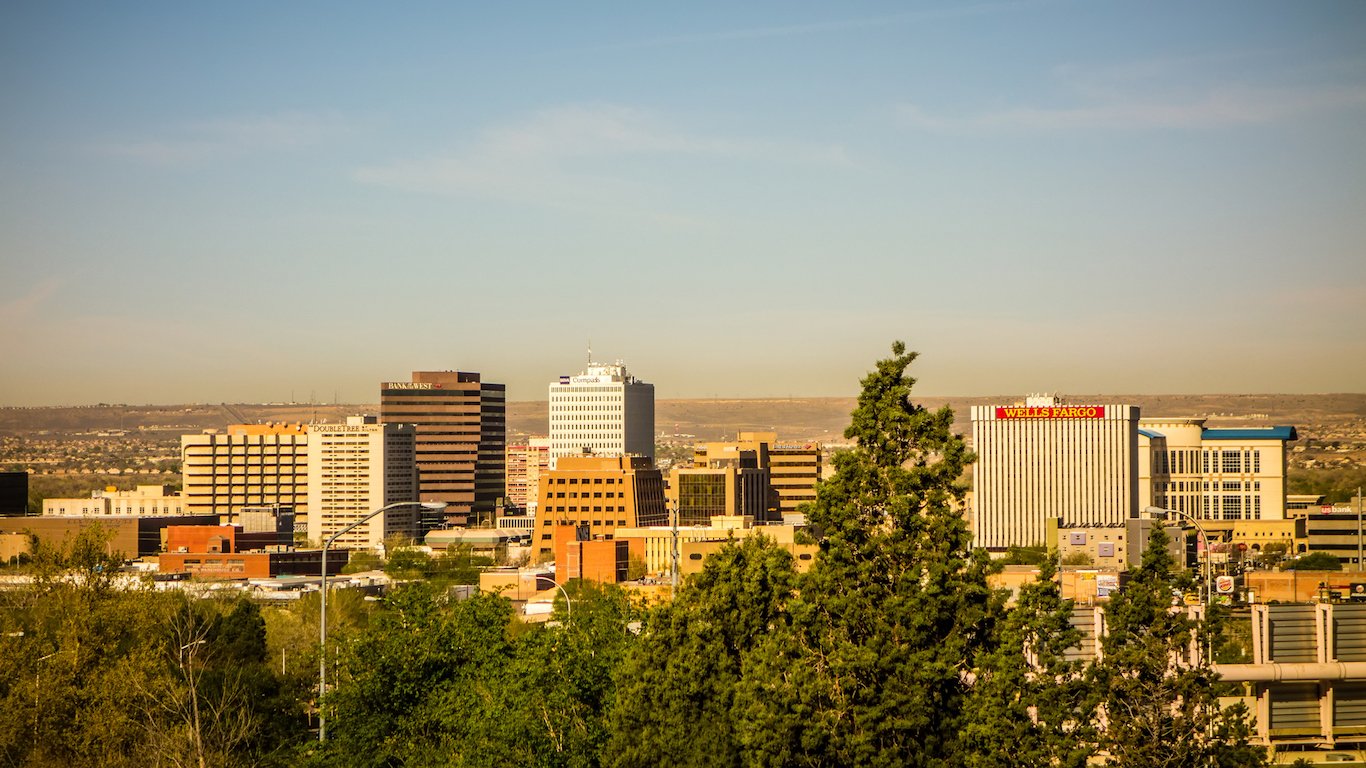
42. New Mexico
> 10-yr. population growth: 10.5% (25th highest)
> Oct. unemployment rate: 6.7% (2nd highest)
> Poverty rate: 20.4% (2nd highest)
> Life expectancy at birth: 77.9 years (18th lowest)
New Mexico has the second highest unemployment rate in the country at 6.7%. It also has the third highest violent crime rate at 656 incidents per 100,000 residents, compared to a national rate of 373 incidents per 100,000 Americans.
Nationwide, 14.7% of the population lives at or below the poverty line. In New Mexico, over 20% of the population is poor, the second highest poverty rate of any state. High poverty tends to yield a variety of negative health outcomes, and more than one in five adults in the state report being in less than optimal health, compared to the national proportion of 14% of adults.

41. South Carolina
> 10-yr. population growth: 19.0% (7th highest)
> Oct. unemployment rate: 4.7% (24th lowest)
> Poverty rate: 16.6% (11th highest)
> Life expectancy at birth: 76.5 years (9th lowest)
South Carolina ranks as the 10th worst state to live in based on its high poverty, low educational attainment, and relatively low life expectancy. Most states that share these three characteristics also tend to have above average violent crime rates, and South Carolina is no different. Over 500 violent crimes were committed per 100,000 state residents last year, significantly higher than the national violent crime rate of 373 incidents per 100,000 Americans.
High crime has been shown to have a negative impact on populations, not just on victims but on entire neighborhoods by causing stress, depressing property values, and making areas less attractive to businesses.

40. Georgia
> 10-yr. population growth: 15.8% (13th highest)
> Oct. unemployment rate: 5.2% (14th highest)
> Poverty rate: 17.0% (9th highest)
> Life expectancy at birth: 76.9 years (10th lowest)
Due to the high poverty rate and relatively low life expectancy, Georgia ranks among the worst states to live in. The 17.0% share of state residents living in poverty is well above the 14.7% national poverty rate. Additionally, 13.9% of the Peach State’s population lack health insurance, nearly the highest uninsured rate of any state. Difficult financial circumstances and inadequate health care coverage likely make it difficult for large segments of the population to lead healthy lives. Partially as a result, life expectancy in the Georgia is only 76.9 years, 1.6 years below the average life expectancy nationwide.
[in-text-ad]

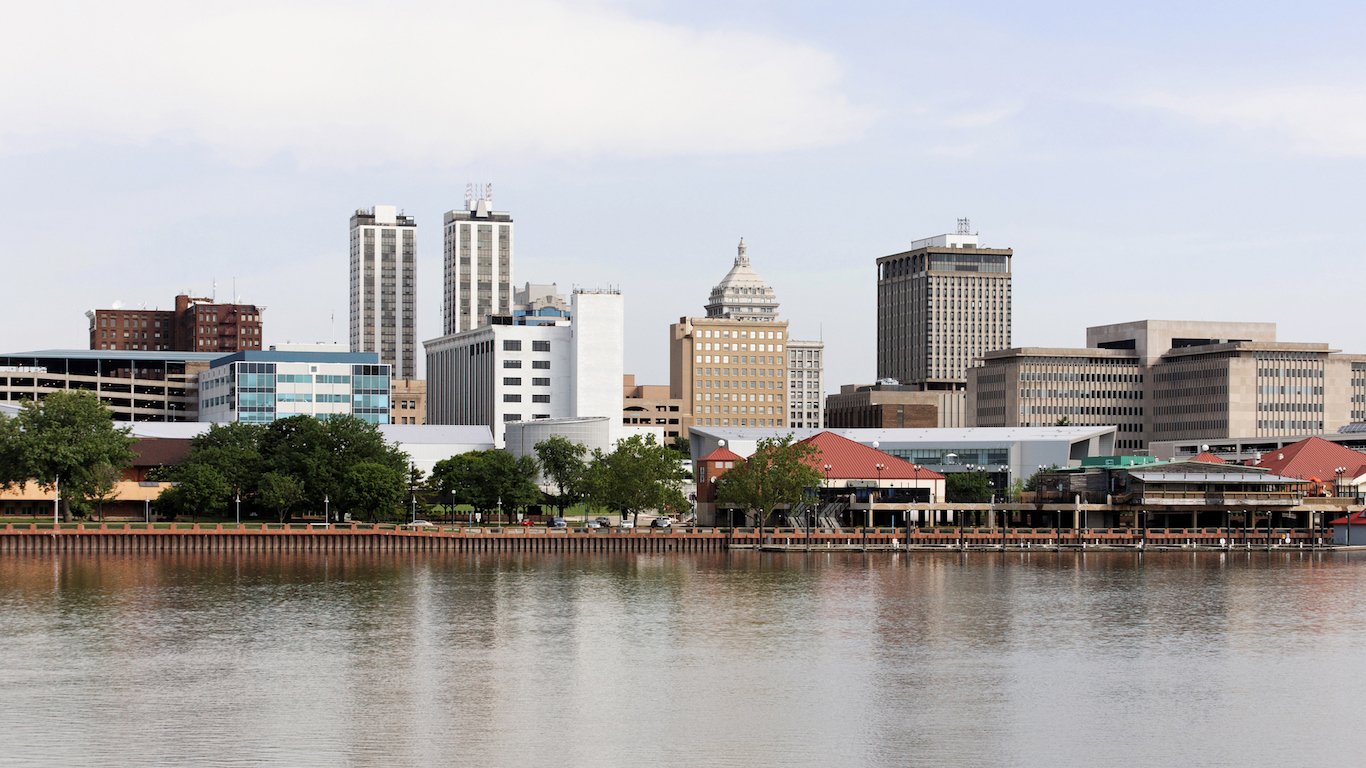
39. Indiana
> 10-yr. population growth: 8.6% (17th lowest)
> Oct. unemployment rate: 4.4% (21st lowest)
> Poverty rate: 14.5% (25th highest)
> Life expectancy at birth: 77.2 years (12th lowest)
Just 24.9% of Indiana’s adult population currently has a college education, compared to a national share of 30.6%. Those without a college degree tend to earn less than their peers. This may help explain Indiana’s median household income of $50,532, which is about $5,000 less than the national median.
Indiana residents also have among the lower life expectancies in the country. This appears to be at least partially due to state residents’ poor health choices. The state has among the higher rates of smoking, obesity, and physical inactivity in the country. These unhealthy behaviors tend to be more prominent in states with lower college attainment and lower incomes.
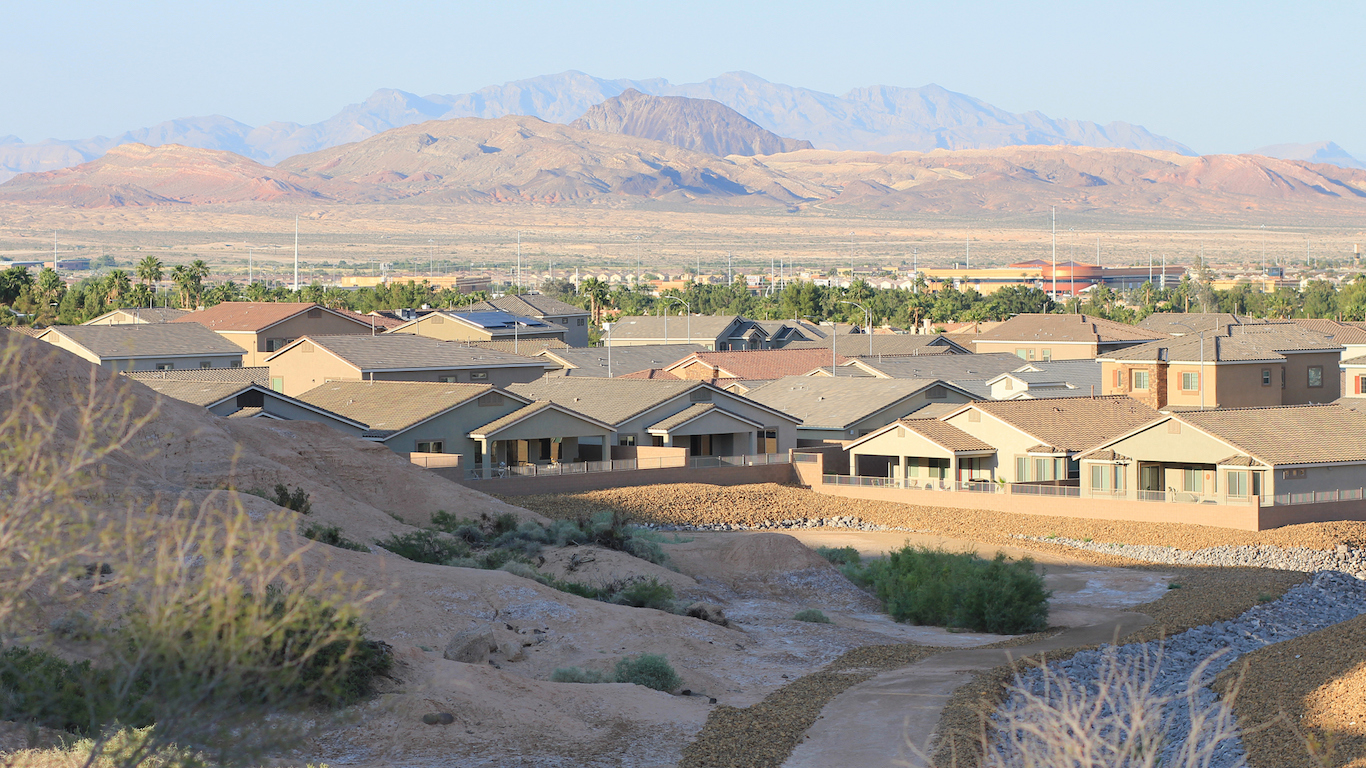
38. Nevada
> 10-yr. population growth: 21.4% (4th highest)
> Oct. unemployment rate: 5.5% (9th highest)
> Poverty rate: 14.7% (23rd highest)
> Life expectancy at birth: 77.9 years (17th lowest)
A well-educated population is better equipped to weather economic downturns and raise healthy families. In Nevada, fewer than one in four adults have earned a bachelor’s degree, nearly the smallest share of any state in the country. Lower educational attainment likely exacerbates the state’s far higher than average 5.5% unemployment rate.
The state is also struggling with high crime. Violent crime, which includes rape, robbery, homicide, and aggravated assault, can detract considerably from quality of life in a given region. In Nevada, there are 696 violent crimes for every 100,000 residents, more than in any other state with the exception of Alaska.
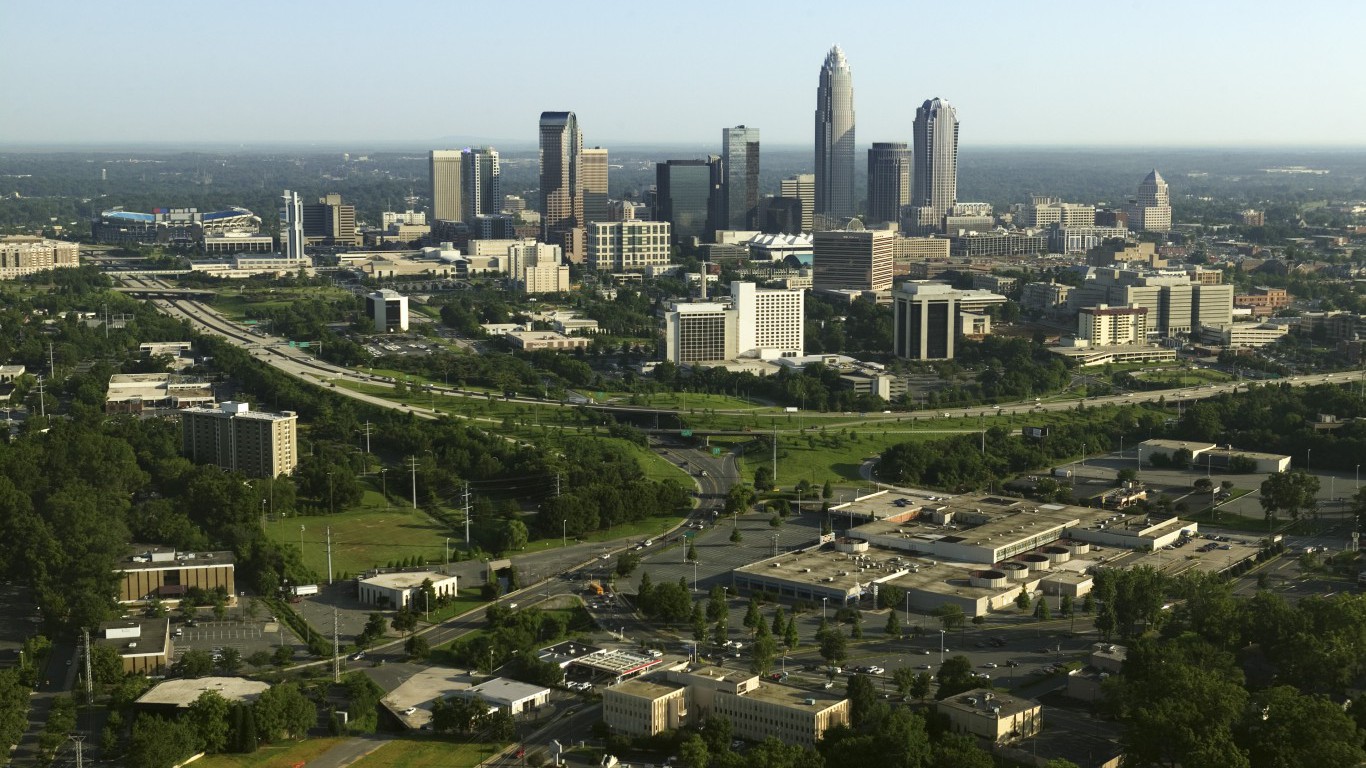
37. North Carolina
> 10-yr. population growth: 19.4% (6th highest)
> Oct. unemployment rate: 4.9% (23rd highest)
> Poverty rate: 16.4% (12th highest)
> Life expectancy at birth: 77.4 years (13th lowest)
Few states have grown as rapidly as North Carolina in the last 10 years. The Tar Heel State’s population growth rate of 19.4% since 2005, far outpaced the 11.5% national population growth. A relatively low cost of living may have attracted new residents. Goods and services are 8.3% less expensive on average in North Carolina than they are nationwide.
Despite lower costs, many North Carolinians are struggling financially. The state’s median household income of $47,830 a year is nearly $8,000 lower than the median income nationwide. Also, 16.4% of people in the state live in poverty, a greater share than the 14.7% of Americans who live at or below the poverty line.
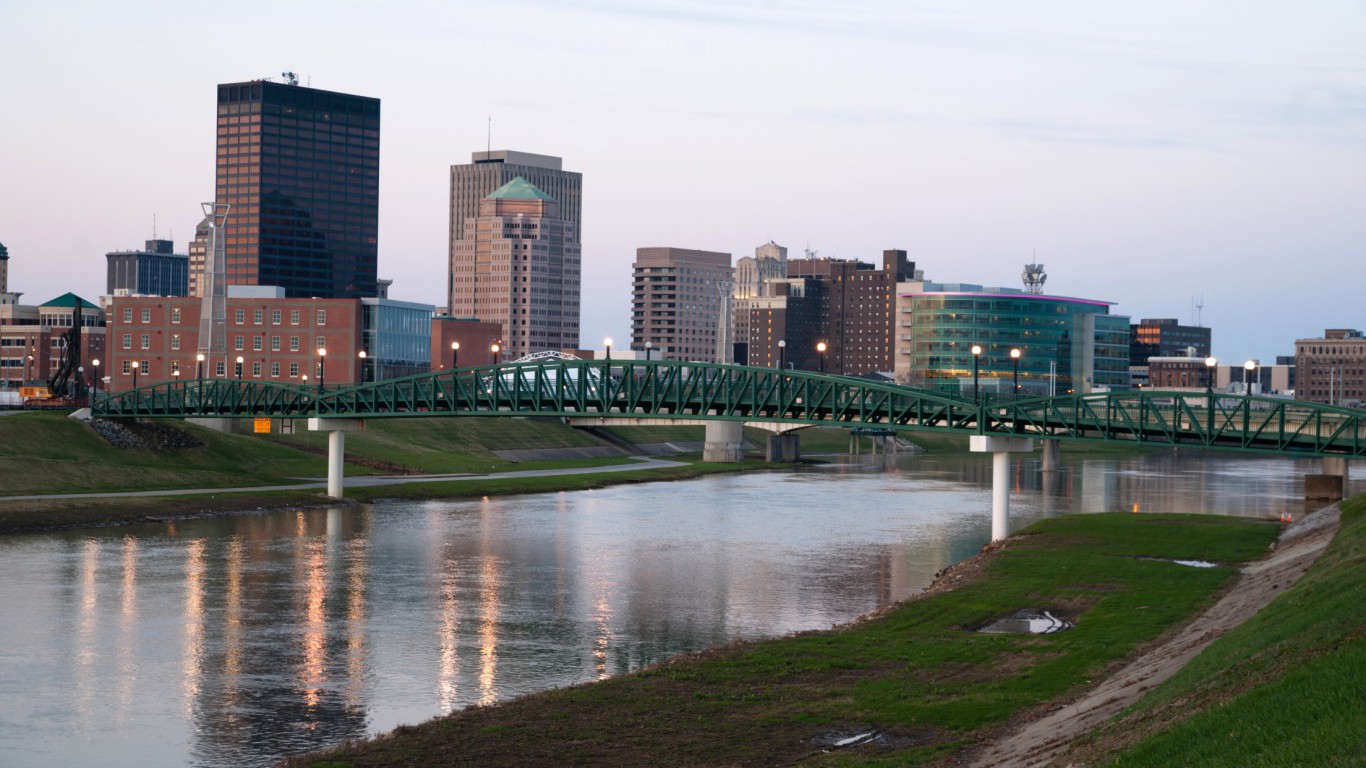
36. Ohio
> 10-yr. population growth: 4.1% (7th lowest)
> Oct. unemployment rate: 4.9% (23rd highest)
> Poverty rate: 14.8% (21st highest)
> Life expectancy at birth: 77.4 years (14th lowest)
Several measures of socioeconomic conditions in Ohio are slightly worse than the national figures, which helps explain Ohio’s ranking below most states, but not as one of the absolute worst states to live in. For example, the percentage of adults in the state who smoke is 21.0%, and the percentage who are obese is 30.5% — each just above the respective national rates.
Some subpar socioeconomic measures are likely related to some more meaningful shortcomings in Ohio. Life expectancy in the state is 77.4 years, more than a year below average life expectancy nationwide. Additionally, only 26.8% of adults in Ohio have earned a bachelor’s degree, well below the 30.6% share nationwide.

35. Missouri
> 10-yr. population growth: 8.0% (16th lowest)
> Oct. unemployment rate: 5.1% (19th highest)
> Poverty rate: 14.8% (21st highest)
> Life expectancy at birth: 77.1 years (11th lowest)
Homeownership is a practical way for many to increase their personal wealth, and consequently their quality of life. The typical home in Missouri costs about $147,800, about $46,700 less than the typical American home. Low real estate taxes in the state make homeownership especially affordable. Partially as a result, the state’s 66% homeownership rate is slightly higher than the 63% corresponding national rate. In addition to real estate, goods and services in general cost about 10.6% less in Missouri than they do on average nationwide.
[in-text-ad]
Still, Missouri lags behind the nation as a whole in several important measures. The state’s 77.1 year life expectancy is about 1.5 years below the average U.S. life expectancy. Violent and property crime are more common in the state than they are nationwide as well.

34. Michigan
> 10-yr. population growth: 0.6% (the lowest)
> Oct. unemployment rate: 4.7% (24th lowest)
> Poverty rate: 15.8% (15th highest)
> Life expectancy at birth: 77.8 years (16th lowest)
Much of Michigan has suffered economically over the last few decades from deindustrialization and the decline of American auto manufacturing. Population growth in Michigan was the lowest in the country over the last 10 years at only 0.6%, a likely consequence of poor long-term economic conditions. Meanwhile, the U.S. population has swelled by 11.5% since 2005.
The median income in Michigan is about $4,700 less than the nationwide median income of $55,775 a year. Additionally, the state’s 15.8% poverty rate is more than one percentage point above the national poverty rate.
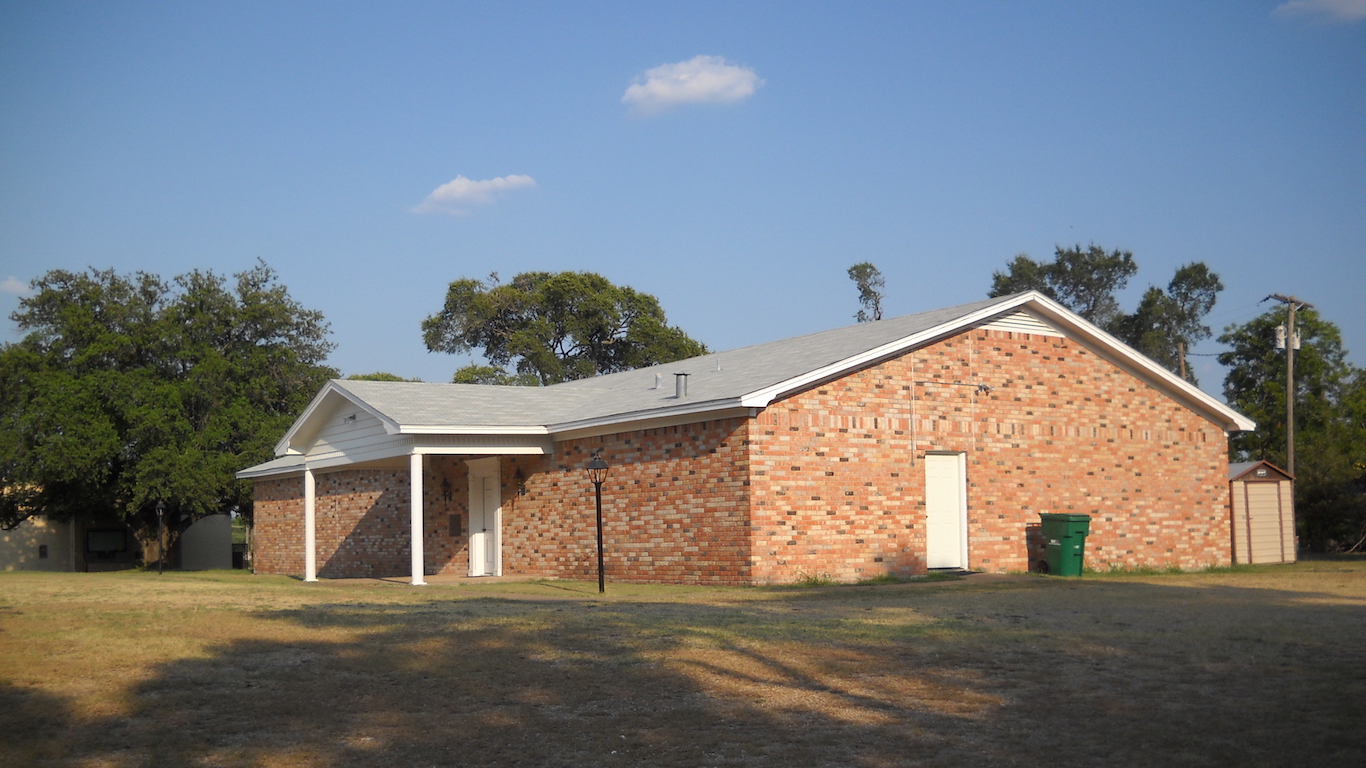
33. Texas
> 10-yr. population growth: 23.3% (3rd highest)
> Oct. unemployment rate: 4.7% (24th lowest)
> Poverty rate: 15.9% (14th highest)
> Life expectancy at birth: 78.1 years (21st lowest)
Home to roughly 27.5 million people, Texas is one of the largest states in the country. Though socioeconomic measures vary considerably from one region to another in the state, Texas as a whole performs slightly worse than the nation in terms of life expectancy, crime rates, and poverty.
Certain socioeconomic measures are closely tied to educational attainment rates, and many of the lagging measures in the Lone Star State would likely improve if a larger share of adults completed high school and college. Only 82.4% of adults in Texas have a high school diploma, the second smallest share of any state. Similarly, only 28.4% have earned a bachelor’s degree, lower than the comparable 30.6% share of American adults with a similar level of education.

32. Arizona
> 10-yr. population growth: 17.1% (10th highest)
> Oct. unemployment rate: 5.2% (14th highest)
> Poverty rate: 17.4% (8th highest)
> Life expectancy at birth: 79.3 years (15th highest)
Income is closely tied to overall well-being as it often shapes the choices people have and make that are related to health care, diet, and overall lifestyle. In Arizona, many people have limited options, as 17.4% of state residents live in poverty, a larger share than the 14.7% national poverty rate. Health care options in particular are further limited for the roughly one in 10 state residents without health insurance. Despite these shortcomings, life expectancy in the Grand Canyon State is nearly a year greater than it is across the country as a whole.

31. Idaho
> 10-yr. population growth: 18.6% (8th highest)
> Oct. unemployment rate: 3.8% (10th lowest)
> Poverty rate: 15.1% (20th highest)
> Life expectancy at birth: 79.0 years (21st highest)
Idaho’s population surge of 18.6% over the last decade is one of the largest population spikes of any state. The influx may be attributable to some of the state’s economic advantages. A relatively inexpensive state, goods and services are about 6.6% less expensive in Idaho than they are on average across the country. Additionally, the state’s 3.8% unemployment rate is nearly the lowest in the country.
Populations with higher educational attainment are better equipped to weather economic downturns and more likely to raise healthy, prosperous families. While Idaho ranks relatively well in many other categories, people in the state are less likely to have a four-year college degree than Americans nationwide. Only 26.0% of adults in the state have a bachelor’s degree compared to 30.6% of Americans.
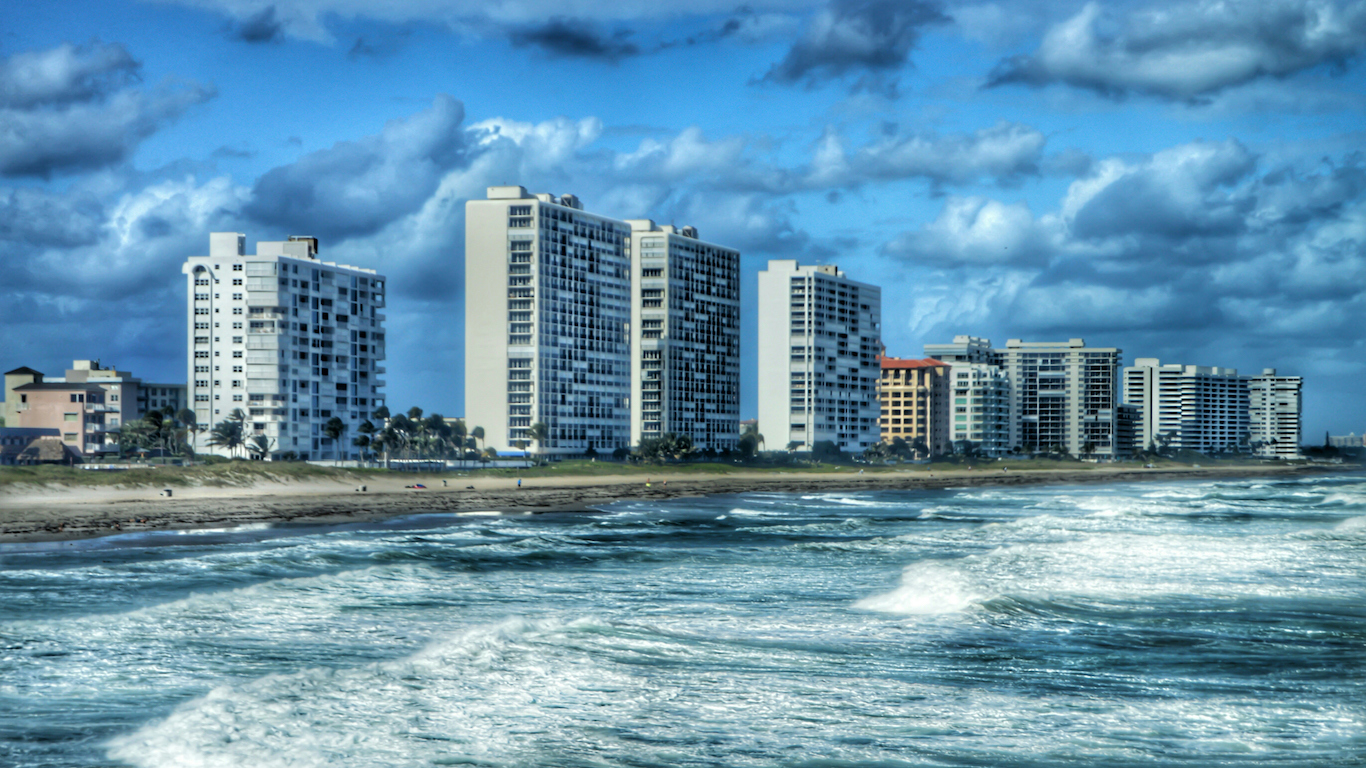
30. Florida
> 10-yr. population growth: 16.6% (12th highest)
> Oct. unemployment rate: 4.8% (25th highest)
> Poverty rate: 15.7% (16th highest)
> Life expectancy at birth: 79.0 years (19th highest)
Florida is one of the largest and fastest growing states in the country. Now home to 20.3 million people, the state’s population has surged by 16.6% in the last decade, faster than the population growth of 11.5% nationwide. Though it may be a popular destination for national migration, Florida lags behind the nation as a whole in several important measures.
[in-text-ad]
For many state residents, a healthy lifestyle is likely out of reach. Nearly 16% of Floridians live at or below the poverty line, and 13.3% of people in the state lack health insurance, each among the higher shares of any state.

29. Montana
> 10-yr. population growth: 13.4% (21st highest)
> Oct. unemployment rate: 4.3% (19th lowest)
> Poverty rate: 14.6% (24th highest)
> Life expectancy at birth: 78.3 years (24th lowest)
The median household income in Montana is only $49,509 a year, roughly $6,300 less than the median income nationwide. However, goods and services cost nearly 6% less in Big Sky Country than they do on average nationwide. Lower incomes are partially offset by a lower cost of living, and possibly as a result, the state’s 14.6% poverty rate is roughly in line with the corresponding national figure.
Education is often a critical component of quality of life. While Montana’s 30.6% bachelor’s degree attainment rate is exactly in line with the average nationwide, 93.5% of adults in the state have completed high school, the largest share of any state in the country.

28. South Dakota
> 10-yr. population growth: 15.1% (16th highest)
> Oct. unemployment rate: 2.8% (2nd lowest)
> Poverty rate: 13.7% (24th lowest)
> Life expectancy at birth: 78.9 years (22nd highest)
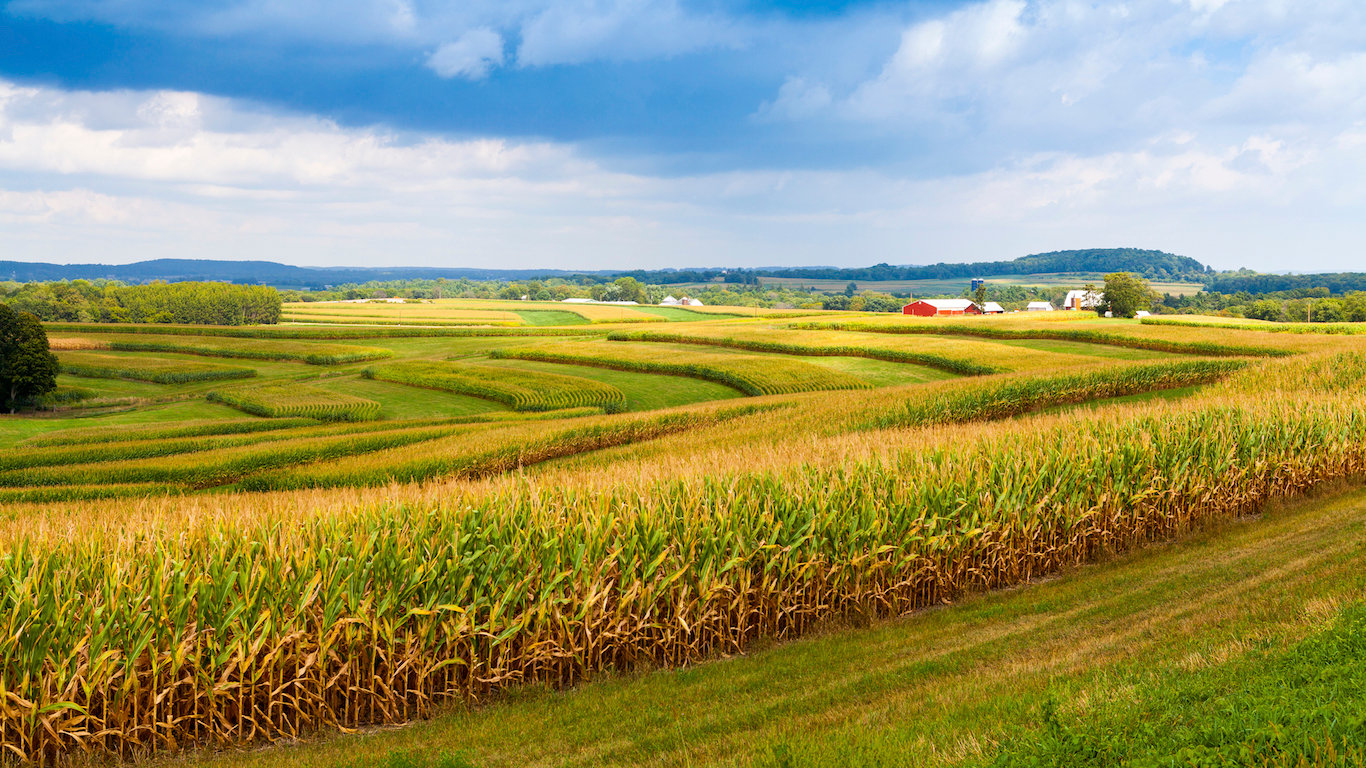
Though only 27.5% of adults in South Dakota have a four-year college degree, some of the state’s socioeconomic measures rival states with higher educational attainment. Life expectancy at birth is slightly higher than the 78.5 year average life expectancy nationwide. Similarly, the state’s poverty rate is a full percentage point below the U.S. figure.
Relatively strong socioeconomic measures across the state are likely tied to the availability of well-paying jobs with low educational requirements in the state’s large agriculture and manufacturing industries. The state’s 2.8% annual unemployment rate is nearly the lowest in the nation.
27. Wyoming
> 10-yr. population growth: 18.4% (9th highest)
> Oct. unemployment rate: 5.1% (19th highest)
> Poverty rate: 11.1% (10th lowest)
> Life expectancy at birth: 78.0 years (19th lowest)
Despite having a bachelor’s degree attainment rate roughly 4.5 percentage points below the 30.6% nationwide rate, incomes are relatively high in Wyoming. The typical household earns $60,214 annually, well above the $55,775 median income nationwide. The state’s high incomes go even further as goods and services are nearly 4% cheaper than they are across the country on average.
Despite the state’s population growing by a relatively high 18.4% rate over the last decade, Wyoming remains the least populated state in the country.

26. Pennsylvania
> 10-yr. population growth: 6.9% (14th lowest)
> Oct. unemployment rate: 5.8% (6th highest)
> Poverty rate: 13.2% (21st lowest)
> Life expectancy at birth: 78.3 years (23rd lowest)
As of this October, 5.8% of Pennsylvania’s labor force was unemployed, the sixth highest jobless rate of all states. Several other socioeconomic measures in the state suggest the quality of life for Pennsylvanians is slightly better or in line with that of most Americans. For example, Pennsylvania’s poverty rate of 13.2% is just under the national rate of 14.7%, and the typical Pennsylvania household earns $55,702 annually, in line with the national median household income of $55,775.
25. Iowa
> 10-yr. population growth: 9.1% (19th lowest)
> Oct. unemployment rate: 4.1% (15th lowest)
> Poverty rate: 12.2% (17th lowest)
> Life expectancy at birth: 79.0 years (20th highest)
By many measures, quality of life in Iowa is representative of the country as a whole. The state’s median household income of $54,736 a year is only about $1,000 less than the corresponding median nationwide. Similarly, life expectancy at birth in Iowa is 79 years, approximately in line with the U.S. average life expectancy.
[in-text-ad]
Despite some significant similarities, Iowans are far less likely to have a four-year college education than most Americans. The state’s 26.8% bachelor’s degree attainment rate trails the national rate by nearly 4 percentage points.
24. Oregon
> 10-yr. population growth: 13.2% (22nd highest)
> Oct. unemployment rate: 5.3% (13th highest)
> Poverty rate: 15.4% (17th highest)
> Life expectancy at birth: 79.1 years (17th highest)
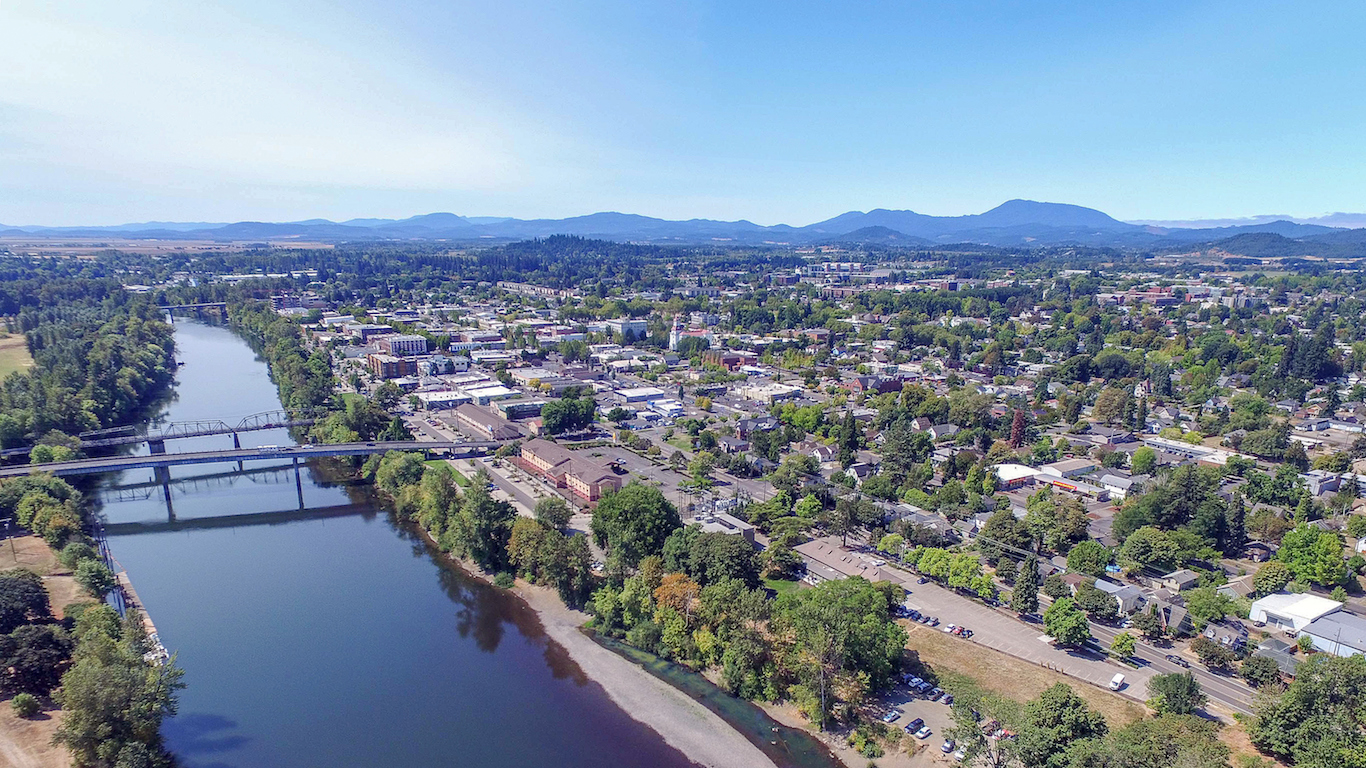
Personal wealth can contribute significantly to quality of life, and homeownership can be a practical way to build wealth. With relatively low incomes and very high home values, however, homes may be prohibitively expensive for many Oregon residents. While the median home value in the state is over a quarter million dollars, nearly $70,000 more than the typical American home, incomes across the state are lower than average. The typical Oregon household earns $54,148 a year, about $1,600 less than the typical American household. Likely as a result, homeownership is slightly less common in Oregon than it is across the country.
Despite lower incomes, both the state’s bachelor’s degree attainment rate and average life expectancy are slightly higher than the corresponding nationwide figures.

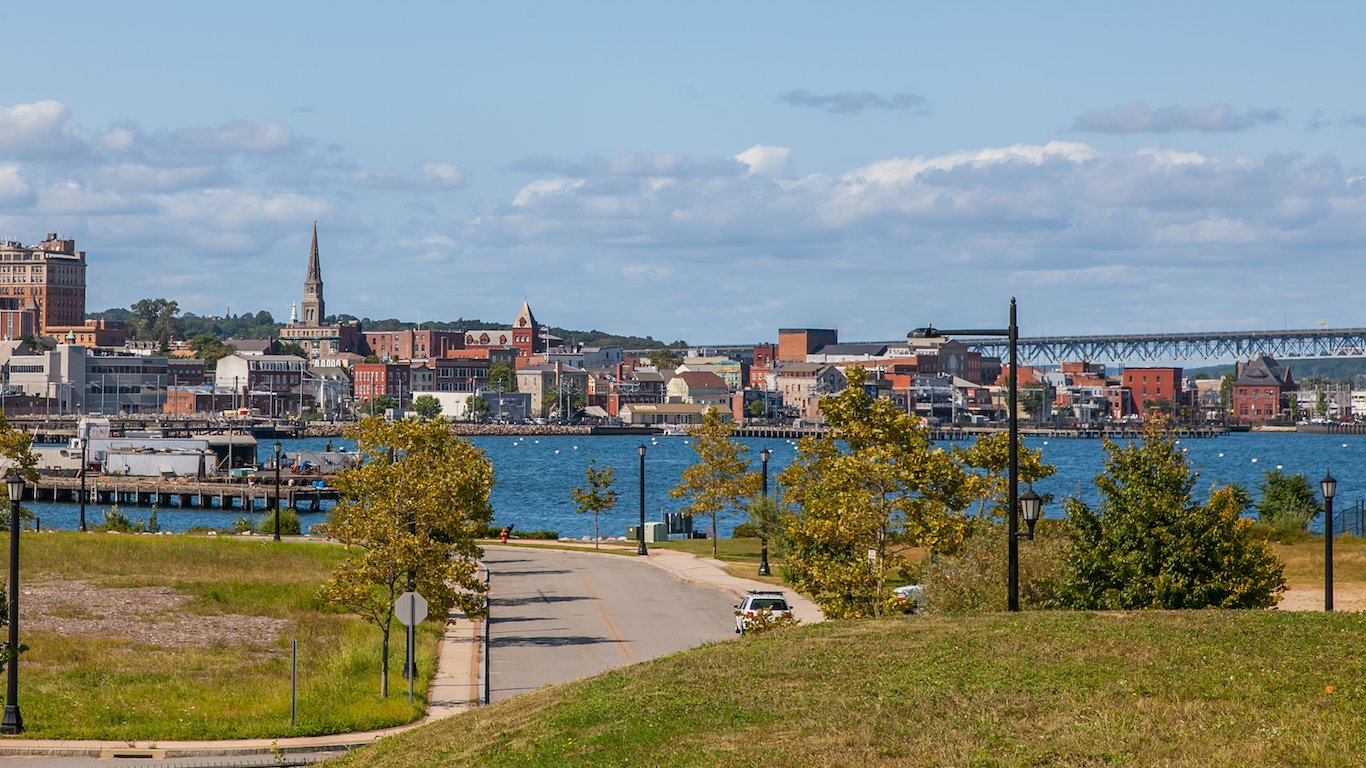
23. Maine
> 10-yr. population growth: 3.6% (4th lowest)
> Oct. unemployment rate: 4.0% (13th lowest)
> Poverty rate: 13.4% (22nd lowest)
> Life expectancy at birth: 78.7 years (23rd highest)
High crime rates can significantly detract from overall quality of life, and in Maine violent crime is very uncommon. There are only 130 violent crimes a year in the state for every 100,000 residents, less than half the corresponding average violent crime rate nationwide. People in Maine are also less likely to live in poverty than most Americans. Only 13.4% of state residents live at or below the poverty line, a considerably smaller share than the 14.7% of Americans who do nationwide. The state’s average life expectancy at birth and share of adults with at least a bachelor’s degree are roughly in line with the corresponding national figures.

22. Delaware
> 10-yr. population growth: 15.6% (15th highest)
> Oct. unemployment rate: 4.3% (19th lowest)
> Poverty rate: 12.4% (18th lowest)
> Life expectancy at birth: 78.1 years (20th lowest)
For families who own land and their home, property values make up a substantial portion of wealth. In Delaware, 70.8% of housing units are owned by their occupants, nearly the highest homeownership rate of any state. High homeownership in a population is usually due to either very high incomes or very low home values and the median household income in Delaware of $61,255 a year is well above the national median income.
The state’s share of adults with at least a bachelor’s degree and average life expectancy at birth are similar to that of the nation.
21. Kansas
> 10-yr. population growth: 9.4% (20th lowest)
> Oct. unemployment rate: 4.4% (21st lowest)
> Poverty rate: 13.0% (20th lowest)
> Life expectancy at birth: 78.2 years (22nd lowest)
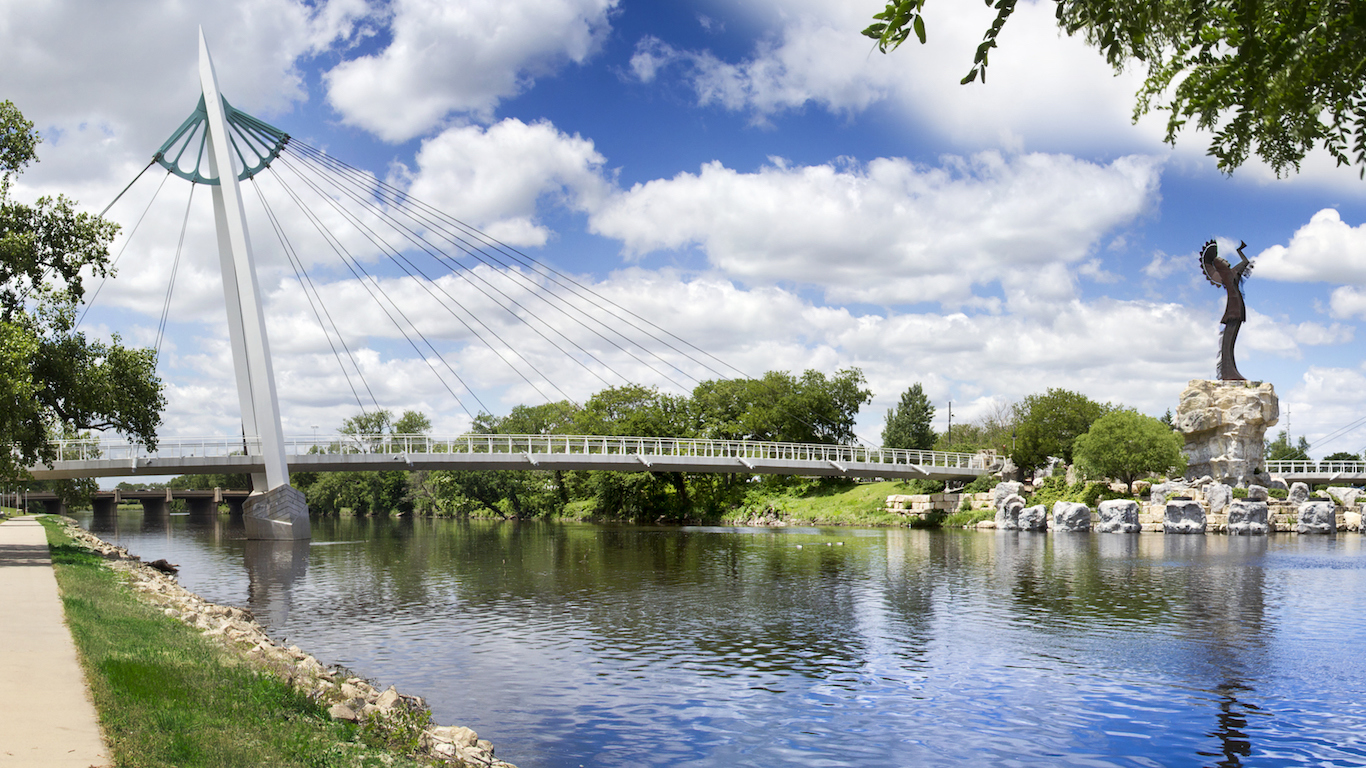
Incomes in Kansas are slightly lower than they are across the country as whole. The typical household in the state earns $53,906 a year, about $1,900 less than the typical American household. Still, likely due in part to a relatively low cost of living, the state’s poverty rate is only 13.0%, substantially lower than the 14.7% national poverty rate.
In measures of health outcomes and educational attainment, Kansas closely mirrors the country as a whole. Life expectancy at birth in Kansas is 78.2 years, roughly in line with life expectancy nationwide. Additionally, 31.7% of adults in the state have at least a bachelor’s degree, only about 1 percentage point higher than is typical nationwide.

20. Alaska
> 10-yr. population growth: 15.1% (17th highest)
> Oct. unemployment rate: 6.8% (the highest)
> Poverty rate: 10.3% (5th lowest)
> Life expectancy at birth: 77.8 years (15th lowest)
Alaska’s poverty rate of 10.3% is fifth lowest of all states. The relatively low poverty rate generally means that Alaskans have a good chance of living in financial stability. The typical state household earns $73,355, third highest of any state. High college attainment in a population tends to help explain low poverty levels and high incomes, but Alaska’s college attainment rate, at 29.7%, is just under the national percentage.
[in-text-ad]
Higher income regions tend to have lower than average violent crime rates. Alaska is an exception. There were more than 730 violent crimes reported per 100,000 state residents last year, by far the highest violent crime rate of any state.
19. Illinois
> 10-yr. population growth: 3.4% (3rd lowest)
> Oct. unemployment rate: 5.6% (8th highest)
> Poverty rate: 13.6% (23rd lowest)
> Life expectancy at birth: 78.7 years (24th highest)
A college education, in addition to providing higher paying job opportunities, often also leads to a longer and higher quality life. In Illinois, 32.9% of adults have at least a bachelor’s degree, a slightly higher share than the 30.6% of Americans. In addition to a relatively high college attainment rate, the median income in Illinois of $59,588 a year is about $3,800 more than the annual income of the typical American household. With a higher median income, poverty is less common in Illinois than it is nationwide. Only 13.6% of state residents live at or below the poverty line, more than a full percentage point lower than the national poverty rate.
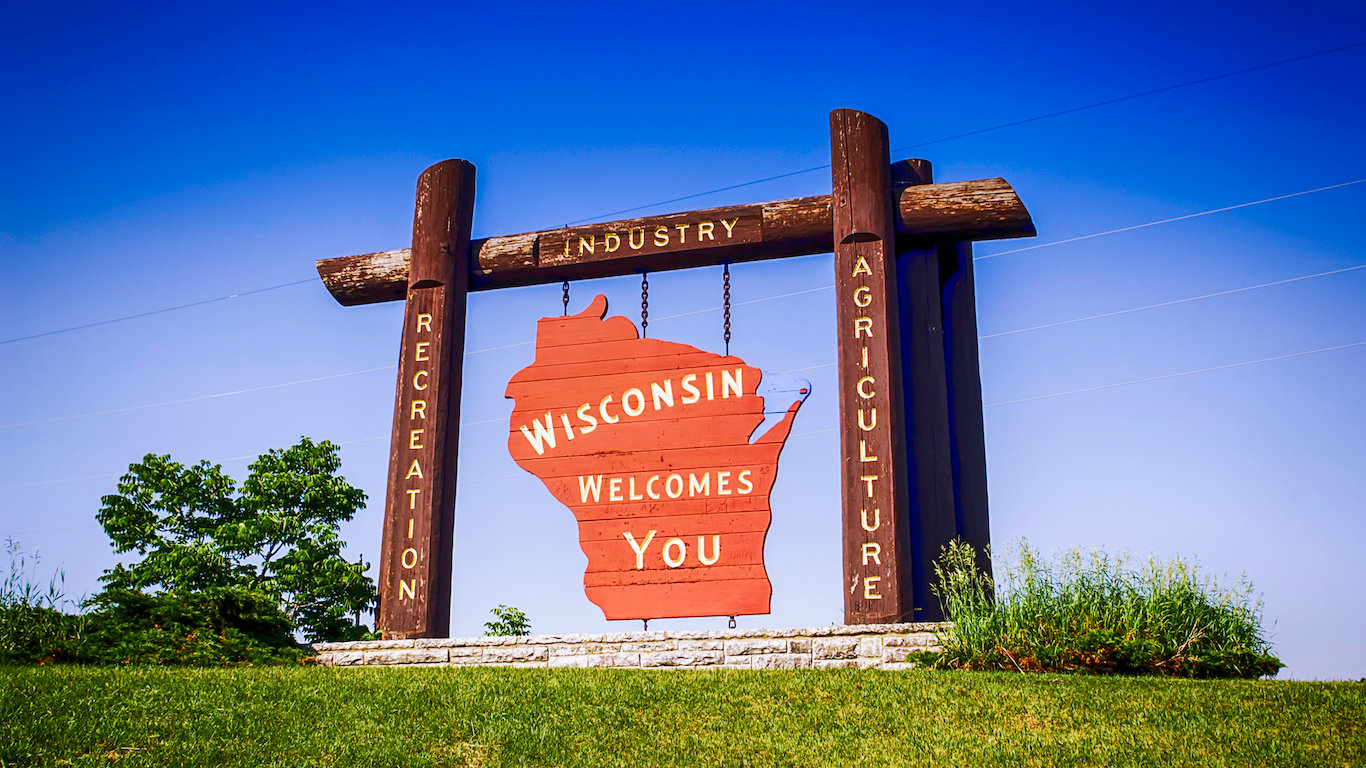
18. Wisconsin
> 10-yr. population growth: 7.4% (15th lowest)
> Oct. unemployment rate: 4.1% (15th lowest)
> Poverty rate: 12.1% (15th lowest)
> Life expectancy at birth: 79.3 years (13th highest)
Due to the socioeconomic benefits of a college-educated population, states with low educational attainment often tend to have a lower quality of life. In Wisconsin, only 28.4% of adults have a bachelor’s degree, well below the 30.6% national share. Still, despite the gap, quality of life is generally high across Wisconsin.
Violent crime, unemployment, and poverty are less common in Wisconsin then they are nationwide. Additionally, life expectancy is nearly a year longer in Wisconsin than it is across the country as a whole.

17. Nebraska
> 10-yr. population growth: 11.1% (23rd highest)
> Oct. unemployment rate: 3.3% (8th lowest)
> Poverty rate: 12.6% (19th lowest)
> Life expectancy at birth: 79.2 years (16th highest)
The typical Nebraska household earns roughly $55,000 annually, about $775 less than the typical American household. A lower cost of living more than offsets lower incomes however, as only 12.6% of state residents live at or below the poverty line, well below the 14.7% national poverty rate. A strong job market also likely helps reduce poverty. Nebraska’s 3.3% unemployment rate is one of the lowest in the country.
Nebraska’s 30.2% bachelor’s degree attainment rate is roughly in line with the average college attainment rate nationwide and partially explains the state’s level of prosperity.

16. Rhode Island
> 10-yr. population growth: 2.3% (2nd lowest)
> Oct. unemployment rate: 5.5% (9th highest)
> Poverty rate: 13.9% (25th lowest)
> Life expectancy at birth: 79.1 years (18th highest)
Quality of life and economy often go hand in hand. When a local economy is healthy often so is the quality of life — and in turn both tend to attract new residents. However, like other states in New England, Rhode Island bucks this trend. Based on median household income and life expectancy, Rhode Island is among the better states to live in. Yet the state’s the state’s population growth of just 2.3% over the past decade is the second lowest of all states after Michigan.
Health insurance coverage often provides a family with peace of mind, while a lack of health insurance can push a family into bankruptcy. As is the case in many of the best states to live in, the uninsured rate in Rhode Island of 5.7% is one of the lowest in the country.

15. California
> 10-yr. population growth: 11.0% (24th highest)
> Oct. unemployment rate: 5.5% (9th highest)
> Poverty rate: 15.3% (19th highest)
> Life expectancy at birth: 80.4 years (3rd highest)
Incomes in California are relatively high. The typical household earns $64,500 a year, about $8,700 more than the typical American household. However, for many across the state, the benefits associated with higher incomes may be offset by the high cost of living. Homeownership in particular is prohibitively expensive for many state residents. The median home value in California is $449,100, more than double the value of the typical home nationwide. High property values partially explain the state’s relatively low homeownership rate of 53.6%, which is nearly 10 percentage points lower than the corresponding national rate.
[in-text-ad]
There appear to be some relatively positive health outcomes for state residents. California is one of only five states where the average life expectancy at birth exceeds 80 years.

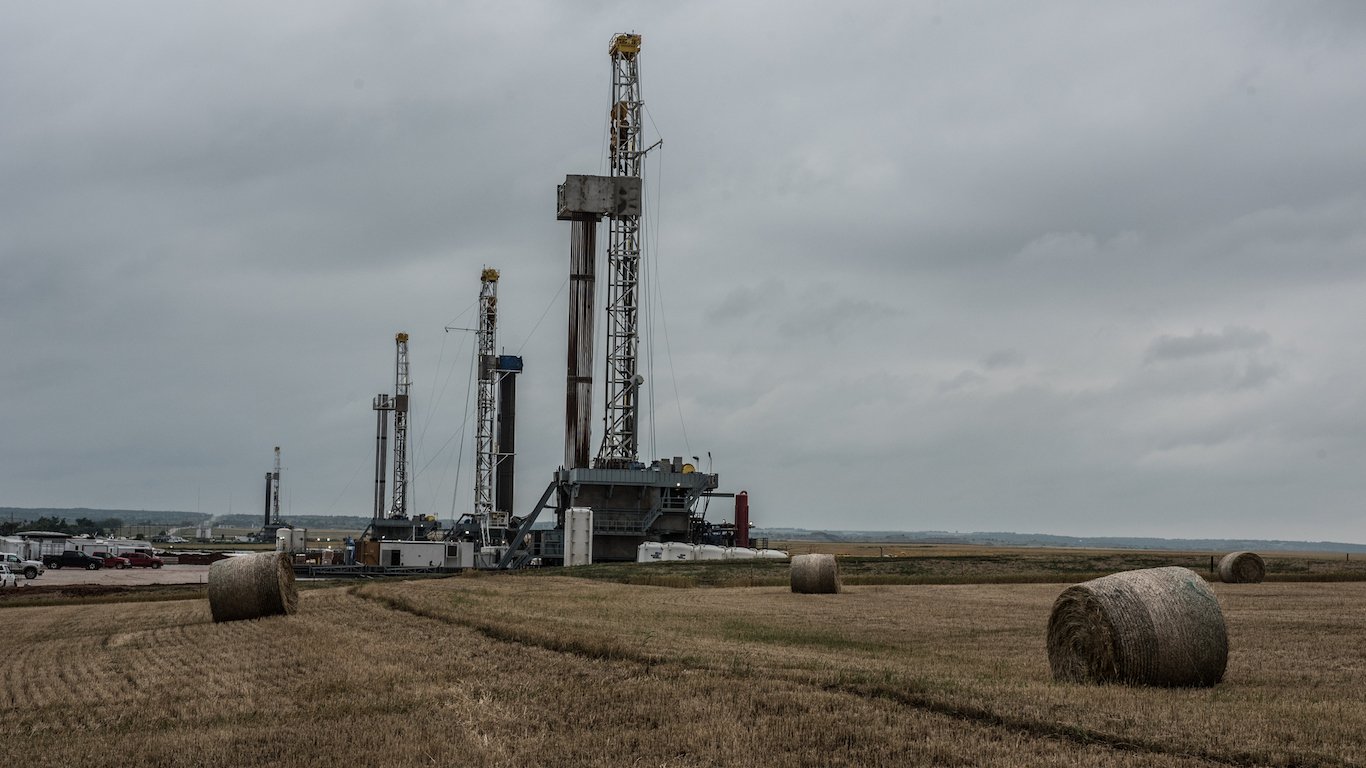
14. North Dakota
> 10-yr. population growth: 24.2% (the highest)
> Oct. unemployment rate: 3.0% (3rd lowest)
> Poverty rate: 11.0% (9th lowest)
> Life expectancy at birth: 79.3 years (14th highest)
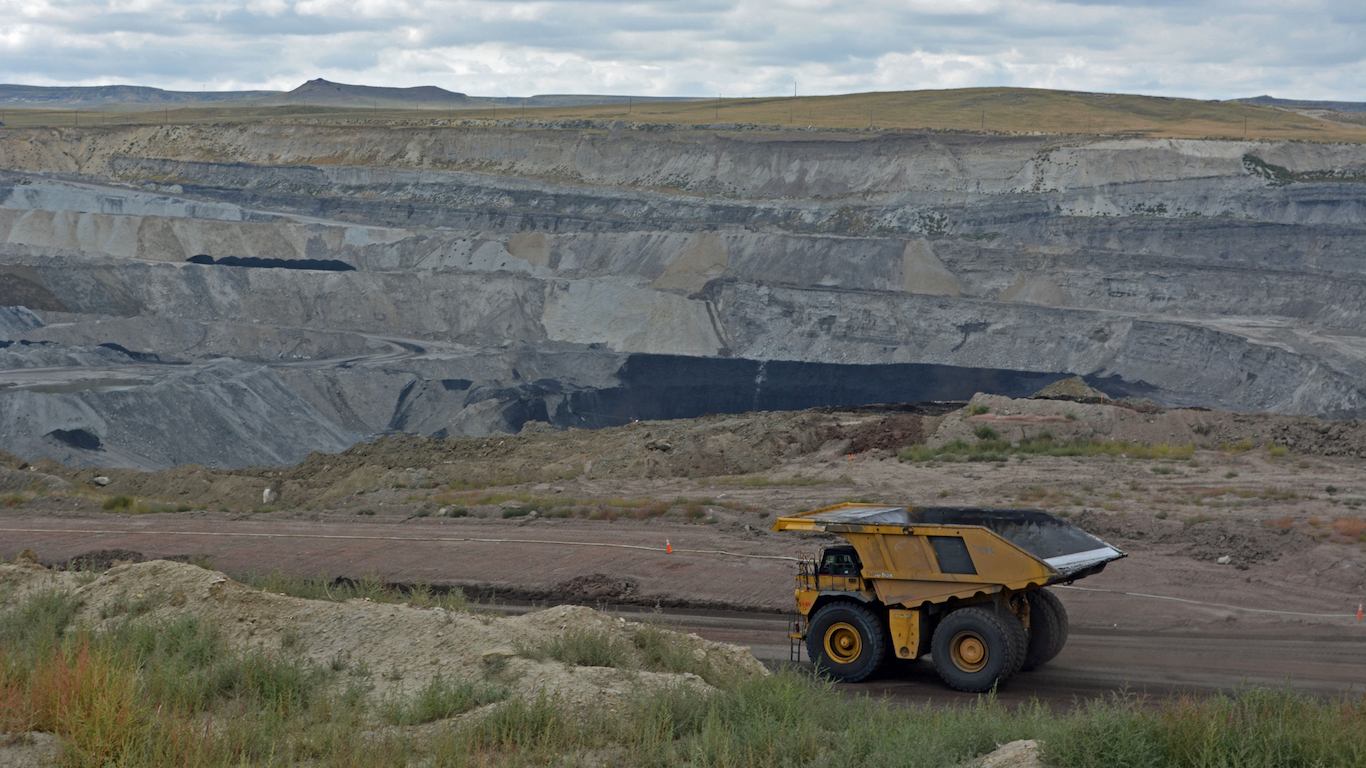
The U.S. Geological Survey estimated in 2008 that North Dakota’s Bakken shale formation contained the equivalent of 3.6 million barrels of oil, many times greater than initially thought. The revelation lead to a boom in the state’s resource extraction industry and a 24.2% population spike, the largest population growth of any state in the country.
A boon to the state’s economy, jobs in oil and gas extraction, as well as service jobs supporting the industry, are plentiful and paying well. North Dakota’s 3.0% unemployment rate is nearly the lowest in the country. Additionally, the $60,557 median annual household income across the state is nearly $5,000 more than the median nationwide. Also, only 11% of state residents live in poverty, well below the nearly 15% poverty rate nationwide.

13. New York
> 10-yr. population growth: 6.1% (12th lowest)
> Oct. unemployment rate: 5.2% (14th highest)
> Poverty rate: 15.4% (17th highest)
> Life expectancy at birth: 80.0 years (6th highest)
At $60,850 a year, New York’s median household income is about $5,000 more than the median nationwide. For many, higher incomes are offset by a higher cost of living. Goods and services are about 16% more expensive in New York than across the country on average, and 15.4% of the state’s population lives in poverty, a slightly higher share than the 14.7% poverty rate nationwide.
New York has a higher than average poverty rate, which often occurs in states with lower educational attainment and lower life expectancy. In New York, however, about 35% of adults have at least a bachelor’s degree, well above the comparable 30.6% national share. Also, life expectancy in the Empire State is 80 years at birth, about a 1.5 years longer than average life expectancy nationwide.

12. Utah
> 10-yr. population growth: 23.4% (2nd highest)
> Oct. unemployment rate: 3.2% (5th lowest)
> Poverty rate: 11.3% (12th lowest)
> Life expectancy at birth: 79.7 years (9th highest)
Utah’s population growth rate of 23.4% since 2005 is the second fastest in the county. The state’s economy has accommodated the influx handily as Utah’s 3.2% unemployment rate is nearly the lowest in the country.
Additionally, the $62,912 median annual household income across the state is roughly $7,000 greater than the national median. Goods and services are also slightly cheaper on average in Utah than they are nationwide. A likely byproduct of such favorable economic conditions is a relatively low poverty rate. Only 11.3% of state residents live at or below the poverty line, about 3.5 percentage points below the national poverty rate.

11. Washington
> 10-yr. population growth: 16.7% (11th highest)
> Oct. unemployment rate: 5.4% (12th highest)
> Poverty rate: 12.2% (17th lowest)
> Life expectancy at birth: 79.6 years (11th highest)
A number of socioeconomic measures indicate a relatively high quality of life in Washington. The typical household in the state earns $64,129 a year, about $8,400 more than the typical American household. Higher incomes help protect families and individuals in times of economic hardship, and in Washington likely contribute to the relatively low poverty rate. Only 12.2% of state residents live at or below the poverty line, 2.5 percentage points lower than the total share of Americans living in poverty.
Economic stability likely also contributes to a higher than average life expectancy in the state. Life expectancy at birth is 79.6 years, more than a year longer than it is nationwide.

10. Virginia
> 10-yr. population growth: 14.3% (18th highest)
> Oct. unemployment rate: 4.2% (17th lowest)
> Poverty rate: 11.2% (11th lowest)
> Life expectancy at birth: 78.5 years (25th highest)
Virginia residents are far more likely to be financially stable than most Americans. The typical household in the Old Dominion State earns $66,262 annually, far more than the $55,775 median annual household income nationwide. Higher incomes in the state contribute to an 11.2% poverty rate, one of the lowest in the nation.
[in-text-ad]
Homeownership can significantly contribute to individual wealth, and Virginia’s 65% homeownership rate is slightly higher than the national average. The typical home in Virginia is worth more than a quarter million dollars, while the median home value nationwide is less than $200,000. Relatively low real estate taxes across the state make homeownership more affordable despite the high property values.

9. Hawaii
> 10-yr. population growth: 15.6% (14th highest)
> Oct. unemployment rate: 3.2% (5th lowest)
> Poverty rate: 10.6% (7th lowest)
> Life expectancy at birth: 80.6 years (the highest)
Hawaiians are some the wealthiest and healthiest people in the country. Average life expectancy at birth in the Pacific island state is 80.6 years, the highest of any state and about two years longer than life expectancy nationwide. For many in the state, healthy lifestyles are enabled by widespread health insurance coverage and high incomes. Only 4% of state residents lack health insurance, nearly the smallest share in the country. Additionally, the typical household in the state earns $73,486 a year, about $17,700 more than the typical American household.
High incomes do not go as far in Hawaii as they would in other states, however. Goods and services cost about 17% more across the state than they do on average nationwide, the highest cost of living of any state. Real estate is especially expensive in Hawaii as the typical home is worth over half a million dollars. Despite a high cost of living, only about one in 10 Hawaiians live in poverty, one of lowest poverty rates in the country.

8. Maryland
> 10-yr. population growth: 10.0% (23rd lowest)
> Oct. unemployment rate: 4.2% (17th lowest)
> Poverty rate: 9.7% (2nd lowest)
> Life expectancy at birth: 78.5 years (25th lowest)
A college education can lead to more opportunities, higher incomes, and better overall quality of life. In Maryland, nearly 39% of adults have earned a bachelor’s degree, one of the highest shares of any state. As is typically the case in regions with high educational attainment, incomes are high in Maryland. The statewide median household income of $75,847 a year is the highest in the country. High incomes partially explain the state’s 9.7% poverty rate, which is nearly the lowest of any state.
College-educated adults are often better equipped to make healthier lifestyle decisions and as a result typically have longer lifespans. Despite Maryland’s near nation-leading bachelor’s degree attainment rate, life expectancy at birth in the state is 78.5 years, exactly the same as the average life expectancy nationwide.

7. Vermont
> 10-yr. population growth: 3.9% (5th lowest)
> Oct. unemployment rate: 3.3% (8th lowest)
> Poverty rate: 10.2% (4th lowest)
> Life expectancy at birth: 79.5 years (12th highest)
The best states to live in usually have very healthy economies that drive the pace of population growth higher. However, this is not the case in New England states such as Vermont. With an unemployment rate of 3.3%, the eighth lowest, Vermont’s economy is certainly performing well. However, the small rural state’s population grew by just 3.9% over the past decade, the fifth slowest growth rate of all states.
The best states to live in do not necessarily have high homeownership rates, but Vermont residents are more likely than most to own their homes. More than 70% of housing units in the state are owned by their occupants, the sixth highest homeownership rate in the country.

6. Colorado
> 10-yr. population growth: 19.6% (5th highest)
> Oct. unemployment rate: 3.5% (9th lowest)
> Poverty rate: 11.5% (14th lowest)
> Life expectancy at birth: 79.6 years (10th highest)
Greater educational attainment is linked to higher incomes and more employment opportunities. In Colorado, 39.2% of adults have at least a bachelor’s degree, the largest share in the country after only Massachusetts. Perhaps due to the state’s well-educated population, Colorado’s job market is healthier than most. The state’s 3.5% unemployment rate is among the lowest in the country and nearly 1.5 percentage points below the unemployment rate nationwide.
Long lifespans are often indicative of healthy lifestyles, and people living in Colorado tend to live longer than most Americans. Average life expectancy in the state is 79.6 years at birth, roughly a year longer than it is nationwide.
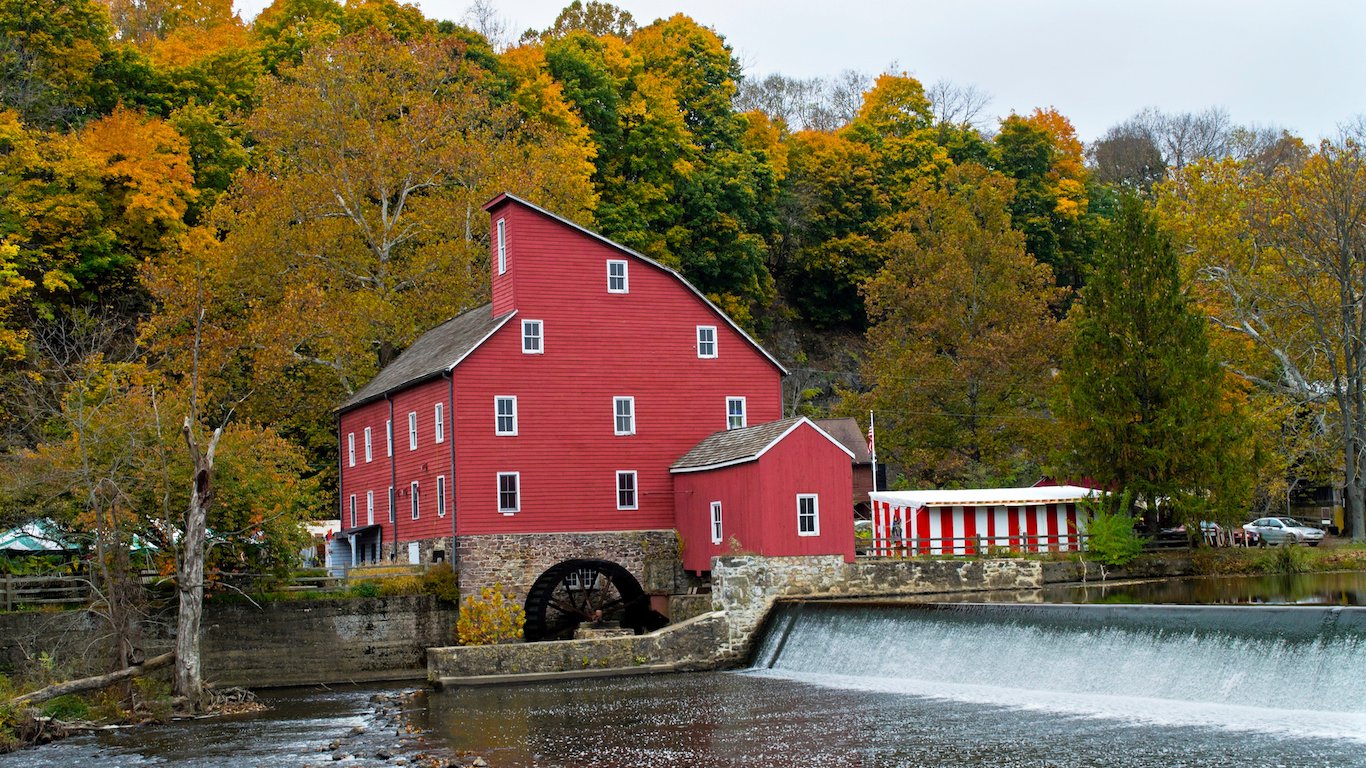
5. New Jersey
> 10-yr. population growth: 5.1% (9th lowest)
> Oct. unemployment rate: 5.2% (14th highest)
> Poverty rate: 10.8% (8th lowest)
> Life expectancy at birth: 79.8 years (8th highest)
A reliable and effective public transportation system can reduce traffic-related injuries, and increase physical activity on an individual level, which can lead to a number of positive health outcomes. In New Jersey, nearly 12% of workers commute using public transit, one of the largest such shares. The high share of New Jersey residents who use public transit may also point to the economic benefits of living within the New York City metro area, a locus of often high-paying job opportunities. While New Jersey’s most recent monthly unemployment rate of 5.2% is slightly above the national rate of 4.9%, incomes in the state are very high. The typical household earns $72,222 annually, the fourth highest median household income of all states.
[in-text-ad]

4. Minnesota
> 10-yr. population growth: 10.0% (24th lowest)
> Oct. unemployment rate: 4.0% (13th lowest)
> Poverty rate: 10.2% (4th lowest)
> Life expectancy at birth: 80.4 years (4th highest)
The typical household in Minnesota earns substantially less annually compared to other top states to live in, but at $63,488 a year, Minnesota’s median household income is well above the national annual median of $55,775. The state’s near nation-leading life expectancy of over 80 years can be partially attributed to economic factors such as high income. Also, only 11.6% of state adults report being in suboptimal health, the second lowest share. Broad health insurance coverage has likely helped many residents stay in good health. Just 4.5% of Minnesotans do not have health insurance, less than half the comparable national percentage and fourth lowest of all states.

3. New Hampshire
> 10-yr. population growth: 4.6% (8th lowest)
> Oct. unemployment rate: 2.8% (2nd lowest)
> Poverty rate: 8.2% (the lowest)
> Life expectancy at birth: 79.9 years (7th highest)
New Hampshire is one of several states with a high quality of life located in New England, where state populations tend to be financially well-off and healthy. New Hampshire’s poverty rate of 8.2% is the lowest of all states, and its unemployment rate of 2.8% is second lowest in the nation. The life expectancy in New Hampshire, at roughly 80 years, is also longer than in all but a handful of states.
The best states in which to live tend to have very healthy economies that usually drive the pace of population growth higher. However, this is not the case in New England states such as New Hampshire. While New Hampshire’s economy is performing well compared with other areas, its population grew by less than 5% over the past decade, the eighth slowest in the country.
2. Connecticut
> 10-yr. population growth: 5.8% (10th lowest)
> Oct. unemployment rate: 5.1% (19th highest)
> Poverty rate: 10.5% (6th lowest)
> Life expectancy at birth: 80.4 years (2nd highest)
Quality of life in the United States is heavily dependent on financial status. As a consequence, the nation’s best states to live in often report very high incomes. With a median household income of $71,346 a year, fifth highest of all states, Connecticut is the second best state to live in and an especially good example of this pattern.
Like the vast majority of states on the higher end of our list, Connecticut is also relatively safe. There were 219 violent crimes reported for every 100,000 state residents in 2015, among the lowest rates of all states.
1. Massachusetts
> 10-yr. population growth: 9.9% (22nd lowest)
> Oct. unemployment rate: 3.3% (8th lowest)
> Poverty rate: 11.5% (14th lowest)
> Life expectancy at birth: 80.2 years (5th highest)
Based on social and economic conditions, including measures of educational attainment, poverty, and health, Massachusetts is the nation’s best state in which to live. More than two out of every five adults have at least a bachelor’s degree, by far the highest proportion of any state. Because a college degree tends to open economic opportunities, the high level of education across the state’s population helps lower the incidence of poverty. With a poverty rate of 11.5%, poverty is considerably less common in Massachusetts than it is across the nation.
Economic factors play a major role in the health of a population, and the health of a state’s residents is a basic determinant of quality of life. Massachusetts residents are expected to live over 80 years on average, the fifth longest life expectancy of all states.
Take the quiz below to get matched with a financial advisor today.
Each advisor has been vetted by SmartAsset and is held to a fiduciary standard to act in your best interests.
Here’s how it works:
1. Answer SmartAsset advisor match quiz
2. Review your pre-screened matches at your leisure. Check out the
advisors’ profiles.
3. Speak with advisors at no cost to you. Have an introductory call on the phone or introduction in person and choose whom to work with in the future
Take the retirement quiz right here.
Thank you for reading! Have some feedback for us?
Contact the 24/7 Wall St. editorial team.


 24/7 Wall St.
 24/7 Wall St.