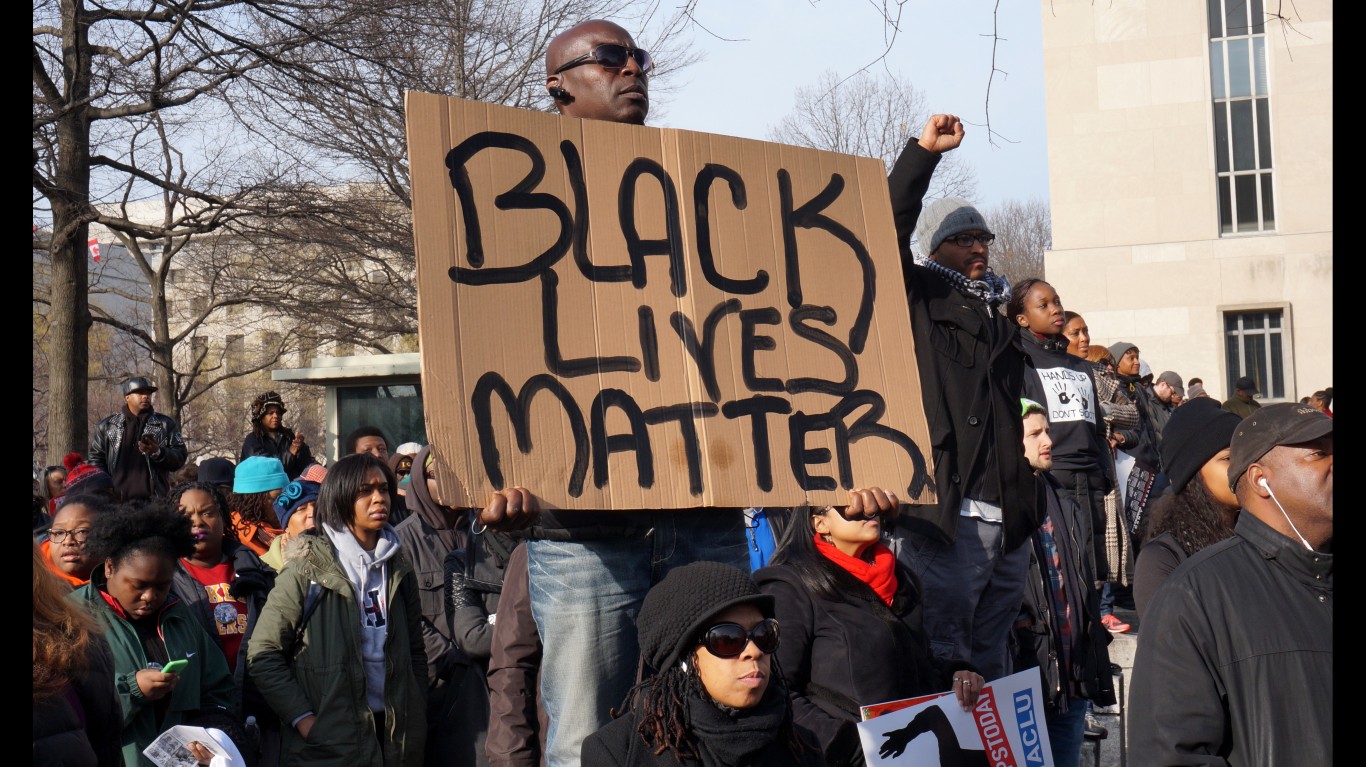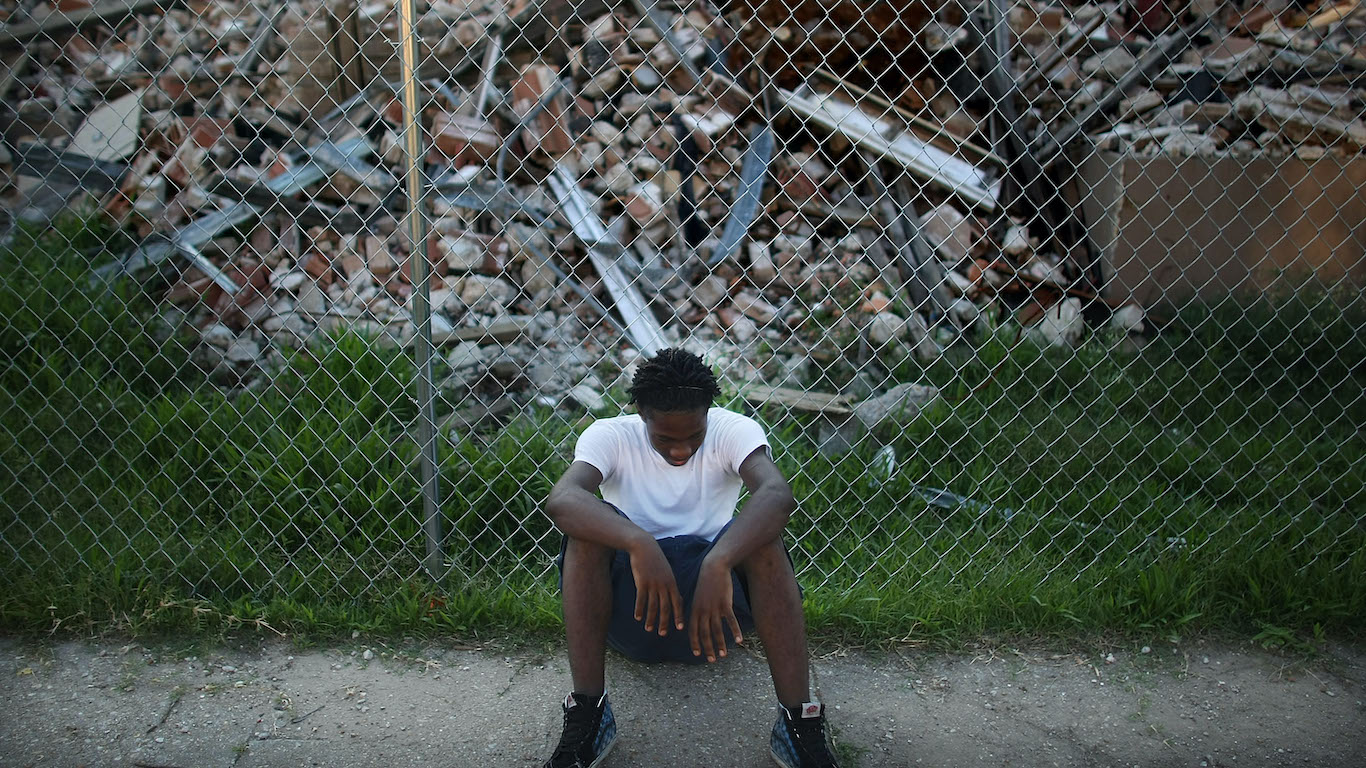
[cnxvideo id=”655234″ placement=”ros”]The United States was late to abolish slavery compared with many other nations, and in no other nation did its abolition involve the level of violence seen during the American Civil War, in which approximately 750,000 people were killed. From the stormy years from 1865 through 1877 following the years of Reconstruction, to the civil rights movement in the 1960s, to the emergence in 2014 of the Black Lives Matter movement, racial tension largely remain in the United States.
To highlight these tensions, 24/7 Wall St. reviewed the 10 worst states for black Americans, namely, the states where social and economic inequality remains at its worst.
[in-text-ad]
In the 10 worst states for black Americans, the typical black household earns less than two-thirds the income of a typical white household without exception. In a few states, black households earn half of what white households do. Because only a fraction of net worth can be captured by annual income, this disparity captures only a portion of the true wealth inequality in these states. According to estimates from the Economic Policy Institute, the median wealth of black families was less than $5,000 in 2010. For white families, by contrast, the typical wealth was nearly $100,000.
Click here to see the worst states for black Americans.
Income disparities are quite pronounced nationwide — the typical black household earns $36,544 a year, about $25,000 less than the typical white household. The household income gap, while severe, does not fully explain the 20-to-1 wealth gap between white and black families. Ownership of property, the single greatest source of familial wealth in America, is one significant factor. Just 40% of Black Americans own the residences in which they live compared to 71% of white Americans.
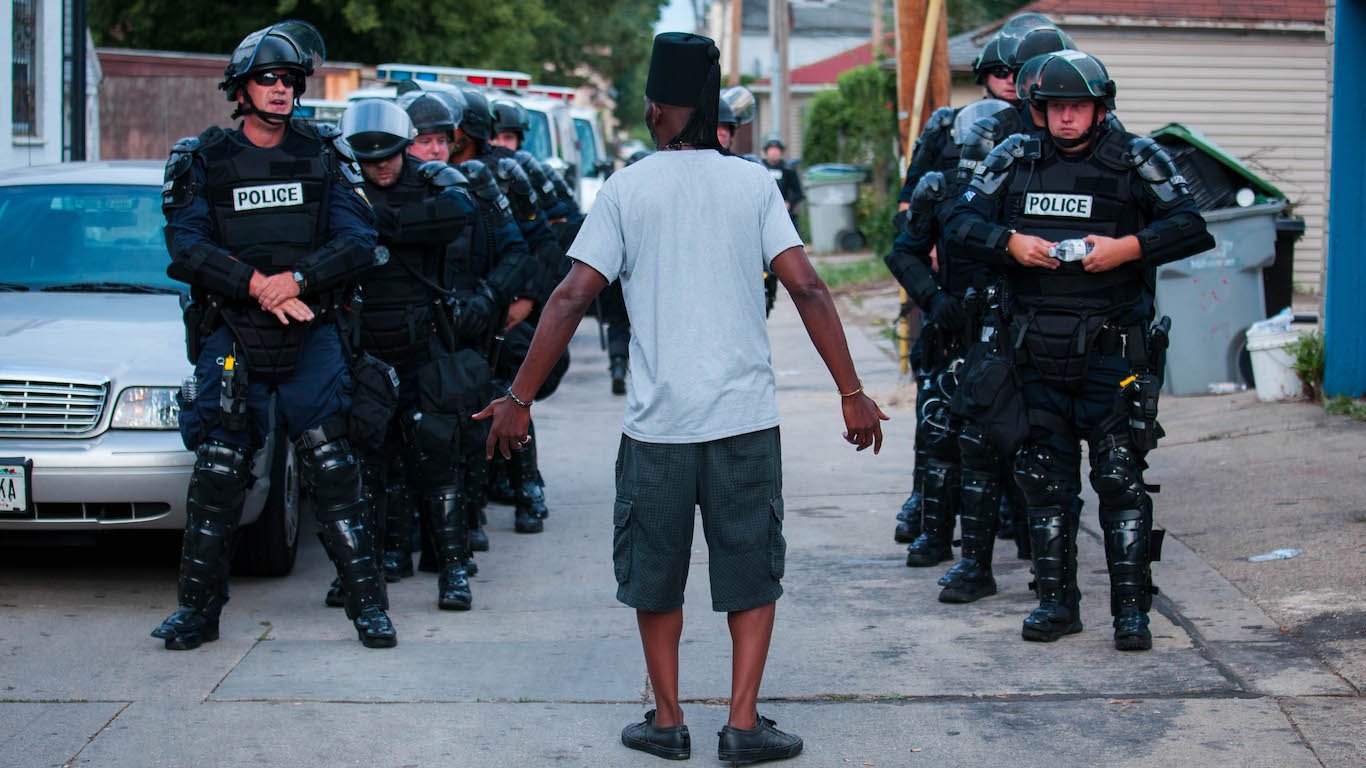
The United States is far and away the international leader in incarceration. There are 2.2 million people in U.S. prisons and jails, up 500% from 40 years ago. According to criminal justice reform advocate The Sentencing Project, changes in law and policy — not changes in crime rates — account for much of the increase. Nationwide, 275 of every 100,000 white Americans are in prison compared to 1,408 of every 100,000 black residents.
Researchers at the Sentencing Project wrote, “The results are overcrowding in prisons and fiscal burdens on states, despite increasing evidence that large-scale incarceration is not an effective means of achieving public safety.”
The consequences of high incarceration rates on African Americans are widespread and compounding. People who have been in prison are less likely to be able to find a job or acquire an education, and those who are convicted on felony charges in many states lose the right to vote. Nationwide, 1 in every 20 black residents is disenfranchised, largely because of imprisonment. In Wyoming, 1 in every 5 black residents is disenfranchised.
It is worth noting that even in states in which social and economic inequalities are less severe, there is still a meaningful gap in outcomes between white and black populations. In Maryland, the state in which the smallest white-black poverty gap exists, black residents are still more than twice as likely to be poor. Even in the state where the racial incarceration rates are the most similar, Hawaii, black residents are still more than twice as likely to be imprisoned.
Click here to read our methodology.
These are the worst states for black Americans.
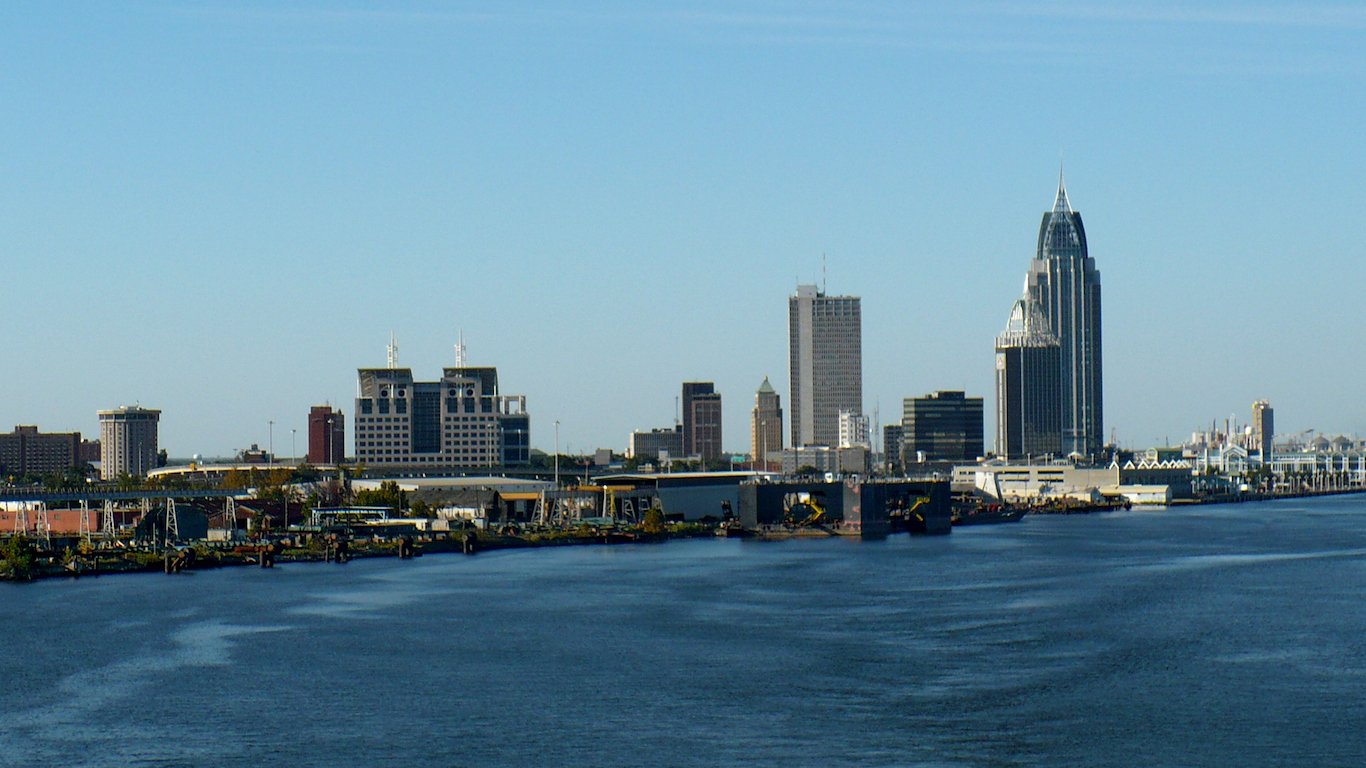
10. Alabama
> Pct. residents black: 26.8% (6th highest)
> Black homeownership rate: 49.7% (5th highest)
> Black incarceration rate: 1,417 per 100,000 (25th lowest)
> Black unemployment rate: 10.6% (12th highest)
More than one-quarter of Alabama residents are black, the sixth largest share of all states and more than double the national proportion. Many states with higher proportions of black residents are Southern states, but do not necessarily have larger racial disparities than others.
[in-text-ad]
Social and economic disparities between racial groups lead to unequal health outcomes. For example, the mortality rate for black babies nationwide is twice as high as that for white babies. In Alabama, the disparity is even greater. While the white infant mortality rate in the state of six deaths for every 1,000 live births is among the highest in the nation, it is less than half the black infant mortality rate. At 14.5 deaths per 1,000 live births, Alabama’s black infant mortality rate is the highest of all states.
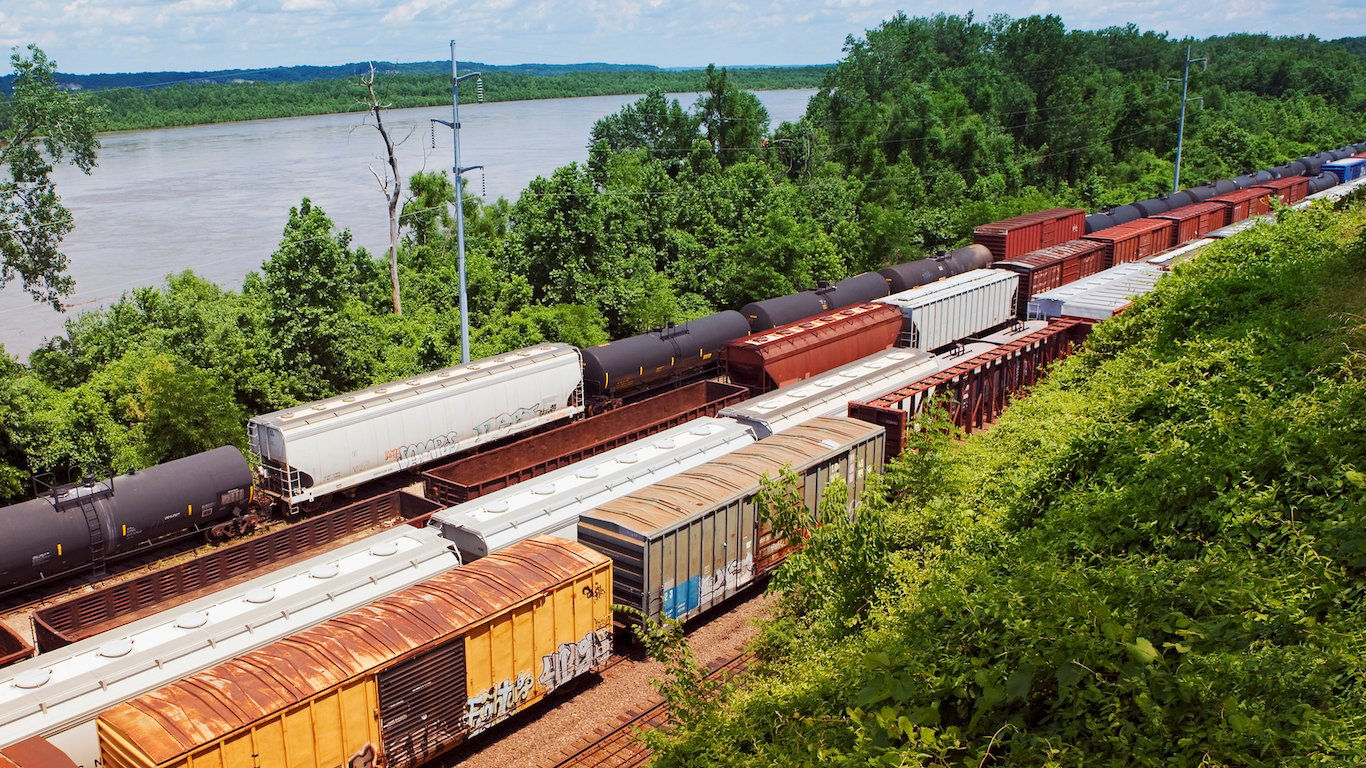
9. Kansas
> Pct. residents black: 5.9% (22nd lowest)
> Black homeownership rate: 34.9% (23rd lowest)
> Black incarceration rate: 1,734 per 100,000 (14th highest)
> Black unemployment rate: 6.6% (17th lowest)
Kansas has one of the lower black unemployment rates in the nation at 6.6%. However, unemployment is still higher among the state’s black labor force than among white Kansas workers. At 4.1%, the state’s white unemployment rate is not even especially low compared with white jobless rates in other states.
The likelihood of imprisonment is grossly higher for black Americans than for white U.S. residents, and this is especially the case in Kansas. While the state’s white incarceration rate of 246 prisoners per 100,000 white state residents is lower than the national white incarceration rate, the likelihood of going to prison as a black person in Kansas is higher than it is nationwide. For every 100,000 black Kansas residents, more than 1,700 are in prison, higher than the nationwide black incarceration rate of 1,408 per 100,000 black Americans.
[nativounit]
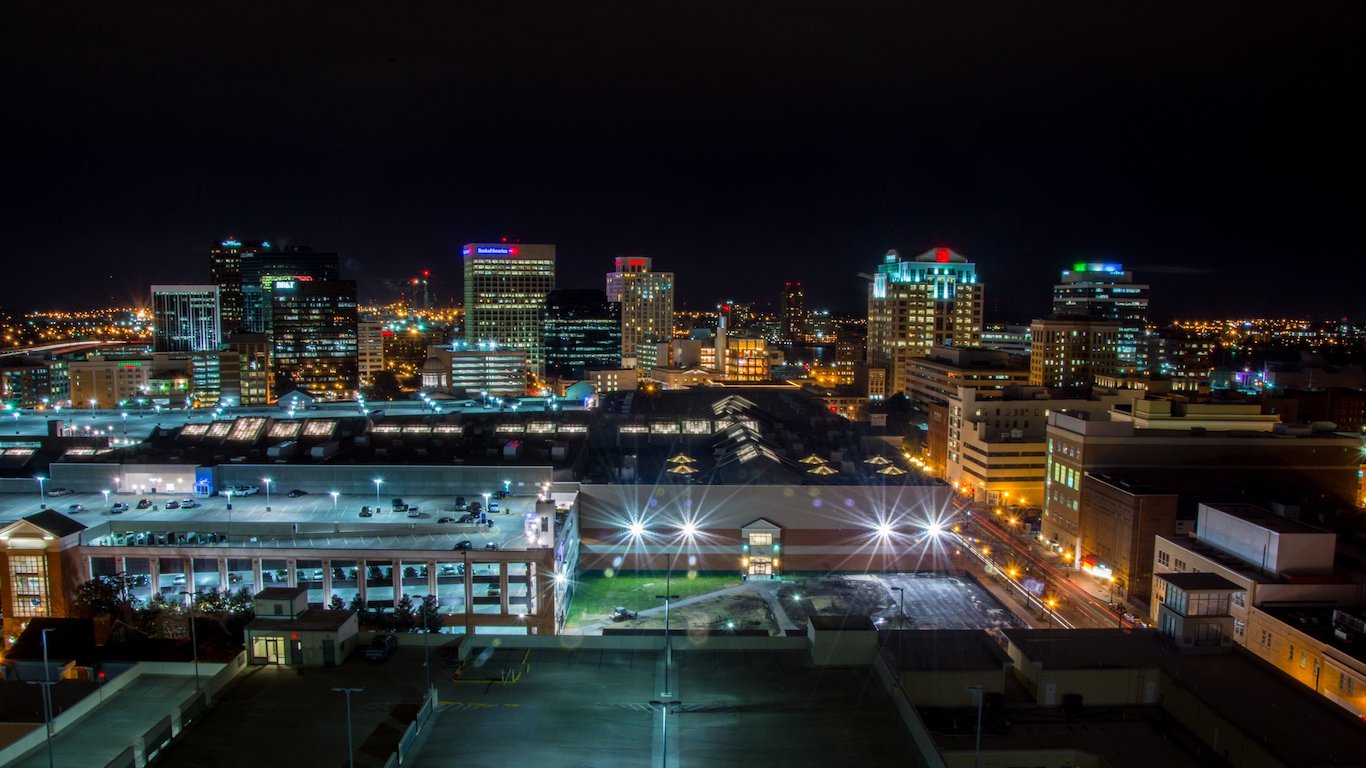
8. Virginia
> Pct. residents black: 19.2% (9th highest)
> Black homeownership rate: 45.5% (7th highest)
> Black incarceration rate: 1,386 per 100,000 (22nd lowest)
> Black unemployment rate: 7.9% (21st lowest)
Certain policies and implicit racial bias can contribute to racial inequity in a community or across a state. Socioeconomic inequities are perhaps the best illustration of how racial disparities can grow. Fewer than 20% of black Virginia residents live in poverty, one of the lower black poverty rates compared with other states but still more than double the state’s white poverty rate of 8.7%. The education level is a major determinant of a population’s financial prosperity. More than 40% of white Virginia adults have at least a college degree versus 22.8% of black Virginia adults. While black Virginians are more likely than African Americans across the nation to have a college degree, the difference compared to the white educational attainment in Virginia is one of the largest of all states.

7. Pennsylvania
> Pct. residents black: 11.0% (20th highest)
> Black homeownership rate: 42.9% (13th highest)
> Black incarceration rate: 1,810 per 100,000 (11th highest)
> Black unemployment rate: 10.5% (15th highest)
Like most of the worst states for black Americans, more than 10% of black Pennsylvania workers are unemployed — double the white unemployment rate. Because individuals with higher levels of education tend to have access to more job opportunities, higher education mostly leads to higher income. However, as is the case virtually without exception throughout the United States, black Pennsylvanians tend to have attained less education than white state residents.
[in-text-ad]
Pennsylvania’s former Gov. Tom Corbett cut education budgets. These cuts disproportionately affected black students, who disproportionately make up student populations in poorer school districts that depend on state funding. Further, according to research published last year, districts at any given poverty level with higher proportions of white students received greater funding than districts with more minority students.

6. Connecticut
> Pct. residents black: 10.6% (21st highest)
> Black homeownership rate: 39.5% (19th highest)
> Black incarceration rate: 1,392 per 100,000 (23rd lowest)
> Black unemployment rate: 13.2% (3rd highest)
Connecticut has one of the nation’s most financially well-off populations. However, the prosperity is largely enjoyed by the state’s white residents. While the white poverty rate of 6.1% is the lowest in the country, for example, more than 20% of black Connecticut residents live in poverty. Similarly, the difference of almost $37,000 between the median annual incomes for black and white households, at $44,418 and $81,324 respectively, is the largest of all states.
Segregation underpins many of these inequities and is a major problem in most U.S. areas. Racial segregation is especially pronounced in Connecticut. Not only are highly affluent, predominantly white neighborhoods more common in Connecticut than across the nation, but unlike many other areas, these communities often border extremely poor, predominantly nonwhite neighborhoods.
[recirclink id=366120]
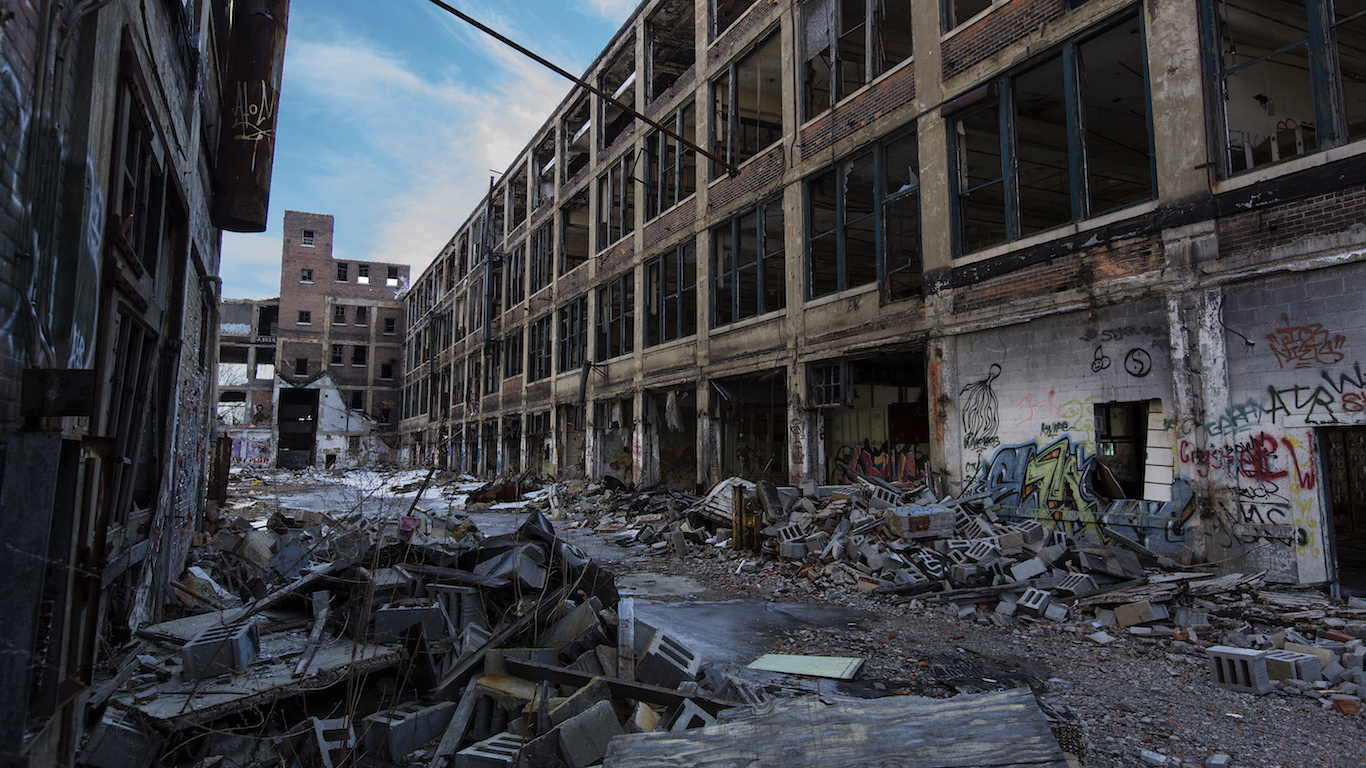
5. Michigan
> Pct. residents black: 13.9% (15th highest)
> Black homeownership rate: 40.8% (16th highest)
> Black incarceration rate: 1,682 per 100,000 (15th highest)
> Black unemployment rate: 11.6% (6th highest)
Based on social and economic gaps between black and white residents, few states are worse for African Americans than Michigan. Gross segregation and inequalities in the Detroit metro area contribute to the state’s poor ranking. By using race to determine home loan eligibility, the FHA deliberately segregated the Detroit area over the course of the mid-20th century. To this day, a wall built in 1940 along 8 Mile Road to separate white and black neighborhoods serves as a reminder of the area’s history of segregation. The wall no longer separates black and white residents, but the city remains one of the most segregated in the country.
Across Michigan, black residents are considerably more likely than white residents to live in poverty. Close to 33% of black people in the state live in poverty versus less than 12% of whites.
[nativounit]

4. Ohio
> Pct. residents black: 12.3% (17th highest)
> Black homeownership rate: 34.9% (22nd lowest)
> Black incarceration rate: 1,625 per 100,000 (19th highest)
> Black unemployment rate: 10.9% (10th highest)
The share of white adults in Ohio with at least a bachelor’s degree is 27.7%, one of the lowest compared with white adult populations in other states. Still, white Ohioans are considerably more likely to have gone to college than black residents as just 16.4% of black adults in Ohio have at least a bachelor’s degree, one of the lowest such rates nationwide. Perhaps due in part to the low educational attainment, black state households tend to earn very low incomes compared to both white Ohio households and black households in other states. The state’s black median household income of less than $30,000 annually is lower than the nationwide black median household income of $36,544 and than the state’s white median household income of $55,448 a year.

3. Illinois
> Pct. residents black: 14.3% (14th highest)
> Black homeownership rate: 38.0% (23rd highest)
> Black incarceration rate: 1,533 per 100,000 (23rd highest)
> Black unemployment rate: 12.2% (4th highest)
The white unemployment rate in Illinois of 5.0% is 12th highest compared with white jobless rates in other states. While relatively high, white unemployment is still a fraction of the rate for black workers in Illinois, which at 12.2% is among the highest in the country. Socioeconomic disparities such as this employment gap contribute to unequal incarceration rates. Black Illinois residents are more than eight times more likely to be imprisoned than white state residents. While the white incarceration rate of 174 per 100,000 white people is one of the lowest in the country, the black incarceration rate of 1,533 per 100,000 black residents is higher than the corresponding national rate.
[in-text-ad]
According to a recent policy brief from the Fiscal Policy Center at Voices for Illinois Children, the state also has a juvenile justice problem. According to the Center, youth incarceration not only disproportionately affects black children, but also it is the most expensive and least effective response to juvenile delinquency. Unfortunately, political gridlock and one of the nation’s worst government debt problems have resulted in fewer community programs in Illinois.
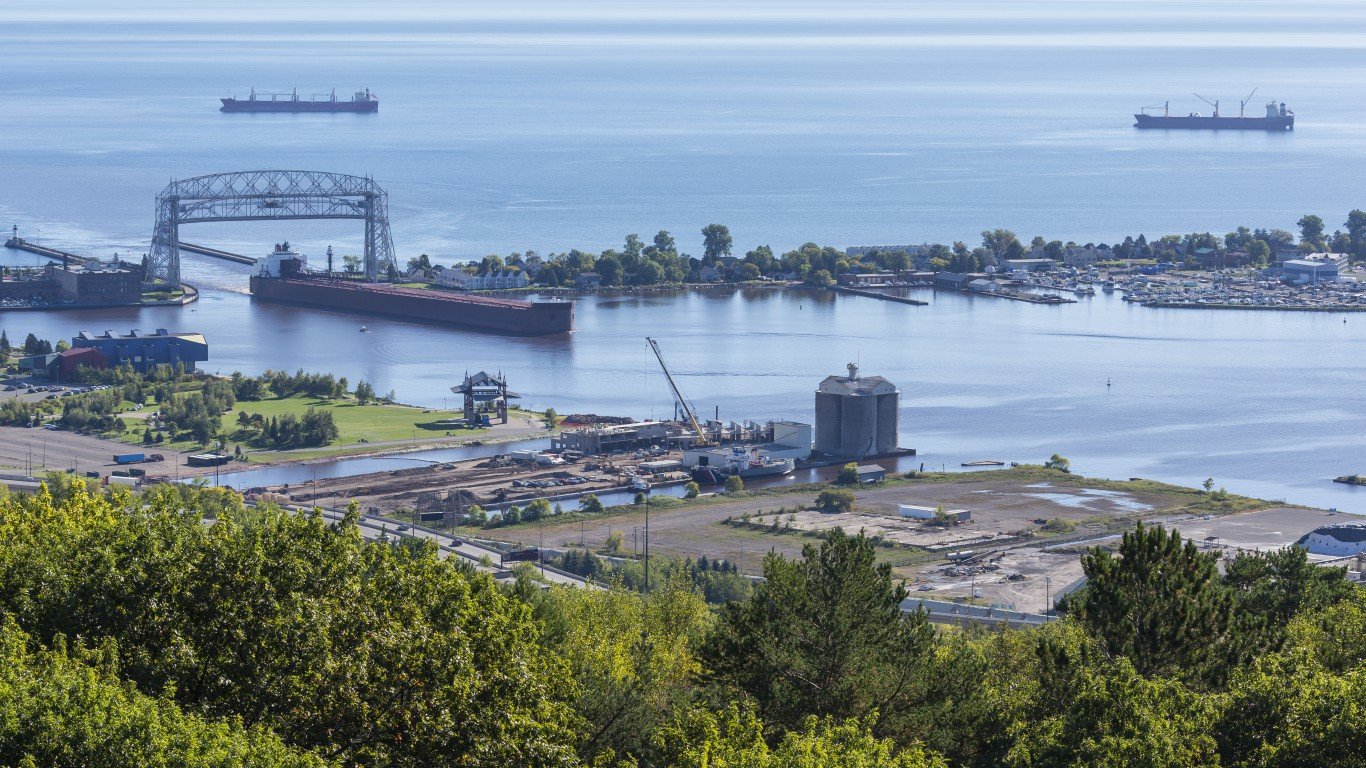
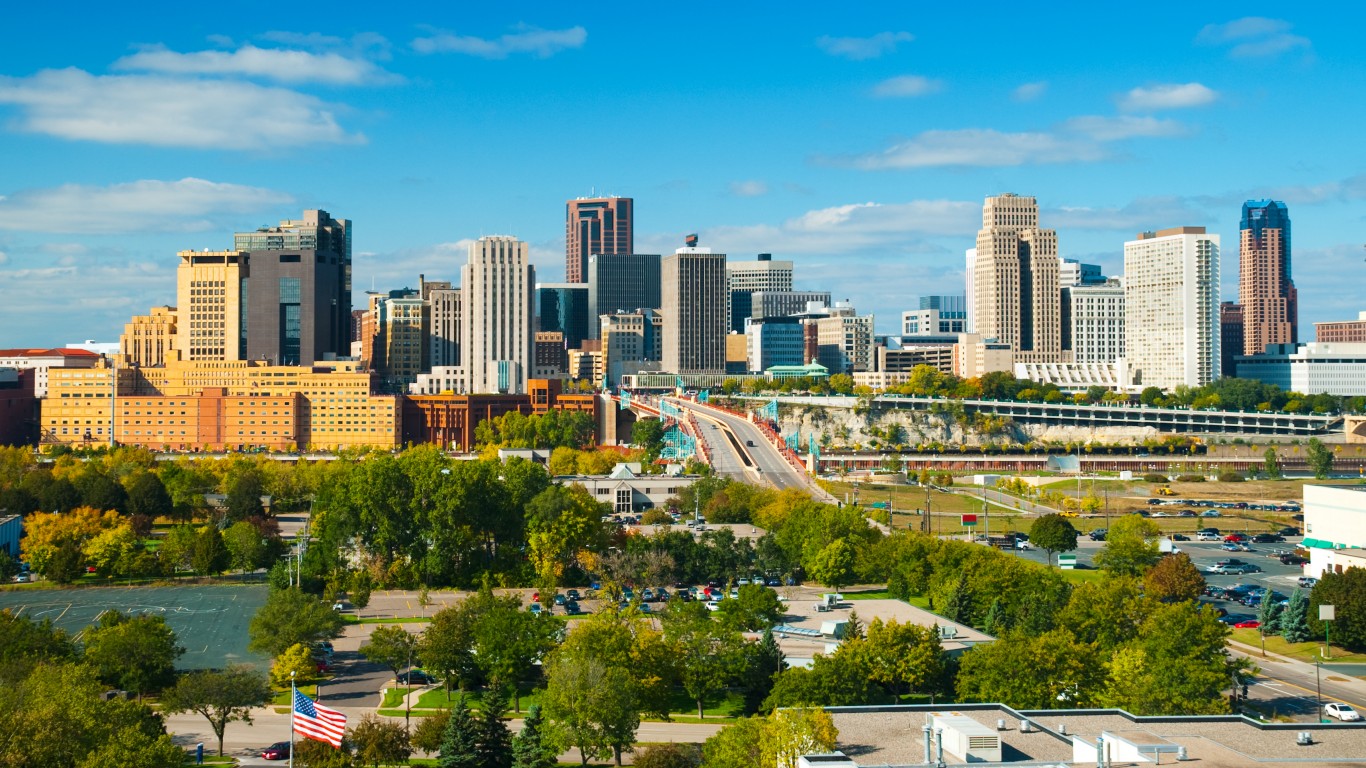
2. Minnesota
> Pct. residents black: 5.8% (21st lowest)
> Black homeownership rate: 21.7% (5th lowest)
> Black incarceration rate: 1,219 per 100,000 (16th lowest)
> Black unemployment rate: 14.1% (the highest)
White Minnesota residents are more than three times as likely to own their homes as black state residents. More than 75% of white-occupied housing units are owned by their occupants, one of the highest homeownership rates in the nation even when compared to white Americans only. By contrast, the black homeownership rate of just 21.7% in Minnesota is almost half the national black homeownership rate of more than 40%.
Such economic disparities are tied to a host of factors, including other social and economic inequities. Of particular note is the racial poverty gap. Nearly a third of black residents live in poverty versus less than 10% of white residents. According to some community leaders in Minnesota, the state’s criminal justice system has burdened minority residents, particularly black men. According to the Minnesota Department of Corrections, black Minnesotans make up 36% of the state’s prison population despite making up just 5.8% of the total population.
[wallst_email_signup]
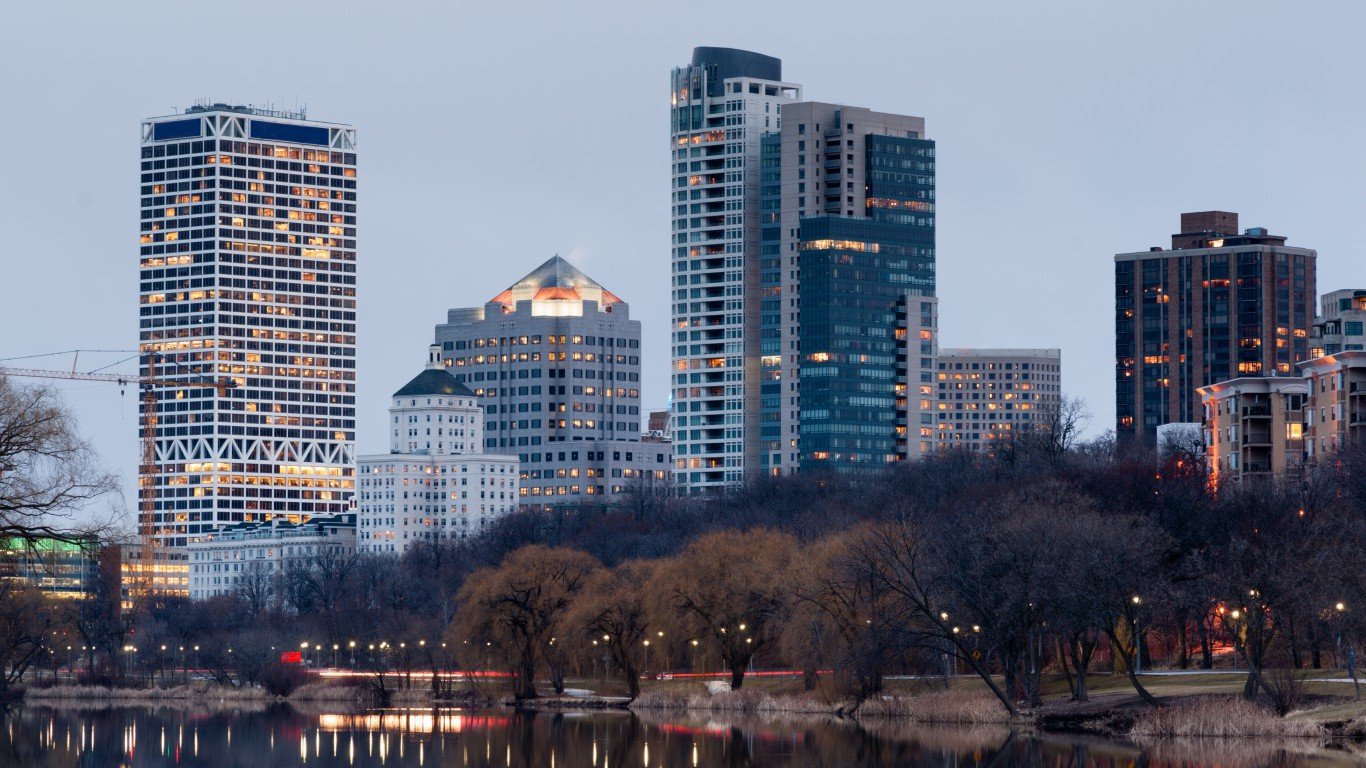
1. Wisconsin
> Pct. residents black: 6.3% (24th lowest)
> Black homeownership rate: 26.2% (8th lowest)
> Black incarceration rate: 2,542 per 100,000 (2nd highest)
> Black unemployment rate: 11.1% (8th highest)
Based on measures of racial inequity, no state is worse for black residents than Wisconsin. For example, the state is one of only two where the typical black household earns less than half the median income of white households. According to such measures of prosperity as homeownership, the racial wealth gap in Wisconsin is likely considerably wider. While the white homeownership rate of 71.6% is in line with the national rate, just 26.2% of housing units with black heads of household are owned by their occupants, much lower than the national black homeownership rate of 40.9%.
The likelihood of imprisonment is grossly higher for black Americans than for white U.S. residents, and this is especially the case in Wisconsin. While the state’s white incarceration rate of 221 prisoners per 100,000 white state residents is lower than the national white incarceration rate, the likelihood of going to prison as a black person in Wisconsin is considerably higher than it is nationwide. For every 100,000 black Wisconsin residents, 2,542 are in prison, the second highest black incarceration rate of all states, more than double the national black incarceration rate of 1,113 per 100,000 black Americans, and 10 times the white incarceration rate.
Methodology
To determine the 10 worst states for black Americans, 24/7 Wall St. created an index of 10 measures to assess racial gaps in access to resources and opportunities in each state. Creating the index in this way highlights disparities between racial groups rather than what may be particularly poor socioeconomic climates for both whites and blacks. For each measure we constructed an index from the gaps between black and white Americans. The index was standardized using min-max normalization. We only considered states where black residents comprise at least 5% of the population, which excluded 19 states from the ranking.
[in-text-ad]
To construct the index, we used 2015 data from the U.S. Census Bureau’s American Community Survey (ACS) on median household income, poverty, high school and bachelor’s educational attainment rates, and homeownership rates — each broken out by race. Unemployment rates for 2015 come from the Bureau of Labor Statistics. Incarceration rates and estimates of felony disenfranchisement are from the Sentencing Project, and are for 2014 and 2016, respectively. Age-adjusted estimates of infant mortality are from the Centers for Disease Control and Prevention (CDC) and are pooled over the period 2012-2014. Also from the CDC we considered infant mortality rates for 2014.
Contact [email protected] for any questions or corrections.