
[cnxvideo id=”509259″ placement=”ros”]The violent crime rate in the United States rose slightly in 2015, from 362 incidents per 100,000 people in 2014 to 373 incidents per 100,000 Americans. Still, the long-term trend of violent crime nationwide has been one of steady improvement. In 1996, there were 637 violent crimes per 100,000 Americans, and the rate has declined nearly every year since.
Violent crime is a broad category that includes rape, robbery, aggravated assault, and murder. While these crimes have become less and less common nationwide, some metro areas have reported a dramatic spike in violent crime. In Monroe, Louisiana, the violent crime rate increased from 640 reported incidents per 100,000 people in 2011, which was 16th highest at the time, to 1,160 incidents per 100,000 people in 2015 — the highest. Based on figures published by the FBI, these are the metropolitan areas with the greatest increases in the violent crime rate.
[in-text-ad]
Violent and nonviolent crime rates can move independently from one another, as factors driving up burglary and theft may have little impact on murder and assault. Still, there appears to be some relationship, as the majority of the 15 cities on this list where violent crime soared either reported a similar rise in property crime, or property crime was already a serious problem in the area. While property crime nationwide fell by 11.7% over the past five years, it increased in 11 of the 15 metropolitan areas on this list.
Click here to see the cities where crime is soaring.
Large five-year increases in violent crime rates tended to be more common in metro areas that started as relatively safe places. Of the 15 metro areas on this list, nine had violent crime rates below the national rate of 387.1 reported incidents per 100,000 Americans in 2011. Each metro area on this list reported at least a 37% spike in violent crimes since, and now all but two have a higher violent crime rate than the nation as a whole.
In an interview with 24/7 Wall St., John Roman, senior fellow at the independent research organization NORC at the University of Chicago, explained that violent crime rates go hand in hand with several other socioeconomic measures. Roman explained that violence and poor economic conditions are cyclical and can feed into each other. There is much evidence that in areas without economic opportunities, residents — young men in particular — are more likely to turn to drug dealing and other kinds of crime.
Roman added that the relationship between economic development and crime is not one-way. Businesses and potential residents are less likely to choose to locate to a high crime neighborhood. “[You] really need to do something about crime and violence before you can see economic growth in a city,” Roman said.
Perhaps counterintuitively, violence reduction is often not the product of increased policing and crime repression strategies. According to Roman, safe cities such as New York “have introduced hundreds of programs and policies — all of which are designed to improve the community instead of trying to improve the community by suppressing violence.”
Community improvement is crucial in crime reduction. “Cities with less segregation, with more diverse income growth and economic growth, and more gentrification” are the same cities reporting declines in violence, Roman explained. Meanwhile, economically and racially segregated cities report persistent higher levels of violence.
Based on figures published by the FBI’s Uniform Crime Report, 24/7 Wall St. identified the 15 metropolitan statistical areas where crime rates rose the most from 2011 to 2015, the most recent available year of data. In order to be considered, areas had to retain the same geographic boundaries during the period covered, and they had to retain consistent reporting practices. Additionally, we reviewed annual unemployment figures from the Bureau of Labor Statistics for 2011 and 2015, as well as unemployment figures from December 2016. We also considered data from the Census Bureau’s 2015 American Community Survey on household income, educational attainment rates, and poverty.
These are the 15 U.S. cities where violent crime is soaring.
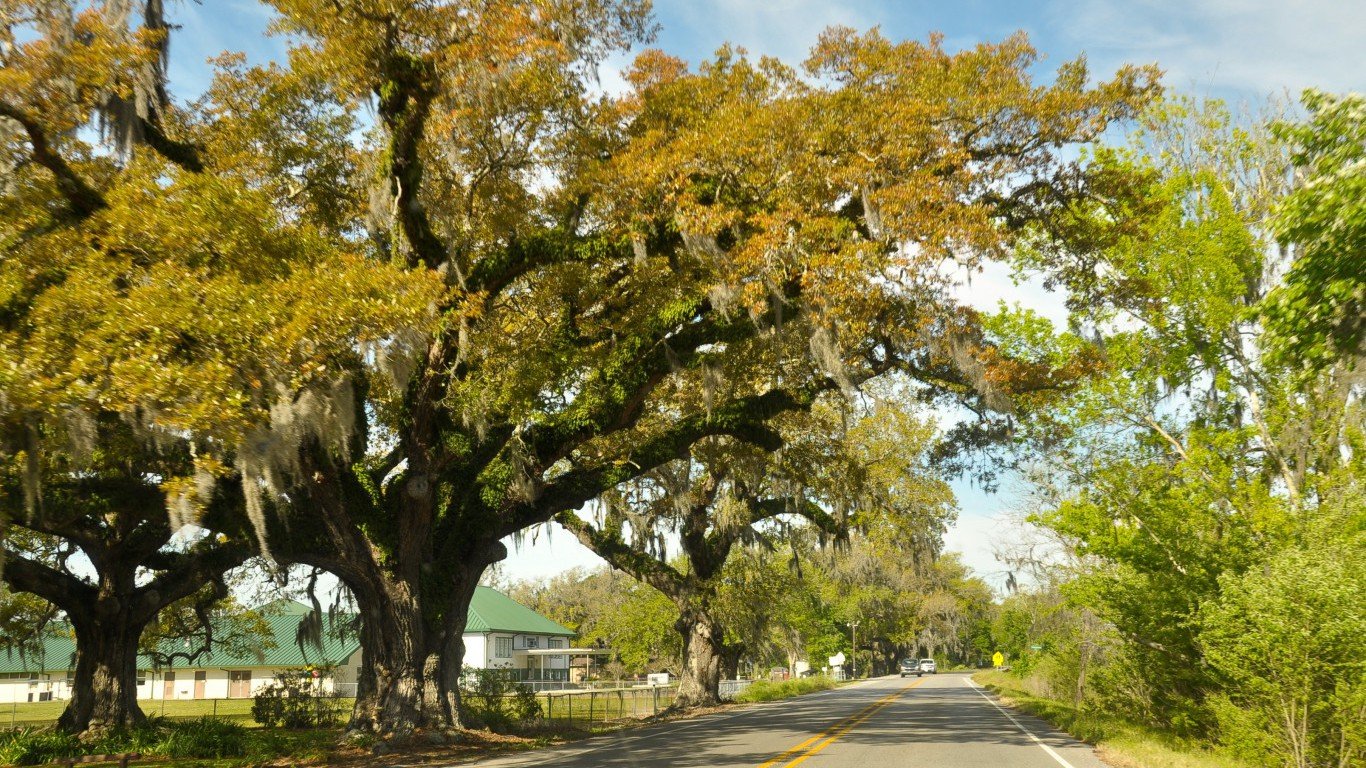
15. Anniston-Oxford-Jacksonville, AL
> 5-yr. violent crime rate change: +37.3%
> 2011 violent crime rate: 509.5 per 100,000
> 2015 violent crime rate: 699.3 per 100,000
> Murders in 2015: 10
The violent crime rate in the Anniston, Alabama metropolitan area rose by 37.3% over the last five years. Violent crime was already a problem in the area five years ago. There were about 510 violent crimes for every 100,000 metro residents in 2011, 43rd highest among metropolitan areas at the time. Anniston’s current rate of nearly 700 violent crimes per 100,000 people is 15th worst among U.S. metro areas. A weak economy can potentially lead to greater crime in an area, and crime can in turn suppress economic growth. Anniston’s current unemployment rate of 6.9% is one of the worst of any U.S. metropolitan area.
[in-text-ad]
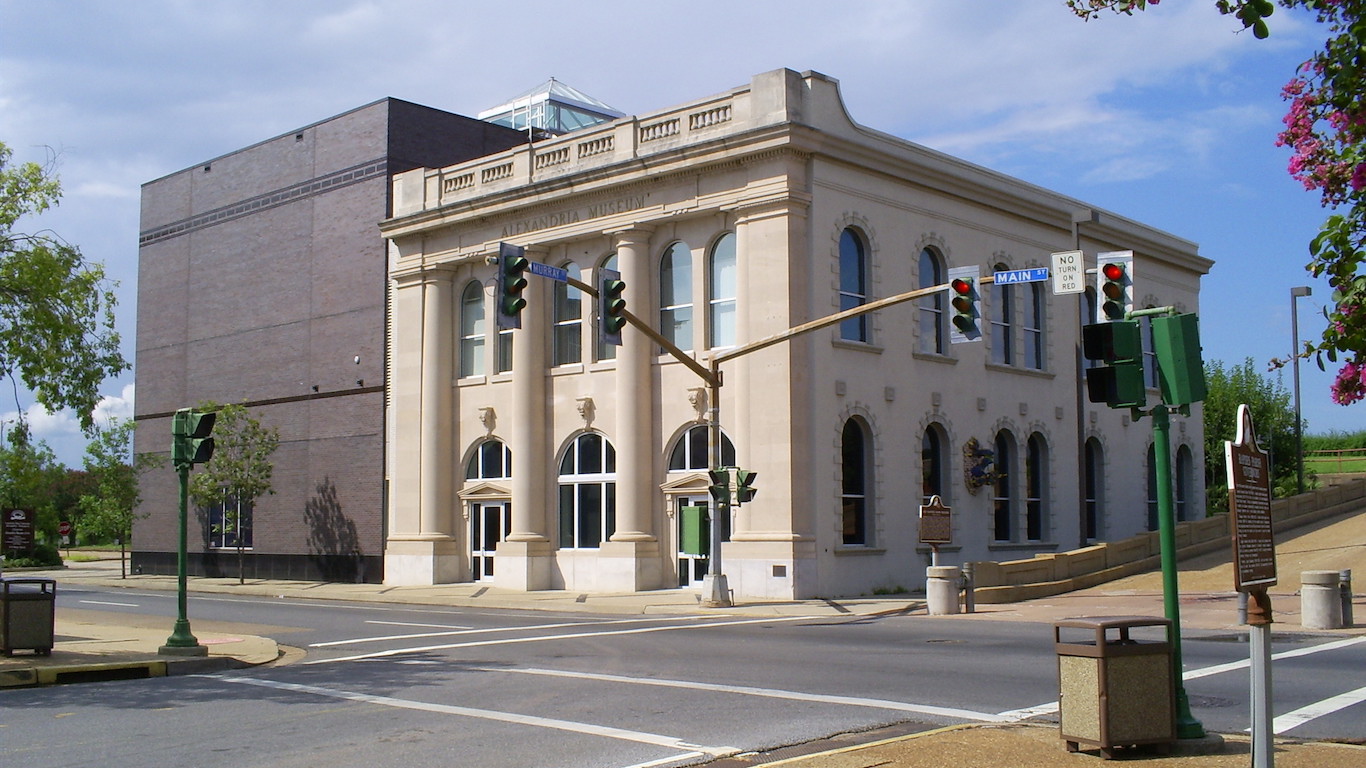
14. Alexandria, LA
> 5-yr. violent crime rate change: +38.1%
> 2011 violent crime rate: 677.9 per 100,000
> 2015 violent crime rate: 936.4 per 100,000
> Murders in 2015: 7
The violent crime rate in Alexandria was already alarmingly high five years ago, and it has only gotten worse since. There were 678 robberies, murders, rapes, and aggravated assaults in the Louisiana metropolitan area per 100,000 residents in 2011, 11th worst in the nation. The current rate of 936 violent crimes per 100,000 people is fourth worst in the country, and well more than double the national rate. Driving this increase was a significant rise in aggravated assaults in the area, from 813 reported incidents in 2011 to 1,202 in 2015. Controlling for population size, the metro area currently has the third worst aggravated assault rate in the country.
[recirclink id=376049]

13. Abilene, TX
> 5-yr. violent crime rate change: +38.7%
> 2011 violent crime rate: 297.5 per 100,000
> 2015 violent crime rate: 412.5 per 100,000
> Murders in 2015: 9
Just five years ago, Abilene, Texas was considered relatively safe. The violent crime rate in 2011 of 298 incidents per 100,000 metro area residents was lower than the nationwide rate that year of 387 per 100,000 Americans. In just five years, the violent crime rate in the metro area rose to 413 incidents per 100,000 residents, now higher than the national rate of 373 incidents per 100,000 people.
A high violent crime rate does not necessarily mean the nonviolent crime rate is also high, but metropolitan areas with high rates of one often experience elevated rates of the other. In Abilene, the property crime rate also increased from 3,030 incidents per 100,000 people in 2011 to 3,609 incidents per 100,000 people in 2015.
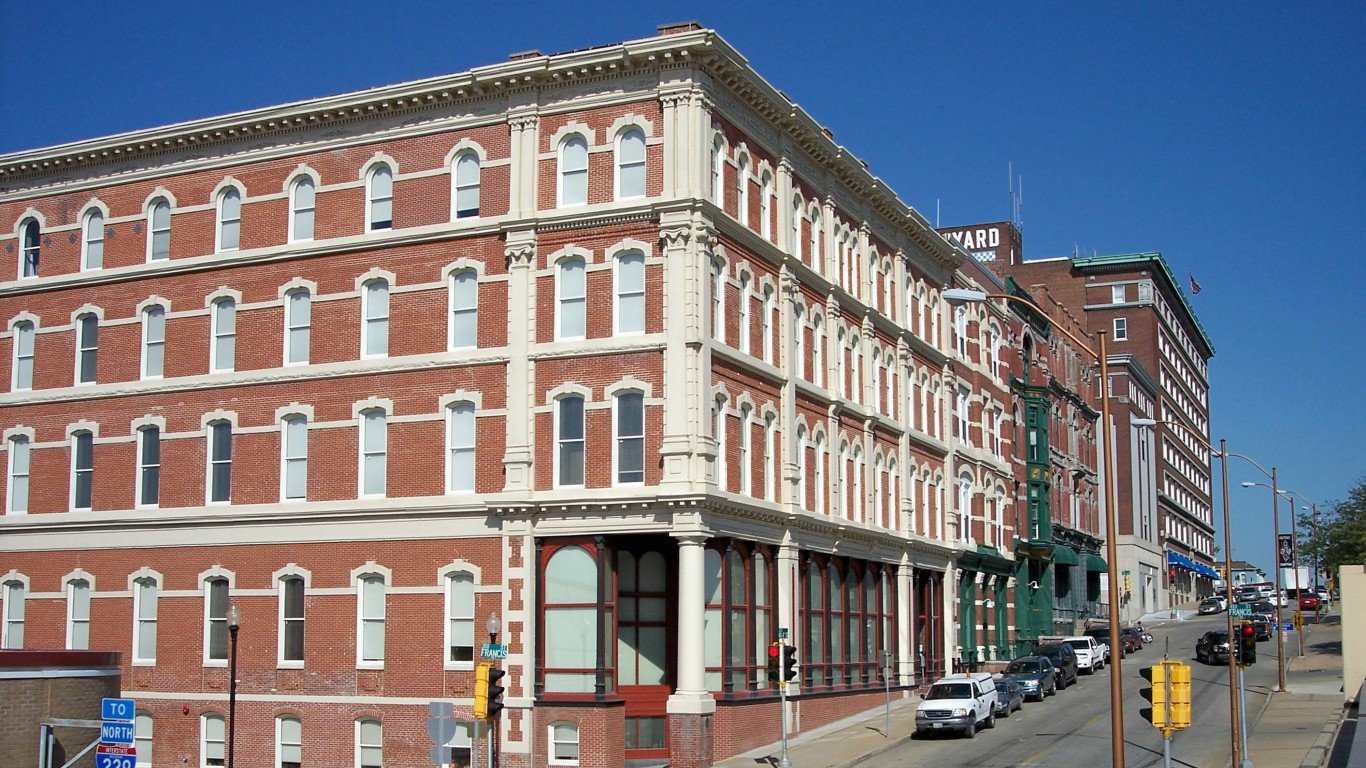
12. St. Joseph, MO-KS
> 5-yr. violent crime rate change: +39.5%
> 2011 violent crime rate: 275.4 per 100,000
> 2015 violent crime rate: 384.3 per 100,000
> Murders in 2015: 12
St. Joseph, Missouri is one of the smaller metropolitan areas by population, with 127,400 residents. While most metropolitan areas with populations of less than 150,000 had fewer than four homicides in 2015, St. Joseph had 12, up from only four in 2011. Adjusting for population, St. Joseph’s murder rate is among highest in the country.
However, as was the case in every city on this list, aggravated assault was the primary driver of increased violence in the area. There were 314 total incidents of aggravated assault in the St. Joseph metro area in 2015, up from 236 half a decade prior. Overall, the violent crime rate in St. Joseph rose by nearly 40% over the last five years.
[in-text-ad-2]
11. Houma-Thibodaux, LA
> 5-yr. violent crime rate change: +41.8%
> 2011 violent crime rate: 314.6 per 100,000
> 2015 violent crime rate: 446.1 per 100,000
> Murders in 2015: 17
While Houma-Thibodaux had one of the largest five-year spikes in violent crime of any metro area, most of the increase occurred over one year. Between 2014 and 2015, the area’s violent crime rate nearly doubled from 242 incidents per 100,000 residents to 446 per 100,000 today, one of the higher violent crime rates of any city. The number of murders in the metro area nearly tripled over the past five years, rising from six reported murders in 2011 to 17 in 2015.
Police list several possible reasons for the spike, suggesting a rise in heroin use may be behind the increase in violent crime, but also noting that many of these crimes appeared to be more random, and not necessarily connected to a broader trend.
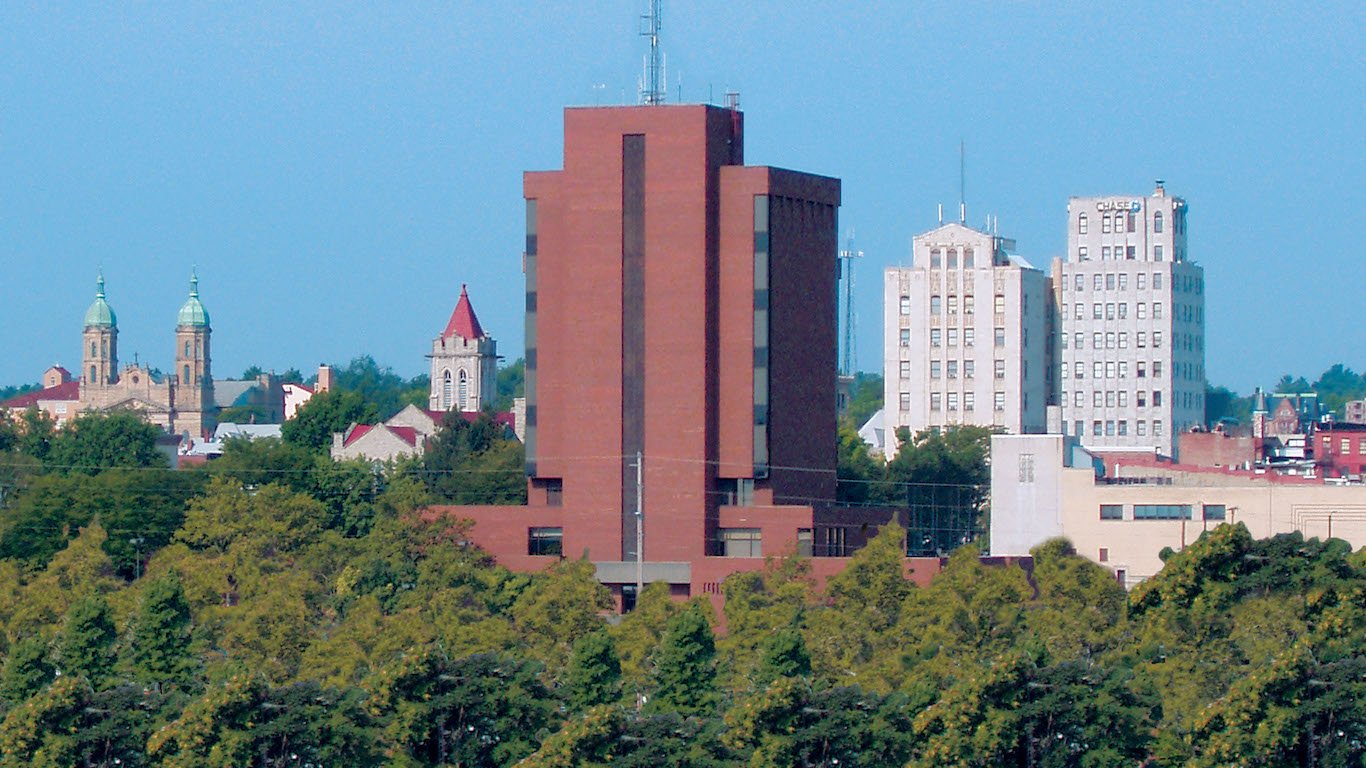
10. Mansfield, OH
> 5-yr. violent crime rate change: +43.2%
> 2011 violent crime rate: 182.2 per 100,000
> 2015 violent crime rate: 261.0 per 100,000
> Murders in 2015: 3
Mansfield’s violent crime rate is well below the U.S. rate, but it is still alarmingly higher compared to what it was five years ago. In 2011, there were just 182 murders, robberies and aggravated assaults for every 100,000 area residents, one of the lowest rates among U.S. metropolitan areas and less than half the national violent crime rate. By 2015, the rate rose to 261 violent crimes per 100,000 residents, a 43.2% increase.
While Mansfield’s violent crime rate remains below the national rate even with this substantial increase, property crime levels in the area have far surpassed national levels and are a serious problem. There were over 4,000 burglaries and thefts in 2015 for every 100,000 Mansfield residents, compared to the national rate of 2,487 property crimes per 100,000 people.
[in-text-ad]

9. Springfield, MO
> 5-yr. violent crime rate change: +45.8%
> 2011 violent crime rate: 426.0 per 100,000
> 2015 violent crime rate: 621.3 per 100,000
> Murders in 2015: 15
Springfield, Missouri had a violent crime rate in 2011 of 426 incidents for every 100,000 residents, which was slightly higher than the national rate of 387 per 100,000 people. Today, the metro area’s violent crime rate has pulled away from the national rate, with 621 reported incidents per 100,000 area residents, compared to the national rate of 373 incidents per 100,000.
In a number of metropolitan areas where violent crime rose, property crime also either rose or remained high. Springfield had over 4,000 burglaries and thefts per 100,000 in 2015, 11th highest among metropolitan areas.
[recirclink id=377173]
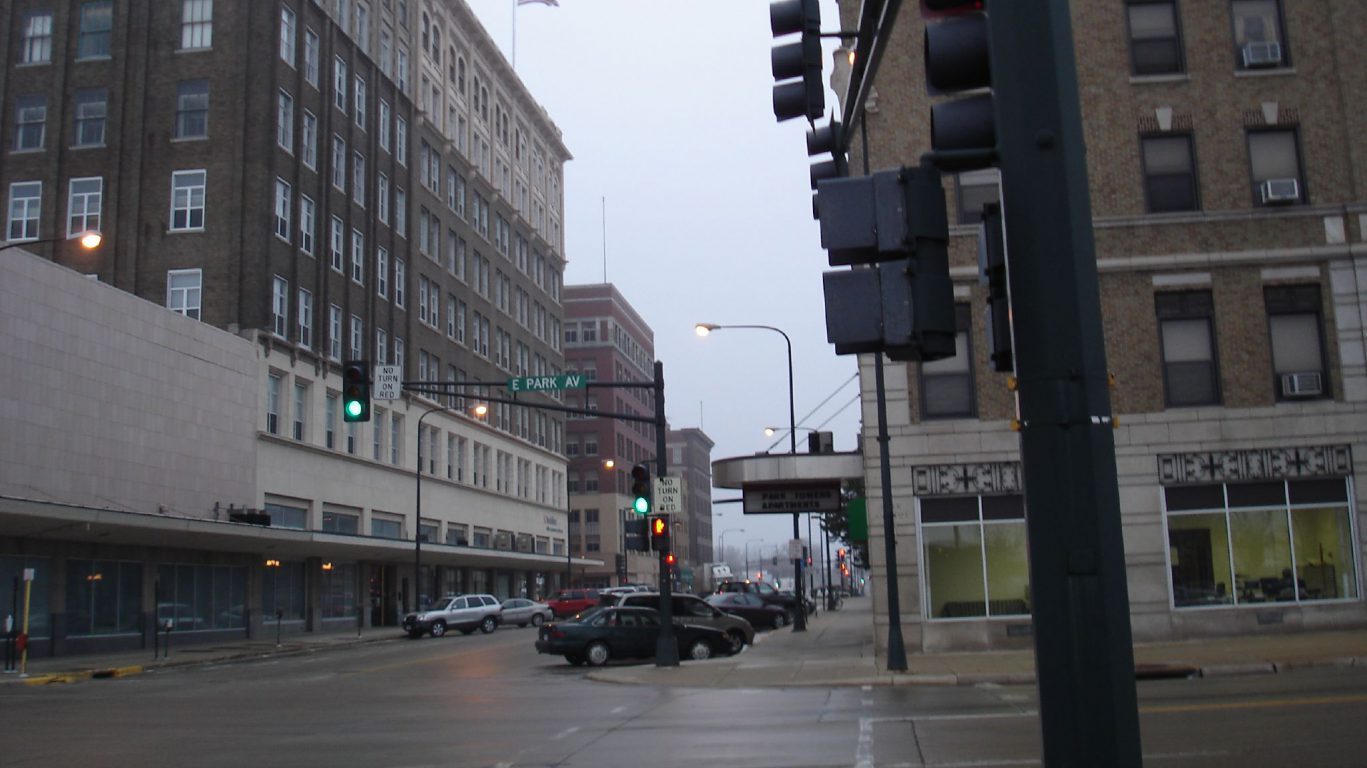
8. Waterloo-Cedar Falls, IA
> 5-yr. violent crime rate change: +50.0%
> 2011 violent crime rate: 331.4 per 100,000
> 2015 violent crime rate: 497.0 per 100,000
> Murders in 2015: 4
Between 2011 and 2015, the Waterloo-Cedar Falls metro area’s violent crime rate increased from 331 incidents per 100,000 residents to 497 per 100,000. Most crimes were reported in Waterloo, the metro area’s largest city. The Waterloo Police Department logged more murders in 2014 than they had in any of the previous 20 years. However, the Waterloo Police Department maintains that the high number of murders was an anomaly and not an indication of an upward trend in violence.
Murder, however, was not the primary driver increased violence in the area. There were nearly 300 more aggravated assaults in the Waterloo metro area in 2015 than in 2011. The jump in aggravated assaults was the main reason for the 50% spike in the metro area’s violent crime rate over the last five years, one of the largest increases nationwide.

7. Milwaukee-Waukesha-West Allis, WI
> 5-yr. violent crime rate change: +51.8%
> 2011 violent crime rate: 448.1 per 100,000
> 2015 violent crime rate: 680.1 per 100,000
> Murders in 2015: 155
Racially segregated cities tend to be more violent than more integrated cities. The Milwaukee metro area, which reported a 51.8% spike in the violent crime rate in the last half decade, is one of the most violent and racially segregated parts of the country. Particularly, the number of murders in the metro area spiked considerably. There were 155 homicides in the Milwaukee metro area in 2015 compared to 92 in 2011.
Some metro area neighborhoods most affected by violent crime are taking action. Community pride and engagement efforts in Milwaukee’s Amani neighborhood are showing signs of promise for long-term crime reduction.
[in-text-ad-2]
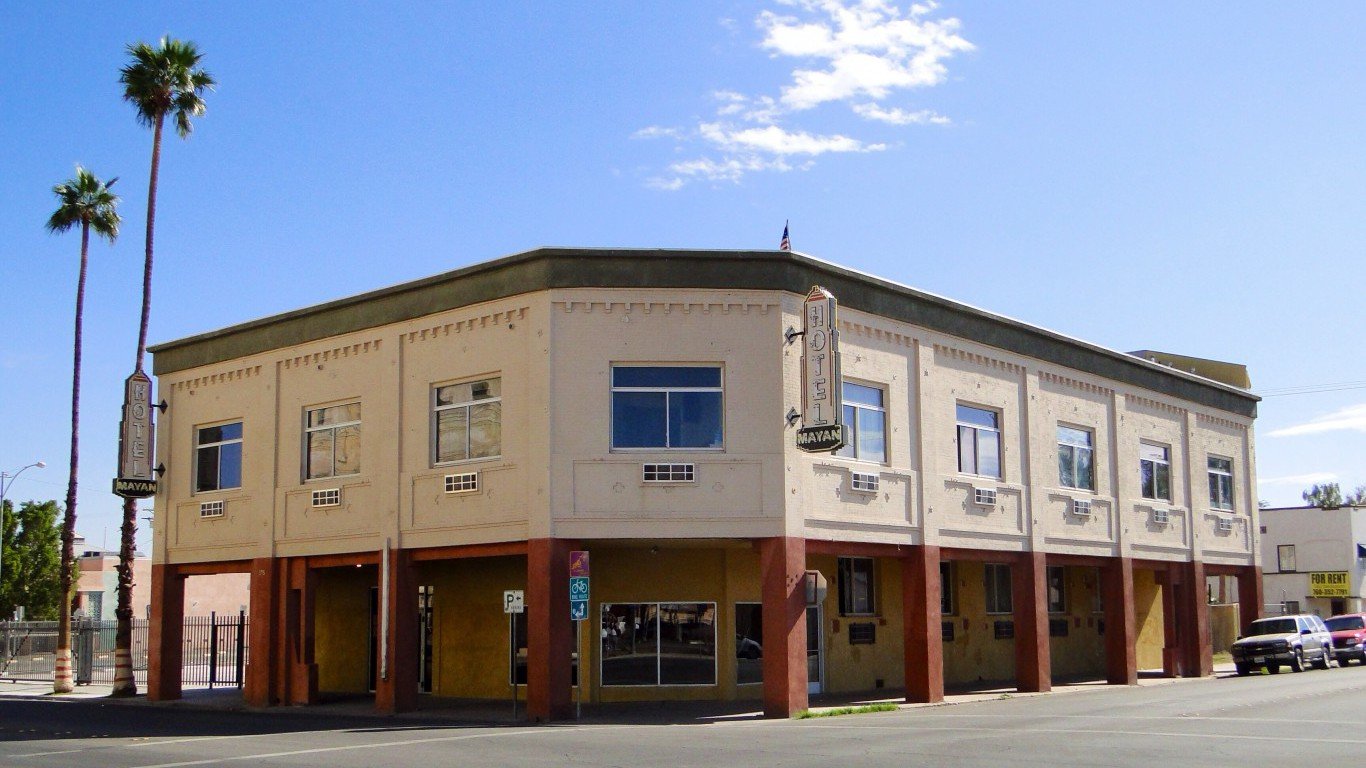
6. El Centro, CA
> 5-yr. violent crime rate change: +53.3%
> 2011 violent crime rate: 270.7 per 100,000
> 2015 violent crime rate: 414.9 per 100,000
> Murders in 2015: 2
El Centro’s violent crime rate jumped in the last five years from 271 incidents per 100,000 residents in 2011, which was comfortably below the national rate that year, to 415 incidents per 100,000 people in 2015 — now higher than the national rate.
The relationship between economic growth and crime in a given area is complicated. A depressed area with fewer opportunities for prosperity can potentially turn residents to criminal activities. At the same time, neighborhoods with high crime can deter economic development. In El Centro, more than one in every five members of the labor force are unemployed, by far the highest unemployment rate in the country. Also, roughly 25% of area residents live in poverty, far higher than the national poverty rate of 14.7%.

5. Odessa, TX
> 5-yr. violent crime rate change: +57.6%
> 2011 violent crime rate: 679.2 per 100,000
> 2015 violent crime rate: 1070.1 per 100,000
> Murders in 2015: 12
The violent crime rate in Odessa, Texas has spiked by 57.6% in the past half decade. Today, the metro area is one of only three nationwide where the violent crime rate exceeds 1,000 incidents per 100,000 residents annually. As is the case in nearly every U.S. city, aggravated assault is the most common violent crime reported in Odessa. However, unlike almost every other U.S. metro area, Odessa’s aggravated assault rate of 880.5 incidents per 100,000 is nearly four times the corresponding national rate.
Unlike the majority of cities with a sharp five-year spike in violent crime, Odessa’s population is booming. The West Texas metro area’s population has grown by 13.8% since 2011, the largest increase of any metro area examined.
[in-text-ad]

4. San Luis Obispo-Paso Robles-Arroyo Grande, CA (mike) done
> 5-yr. violent crime rate change: +61.8%
> 2011 violent crime rate: 249.3 per 100,000
> 2015 violent crime rate: 403.3 per 100,000
> Murders in 2015: 3
San Luis Obispo’s violent crime rate rose by more than 60% over the last five years, but not all forms of violence in the area increased. The number of murders in the region fell from five to three, or a murder rate of just 1.1 per 100,000 residents — one of the lowest in the country. Similarly, the rate of robberies in the area fell to just 27 per 100,000 people, about one-quarter of the national rate.
However, the rate of aggravated assault roughly doubled to 346 incidents per 100,000 residents, compared to a national rate of 238 aggravated assaults per 100,000 people.
[recirclink id=375722]

3. Sioux Falls, SD
> 5-yr. violent crime rate change: +69.1%
> 2011 violent crime rate: 215.1 per 100,000
> 2015 violent crime rate: 363.7 per 100,000
> Murders in 2015: 3
Between 2011 and 2015, the violent crime rate in Sioux Falls rose from 215 incidents per 100,000 residents to 364 per 100,000. The number of aggravated assaults in the metro area more than doubled from 288 to 679 incidents. While violent crime levels are often greater in areas with high unemployment and poverty, the typical Sioux Falls household earns roughly $4,000 more than the typical American household, and the metro area’s unemployment rate has fallen over the last five years to 3.3% — far less than the national figure of 4.7%.
According to the Sioux Falls Police Department, the rise in crime is largely due to the city’s growing drug problem. The number of total police calls and drug seizures by Sioux Falls police has increased rapidly in recent years, with the amount of seized meth quadrupling from 9.8 pounds to 38.0 pounds from 2015 to 2016.

2. Missoula, MT
> 5-yr. violent crime rate change: +69.9%
> 2011 violent crime rate: 250.3 per 100,000
> 2015 violent crime rate: 425.2 per 100,000
> Murders in 2015: 4
Missoula, Montana is no longer the safe city it once was. Just five years ago, the metro area’s violent crime rate of 250 incidents per 100,000 residents trailed the national rate of 387 incidents per 100,000 people. Since then, the violent crime rate has climbed to 425 incidents per 100,000 residents, a 69.9% spike, and it is now considerably higher than the comparable national rate of 373 incidents per 100,000 people.
Some crime in the metro area has likely been drug related. Recently, federal law enforcement officials busted a methamphetamine trafficking ring in the metro area following a two year investigation. In addition to 11 pounds of methamphetamine, federal agents confiscated nearly 70 weapons, including grenade launchers and assault rifles, as well as illegal silencers and thousands of rounds of ammunition.
[in-text-ad-2]

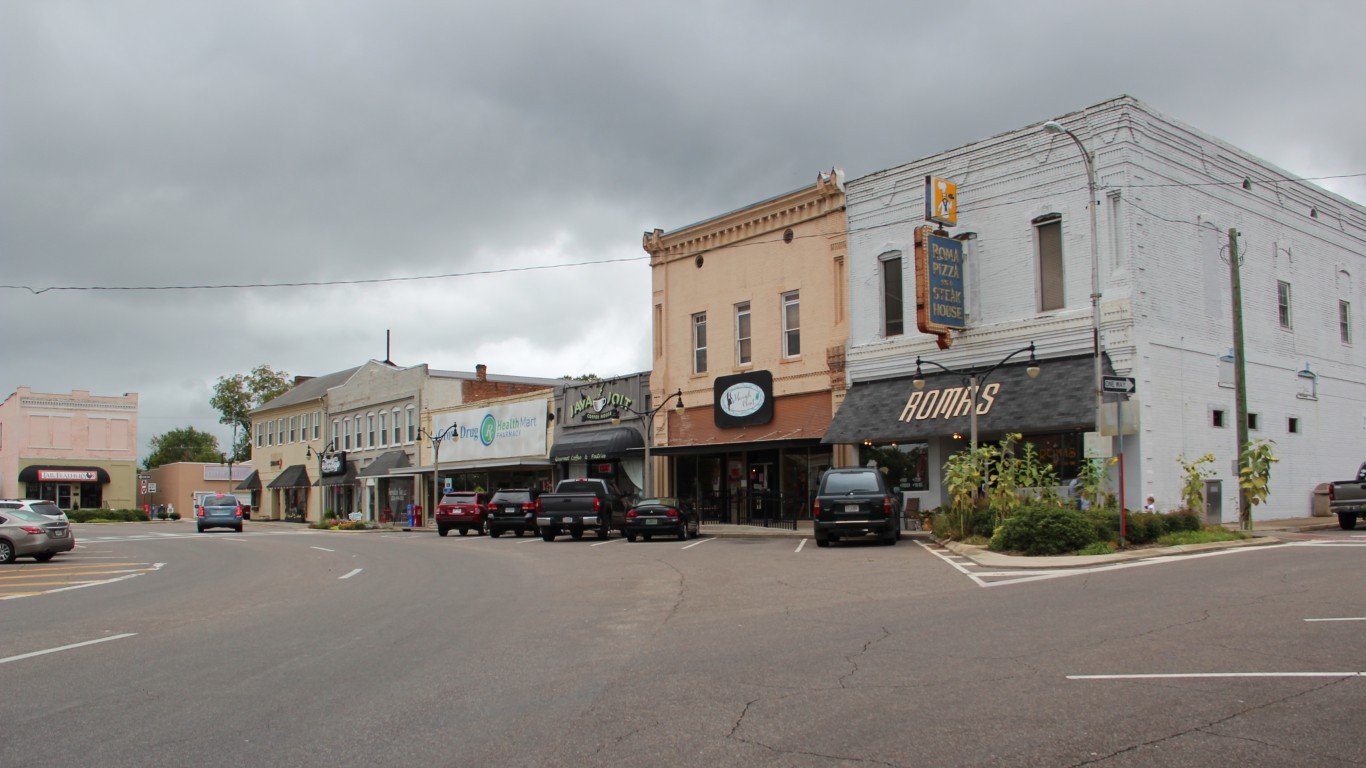
1. Monroe, LA
> 5-yr. violent crime rate change: +81.3%
> 2011 violent crime rate: 639.7 per 100,000
> 2015 violent crime rate: 1,160.0 per 100,000
> Murders in 2015: 27
The incidence of violent crime in Monroe spiked 81.3%, faster than in any other U.S. metropolitan area over the last five years, rising to the highest violent crime rate nationwide. A nation-leading 1,160 violent crimes were reported per 100,000 area residents in 2015, up from 640 per 100,000 in 2011.
The presence of crime can create an environment of instability and uncertainty that is unlikely to attract businesses or enable them to thrive. On the other side of the equation, the lack of job opportunities or high-paying positions in a city with a lagging economy may increase the likelihood of criminal activity. In Monroe, an estimated 23.9% of residents live in poverty, one of the largest poverty rates of any city. While five years ago Monroe’s unemployment rate was below the nationwide jobless rate, today the metro area’s 6.2% unemployment rate is higher than the 4.7% national rate.
Contact [email protected] for any questions or corrections.