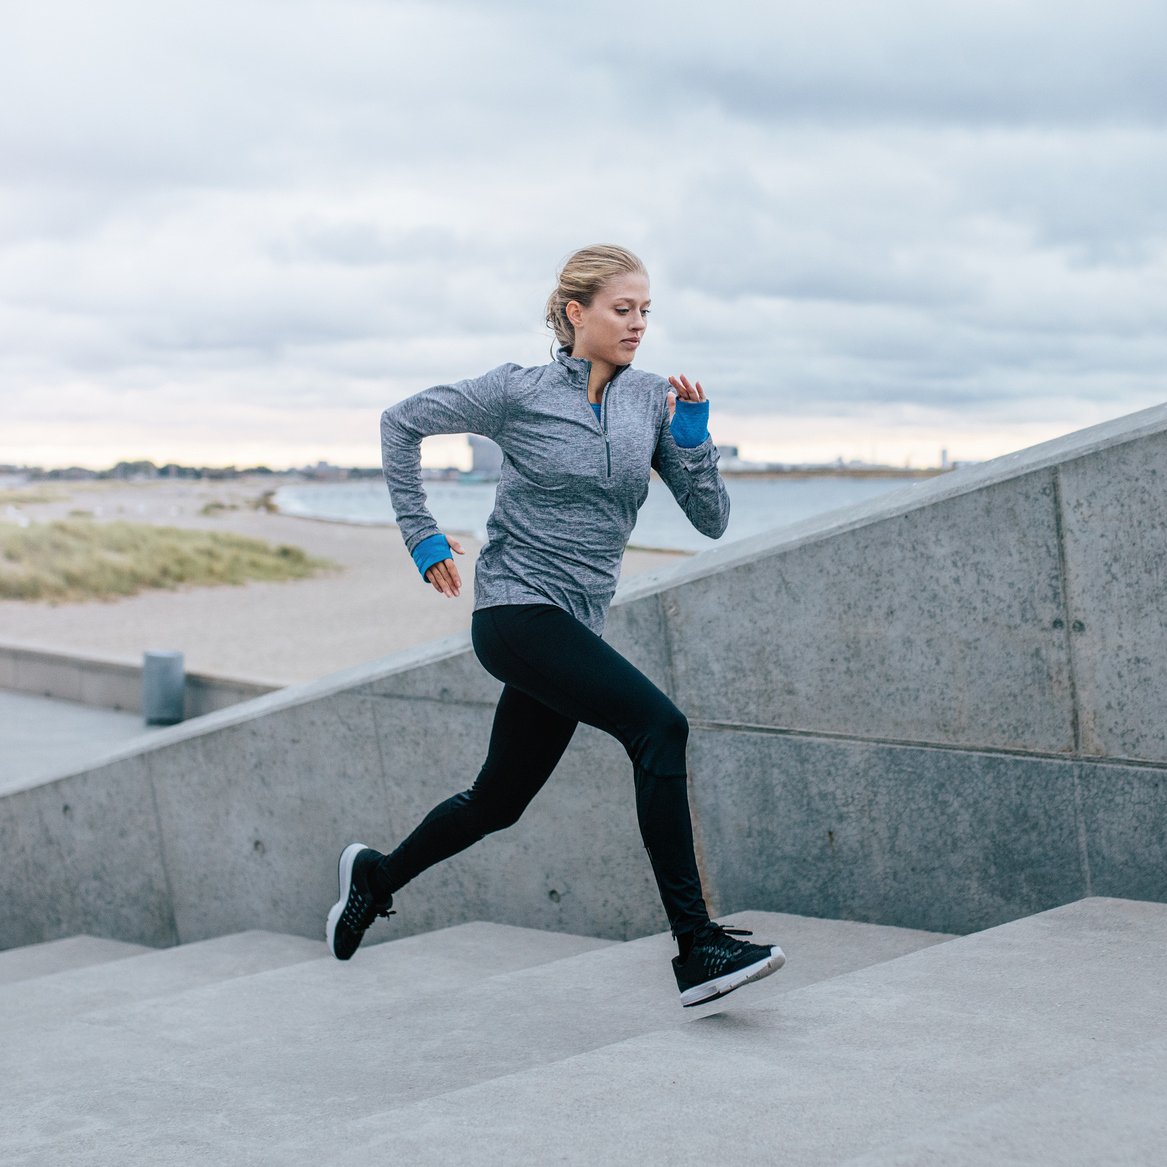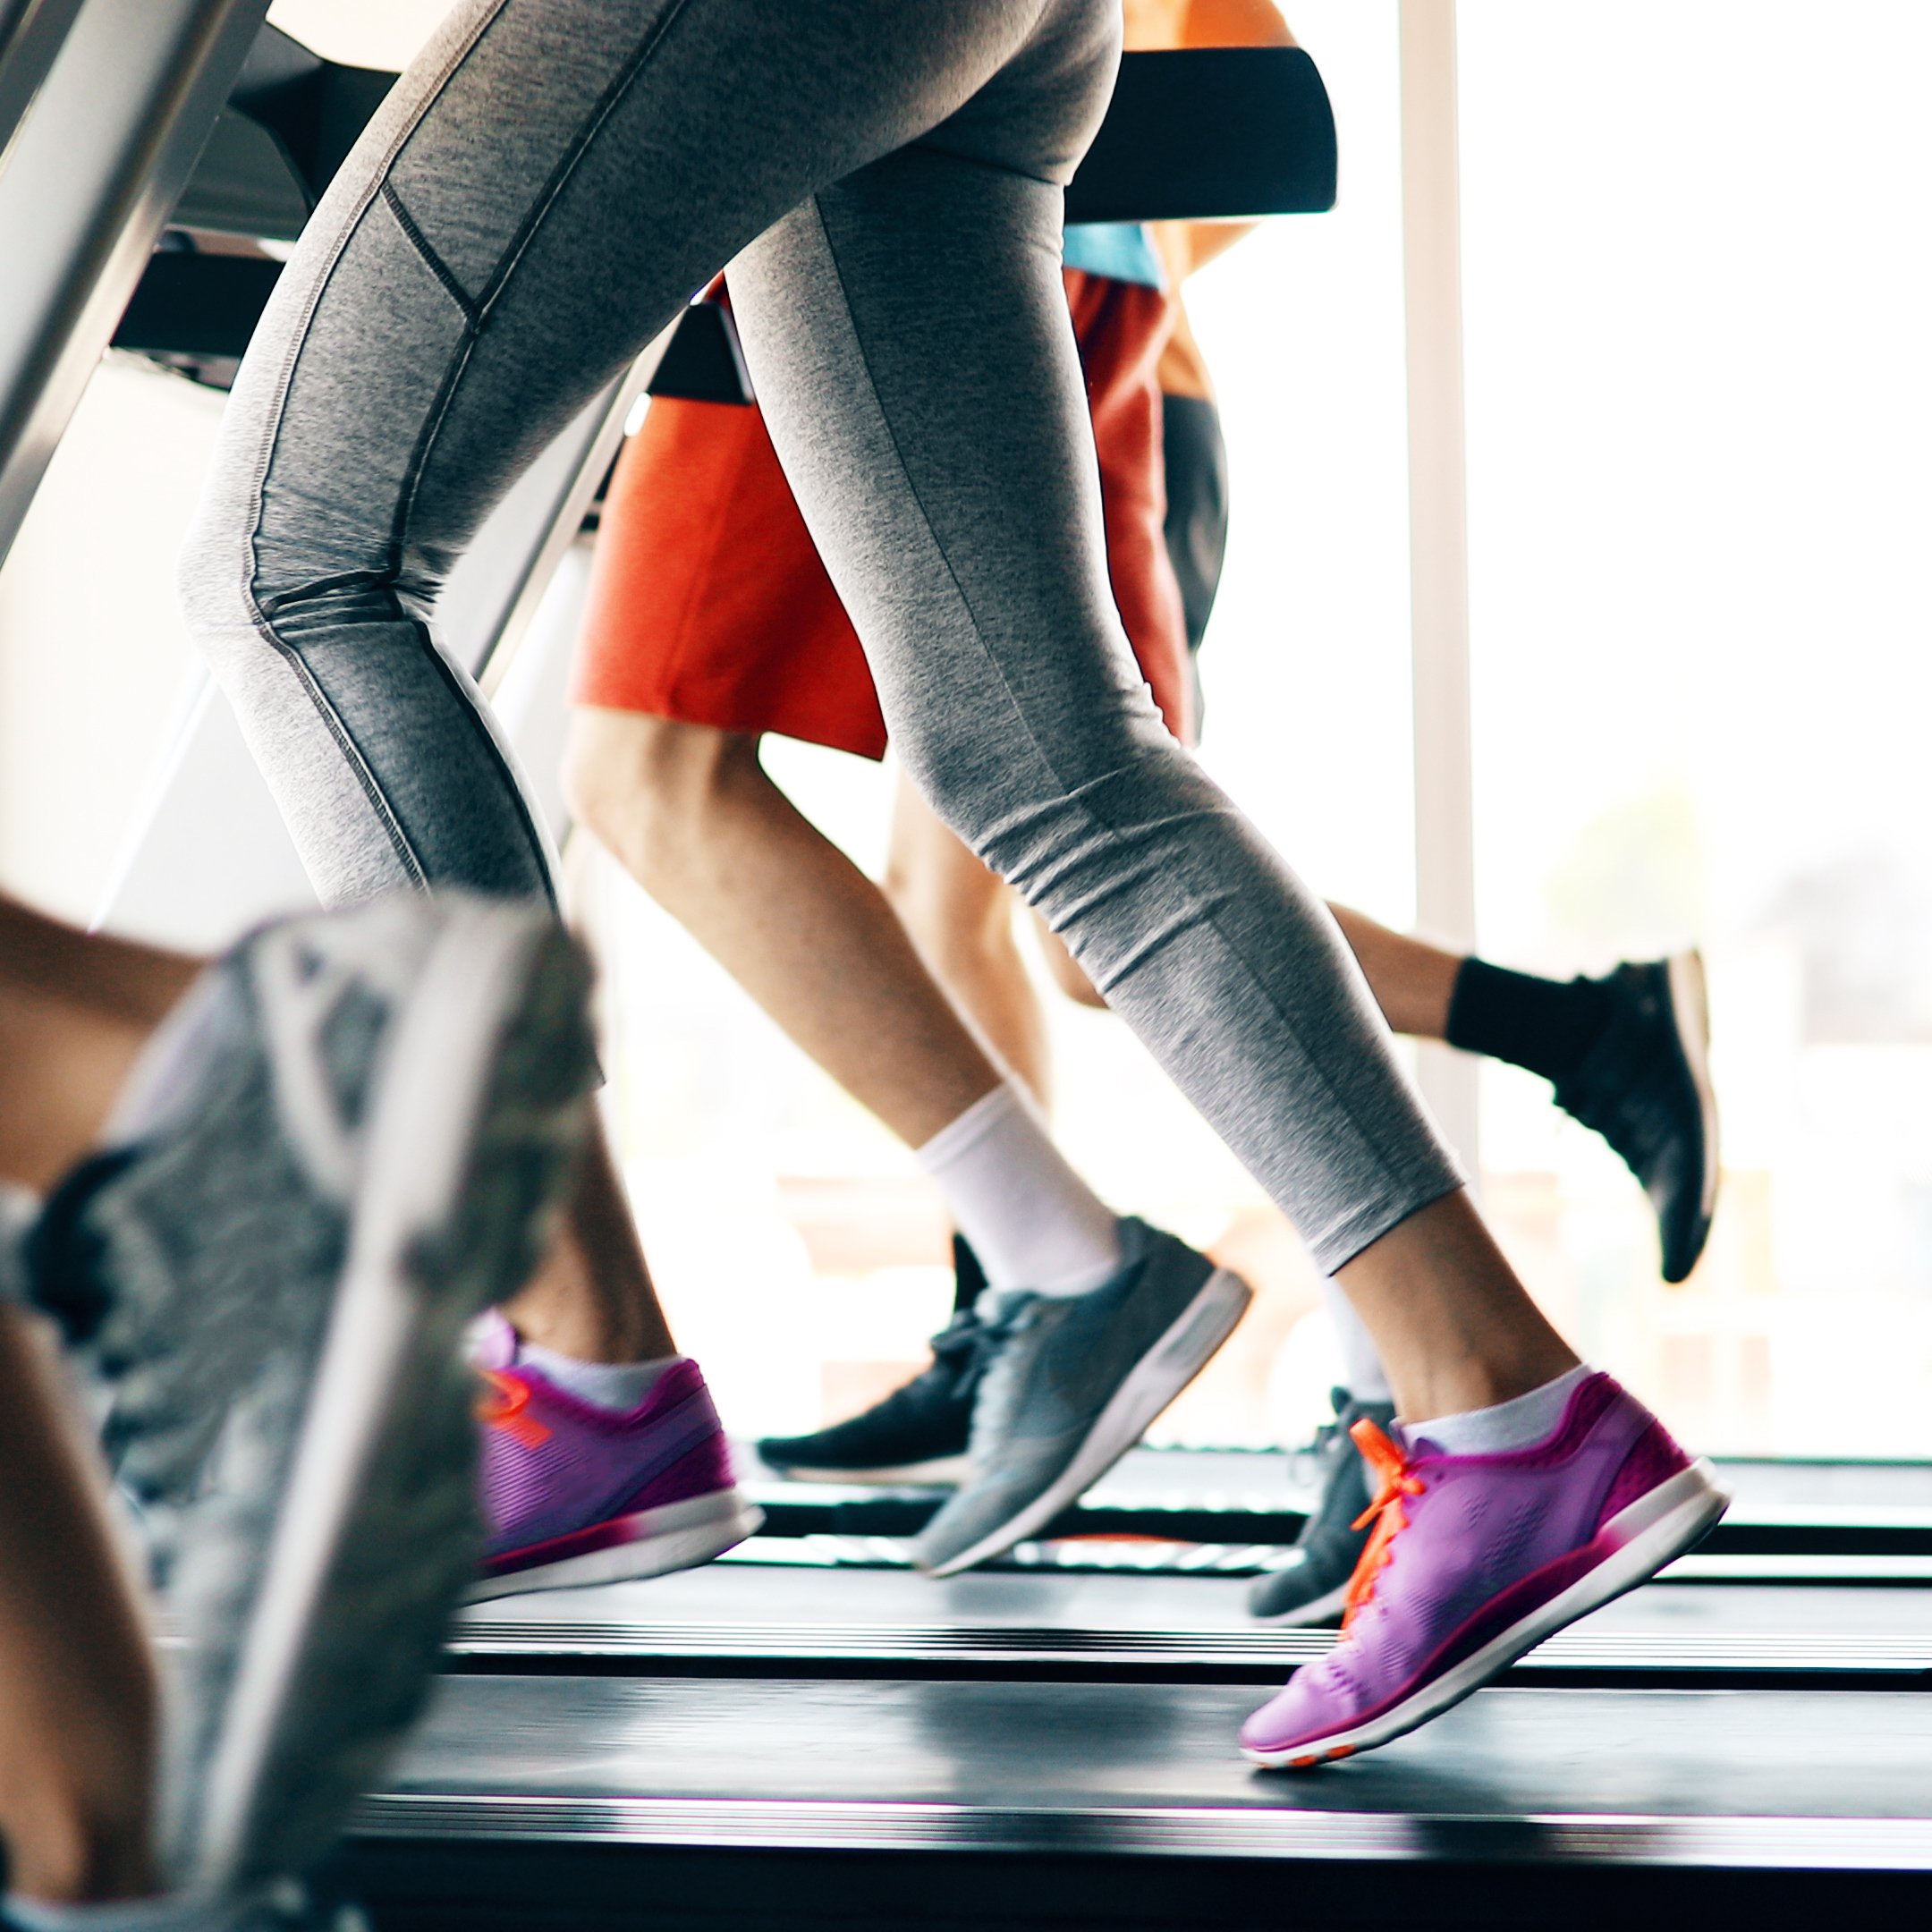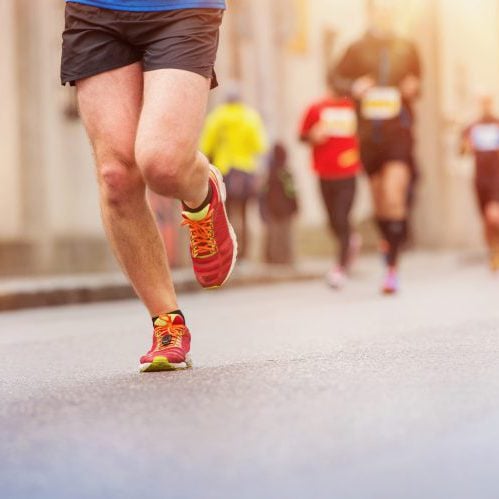
[cnxvideo id=”620993″ placement=”ros”]Only about one in five adults meet the federal guidelines for both aerobic and strength-focused exercise. Perhaps even more concerning, nearly one in four Americans fail to get any exercise whatsoever outside of work.
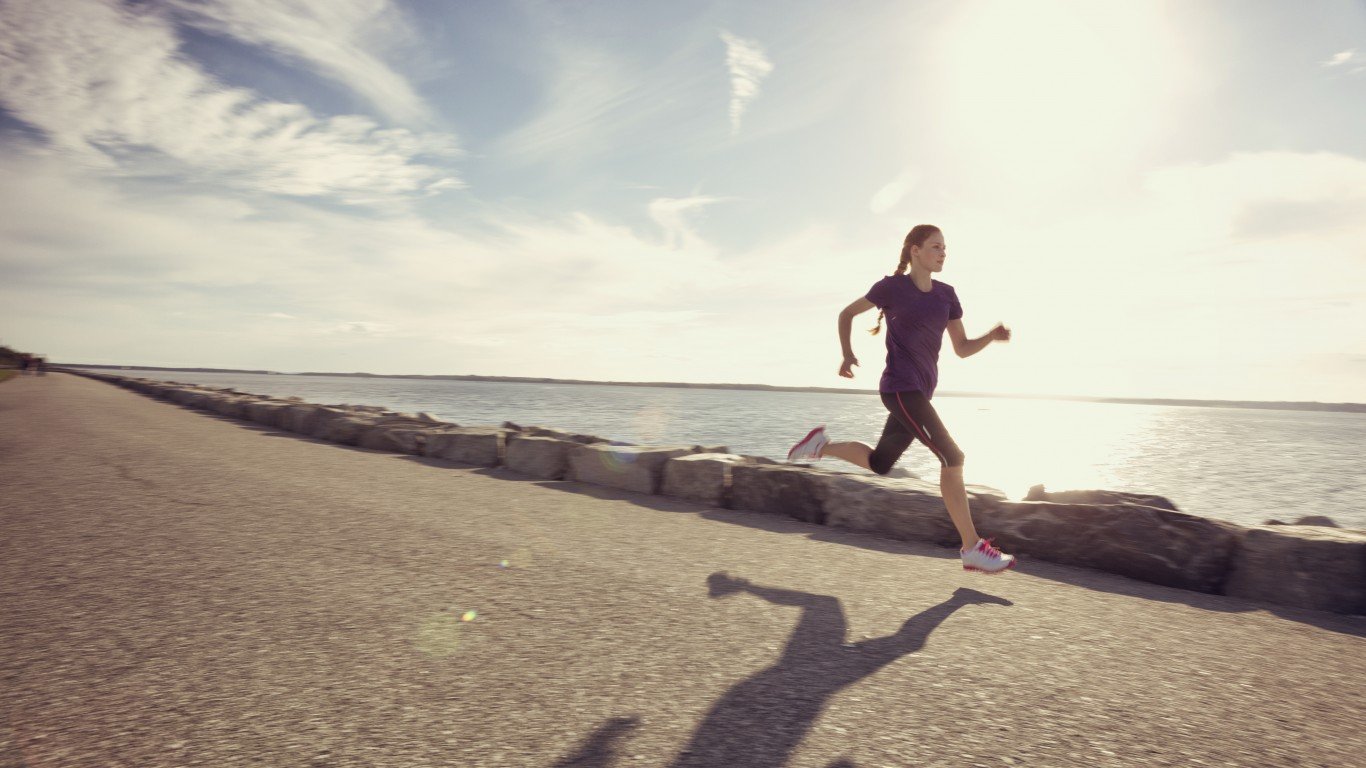
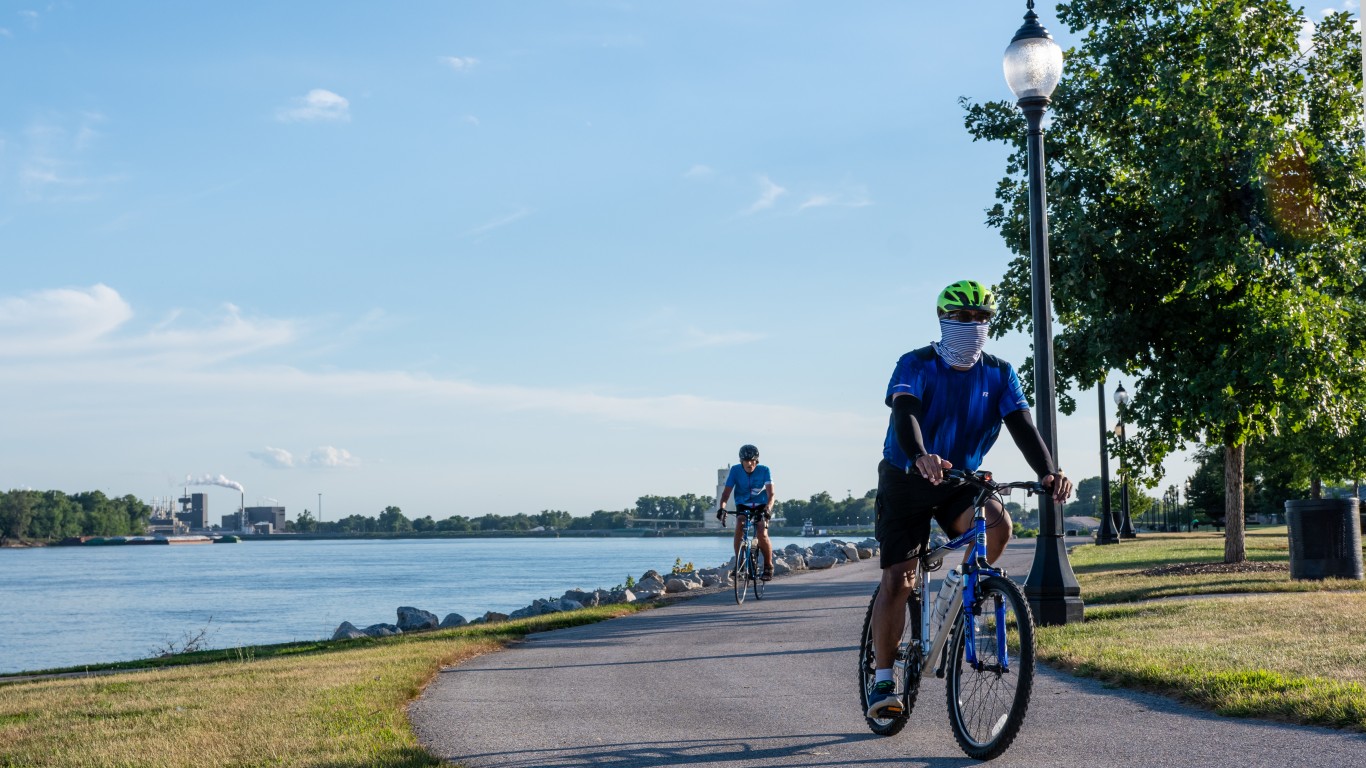
In some areas, residents tend to be more physically active than in others. In these cities, residents have greater access to gyms, recreation centers, and parks. Further, people in these cities take advantage of these many opportunities to stay active. To determine the American cities getting the most exercise, 24/7 Wall St. created an index based on two measures — the share of adults in a metro area who are physically active during their leisure time, and the share of the population that has access to areas for physical activities outside of their homes.
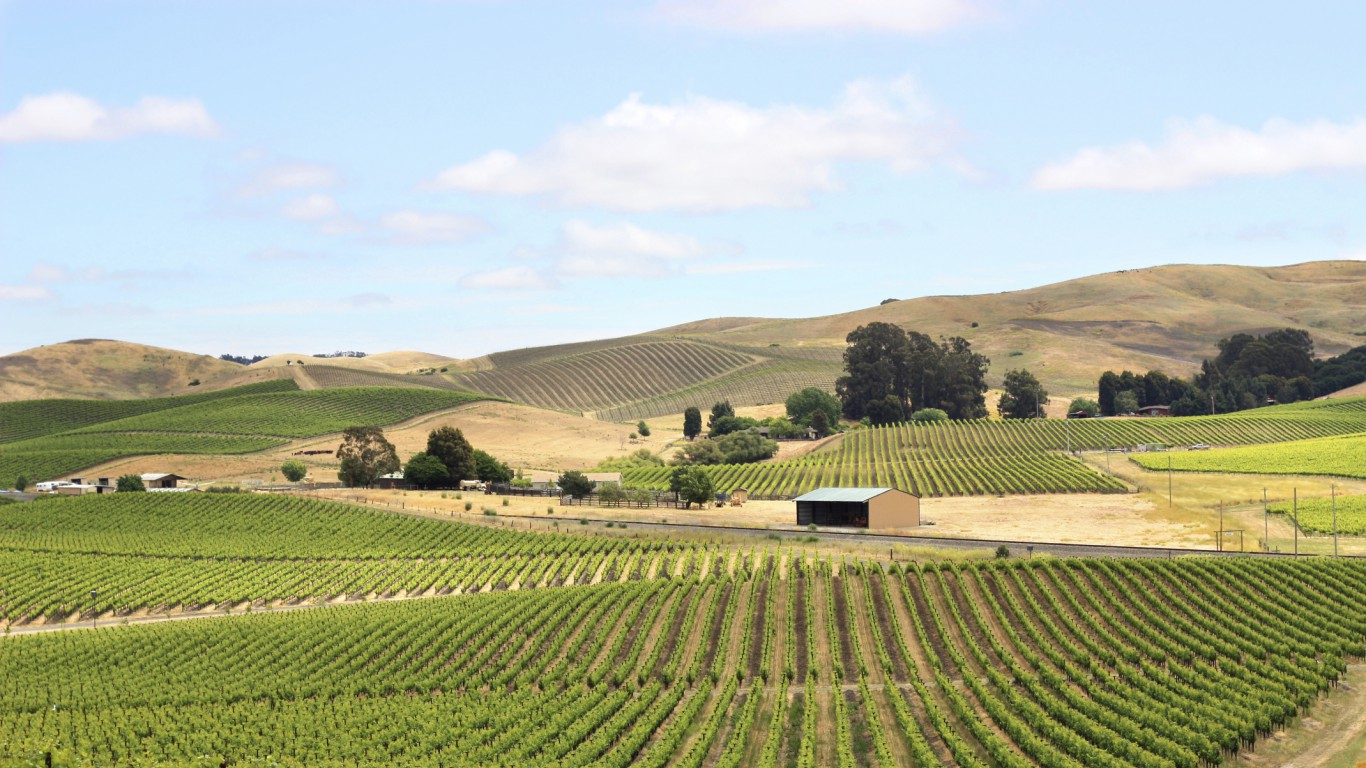
Residents of Southern states are typically less active than residents in other regions. Of the 50 American cities getting the most exercise, only three are located in Southern states. At the same time, 41 of the 50 cities getting the least exercise are in the South. Residents of Western states tend to get the most exercise, and cities located in Western states account for 37 of the 50 cities on this list.
Click here to see the cities getting the most exercise.
When there are fewer barriers to being physically active, more people tend to exercise. In Boulder, which ranks first on our list, more than 97.7% of the Colorado city’s population are within a 5-10 minutes commute from a place to exercise, compared to the 84% of adults nationwide. In Boulder, 90.6% of adults spend some of their leisure time being physically active, a larger share than in any other metropolitan area, and well above the national share of 77%. Of the 50 cities with the highest share of physically active adults, 39 have more access to exercise opportunities than the nation.
Ultimately, a city with a lower share of sedentary adults, even if they do not fully meet the federal guidelines for exercise, tend to have better health outcomes. For example, obesity rates in areas with active adults tend to be lower than in areas with less active adults. In 44 of the 50 cities on this list, the obesity rate is lower than the national rate of 27%. In addition, residents tend to feel healthier in the cities that exercise more. The 50 cities getting the least exercise all have a higher share of adults in poor or fair health than the nationwide share of 14%. Meanwhile, the majority of cities on this list have a lower share of adults who report poor or fair health than across the country as a whole.
To determine the cities getting the most exercise, 24/7 Wall St. created an index to rank the 381 metro areas by both the share of adults who are physically active as well as the accessibility to areas of exercise. Both measures come from the 2014 County Health Rankings & Roadmaps, a collaboration between the Robert Wood Johnson Foundation and the University of Wisconsin Population Health Institute. Obesity rates — the share of residents that report a body mass index greater than or equal to 30 — as well as the percentage of adults who report fair or poor health also come from County Health Rankings.
These are the cities exercising the most.
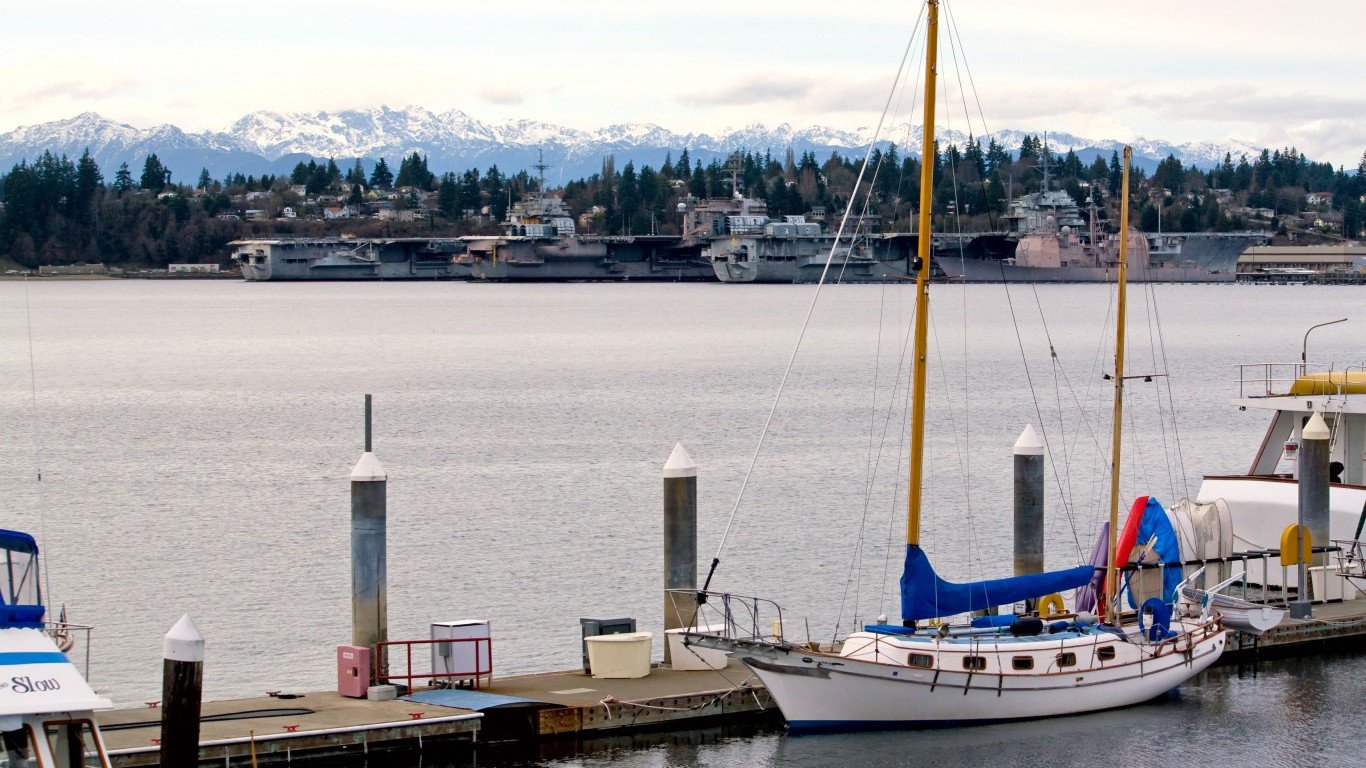
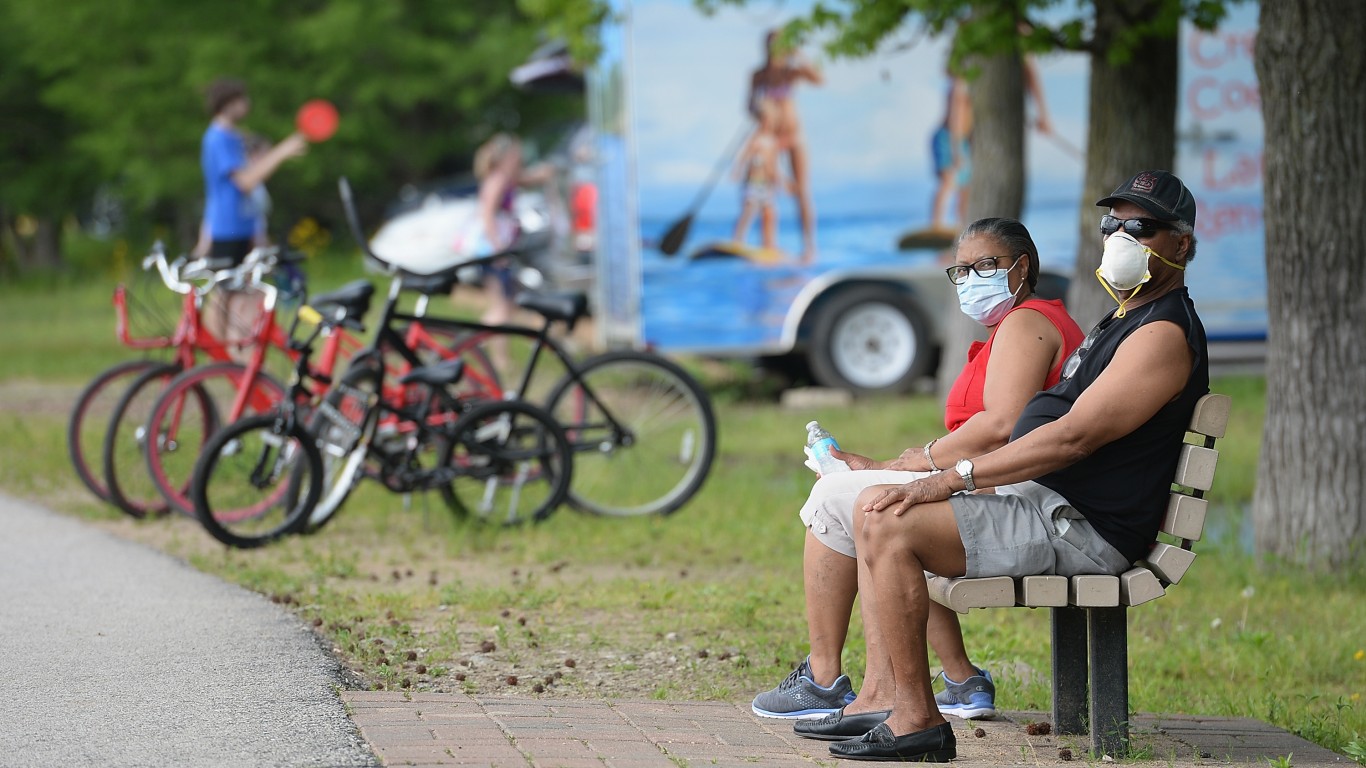
50. Bremerton-Silverdale, WA
> Physically active adults: 80.9%
> Pop. with access to exercise locations: 90.3%
> Obesity rate: 29.5%
> Adults in fair/poor health: 12.9%
[in-text-ad]
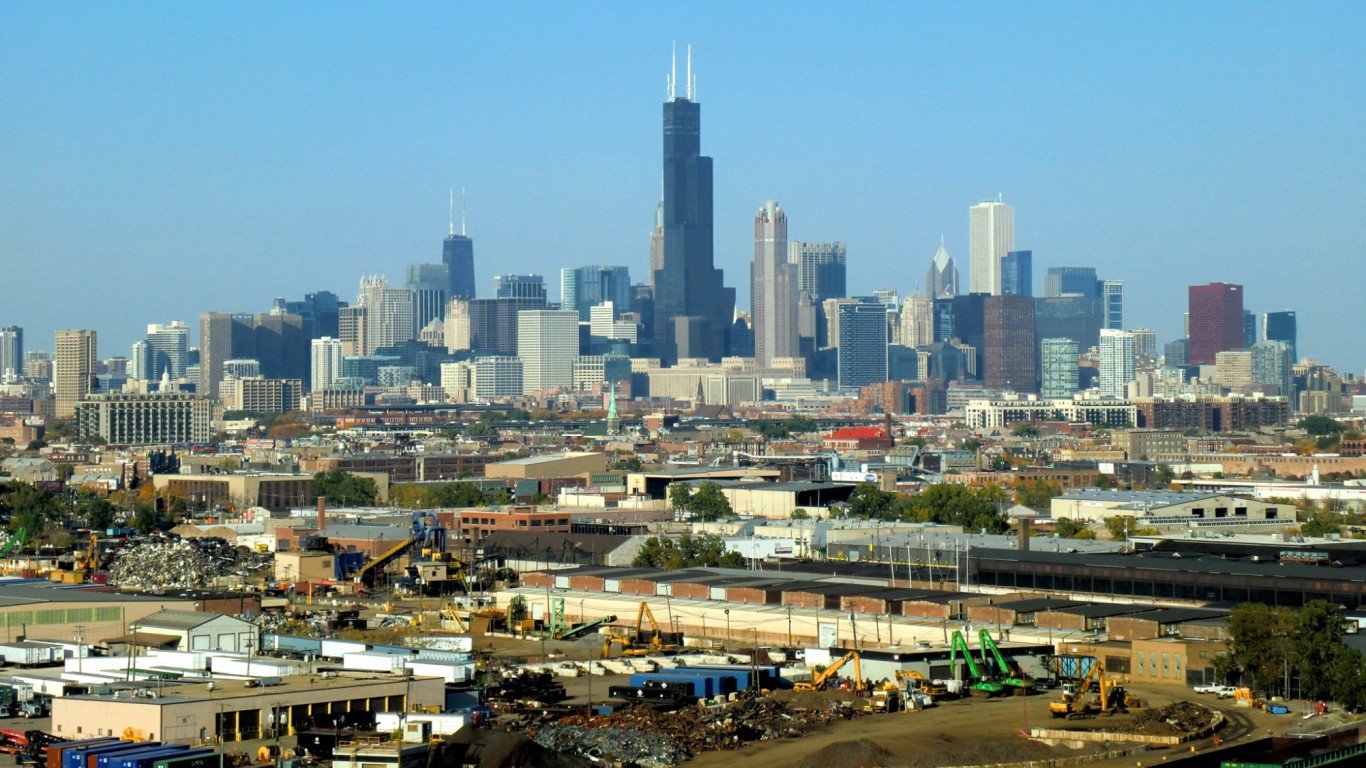
49. Chicago-Naperville-Elgin, IL-IN-WI
> Physically active adults: 79.1%
> Pop. with access to exercise locations: 96.7%
> Obesity rate: 26.4%
> Adults in fair/poor health: 15.5%
[recirclink id=376049]
48. Rochester, MN
> Physically active adults: 80.4%
> Pop. with access to exercise locations: 92.1%
> Obesity rate: 25.1%
> Adults in fair/poor health: 9.2%

47. Iowa City, IA
> Physically active adults: 82.3%
> Pop. with access to exercise locations: 86.6%
> Obesity rate: 23.7%
> Adults in fair/poor health: 11.8%
[in-text-ad-2]

46. Salem, OR
> Physically active adults: 83.3%
> Pop. with access to exercise locations: 84.9%
> Obesity rate: 33.4%
> Adults in fair/poor health: 15.1%
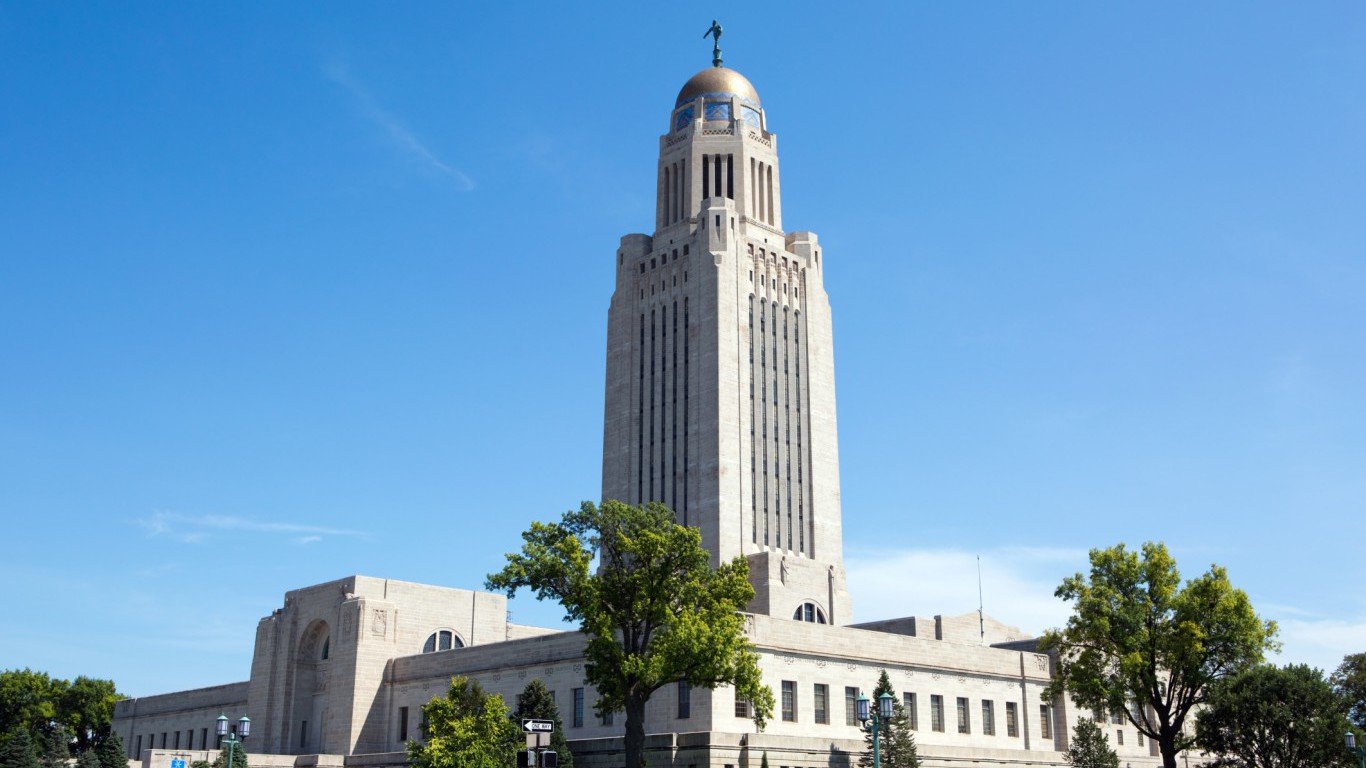
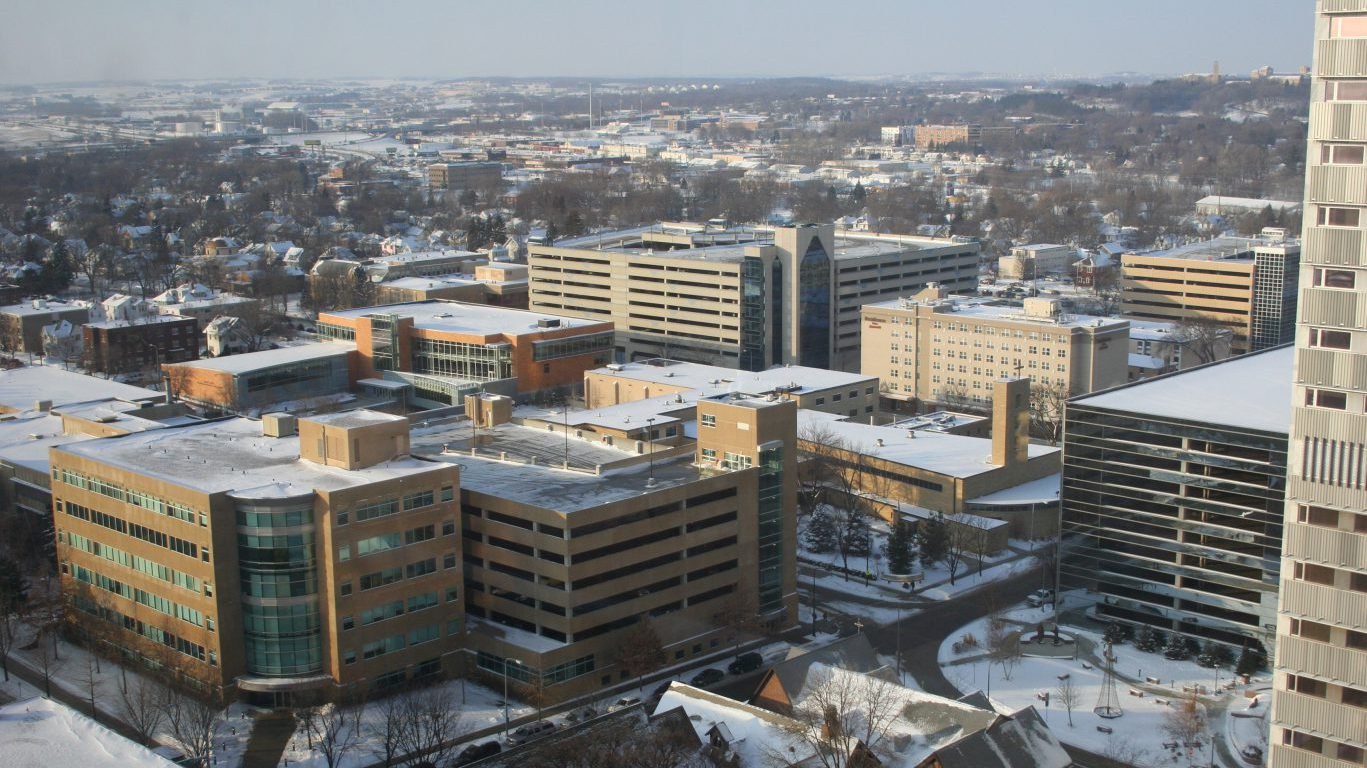
45. Lincoln, NE
> Physically active adults: 80.7%
> Pop. with access to exercise locations: 93.0%
> Obesity rate: 26.3%
> Adults in fair/poor health: 9.9%
[in-text-ad]
44. Riverside-San Bernardino-Ontario, CA
> Physically active adults: 81.5%
> Pop. with access to exercise locations: 90.6%
> Obesity rate: 27.0%
> Adults in fair/poor health: 19.3%
[recirclink id=377173]
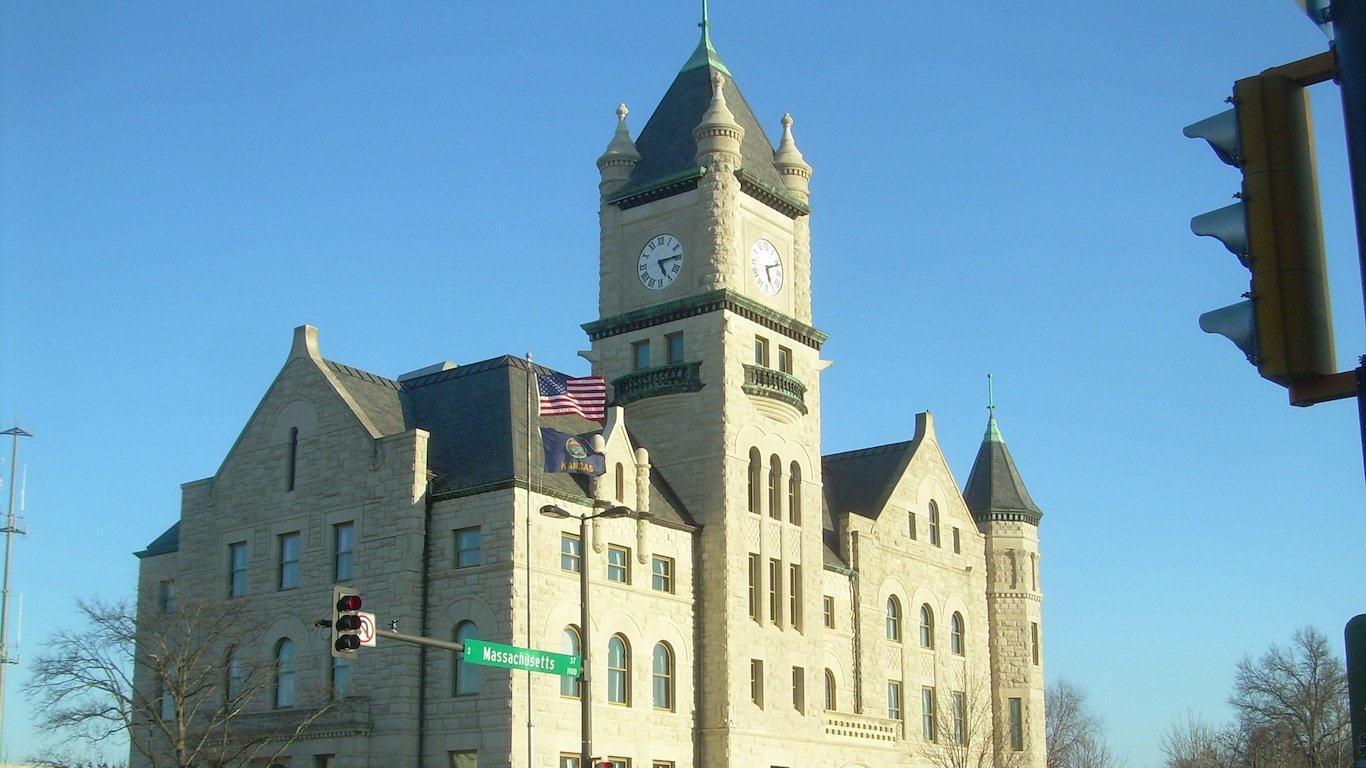
43. Lawrence, KS
> Physically active adults: 81.3%
> Pop. with access to exercise locations: 91.3%
> Obesity rate: 23.3%
> Adults in fair/poor health: 12.4%
42. Bridgeport-Stamford-Norwalk, CT
> Physically active adults: 79.7%
> Pop. with access to exercise locations: 96.8%
> Obesity rate: 20.8%
> Adults in fair/poor health: 11.8%
[in-text-ad-2]

41. Salinas, CA
> Physically active adults: 83.2%
> Pop. with access to exercise locations: 87.2%
> Obesity rate: 23.7%
> Adults in fair/poor health: 19.9%

40. Barnstable Town, MA
> Physically active adults: 82.8%
> Pop. with access to exercise locations: 88.5%
> Obesity rate: 19.7%
> Adults in fair/poor health: 9.2%
[in-text-ad]
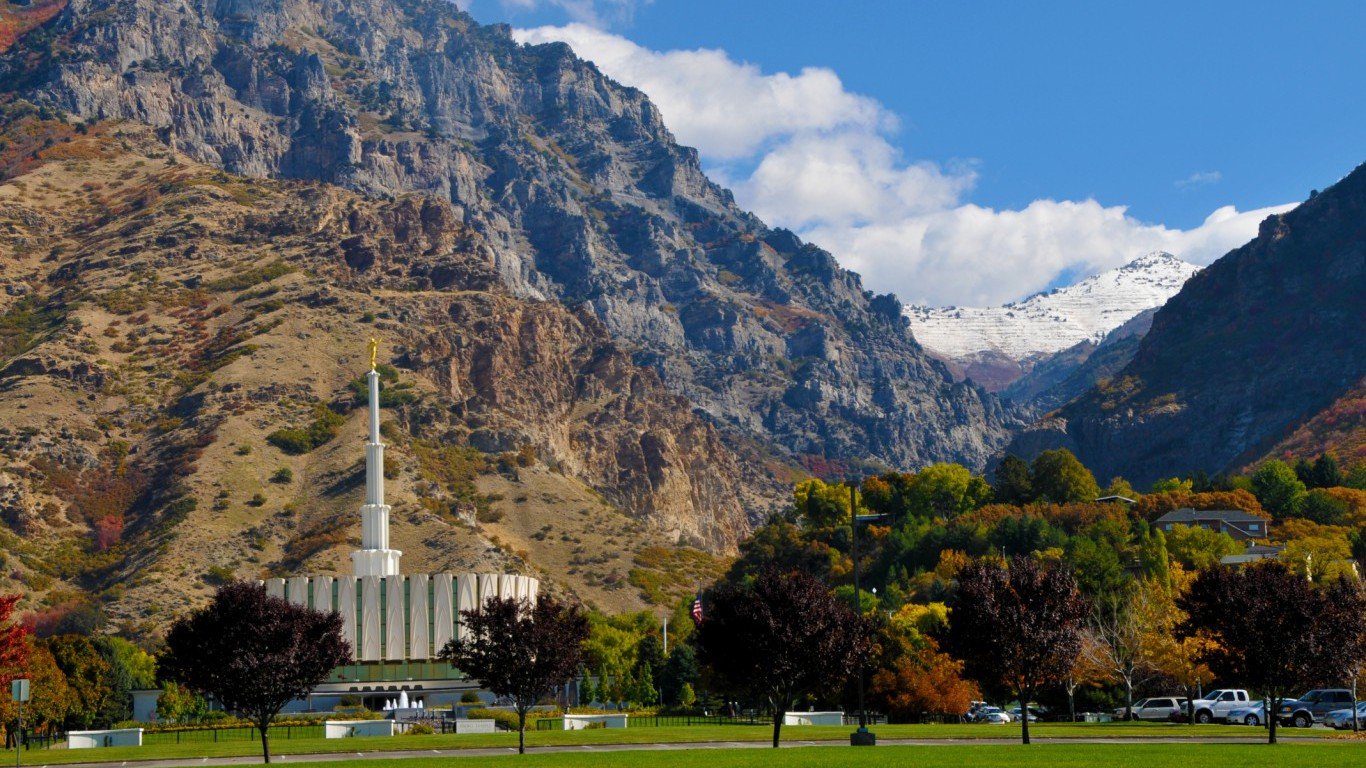
39. Provo-Orem, UT
> Physically active adults: 84.7%
> Pop. with access to exercise locations: 83.9%
> Obesity rate: 23.3%
> Adults in fair/poor health: 11.8%
[recirclink id=375722]
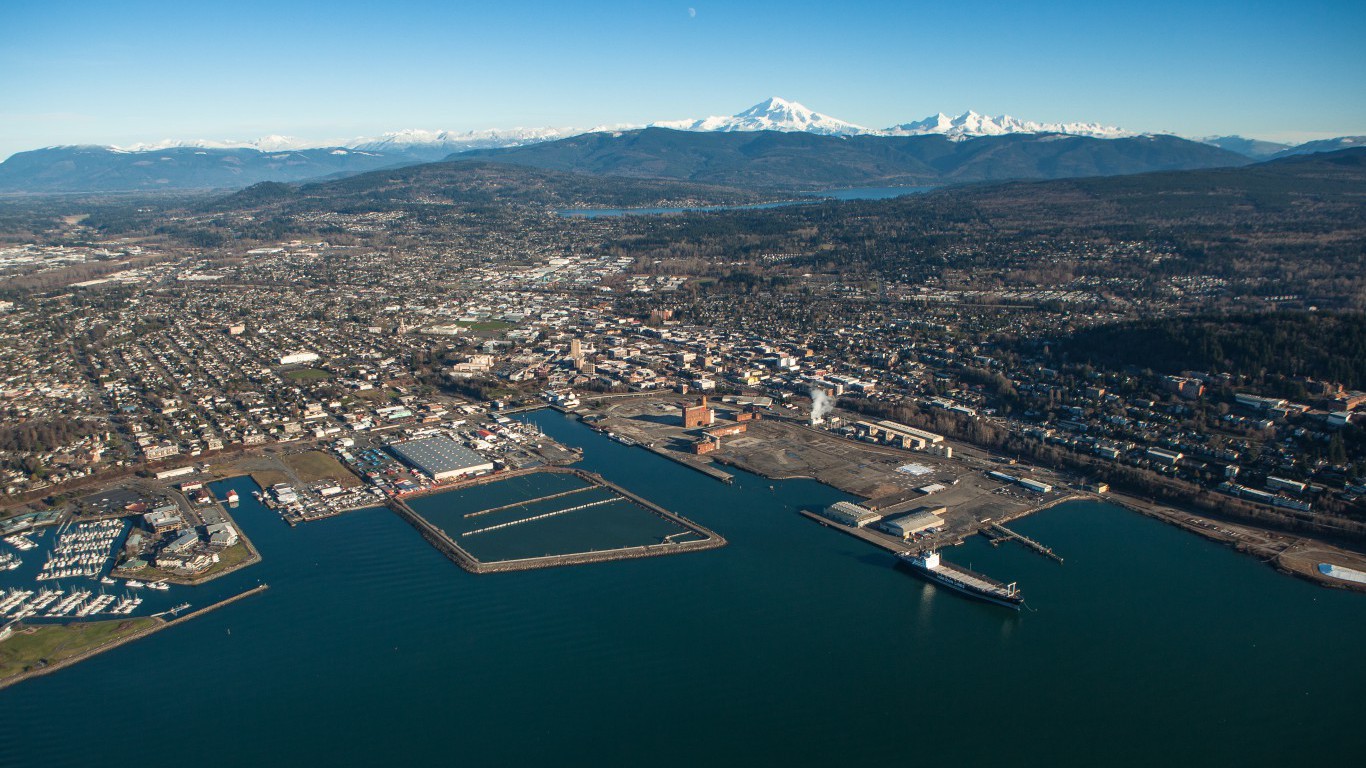
38. Bellingham, WA
> Physically active adults: 83.7%
> Pop. with access to exercise locations: 87.0%
> Obesity rate: 23.3%
> Adults in fair/poor health: 13.7%
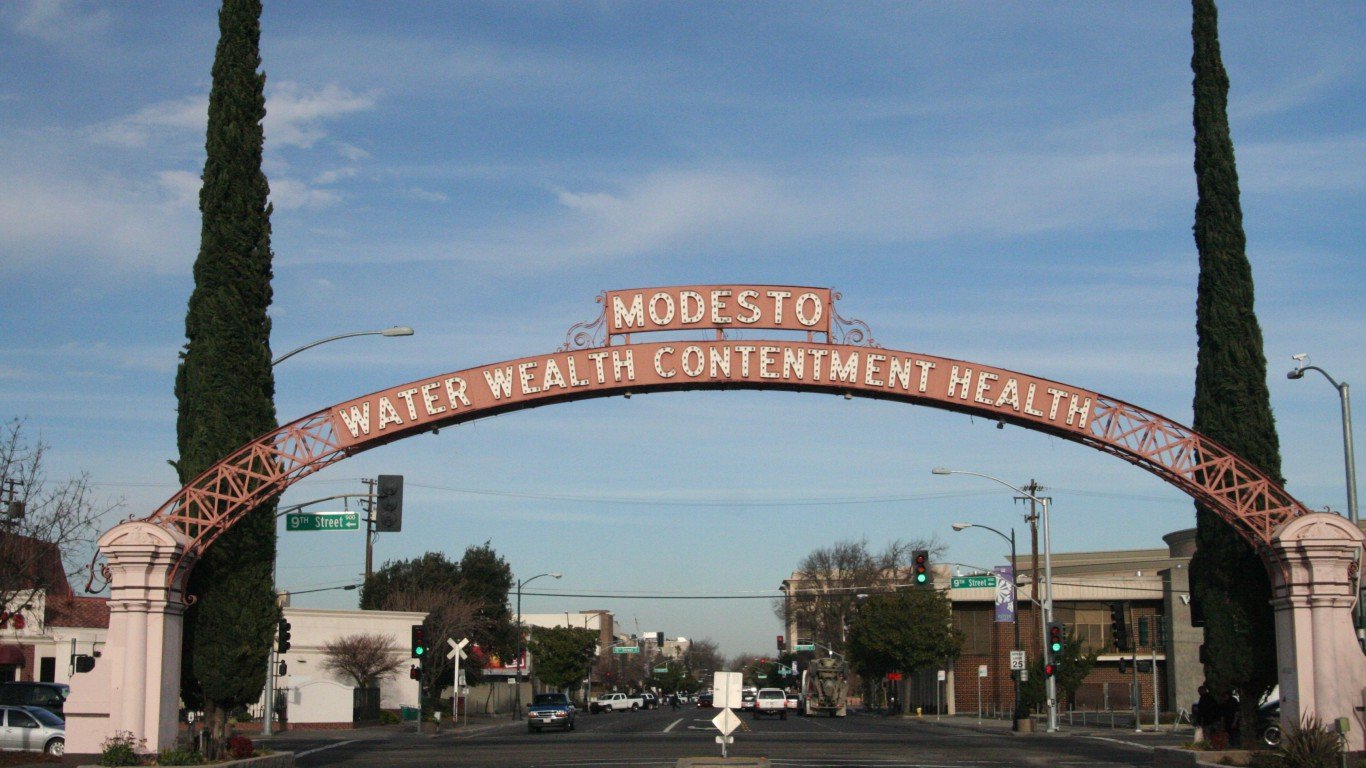
37. Modesto, CA
> Physically active adults: 81.7%
> Pop. with access to exercise locations: 92.7%
> Obesity rate: 32.4%
> Adults in fair/poor health: 20.2%
[in-text-ad-2]
36. Olympia-Tumwater, WA
> Physically active adults: 82.8%
> Pop. with access to exercise locations: 89.5%
> Obesity rate: 28.6%
> Adults in fair/poor health: 12.6%
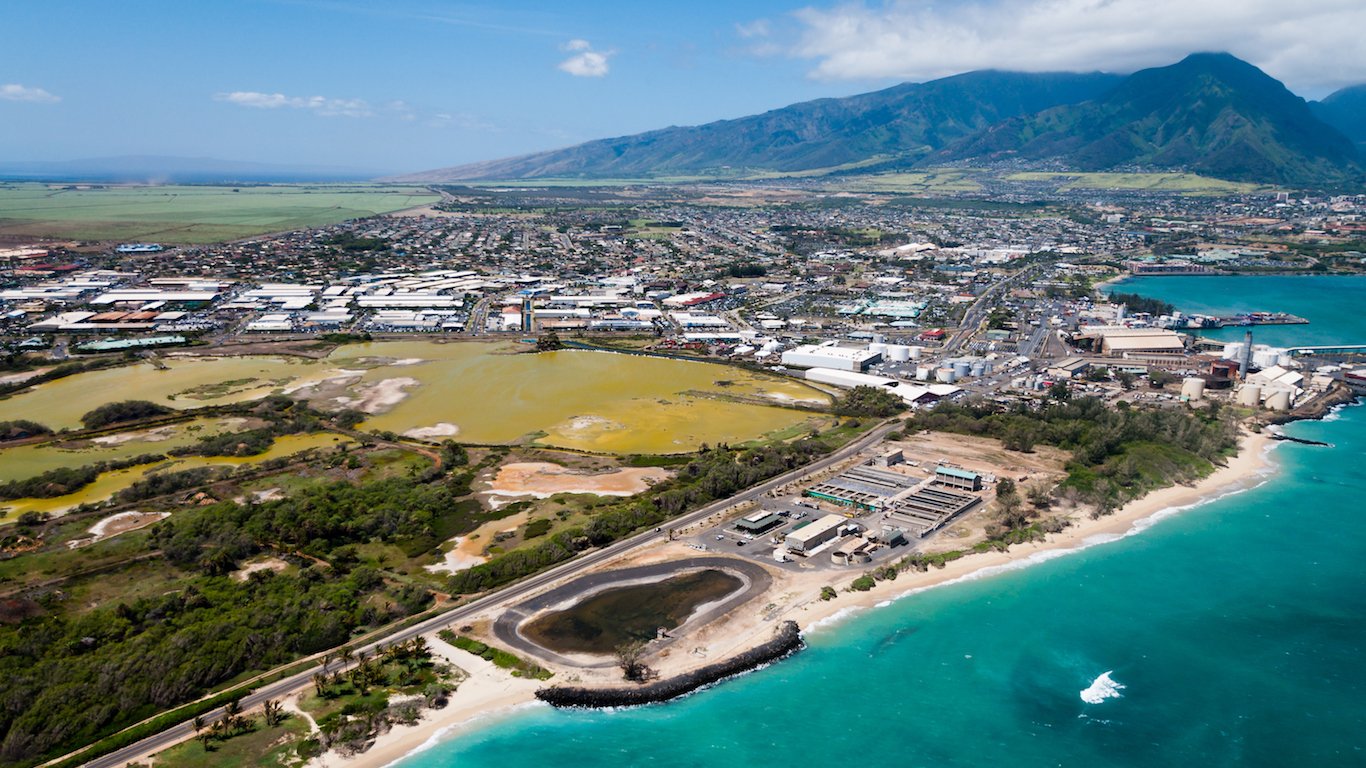
35. Kahului-Wailuku-Lahaina, HI
> Physically active adults: 81.4%
> Pop. with access to exercise locations: 93.7%
> Obesity rate: 22.4%
> Adults in fair/poor health: 12.6%
[in-text-ad]
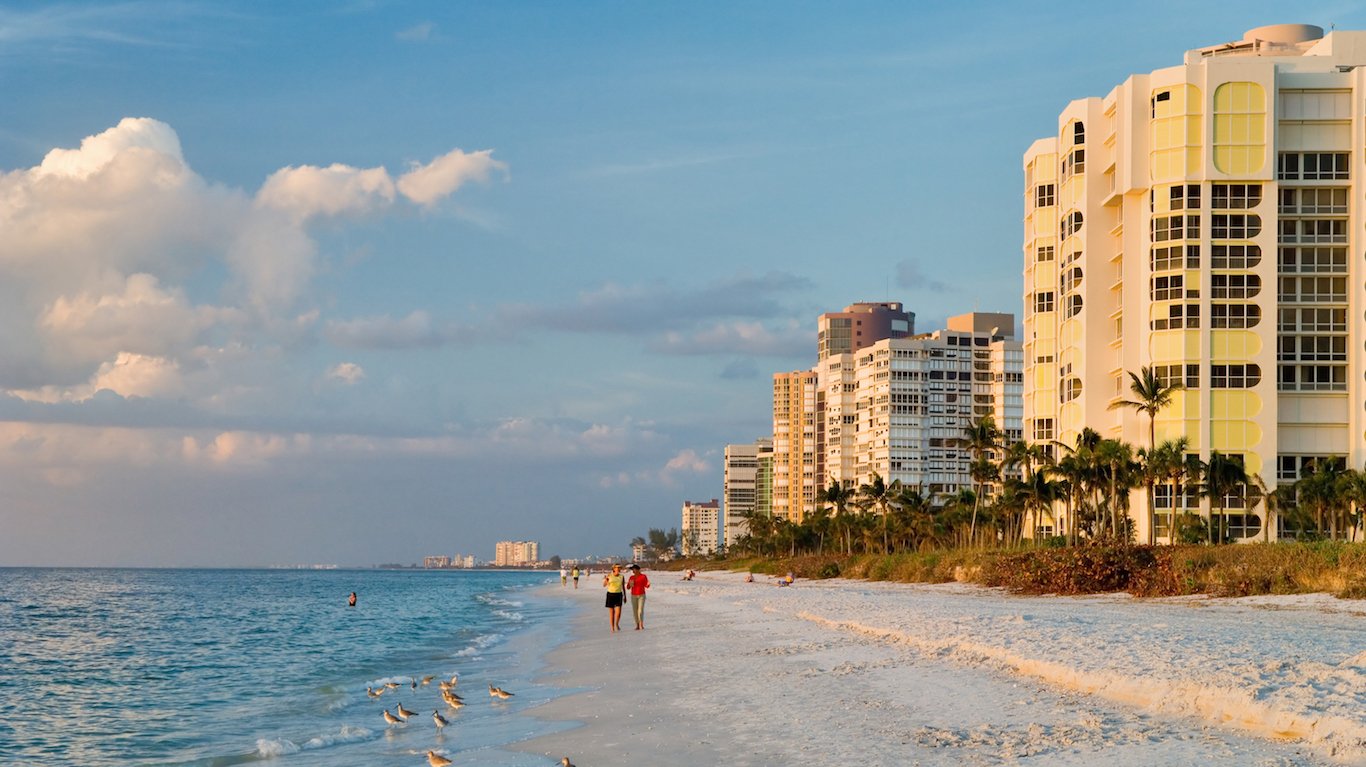
34. Naples-Immokalee-Marco Island, FL
> Physically active adults: 82.2%
> Pop. with access to exercise locations: 91.3%
> Obesity rate: 18.8%
> Adults in fair/poor health: 16.4%
[recirclink id=377173]
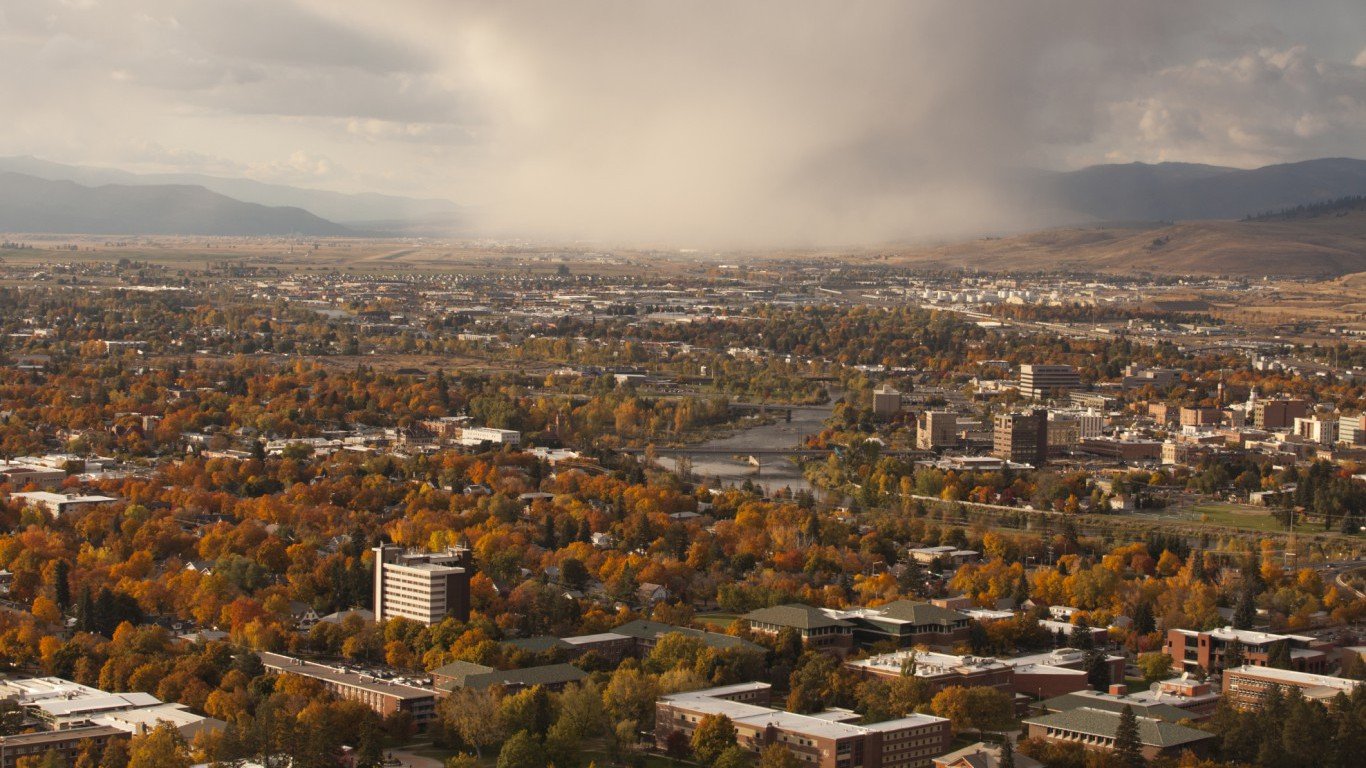
33. Missoula, MT
> Physically active adults: 83.0%
> Pop. with access to exercise locations: 89.1%
> Obesity rate: 21.4%
> Adults in fair/poor health: 13.4%
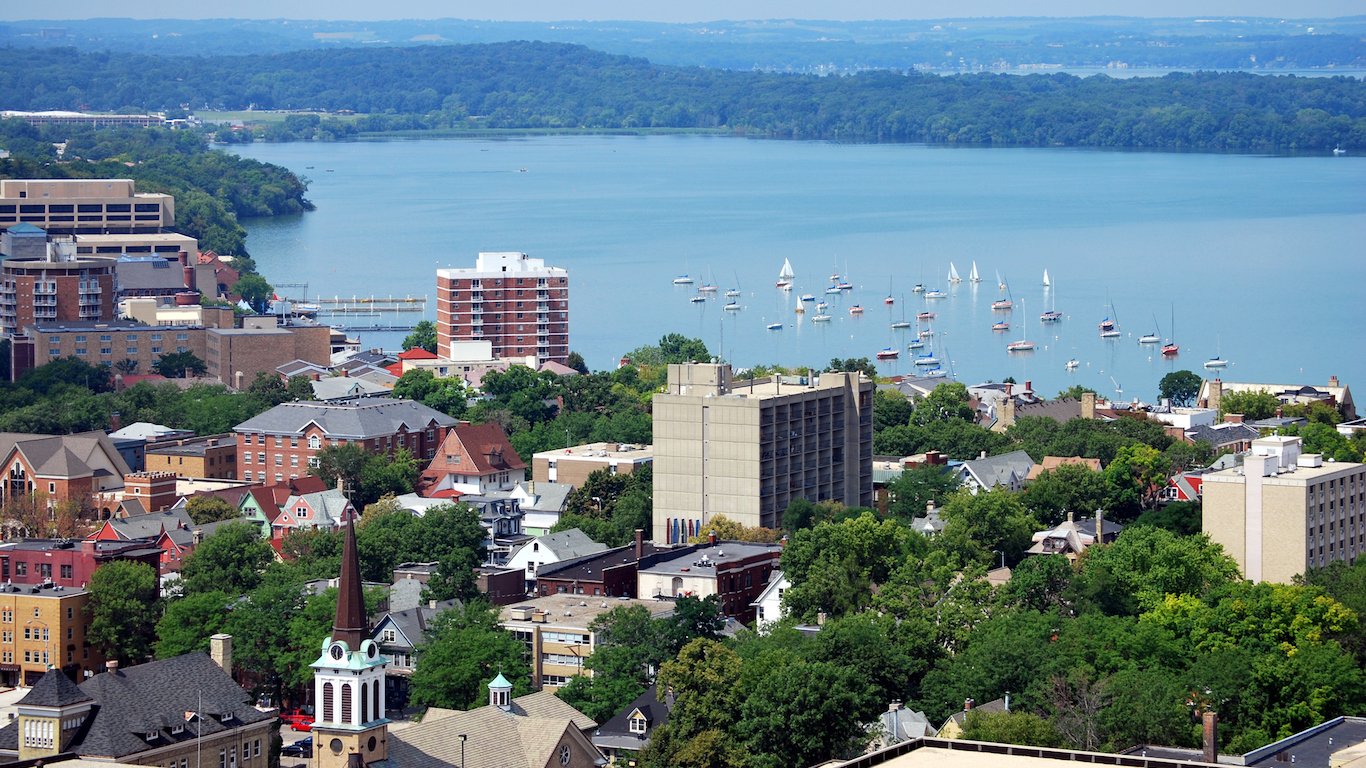
32. Madison, WI
> Physically active adults: 83.3%
> Pop. with access to exercise locations: 88.5%
> Obesity rate: 23.9%
> Adults in fair/poor health: 11.2%
[in-text-ad-2]
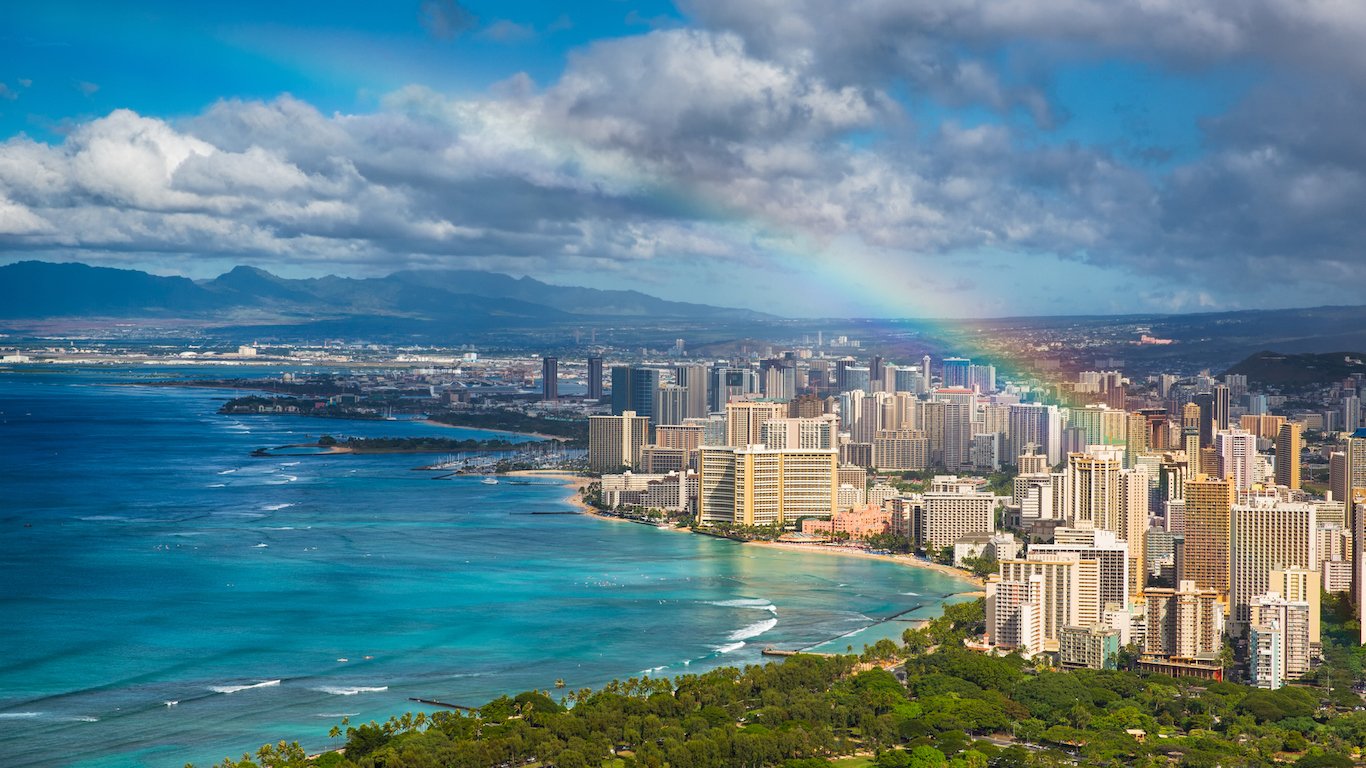
31. Urban Honolulu, HI
> Physically active adults: 81.3%
> Pop. with access to exercise locations: 94.6%
> Obesity rate: 21.9%
> Adults in fair/poor health: 12.6%
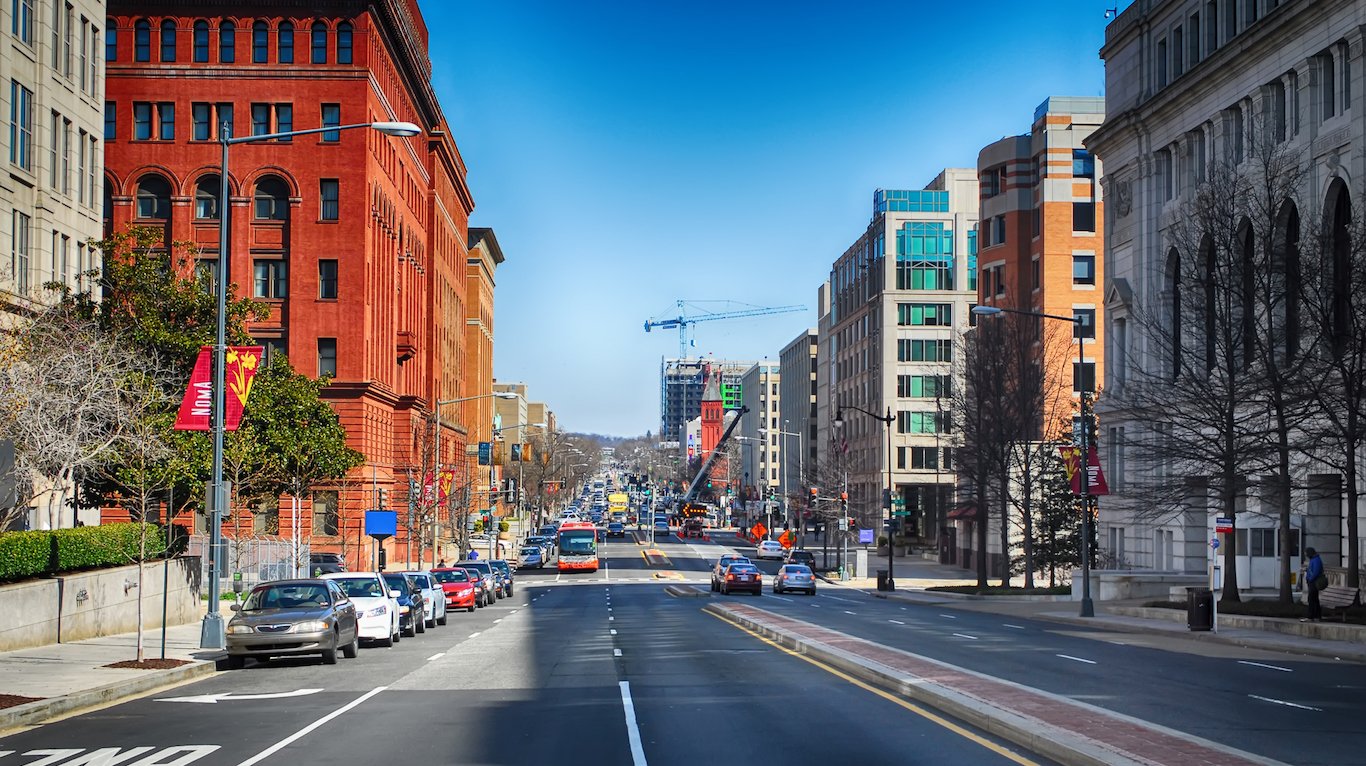
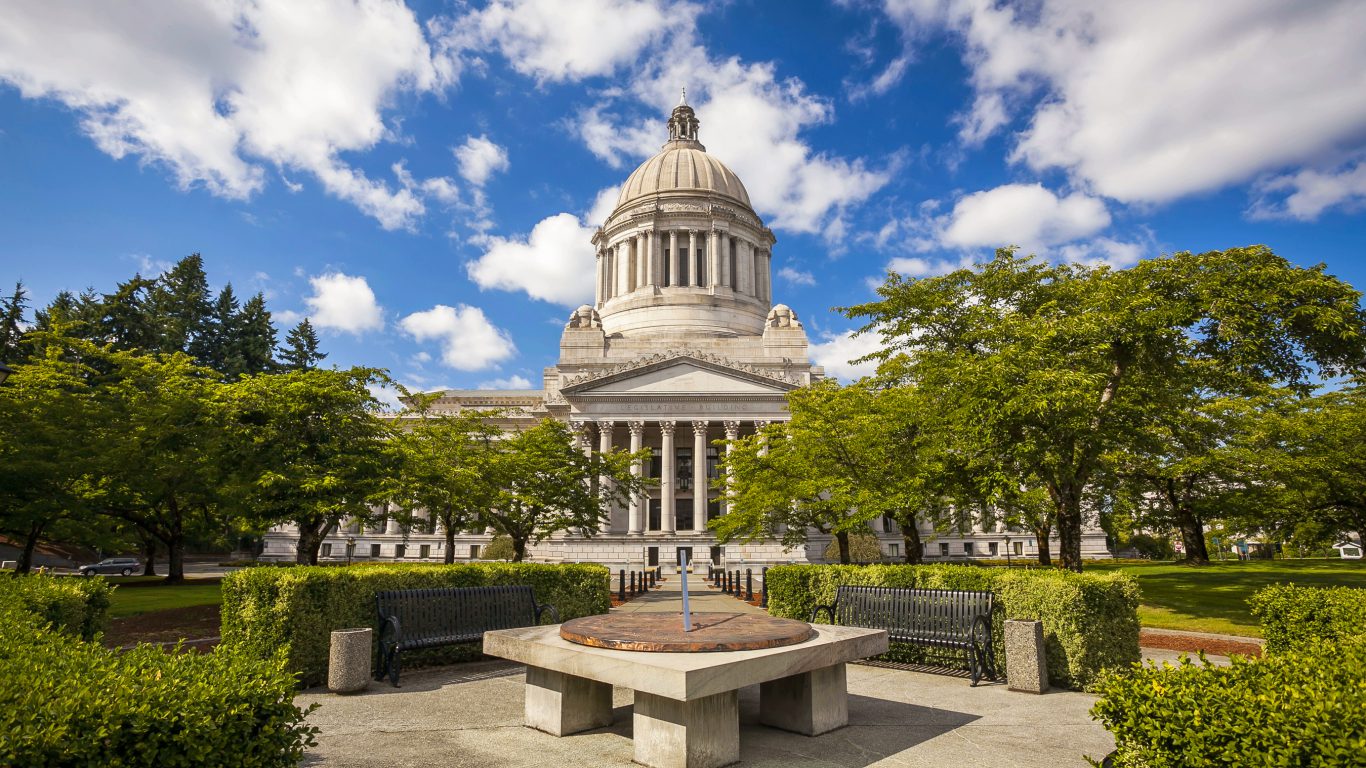
30. Washington-Arlington-Alexandria, DC-VA-MD-WV
> Physically active adults: 81.2%
> Pop. with access to exercise locations: 95.2%
> Obesity rate: 24.3%
> Adults in fair/poor health: 11.9%
[in-text-ad]
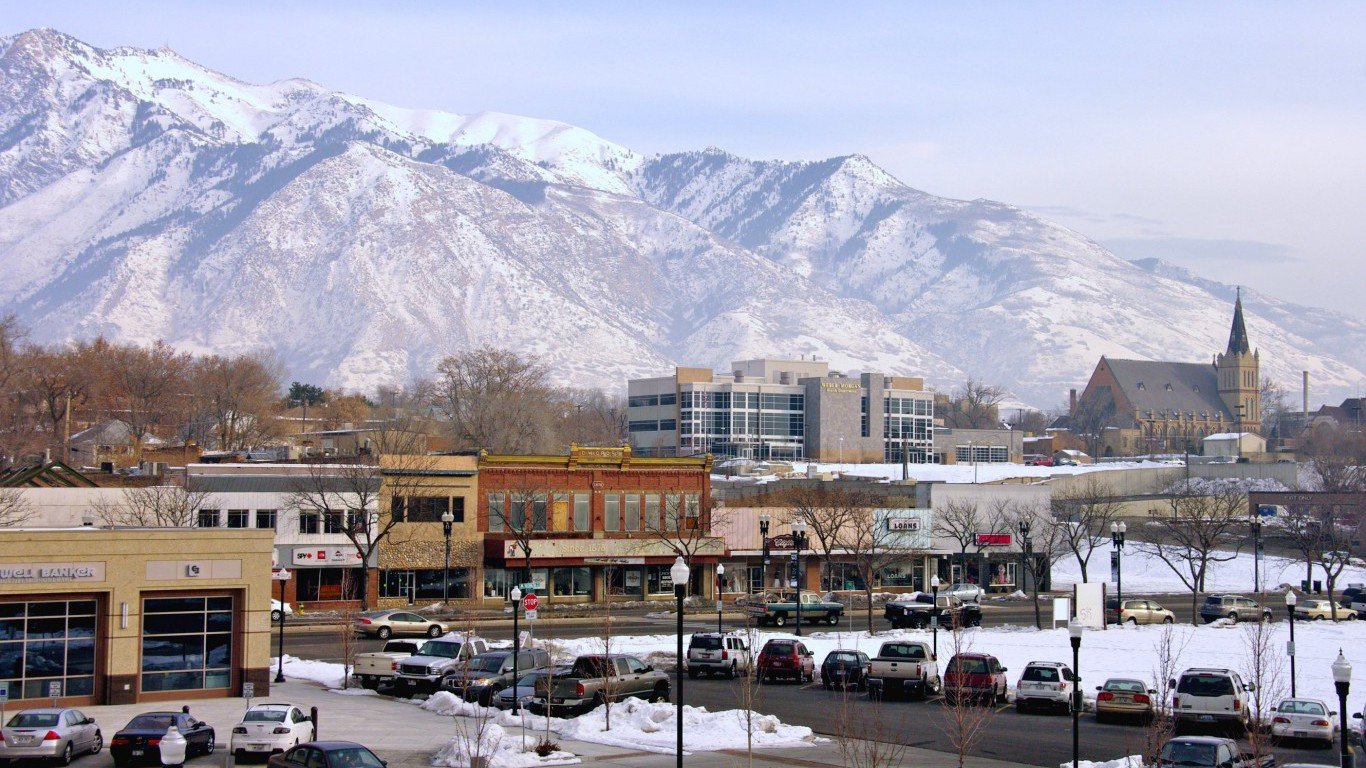
29. Ogden-Clearfield, UT
> Physically active adults: 82.6%
> Pop. with access to exercise locations: 91.3%
> Obesity rate: 26.3%
> Adults in fair/poor health: 11.6%
[recirclink id=375074]
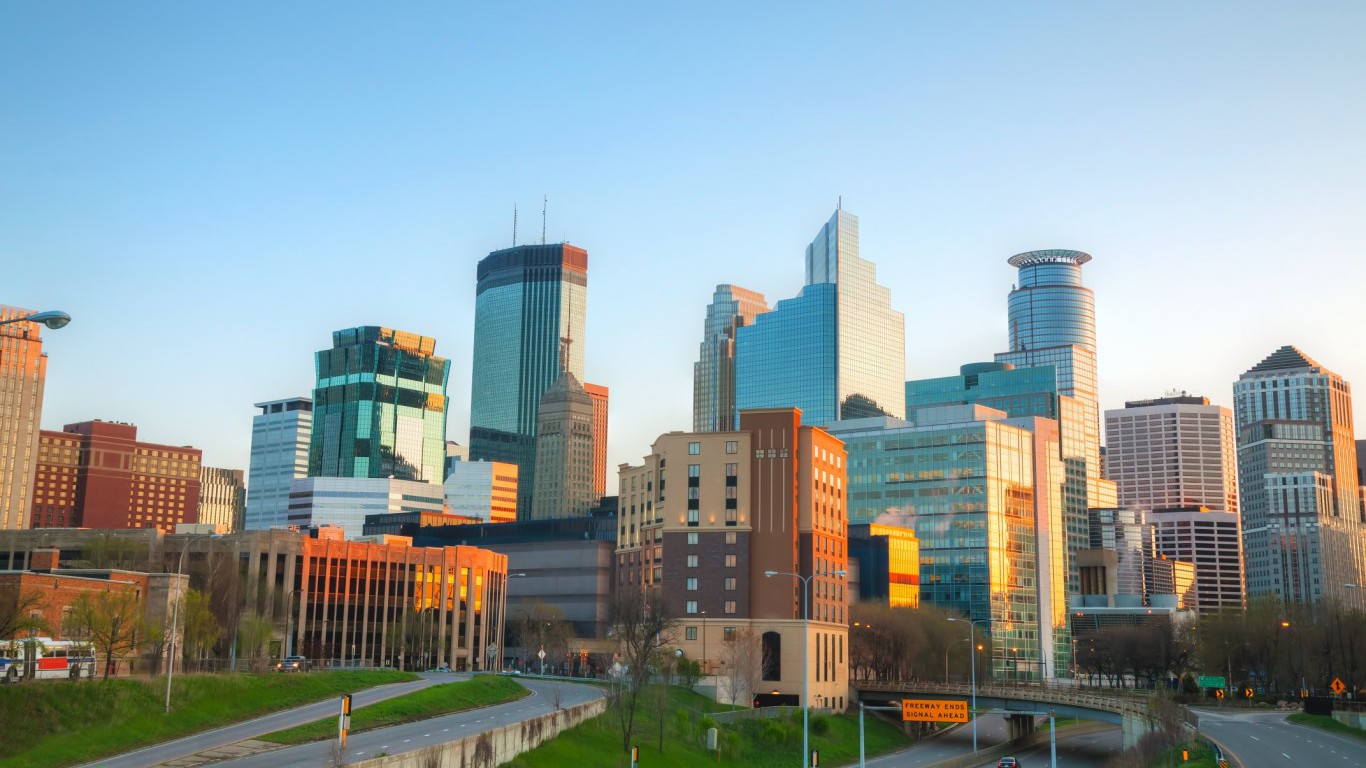
28. Minneapolis-St. Paul-Bloomington, MN-WI
> Physically active adults: 82.0%
> Pop. with access to exercise locations: 94.0%
> Obesity rate: 25.4%
> Adults in fair/poor health: 10.1%
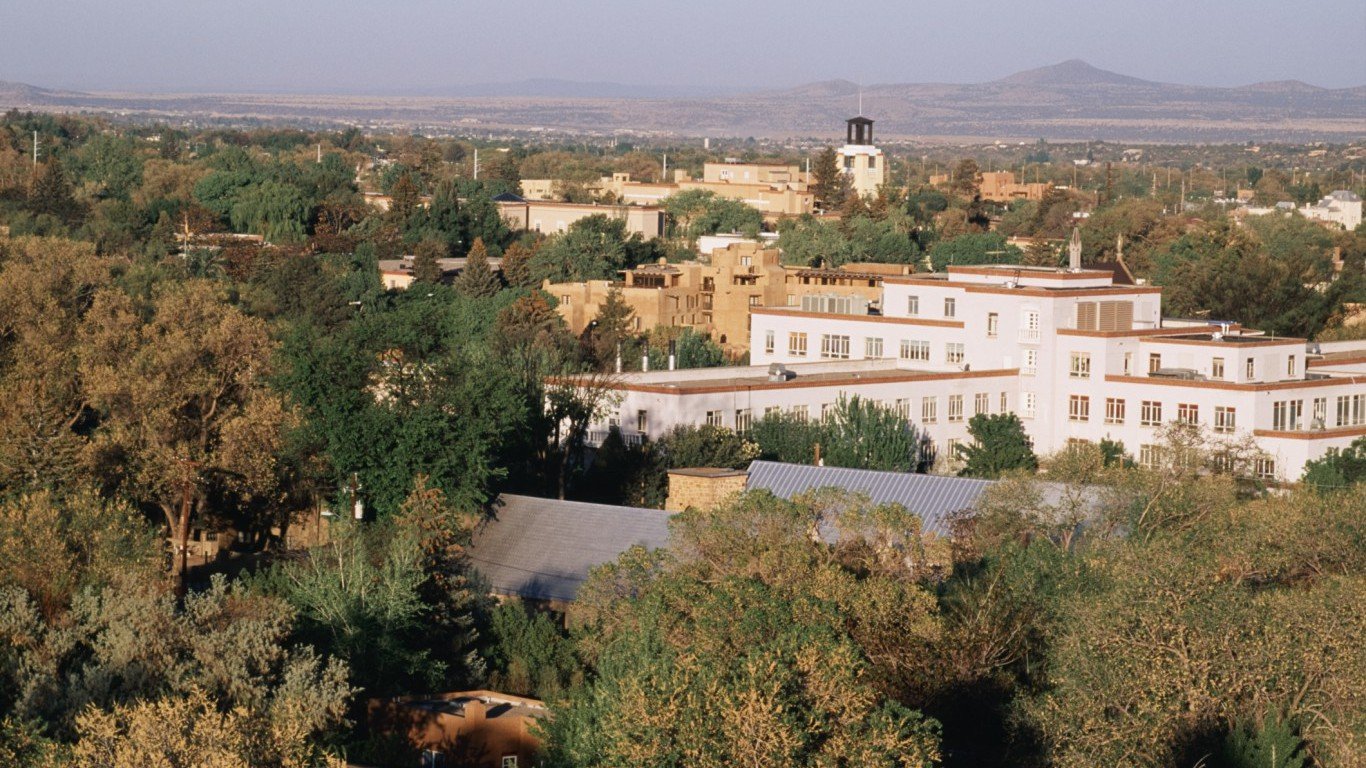
27. Santa Fe, NM
> Physically active adults: 88.0%
> Pop. with access to exercise locations: 80.6%
> Obesity rate: 13.8%
> Adults in fair/poor health: 15.1%
[in-text-ad-2]
26. Vallejo-Fairfield, CA
> Physically active adults: 81.6%
> Pop. with access to exercise locations: 96.8%
> Obesity rate: 29.5%
> Adults in fair/poor health: 15.5%

25. Austin-Round Rock, TX
> Physically active adults: 82.7%
> Pop. with access to exercise locations: 93.4%
> Obesity rate: 23.3%
> Adults in fair/poor health: 15.0%
[in-text-ad]
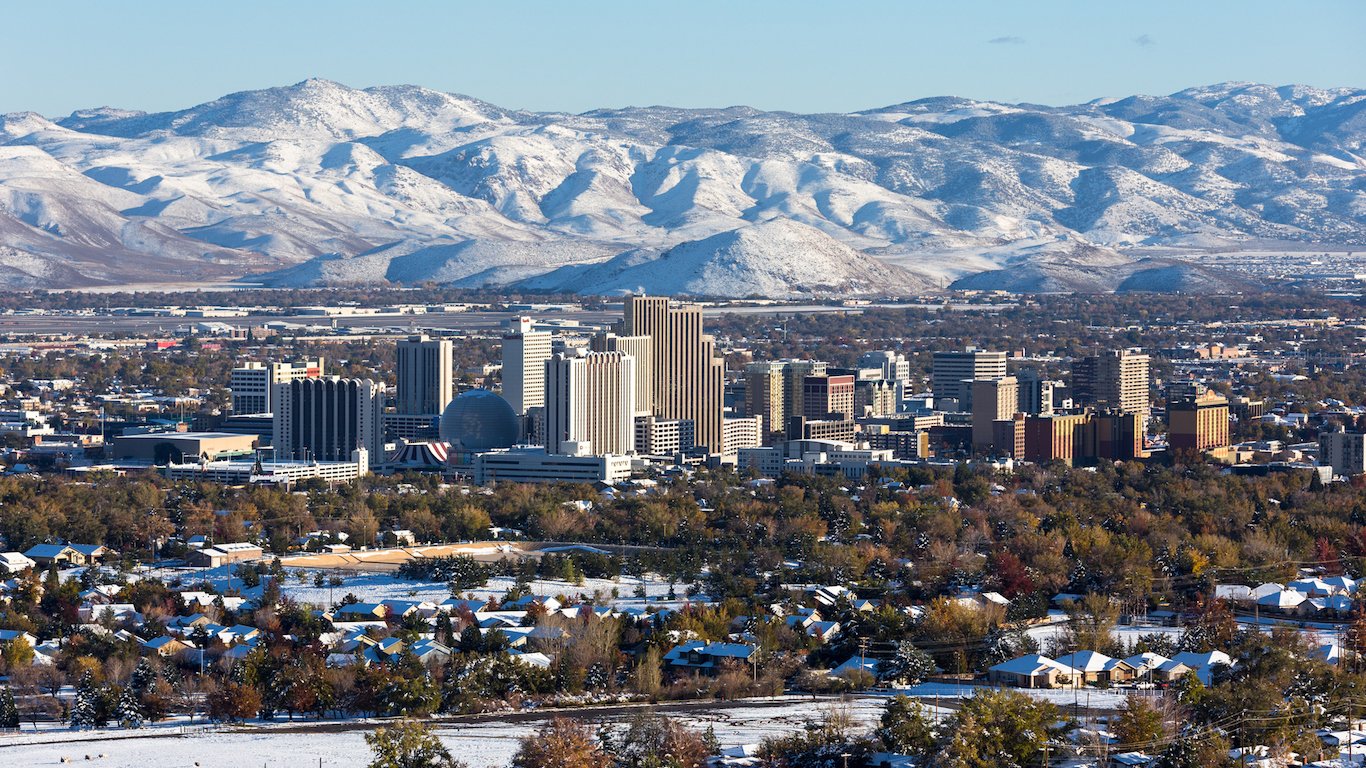
24. Reno, NV
> Physically active adults: 83.8%
> Pop. with access to exercise locations: 90.7%
> Obesity rate: 22.2%
> Adults in fair/poor health: 16.3%
[recirclink id=377173]
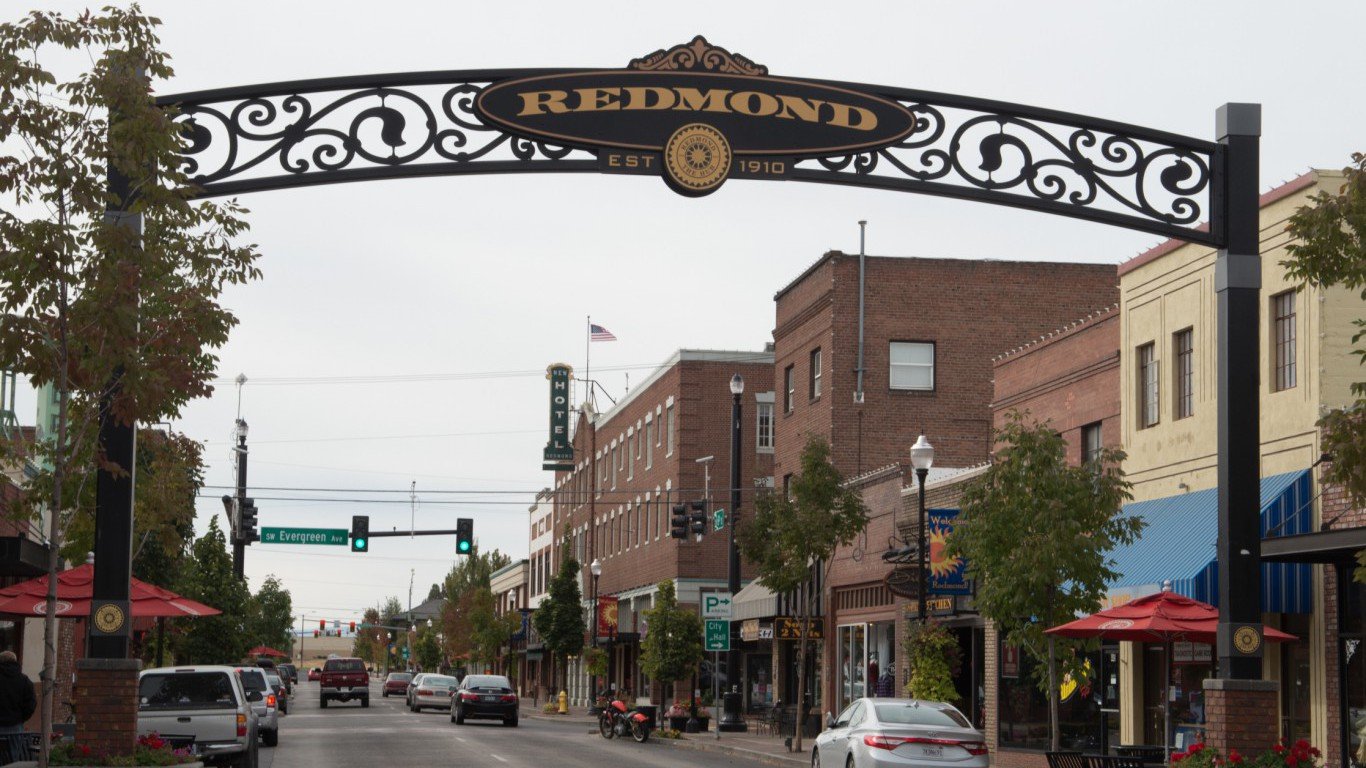
23. Bend-Redmond, OR
> Physically active adults: 85.4%
> Pop. with access to exercise locations: 87.1%
> Obesity rate: 23.3%
> Adults in fair/poor health: 12.3%
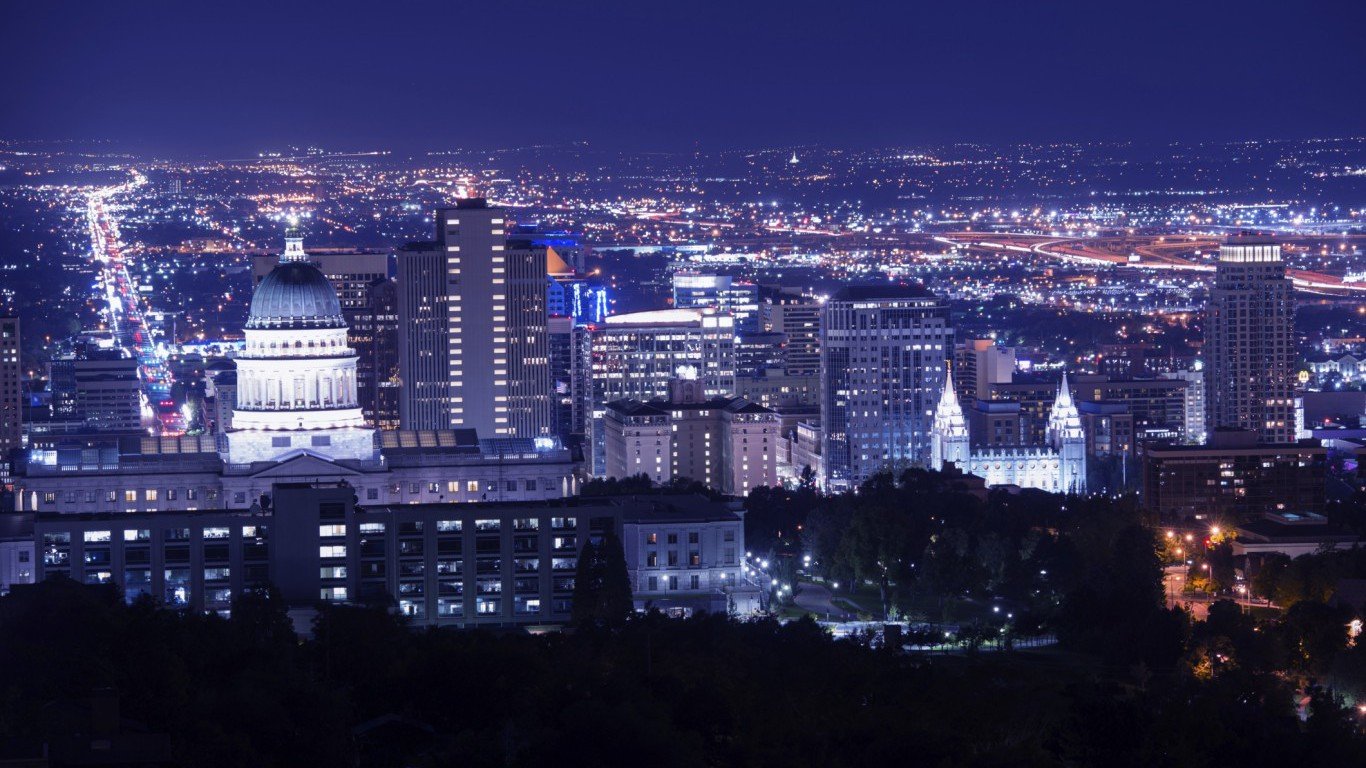
22. Salt Lake City, UT
> Physically active adults: 82.9%
> Pop. with access to exercise locations: 94.3%
> Obesity rate: 25.4%
> Adults in fair/poor health: 12.6%
[in-text-ad-2]
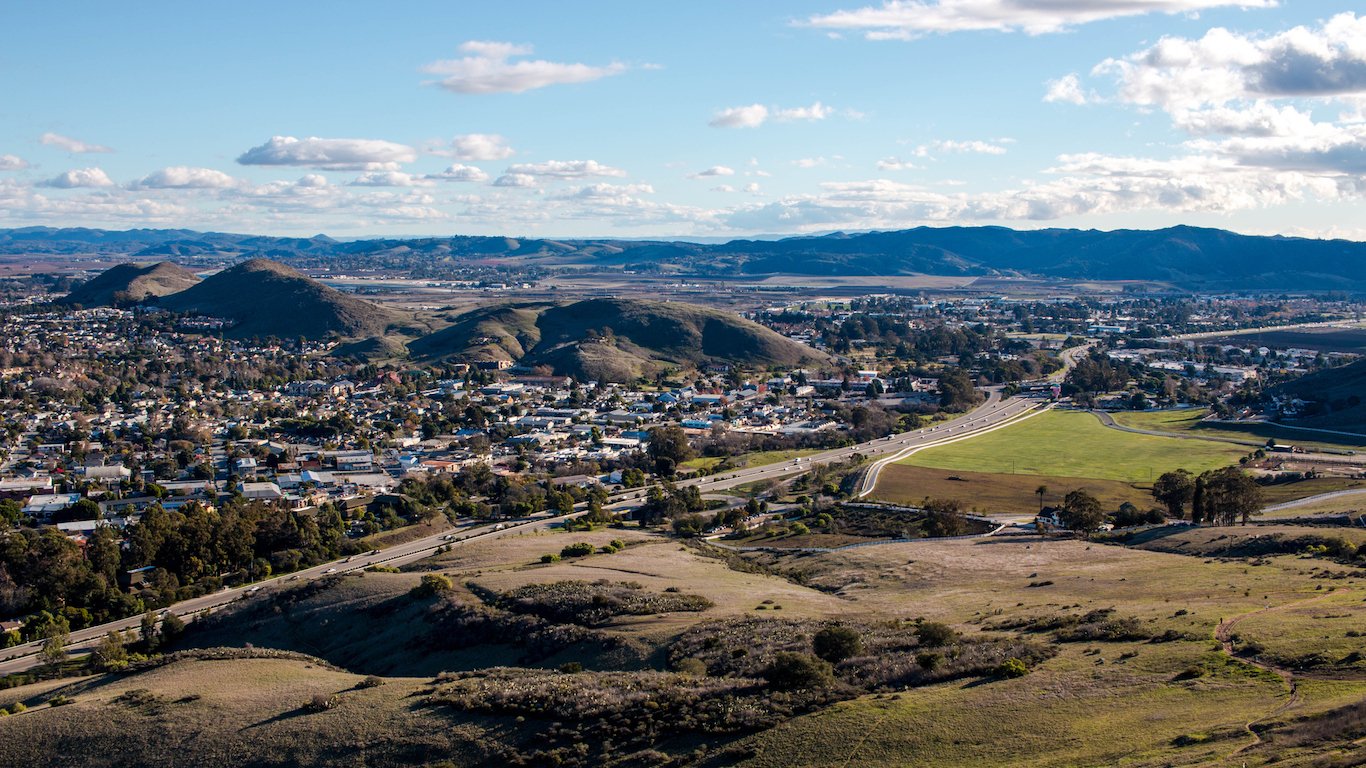
21. San Luis Obispo-Paso Robles-Arroyo Grande, CA
> Physically active adults: 84.9%
> Pop. with access to exercise locations: 89.2%
> Obesity rate: 21.8%
> Adults in fair/poor health: 13.1%
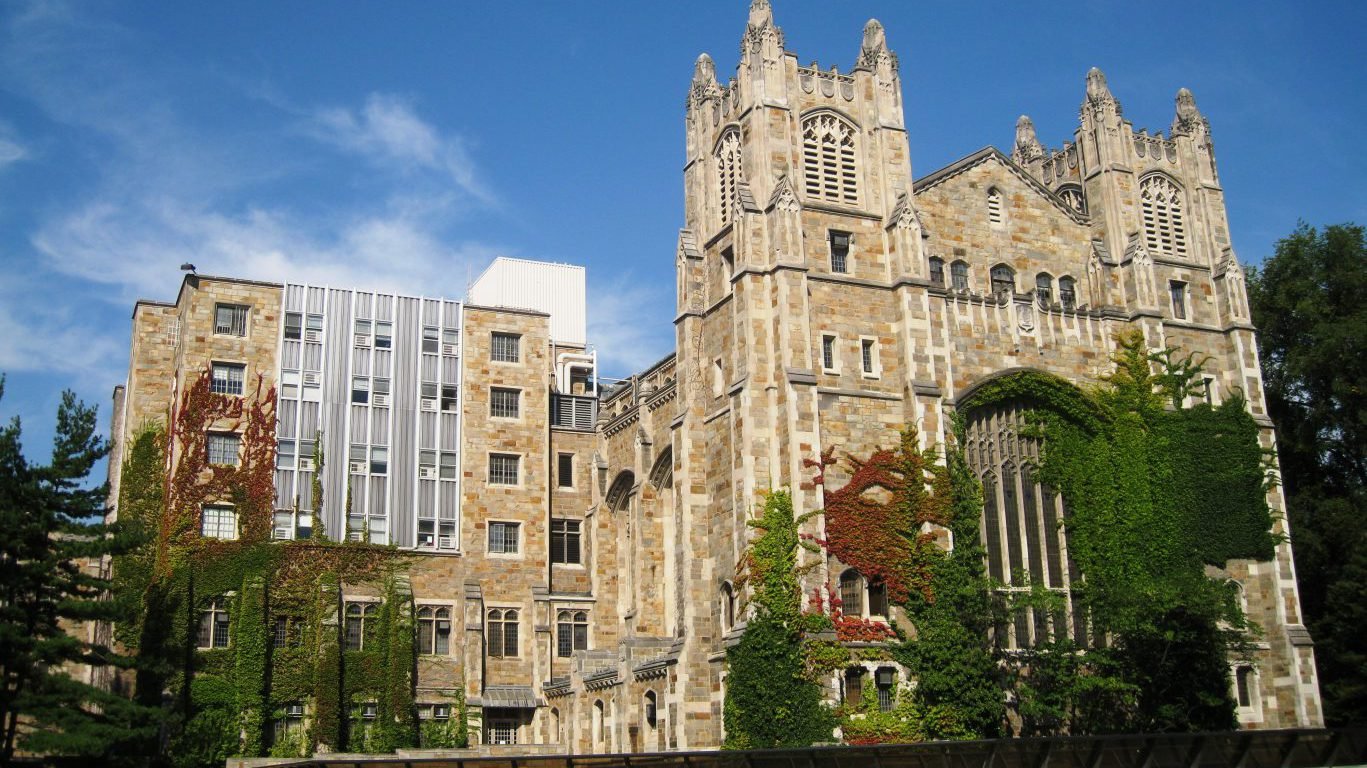
20. Ann Arbor, MI
> Physically active adults: 83.9%
> Pop. with access to exercise locations: 92.0%
> Obesity rate: 23.3%
> Adults in fair/poor health: 11.5%
[in-text-ad]
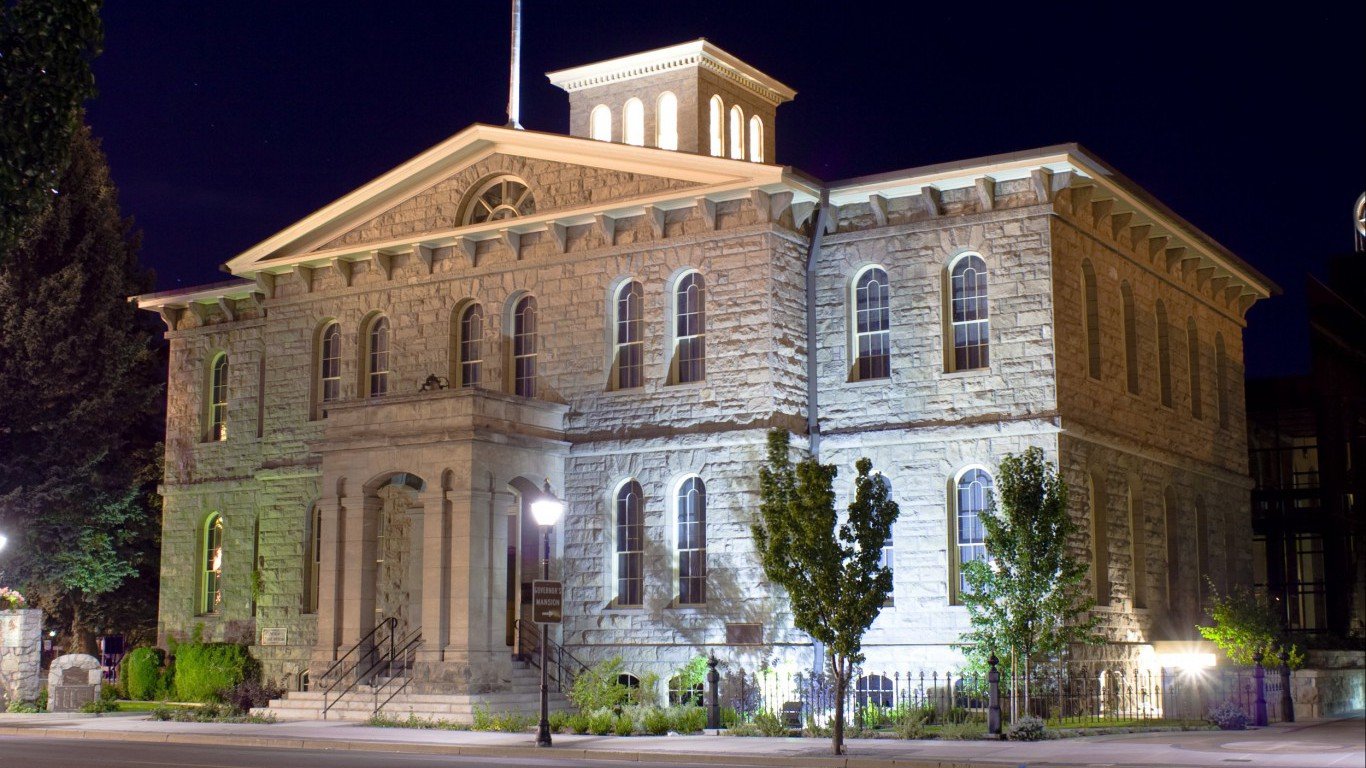
19. Carson City, NV
> Physically active adults: 82.6%
> Pop. with access to exercise locations: 96.4%
> Obesity rate: 24.1%
> Adults in fair/poor health: 18.1%
[recirclink id=375461]
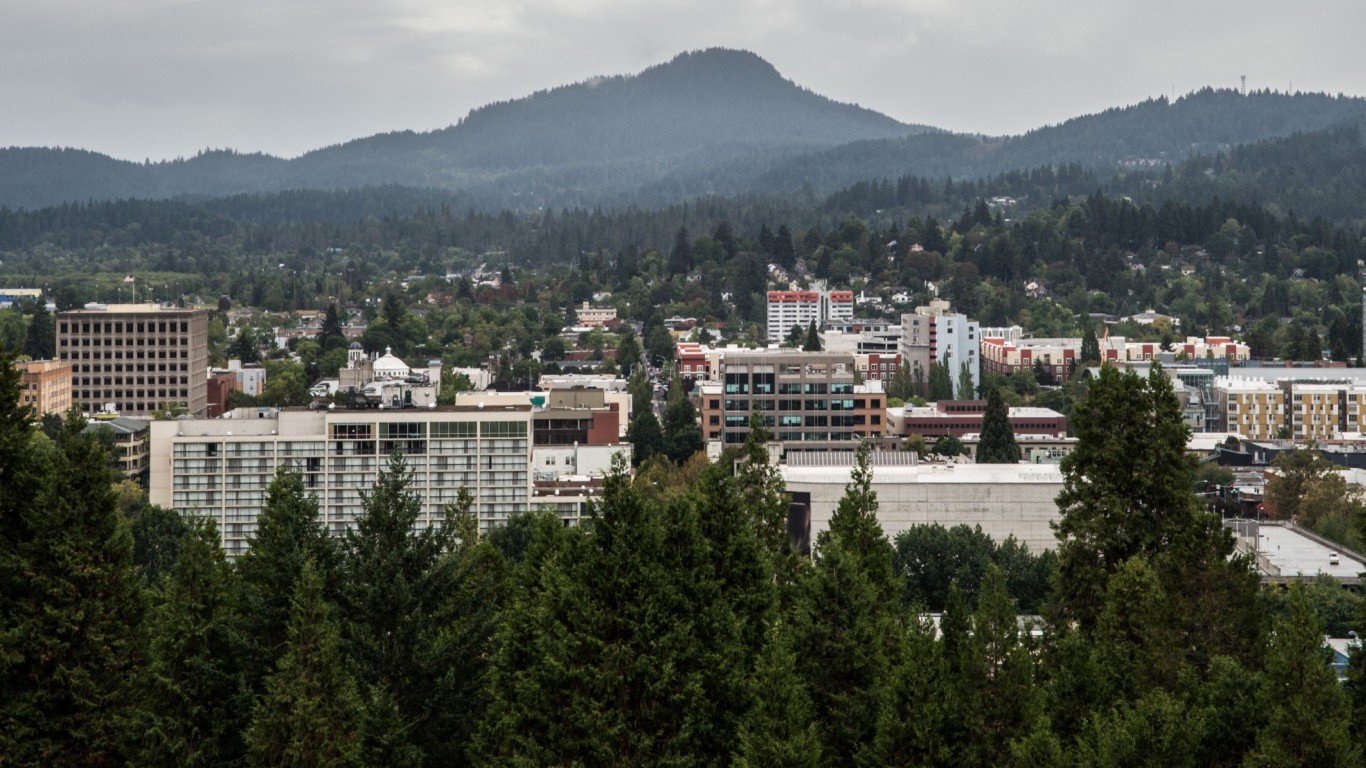
18. Eugene, OR
> Physically active adults: 84.5%
> Pop. with access to exercise locations: 91.1%
> Obesity rate: 27.3%
> Adults in fair/poor health: 13.1%
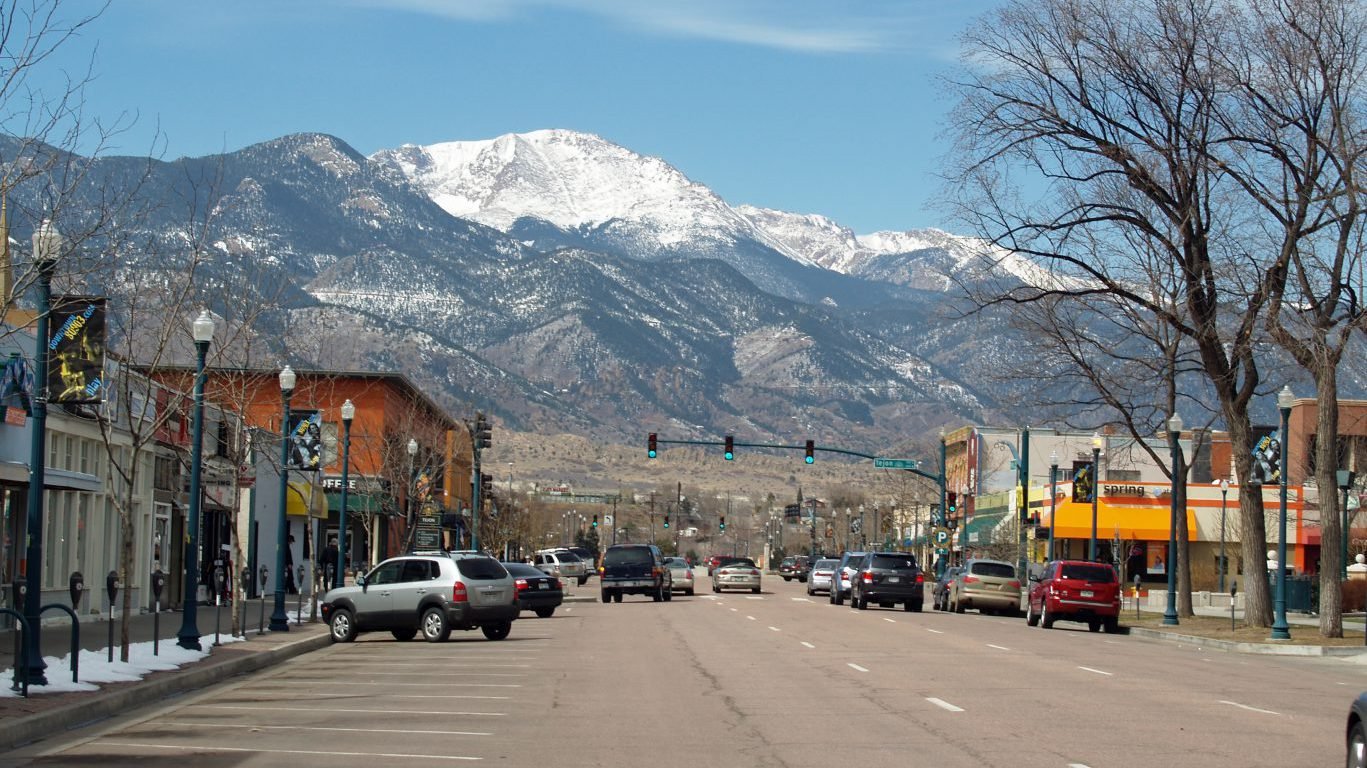
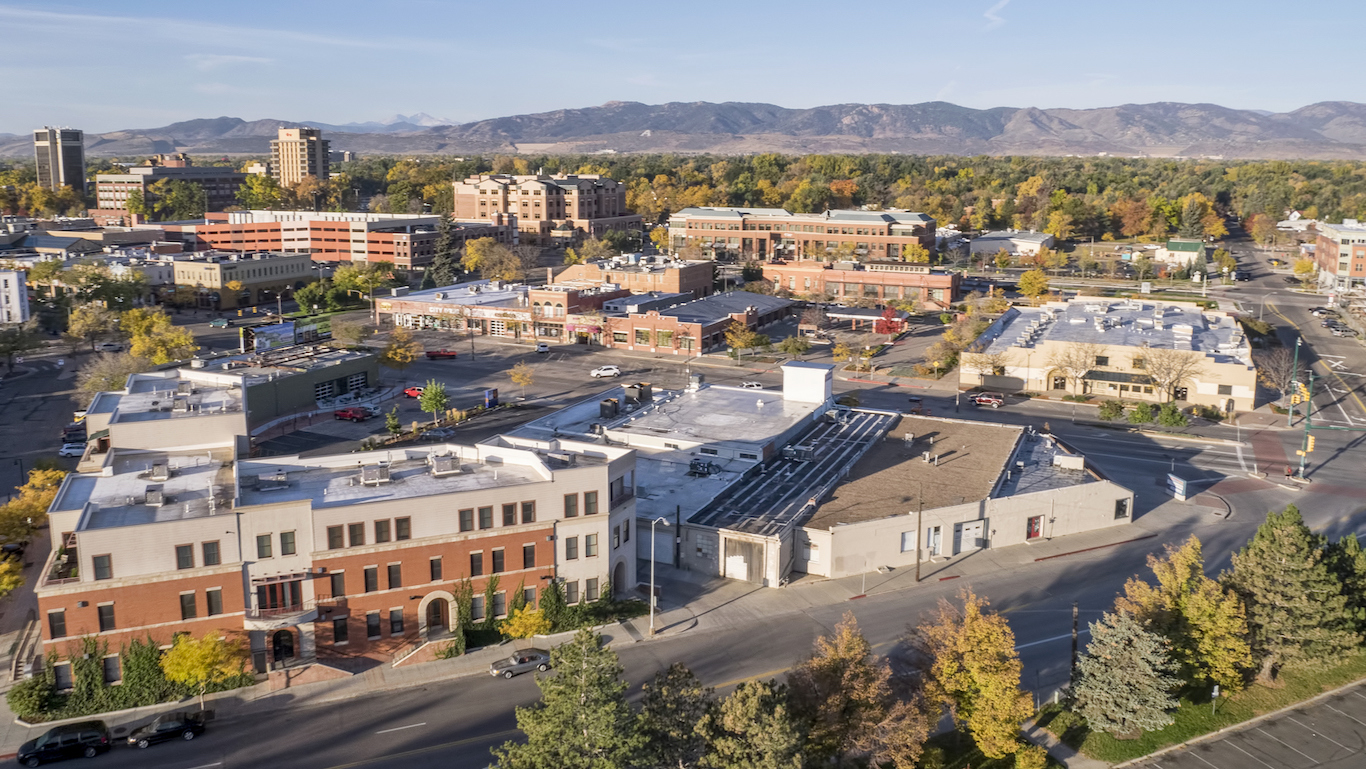
17. Colorado Springs, CO
> Physically active adults: 83.8%
> Pop. with access to exercise locations: 93.3%
> Obesity rate: 21.3%
> Adults in fair/poor health: 11.2%
[in-text-ad-2]
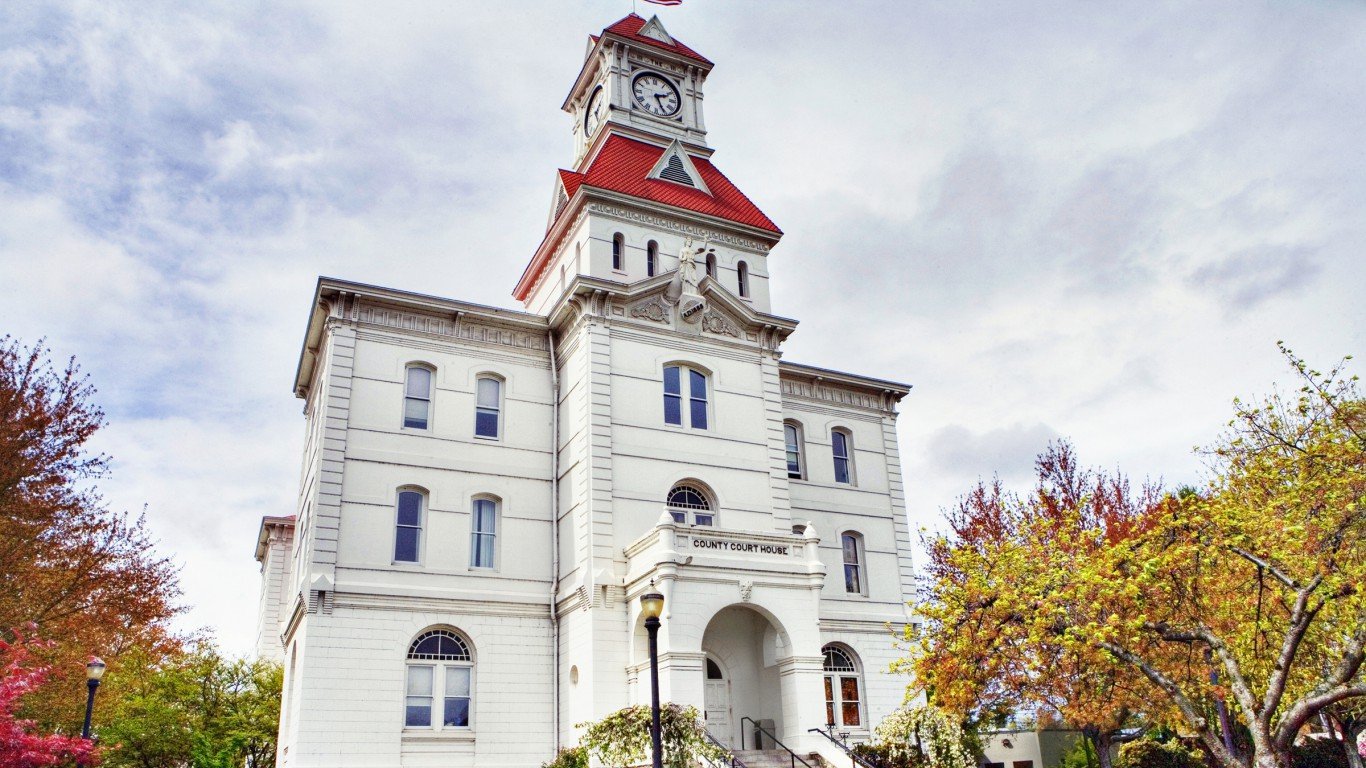
16. Corvallis, OR
> Physically active adults: 86.8%
> Pop. with access to exercise locations: 86.0%
> Obesity rate: 19.7%
> Adults in fair/poor health: 13.0%

15. Seattle-Tacoma-Bellevue, WA
> Physically active adults: 83.1%
> Pop. with access to exercise locations: 95.5%
> Obesity rate: 25.5%
> Adults in fair/poor health: 11.8%
[in-text-ad]
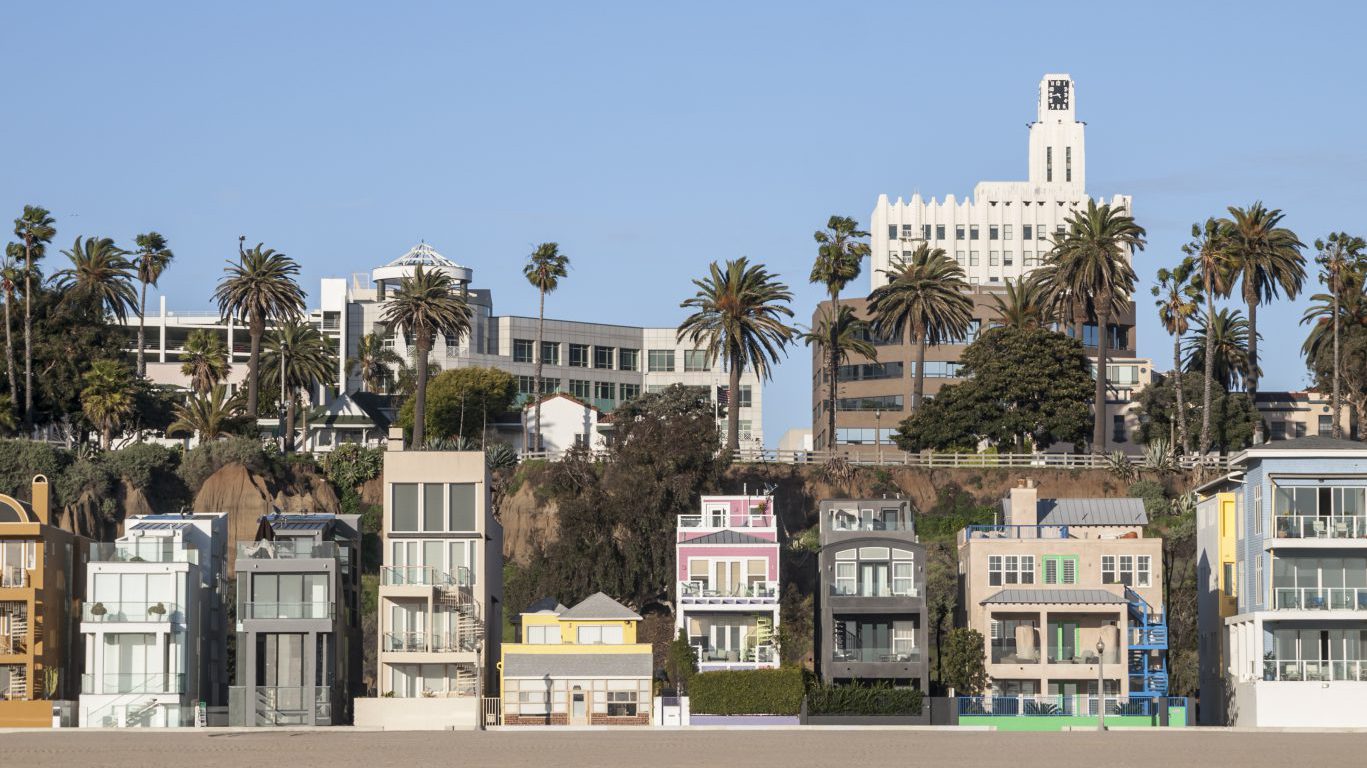
14. Los Angeles-Long Beach-Anaheim, CA
> Physically active adults: 83.1%
> Pop. with access to exercise locations: 97.8%
> Obesity rate: 20.7%
> Adults in fair/poor health: 18.7%
[recirclink id=377173]
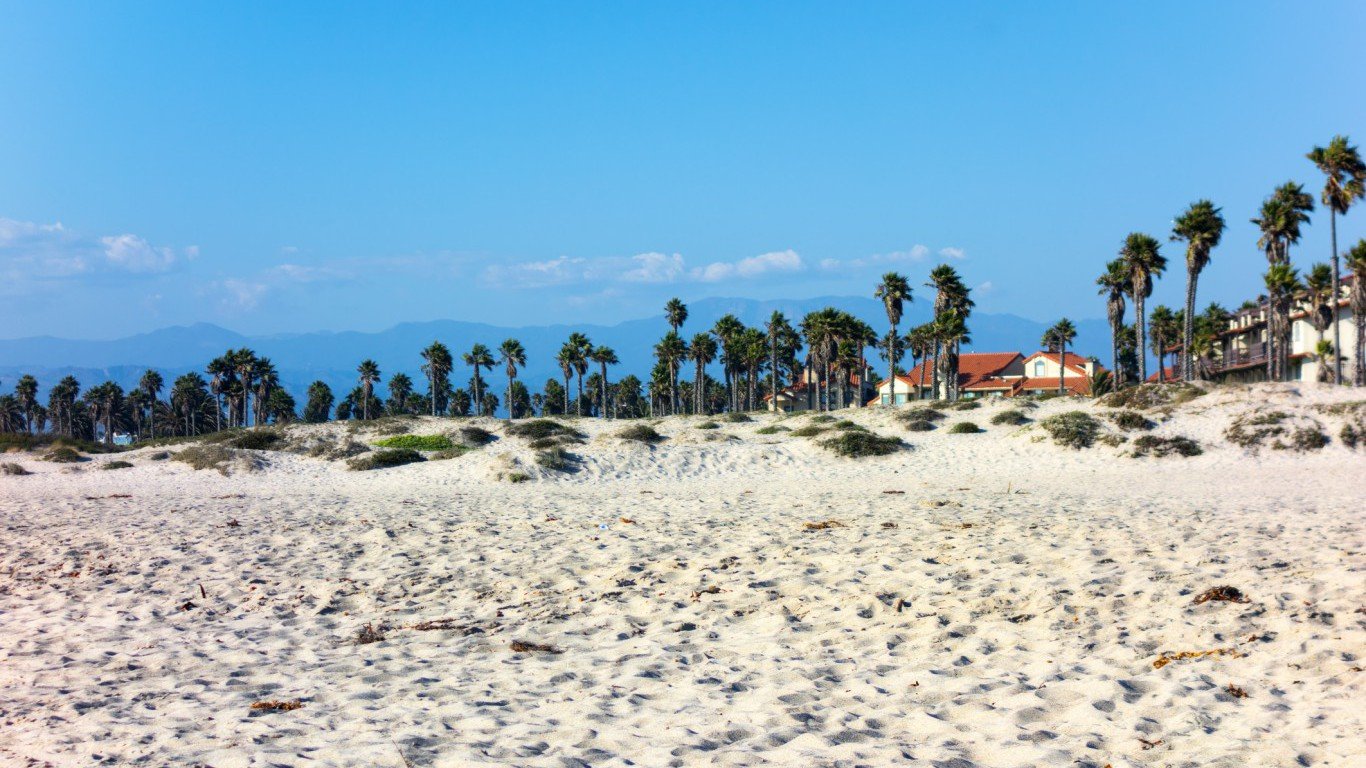
13. Oxnard-Thousand Oaks-Ventura, CA
> Physically active adults: 83.3%
> Pop. with access to exercise locations: 97.8%
> Obesity rate: 20.6%
> Adults in fair/poor health: 14.7%
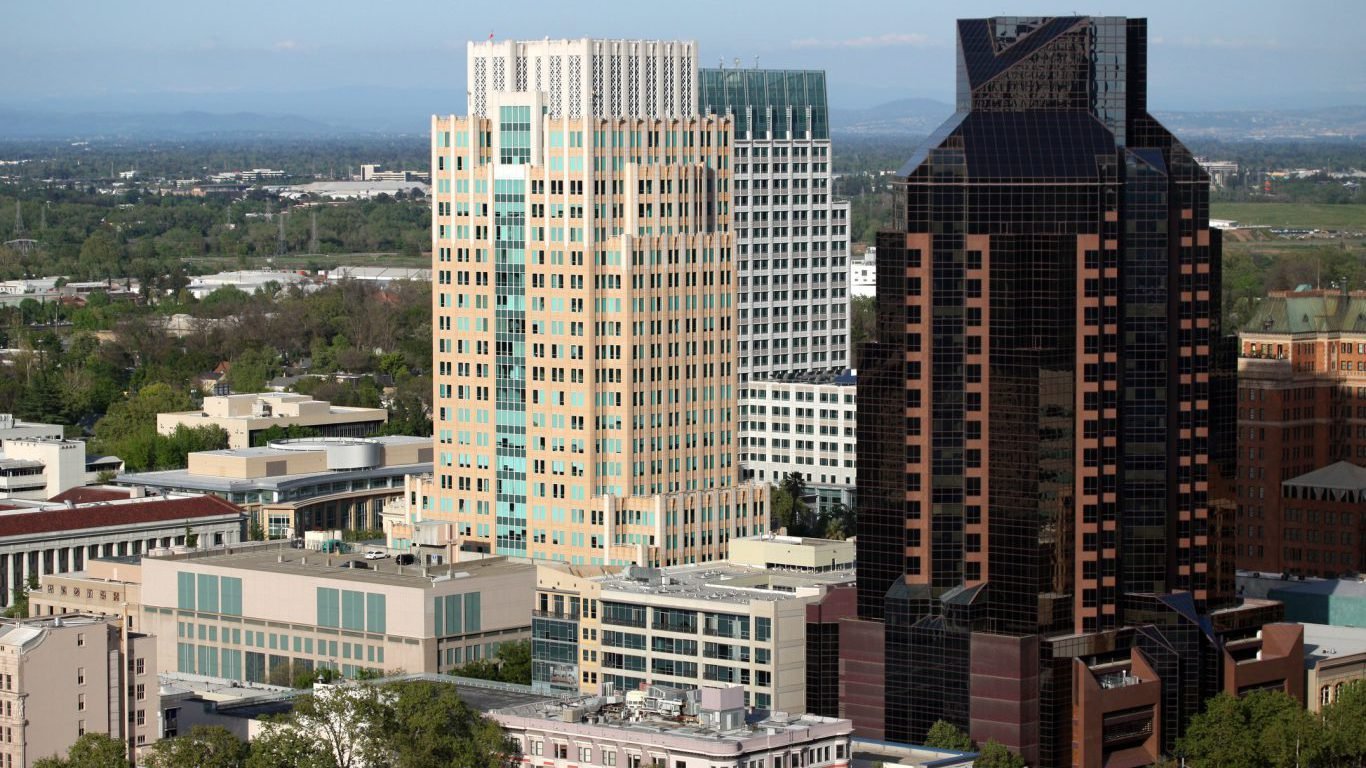
12. Sacramento–Roseville–Arden-Arcade, CA
> Physically active adults: 84.0%
> Pop. with access to exercise locations: 95.9%
> Obesity rate: 24.7%
> Adults in fair/poor health: 14.7%
[in-text-ad-2]

11. Portland-Vancouver-Hillsboro, OR-WA
> Physically active adults: 85.0%
> Pop. with access to exercise locations: 95.4%
> Obesity rate: 24.7%
> Adults in fair/poor health: 12.6%
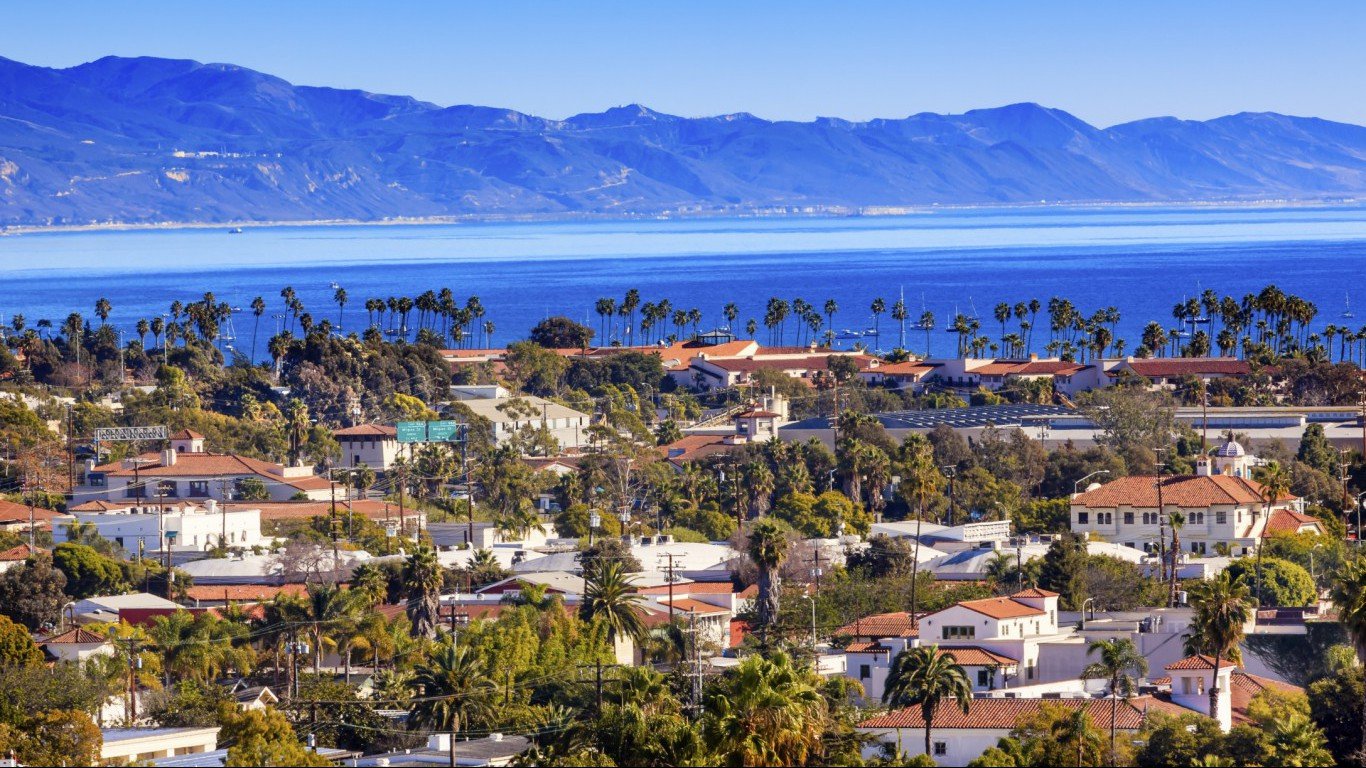
10. Santa Maria-Santa Barbara, CA
> Physically active adults: 85.3%
> Pop. with access to exercise locations: 95.6%
> Obesity rate: 19.0%
> Adults in fair/poor health: 16.8%
[in-text-ad]
9. Napa, CA
> Physically active adults: 86.0%
> Pop. with access to exercise locations: 93.9%
> Obesity rate: 24.3%
> Adults in fair/poor health: 14.2%
[recirclink id=375300]
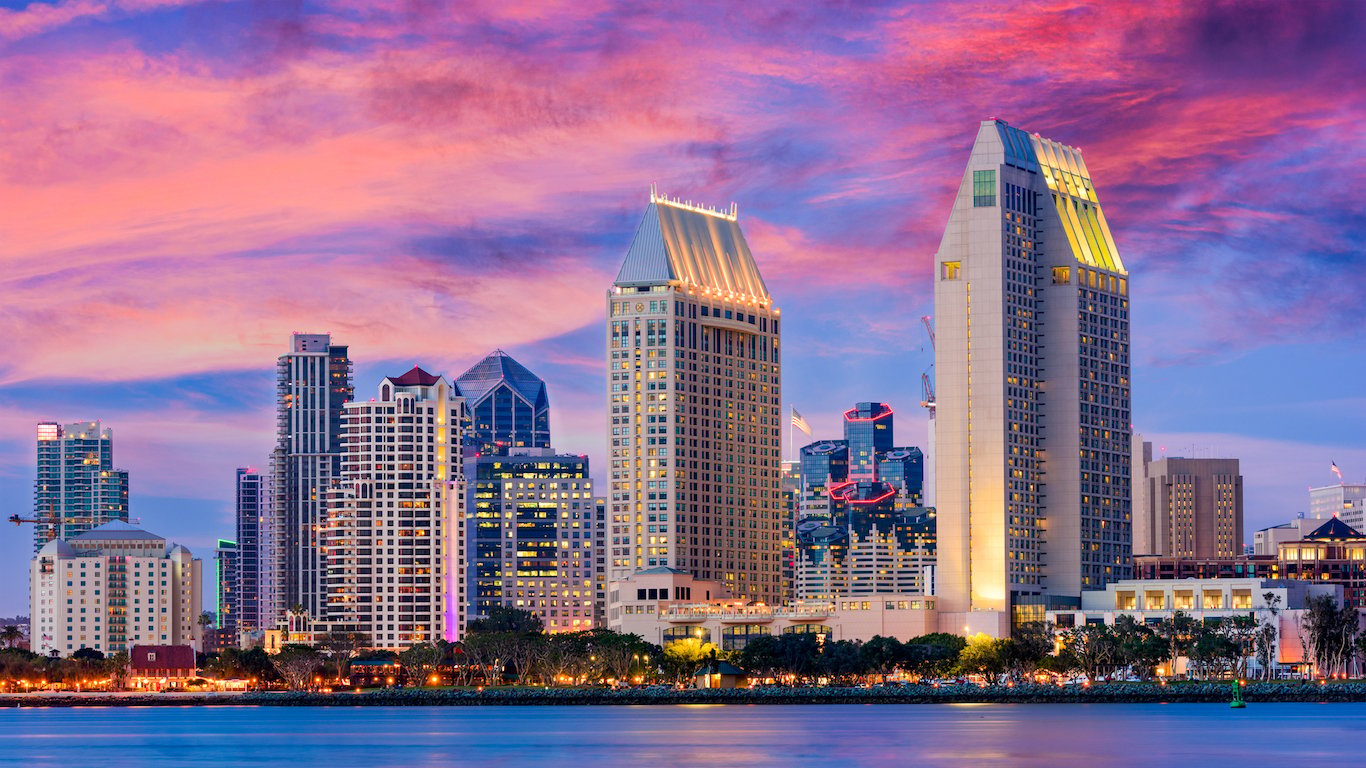
8. San Diego-Carlsbad, CA
> Physically active adults: 85.2%
> Pop. with access to exercise locations: 96.1%
> Obesity rate: 20.2%
> Adults in fair/poor health: 14.3%
7. San Jose-Sunnyvale-Santa Clara, CA
> Physically active adults: 84.7%
> Pop. with access to exercise locations: 98.2%
> Obesity rate: 19.6%
> Adults in fair/poor health: 11.6%
[in-text-ad-2]

6. San Francisco-Oakland-Hayward, CA
> Physically active adults: 85.1%
> Pop. with access to exercise locations: 98.6%
> Obesity rate: 19.5%
> Adults in fair/poor health: 12.5%

5. Denver-Aurora-Lakewood, CO
> Physically active adults: 85.6%
> Pop. with access to exercise locations: 97.9%
> Obesity rate: 19.7%
> Adults in fair/poor health: 12.1%
[in-text-ad]

4. Santa Rosa, CA
> Physically active adults: 86.8%
> Pop. with access to exercise locations: 94.7%
> Obesity rate: 21.6%
> Adults in fair/poor health: 13.3%
[recirclink id=377173]
3. Fort Collins, CO
> Physically active adults: 87.9%
> Pop. with access to exercise locations: 92.1%
> Obesity rate: 18.9%
> Adults in fair/poor health: 9.8%
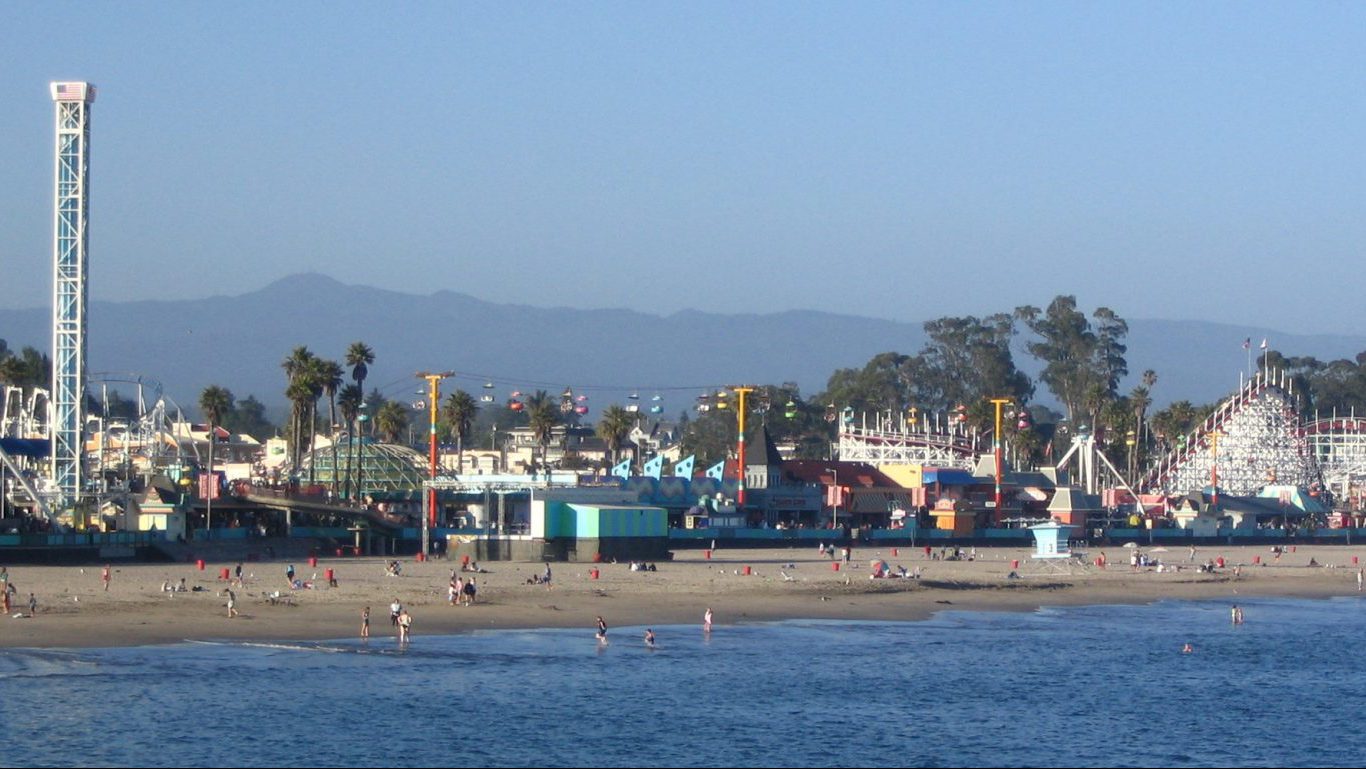
2. Santa Cruz-Watsonville, CA
> Physically active adults: 88.6%
> Pop. with access to exercise locations: 96.1%
> Obesity rate: 20.6%
> Adults in fair/poor health: 14.3%
[in-text-ad-2]
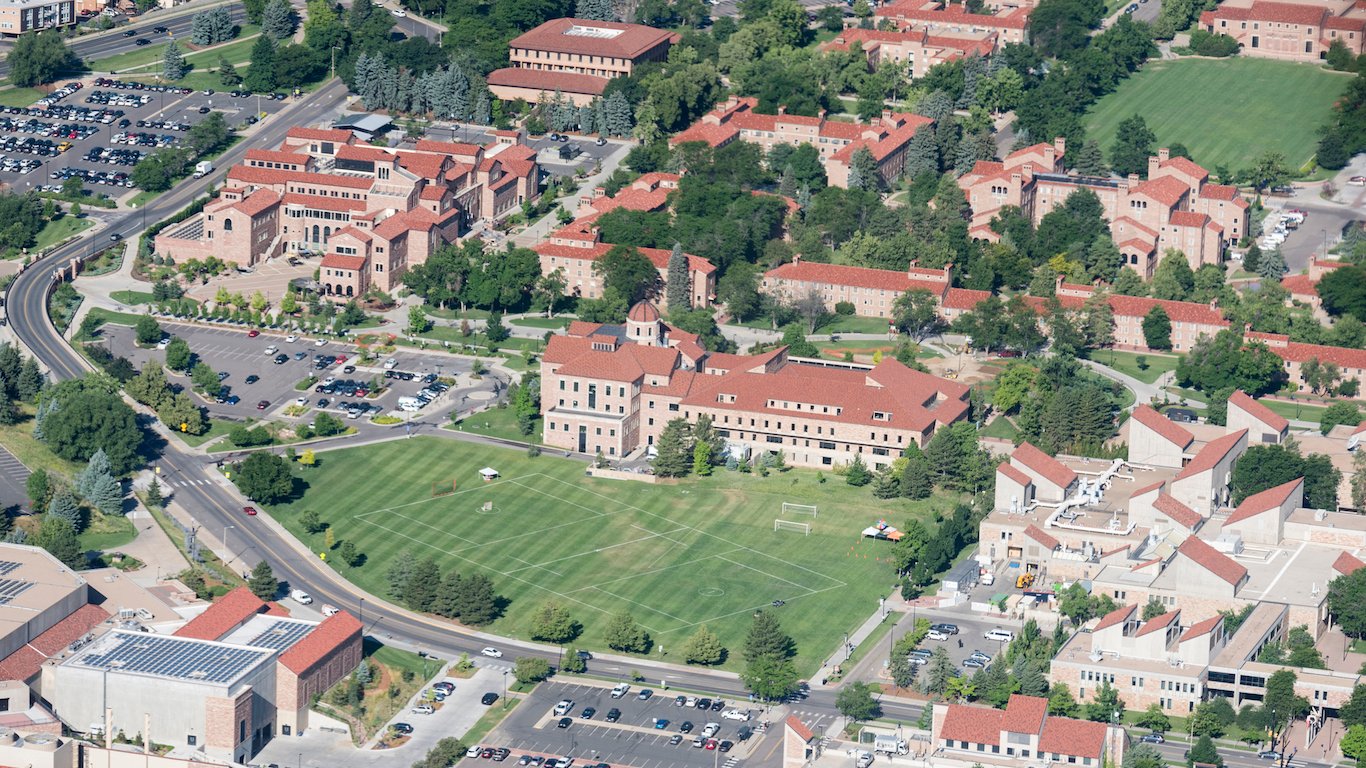
1. Boulder, CO
> Physically active adults: 90.6%
> Pop. with access to exercise locations: 97.7%
> Obesity rate: 13.3%
> Adults in fair/poor health: 10.1%
Contact [email protected] for any questions or corrections.