In the wake of the subprime mortgage crisis, housing became much more affordable as prices dropped. Since peaking in 2012, however, affordability has rapidly declined. Inventory of for-sale homes fell faster in May than it has in years, and home prices have risen substantially in turn.
Homeownership in the United States has declined in recent years. The homeownership rate reached 63.6% this year, nearly the lowest level since the Census Bureau began tracking the data over 50 years ago, and down from a peak of 69.2% in 2004.
Some areas are far less affordable than others, and in some parts of the country, typical rents and home prices are only affordable to high earners in the area. Based on data provided by real estate data company ATTOM Data Solutions and 24/7 Wall St.’s calculations, we identified the 25 counties where housing is the least affordable relative to average area wages.
Of the 25 least affordable housing markets, 16 are located in California, with many clustered around the Silicon Valley area. Many people move to these areas for the specialized, high-paying jobs available. However, even with some of the highest incomes in the country, typical housing costs are well out of reach for most residents.
Click here to see America’s 25 least affordable housing markets.
Click here to see the detailed findings and methodology.
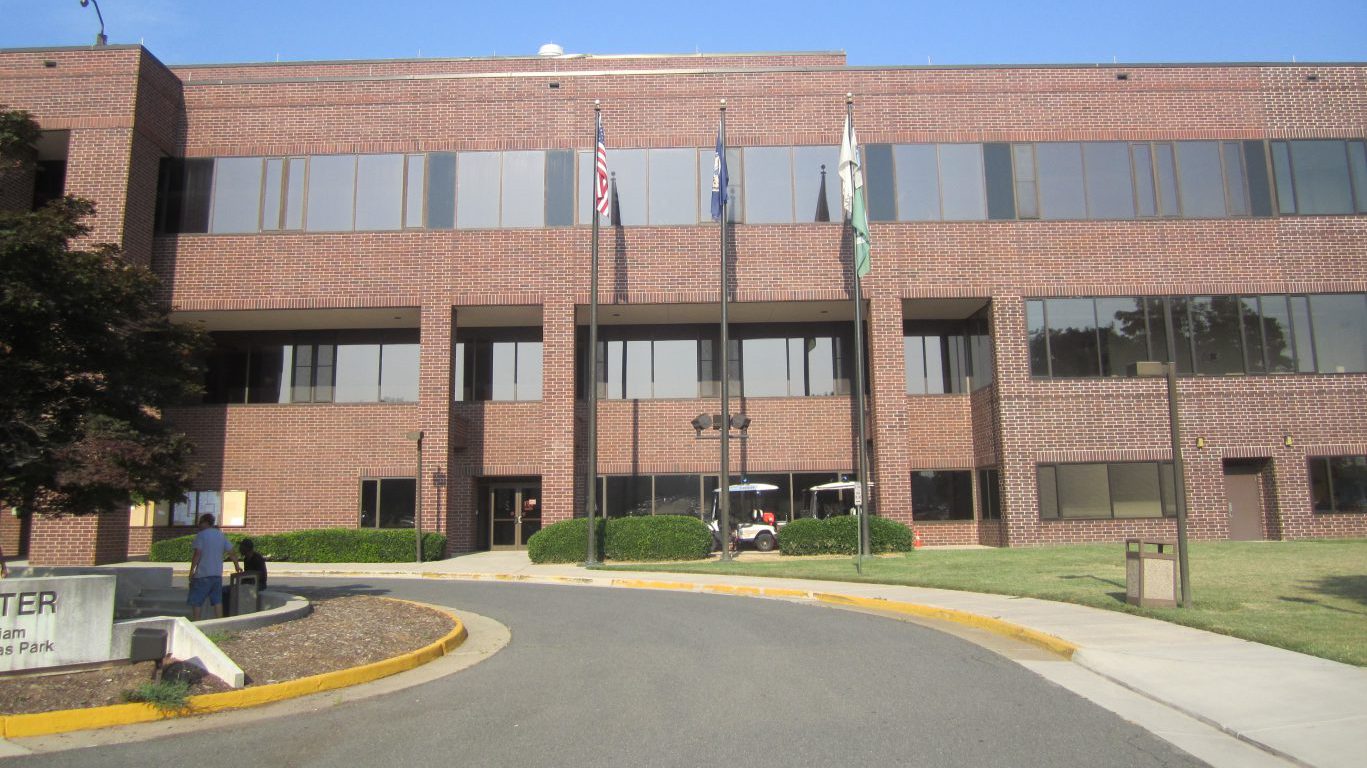
25. Prince William County, Virginia
> Metro area: Washington-Arlington-Alexandria, DC-VA-MD-WV
> Avg. % of wage spent on housing: 56.0%
> Avg. monthly wage: $3,827
> Median home ownership cost: $2,108
> Median rent, 3 bedrooms: $2,300
[in-text-ad]

24. Los Angeles County, California
> Metro area: Los Angeles-Long Beach-Anaheim, CA
> Avg. % of wage spent on housing: 56.9%
> Avg. monthly wage: $5,000
> Median home ownership cost: $3,514
> Median rent, 3 bedrooms: $2,249
[recirclink id=395122]

23. Rockland County, New York
> Metro area: New York-Newark-Jersey City, NY-NJ-PA
> Avg. % of wage spent on housing: 58.4%
> Avg. monthly wage: $4,403
> Median home ownership cost: $2,677
> Median rent, 3 bedrooms: $2,293

22. Barnstable County, Massachusetts
> Metro area: Barnstable Town, MA
> Avg. % of wage spent on housing: 59.2%
> Avg. monthly wage: $3,781
> Median home ownership cost: $2,396
> Median rent, 3 bedrooms: $1,669
[in-text-ad-2]

21. San Diego County, California
> Metro area: San Diego-Carlsbad, CA
> Avg. % of wage spent on housing: 59.7%
> Avg. monthly wage: $4,870
> Median home ownership cost: $3,293
> Median rent, 3 bedrooms: $2,507

20. Contra Costa County, California
> Metro area: San Francisco-Oakland-Hayward, CA
> Avg. % of wage spent on housing: 60.3%
> Avg. monthly wage: $5,437
> Median home ownership cost: $3,280
> Median rent, 3 bedrooms: $3,251
[in-text-ad]

19. Nassau County, New York
> Metro area: New York-Newark-Jersey City, NY-NJ-PA
> Avg. % of wage spent on housing: 60.4%
> Avg. monthly wage: $5,012
> Median home ownership cost: $3,086
> Median rent, 3 bedrooms: $2,627
[recirclink id=400089]

18. Hawaii County, Hawaii
> Metro area: Hilo, HI
> Avg. % of wage spent on housing: 60.8%
> Avg. monthly wage: $3,497
> Median home ownership cost: $2,311
> Median rent, 3 bedrooms: $1,804
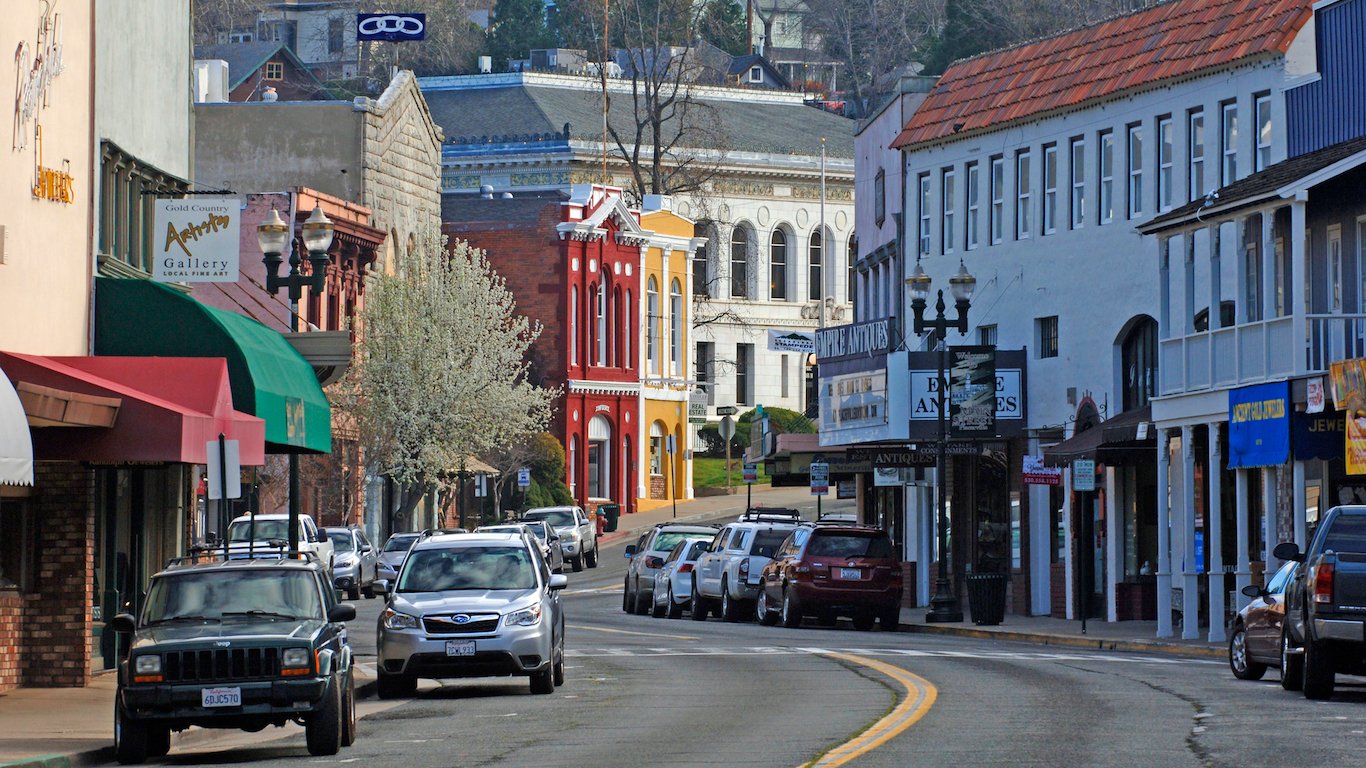
17. El Dorado County, California
> Metro area: Sacramento–Roseville–Arden-Arcade, CA
> Avg. % of wage spent on housing: 61.1%
> Avg. monthly wage: $3,910
> Median home ownership cost: $2,610
> Median rent, 3 bedrooms: $1,609
[in-text-ad-2]
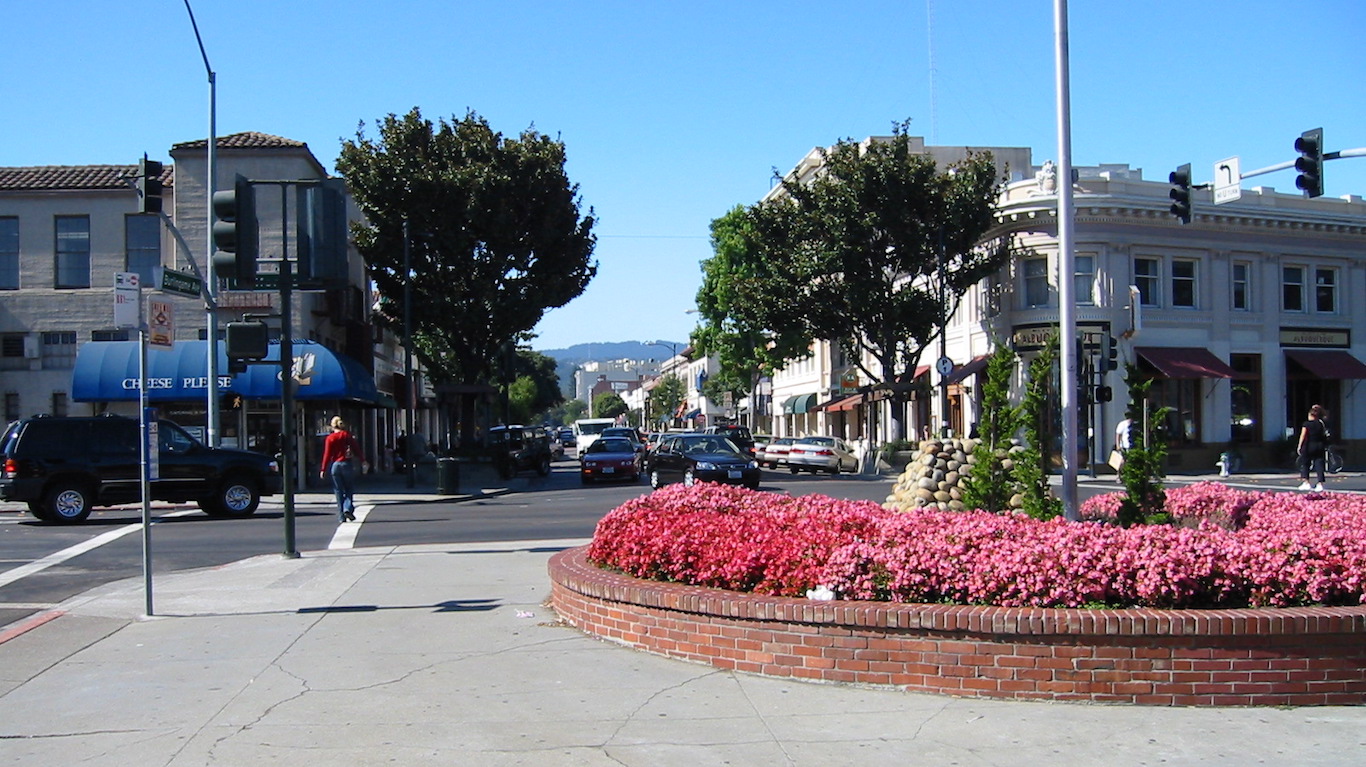
16. San Mateo County, California
> Metro area: San Francisco-Oakland-Hayward, CA
> Avg. % of wage spent on housing: 63.0%
> Avg. monthly wage: $8,947
> Median home ownership cost: $6,626
> Median rent, 3 bedrooms: $4,250

15. San Francisco County, California
> Metro area: San Francisco-Oakland-Hayward, CA
> Avg. % of wage spent on housing: 63.5%
> Avg. monthly wage: $8,356
> Median home ownership cost: $7,045
> Median rent, 3 bedrooms: $4,250
[in-text-ad]

14. Alameda County, California
> Metro area: San Francisco-Oakland-Hayward, CA
> Avg. % of wage spent on housing: 64.6%
> Avg. monthly wage: $5,910
> Median home ownership cost: $4,394
> Median rent, 3 bedrooms: $3,251
[recirclink id=395076]

13. Santa Barbara County, California
> Metro area: Santa Maria-Santa Barbara, CA
> Avg. % of wage spent on housing: 66.4%
> Avg. monthly wage: $4,243
> Median home ownership cost: $3,246
> Median rent, 3 bedrooms: $2,417

12. Queens County, New York
> Metro area: New York-Newark-Jersey City, NY-NJ-PA
> Avg. % of wage spent on housing: 69.5%
> Avg. monthly wage: $4,225
> Median home ownership cost: $3,782
> Median rent, 3 bedrooms: $2,293
[in-text-ad-2]
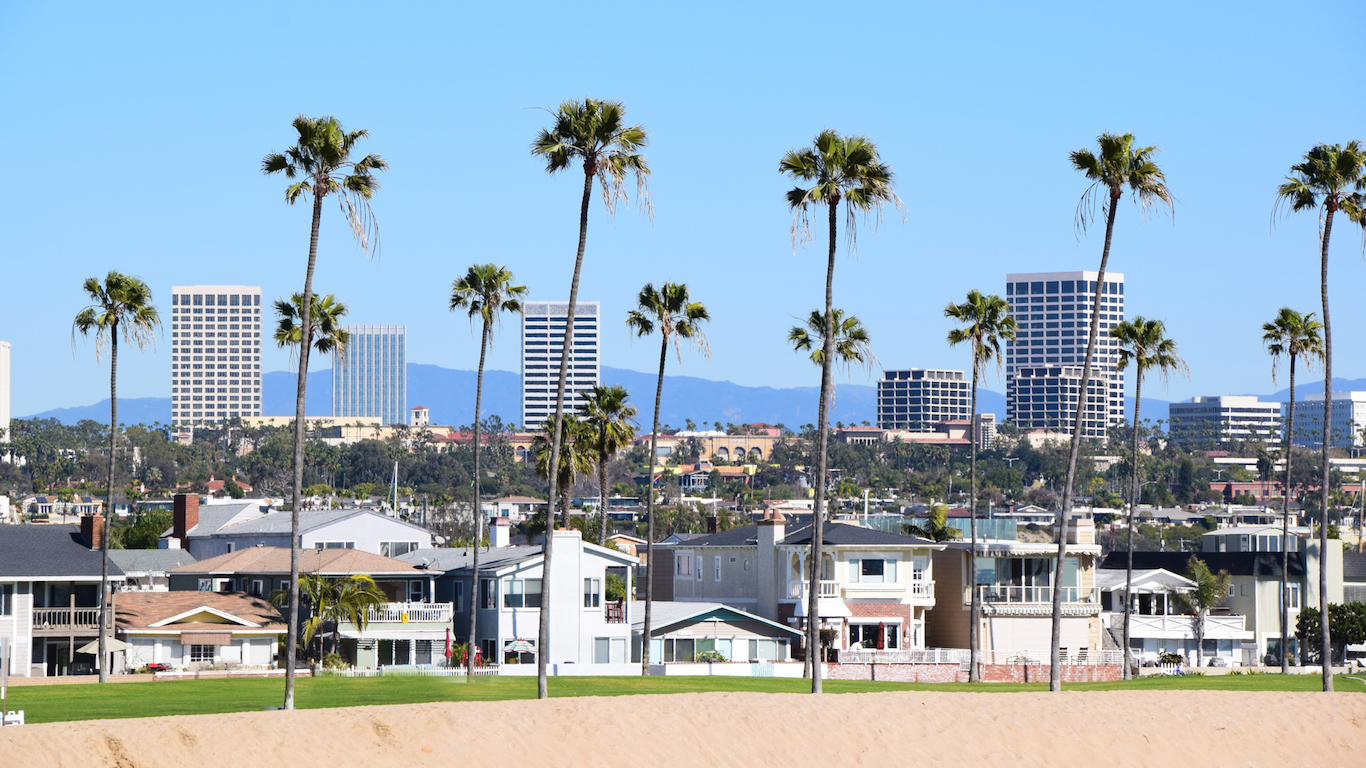
11. Orange County, California
> Metro area: Los Angeles-Long Beach-Anaheim, CA
> Avg. % of wage spent on housing: 70.7%
> Avg. monthly wage: $4,988
> Median home ownership cost: $4,150
> Median rent, 3 bedrooms: $2,722

10. Ventura County, California
> Metro area: Oxnard-Thousand Oaks-Ventura, CA
> Avg. % of wage spent on housing: 71.8%
> Avg. monthly wage: $4,499
> Median home ownership cost: $3,514
> Median rent, 3 bedrooms: $2,692
[in-text-ad]

9. Sonoma County, California
> Metro area: Santa Rosa, CA
> Avg. % of wage spent on housing: 73.2%
> Avg. monthly wage: $4,226
> Median home ownership cost: $3,564
> Median rent, 3 bedrooms: $2,449
[recirclink id=400089]

8. Monterey County, California
> Metro area: Salinas, CA
> Avg. % of wage spent on housing: 75.1%
> Avg. monthly wage: $3,787
> Median home ownership cost: $3,547
> Median rent, 3 bedrooms: $2,211

7. Honolulu County, Hawaii
> Metro area: Urban Honolulu, HI
> Avg. % of wage spent on housing: 75.2%
> Avg. monthly wage: $4,194
> Median home ownership cost: $3,461
> Median rent, 3 bedrooms: $2,885
[in-text-ad-2]

6. San Luis Obispo County, California
> Metro area: San Luis Obispo-Paso Robles-Arroyo Grande, CA
> Avg. % of wage spent on housing: 76.9%
> Avg. monthly wage: $3,703
> Median home ownership cost: $3,435
> Median rent, 3 bedrooms: $2,023

5. Kings County, New York
> Metro area: New York-Newark-Jersey City, NY-NJ-PA
> Avg. % of wage spent on housing: 78.4%
> Avg. monthly wage: $3,722
> Median home ownership cost: $4,518
> Median rent, 3 bedrooms: $2,293
[in-text-ad]

4. Napa County, California
> Metro area: Napa, CA
> Avg. % of wage spent on housing: 80.0%
> Avg. monthly wage: $4,358
> Median home ownership cost: $4,093
> Median rent, 3 bedrooms: $2,526
[recirclink id=395179]

3. Maui County, Hawaii
> Metro area: Kahului-Wailuku-Lahaina, HI
> Avg. % of wage spent on housing: 86.8%
> Avg. monthly wage: $3,606
> Median home ownership cost: $3,614
> Median rent, 3 bedrooms: $2,507

2. Santa Cruz County, California
> Metro area: Santa Cruz-Watsonville, CA
> Avg. % of wage spent on housing: 90.8%
> Avg. monthly wage: $3,977
> Median home ownership cost: $4,451
> Median rent, 3 bedrooms: $2,620
[in-text-ad-2]
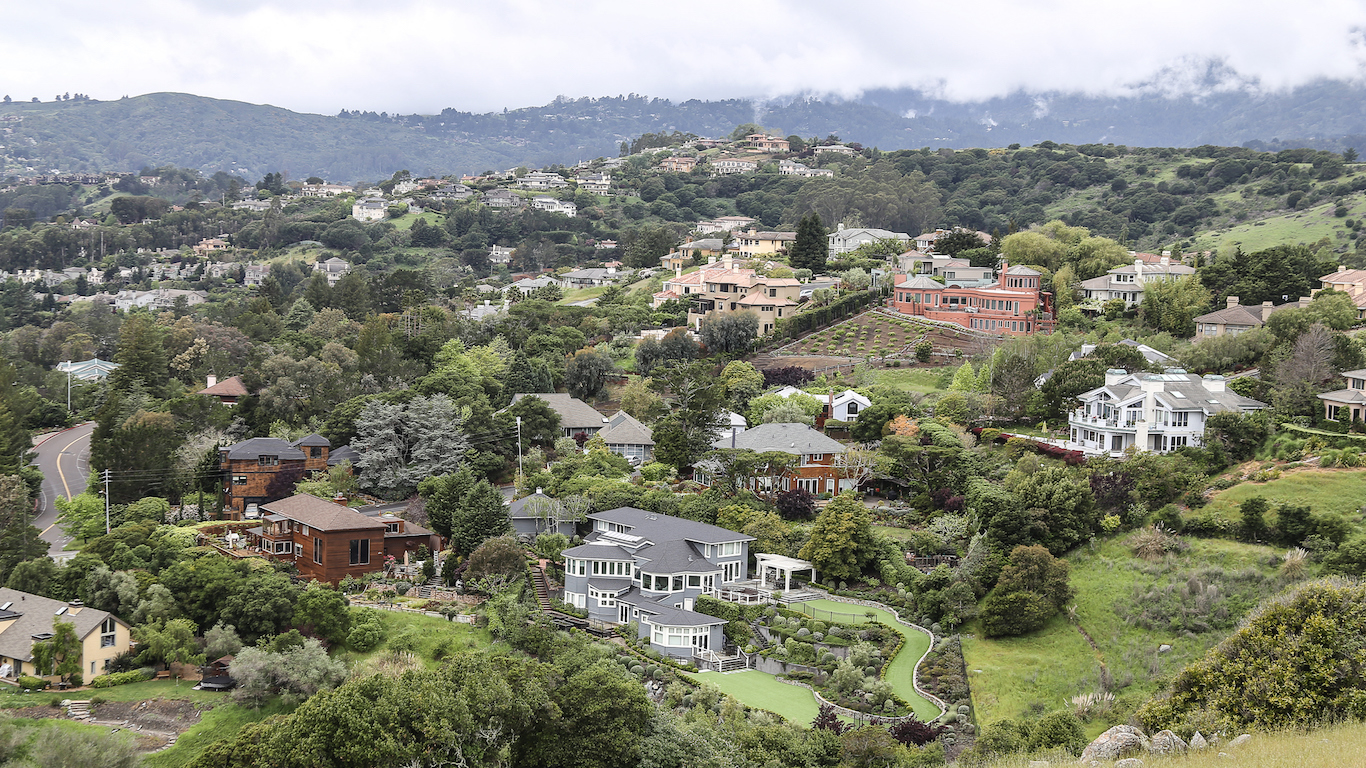
1. Marin County, California
> Metro area: San Francisco-Oakland-Hayward, CA
> Avg. % of wage spent on housing: 98.6%
> Avg. monthly wage: $5,554
> Median home ownership cost: $6,104
> Median rent, 3 bedrooms: $4,250
Detailed Findings & Methodology
While a resident can typically find an apartment to rent that is significantly cheaper than the average area rent, this is not necessarily true for buying a home. Cheap homes are rarely available in places like Manhattan or Silicon Valley, so owning a home is typically reserved for top earners. In San Francisco, for example, most of the 290 homes purchased in the first quarter of 2017 sold for more than $1,000,000. This is completely out of reach for someone earning the average area monthly wage of $8,200.
Housing costs generally reflect the desirability of an area, and while expensive markets can be a downside for residents, they can be indicative of a nice place to live with a strong economy and job market. In the vast majority of these markets, higher education is common, unemployment and poverty rates are low, and life expectancy is high.
While these areas are the least affordable housing markets in America, they are all more affordable today than they were just before the mortgage crisis.
To identify the least affordable housing markets, 24/7 Wall St. reviewed home and rental affordability for 379 U.S. counties with at least 100 home sales in the first quarter of 2017 based on an analysis of U.S. Department of Housing and Urban Development data by ATTOM Data Solutions. We calculated an average of the homeownership and rental affordability measures in each county, weighted by the percentages of owner- and renter-occupied housing units in the area.
Monthly homeownership costs, median fair market rent and wage data also came from ATTOM. Median homeownership cost is the monthly house payment for a median-priced home (based on a 3% down payment and including mortgage, property tax, homeowner’s insurance and private mortgage insurance.)
Contact [email protected] for any questions or corrections.