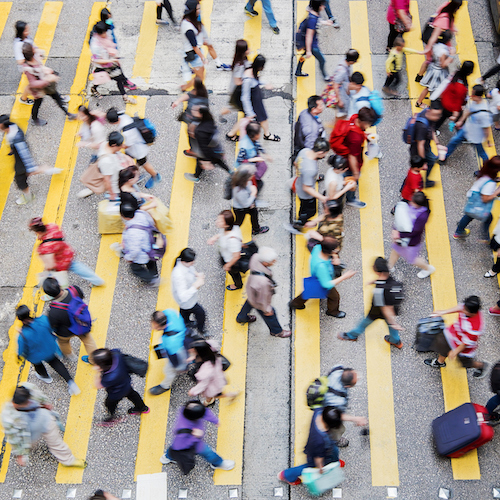
[cnxvideo id=”655225″ placement=”ros”]If the world’s population were evenly distributed across the globe, each of Earth’s 7.4 billion human beings would have approximately 150 square miles to him- or herself. But humans have lived in cities for more than 10,000 years, and many aspects of modern life depend on high-density development. By 2050, 66% of the world’s population will live in an urban area, an increase from 54% today.
In many of the densest countries in the world, 100% of the population lives in an urban area. Small countries such as Macao, Monaco, and Gibraltar have experienced massive population growth over the past several decades, yet the total land area of the three nations is smaller than the island of Manhattan. As a result, these countries’ populations have had to concentrate in high-density cities. Meanwhile, countries such as Namibia, Mongolia, and Greenland are covered in wide swathes of uninhabitable land, and as a result have the smallest ratios of people-to-land area in the world.
To determine the most and least crowded countries in the world, 24/7 Wall St. reviewed the population density of 215 countries with data from the World Bank. Population density is defined as the number of people per square mile of land area within a country. There are 25 countries with a population density of at least 1,100 people per square mile, and 25 countries with fewer than 42 people per square mile.
Click here to see the most crowded countries in the world.
Click here to see the least crowded countries in the world.
Click here to see our detailed findings and methodology.
The Most Crowded Countries in the World
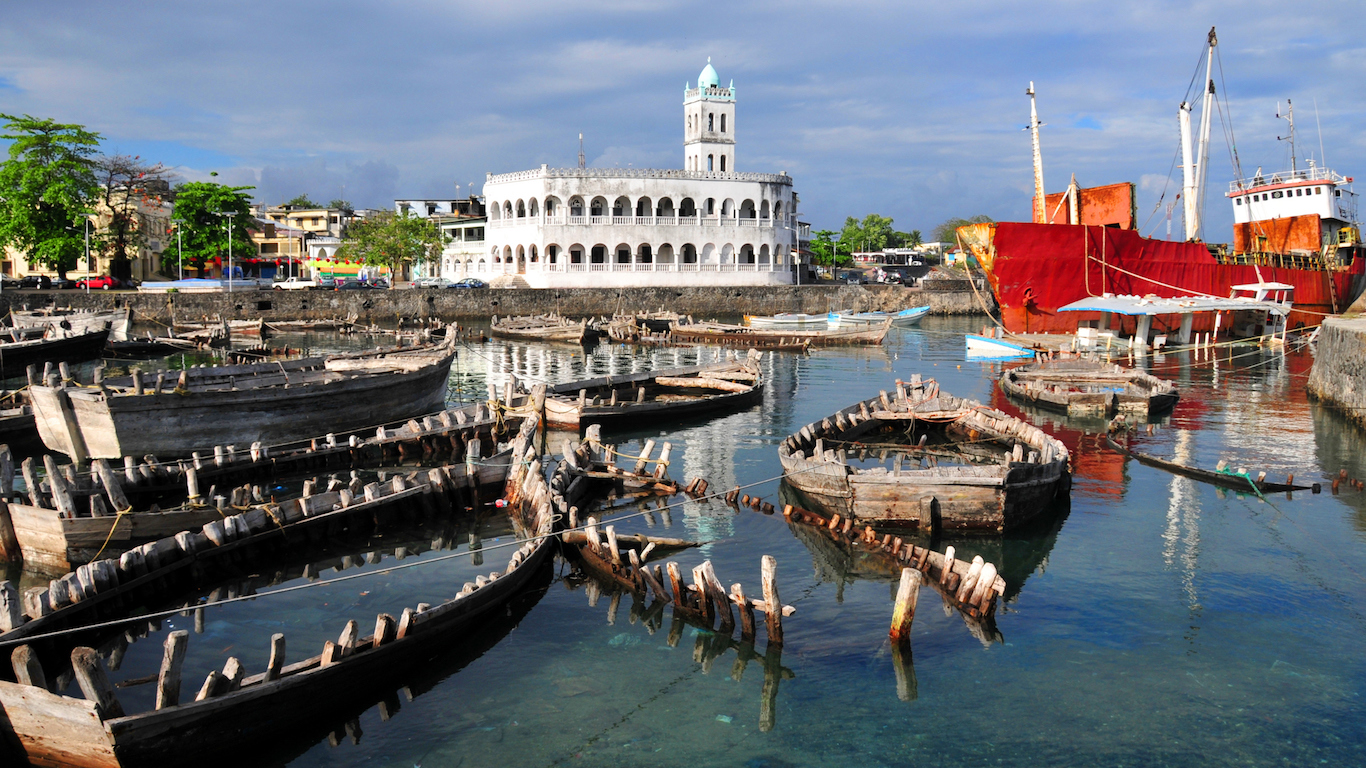
25. Comoros
> People per square mile: 1,107.3
> Population: 795,601
> Land area: 718.5 square miles
> 25-yr. population change: 87.7%
[in-text-ad]
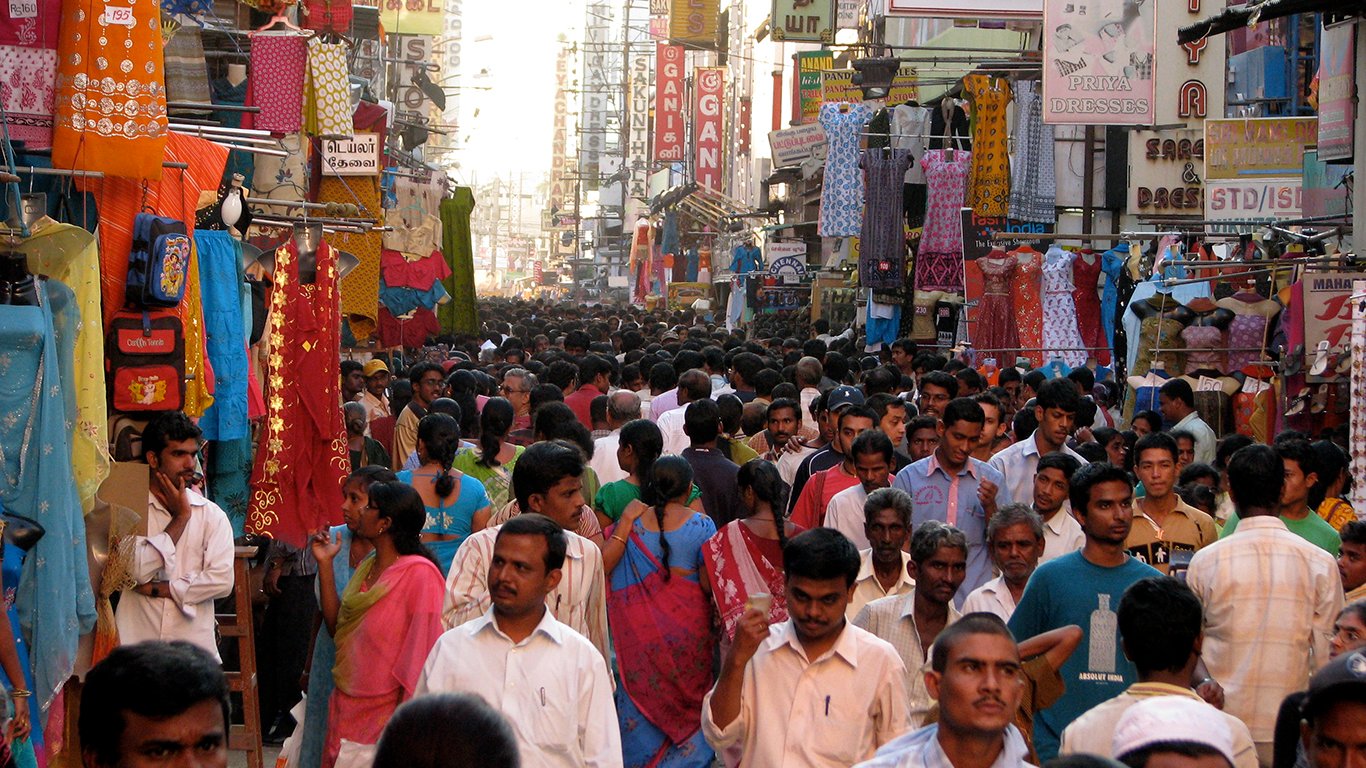
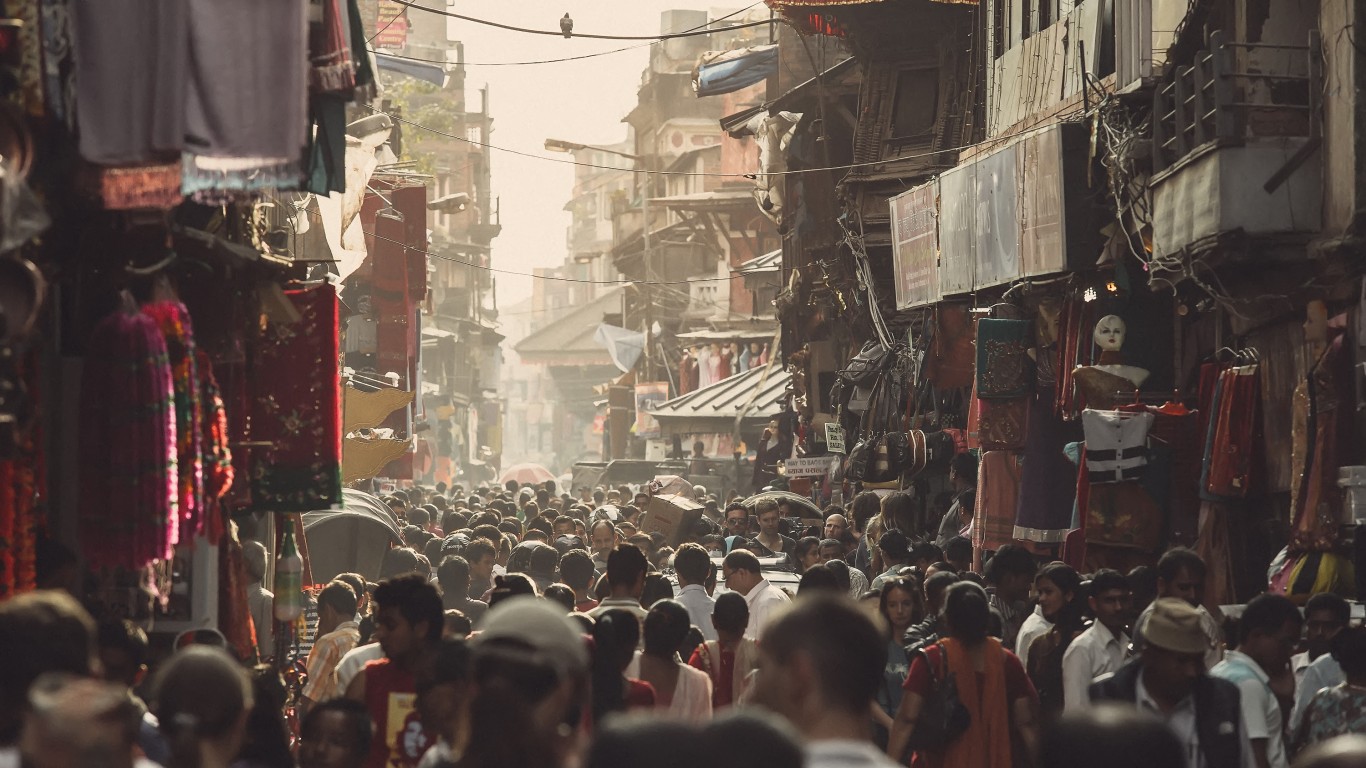
24. India
> People per square mile: 1,153.5
> Population: 1.3 billion
> Land area: 1.1 million square miles
> 25-yr. population change: 49.1%
[recirclink id=405297]
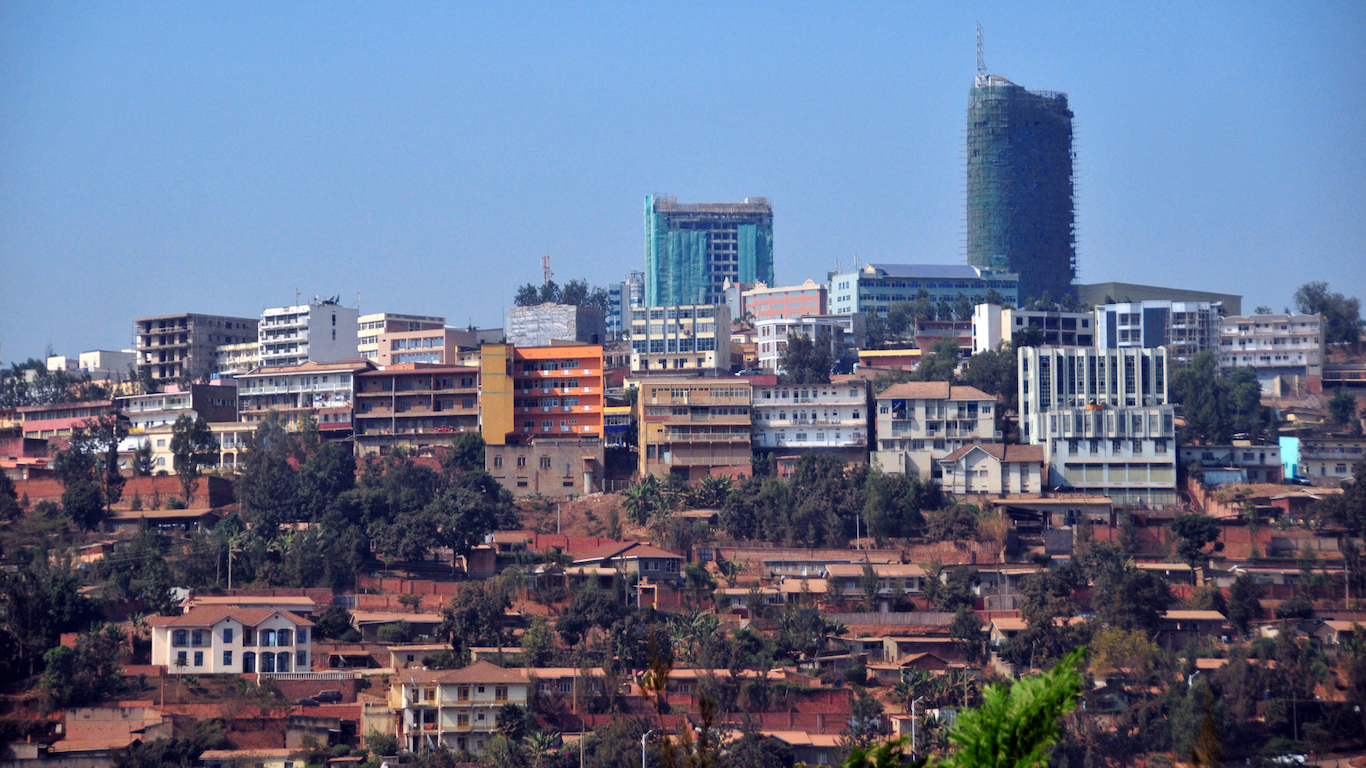
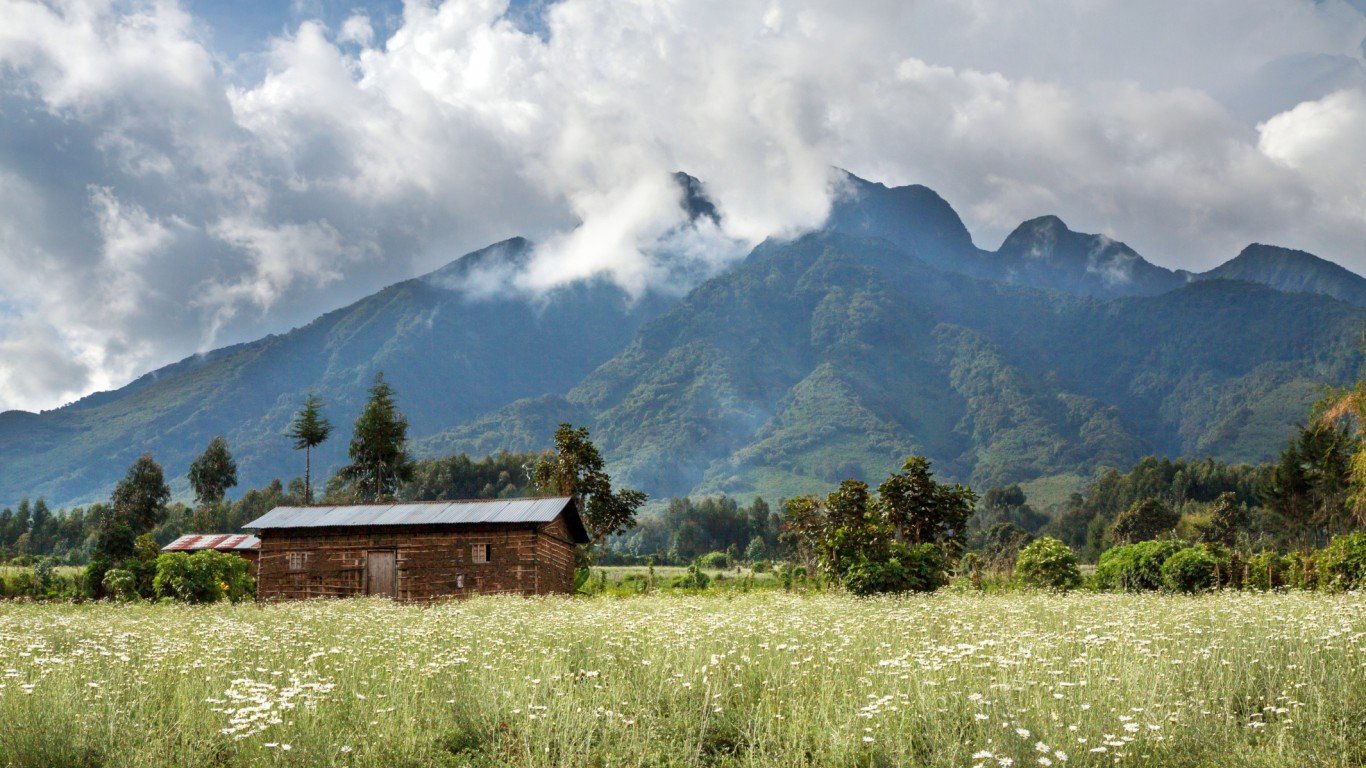
23. Rwanda
> People per square mile: 1,251.2
> Population: 11.9 million
> Land area: 9,525.1 square miles
> 25-yr. population change: 69.0%
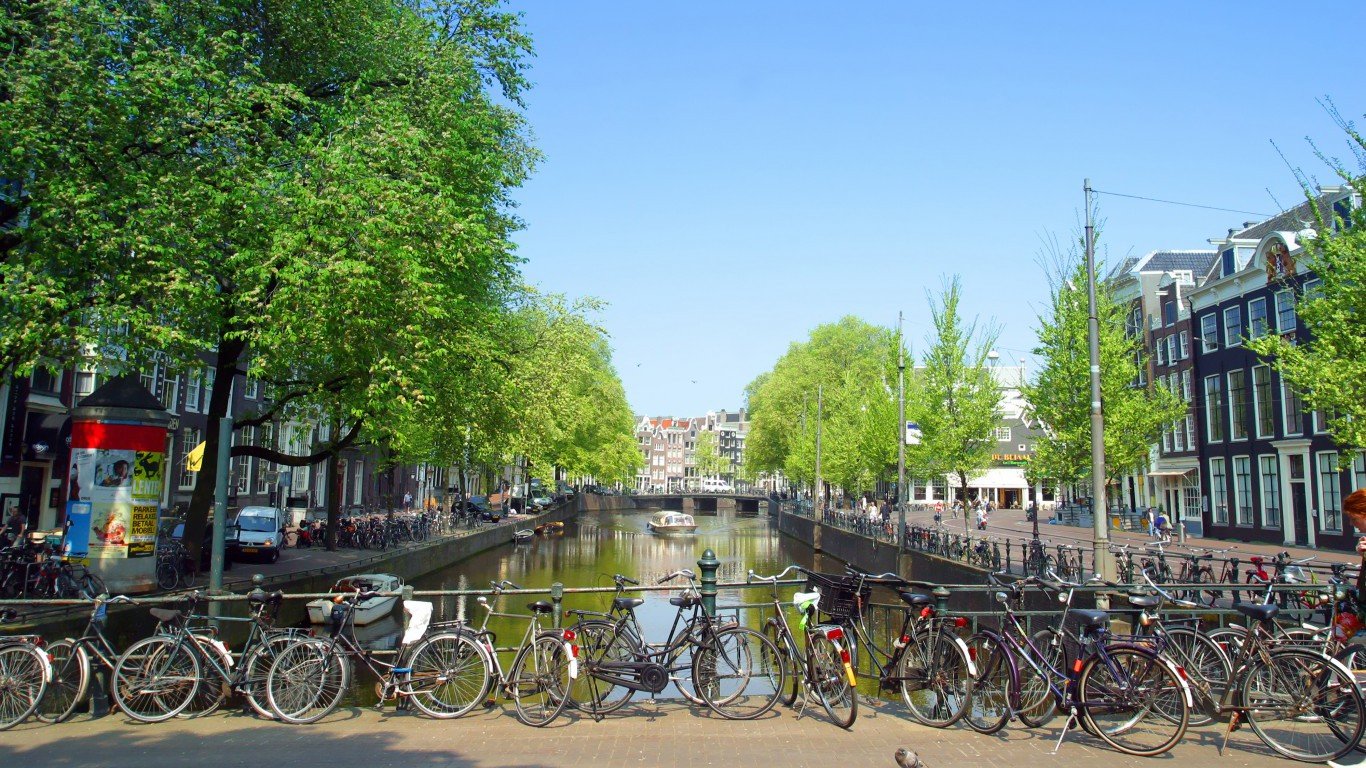
22. Netherlands
> People per square mile: 1,308.3
> Population: 17.0 million
> Land area: 13,007.8 square miles
> 25-yr. population change: 12.9%
[in-text-ad-2]

21. South Korea
> People per square mile: 1,361.6
> Population: 51.2 million
> Land area: 37,637.2 square miles
> 25-yr. population change: 18.4%

20. San Marino
> People per square mile: 1,433.3
> Population: 33,203
> Land area: 23.2 square miles
> 25-yr. population change: 36.2%
[in-text-ad]
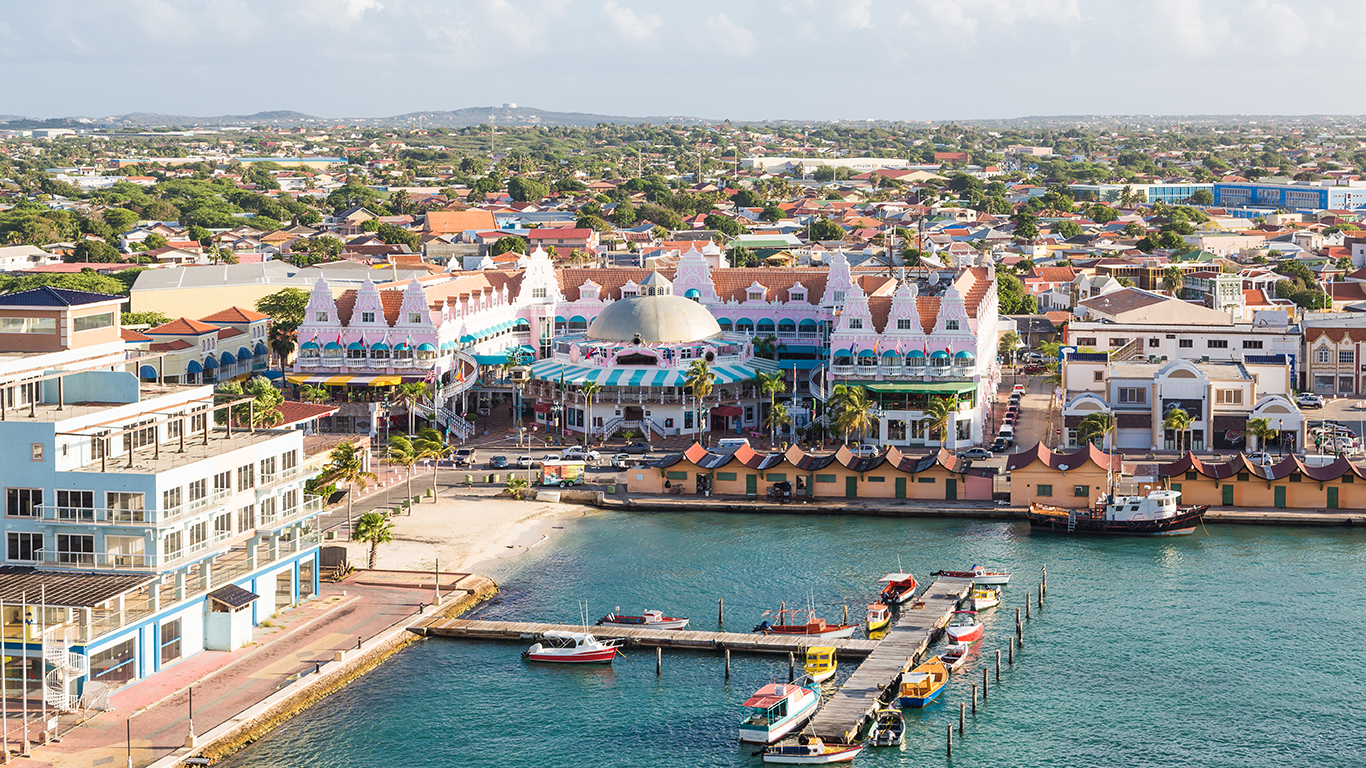
19. Aruba
> People per square mile: 1,508.3
> Population: 104,822
> Land area: 69.5 square miles
> 25-yr. population change: 62.2%
[recirclink id=404324]
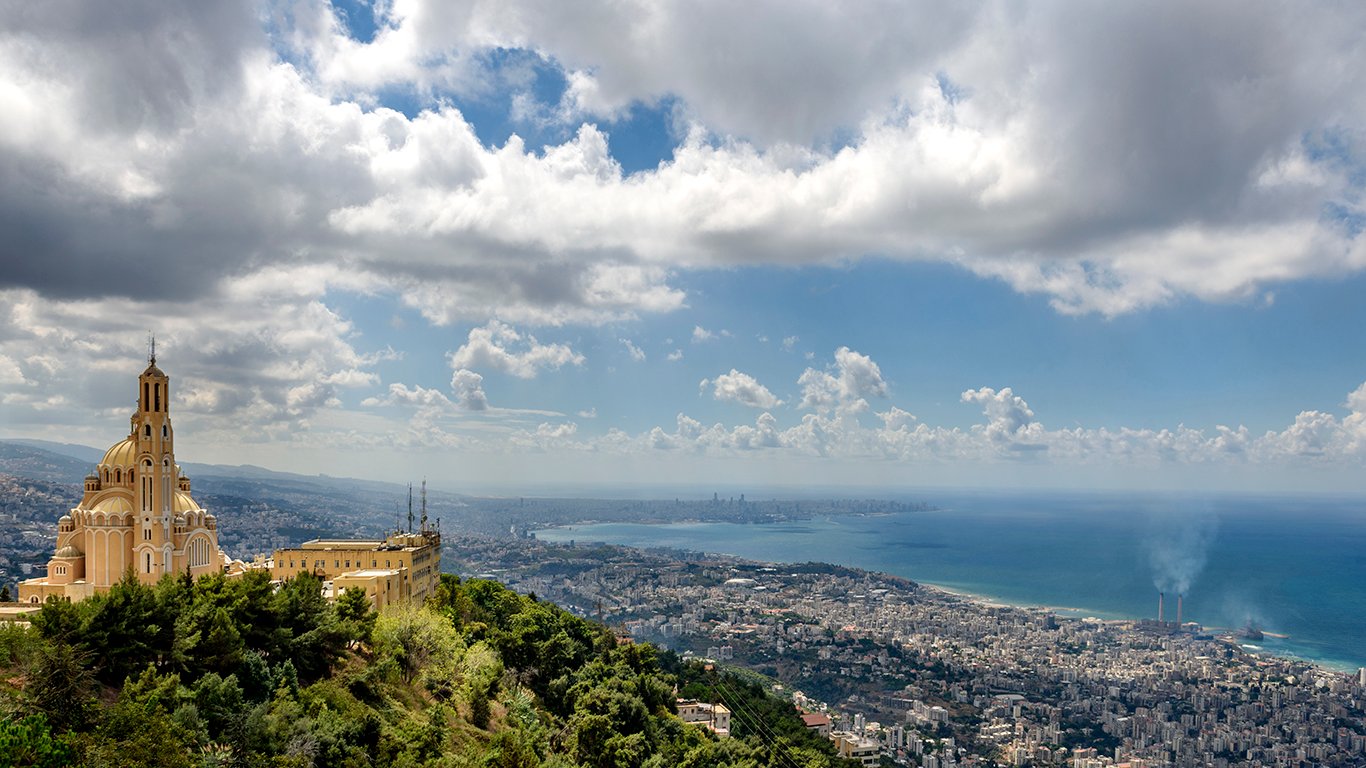
18. Lebanon
> People per square mile: 1,520.7
> Population: 6.0 million
> Land area: 3,949.8 square miles
> 25-yr. population change: 118.2%
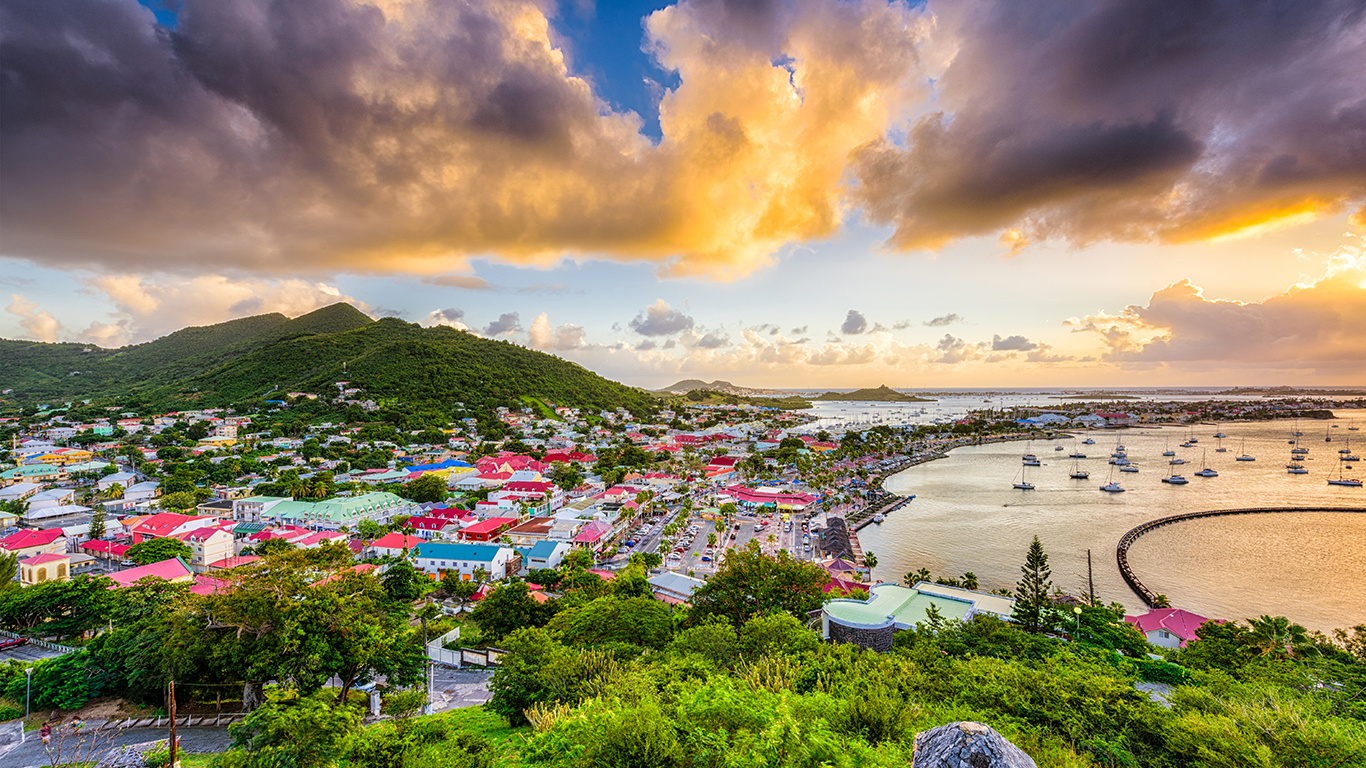
17. St. Martin (French part)
> People per square mile: 1,521.1
> Population: 31,949
> Land area: 21.0 square miles
> 25-yr. population change: 0.4%
[in-text-ad-2]
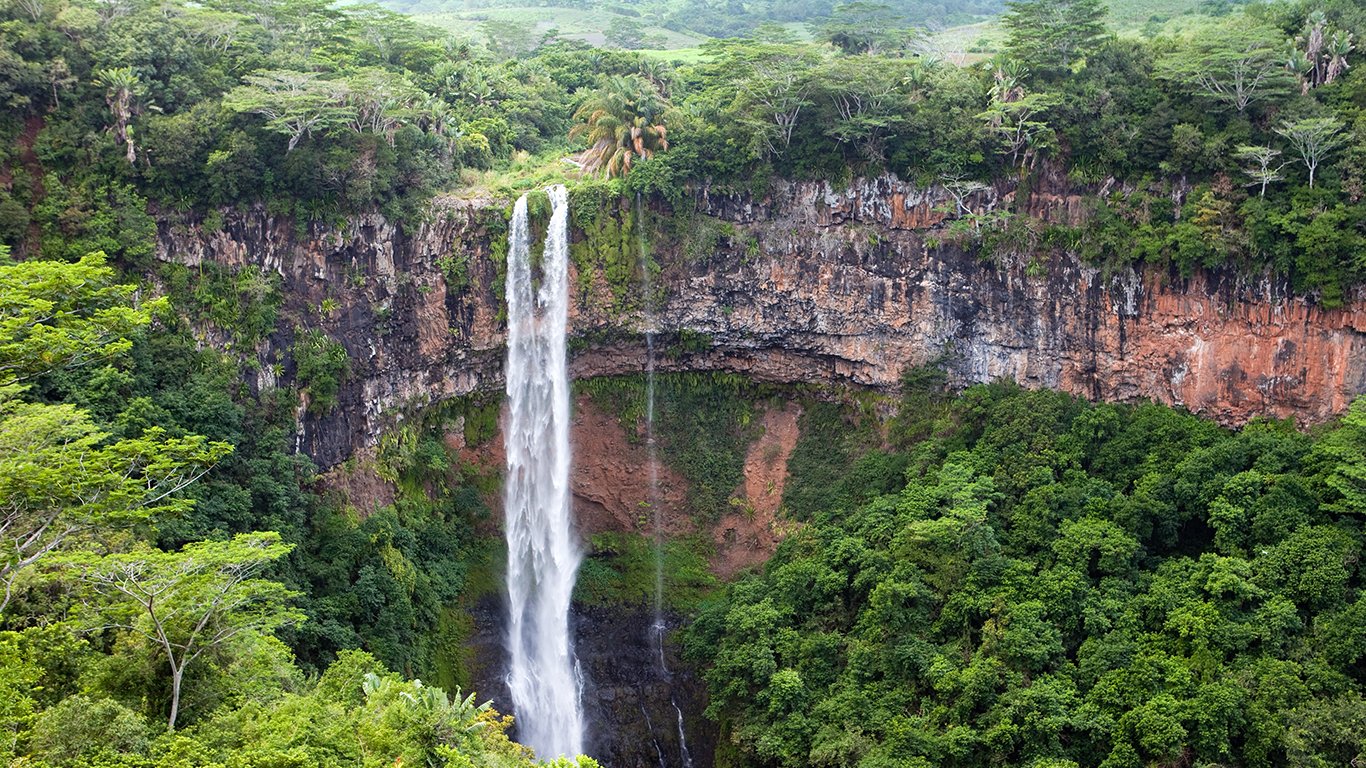
16. Mauritius
> People per square mile: 1,612.0
> Population: 1.3 million
> Land area: 783.8 square miles
> 25-yr. population change: 18.1%
15. Nauru
> People per square mile: 1,689.8
> Population: 13,049
> Land area: 7.7 square miles
> 25-yr. population change: 39.5%
[in-text-ad]

14. Barbados
> People per square mile: 1,716.6
> Population: 284,996
> Land area: 166.0 square miles
> 25-yr. population change: 9.1%
[recirclink id=404837]
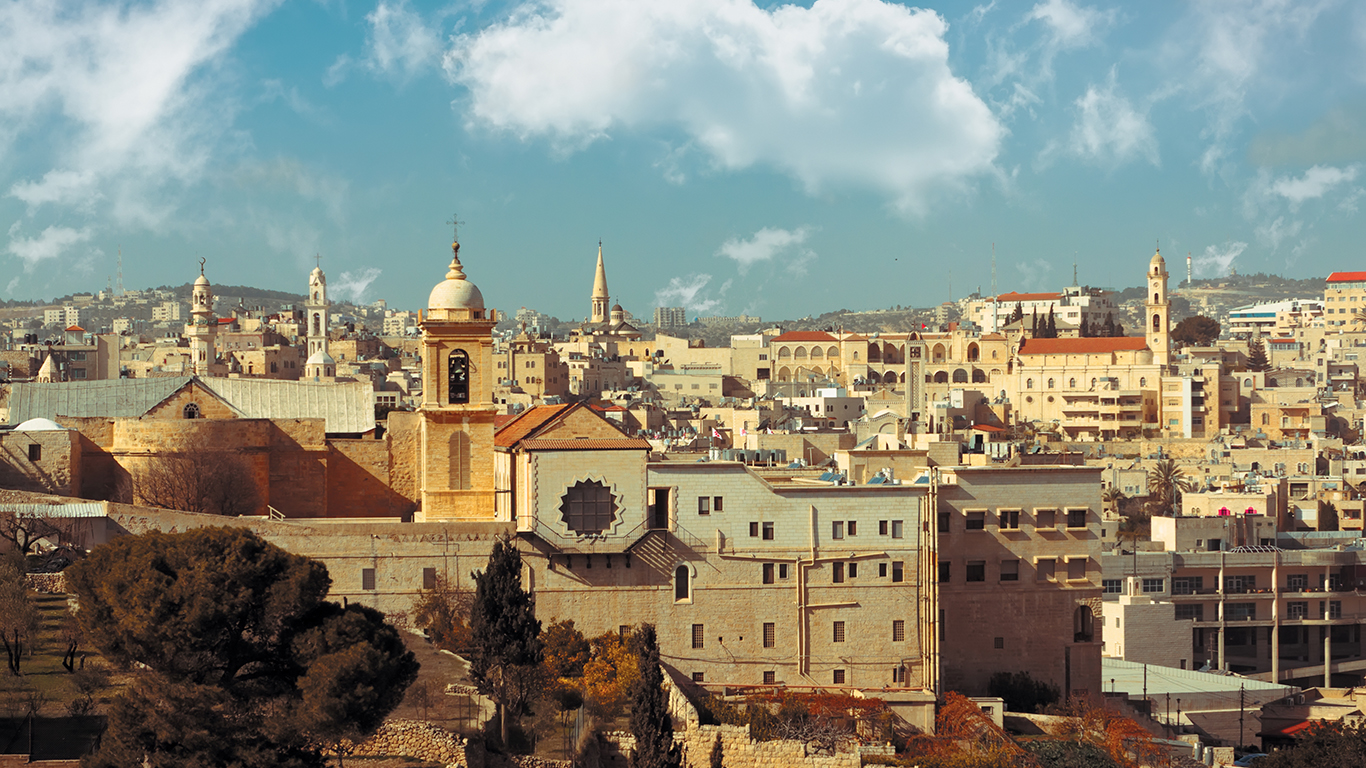
13. West Bank and Gaza
> People per square mile: 1,958.2
> Population: 4.6 million
> Land area: 2,324.3 square miles
> 25-yr. population change: 120.0%
12. Channel Islands
> People per square mile: 2,242.9
> Population: 164,541
> Land area: 73.4 square miles
> 25-yr. population change: 16.2%
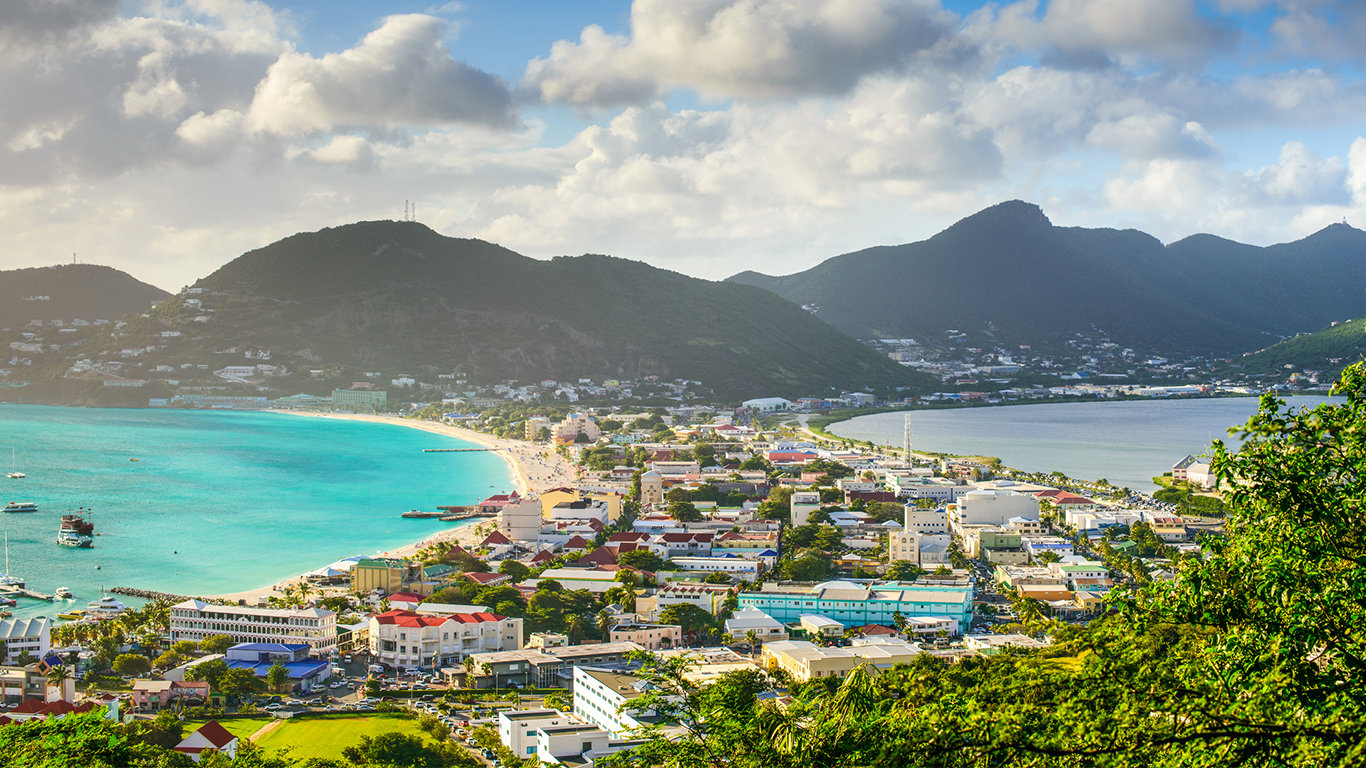
11. Sint Maarten (Dutch part)
> People per square mile: 3,047.4
> Population: 40,005
> Land area: 13.1 square miles
> 25-yr. population change: 0.0%
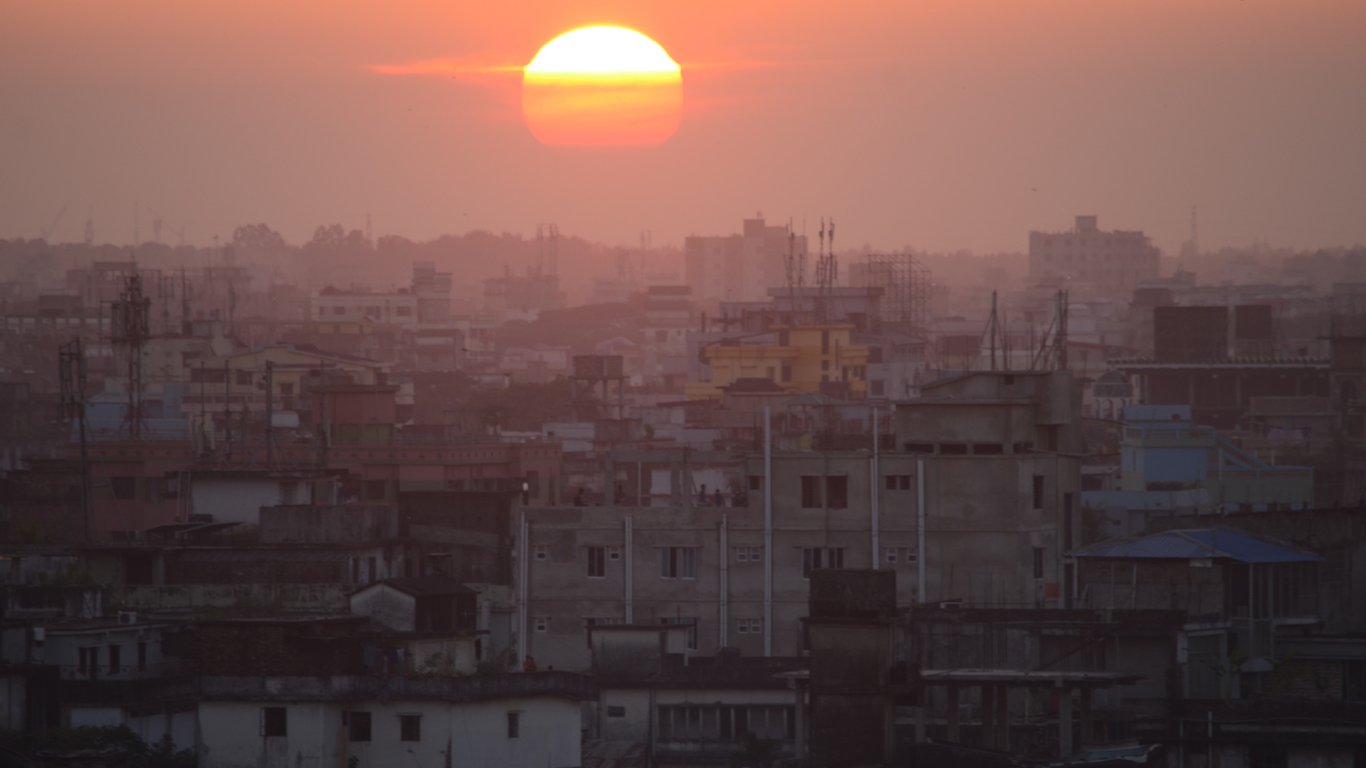
10. Bangladesh
> People per square mile: 3,242.2
> Population: 163.0 million
> Land area: 50,258.9 square miles
> 25-yr. population change: 49.9%
[in-text-ad]

9. Bermuda
> People per square mile: 3,384.1
> Population: 65,331
> Land area: 19.3 square miles
> 25-yr. population change: 10.7%
[recirclink id=404324]
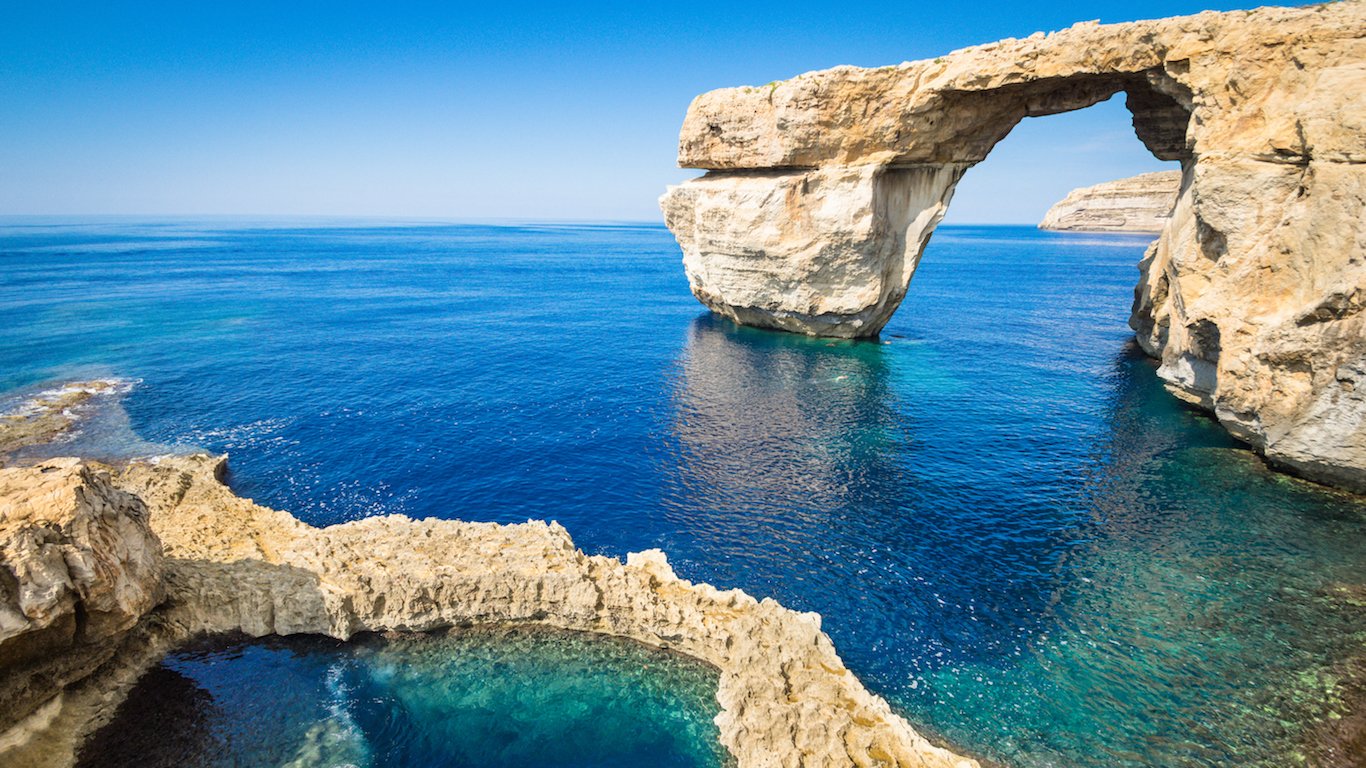
8. Malta
> People per square mile: 3,536.5
> Population: 436,947
> Land area: 123.6 square miles
> 25-yr. population change: 20.1%

7. Maldives
> People per square mile: 3,604.3
> Population: 417,492
> Land area: 115.8 square miles
> 25-yr. population change: 83.9%
[in-text-ad-2]
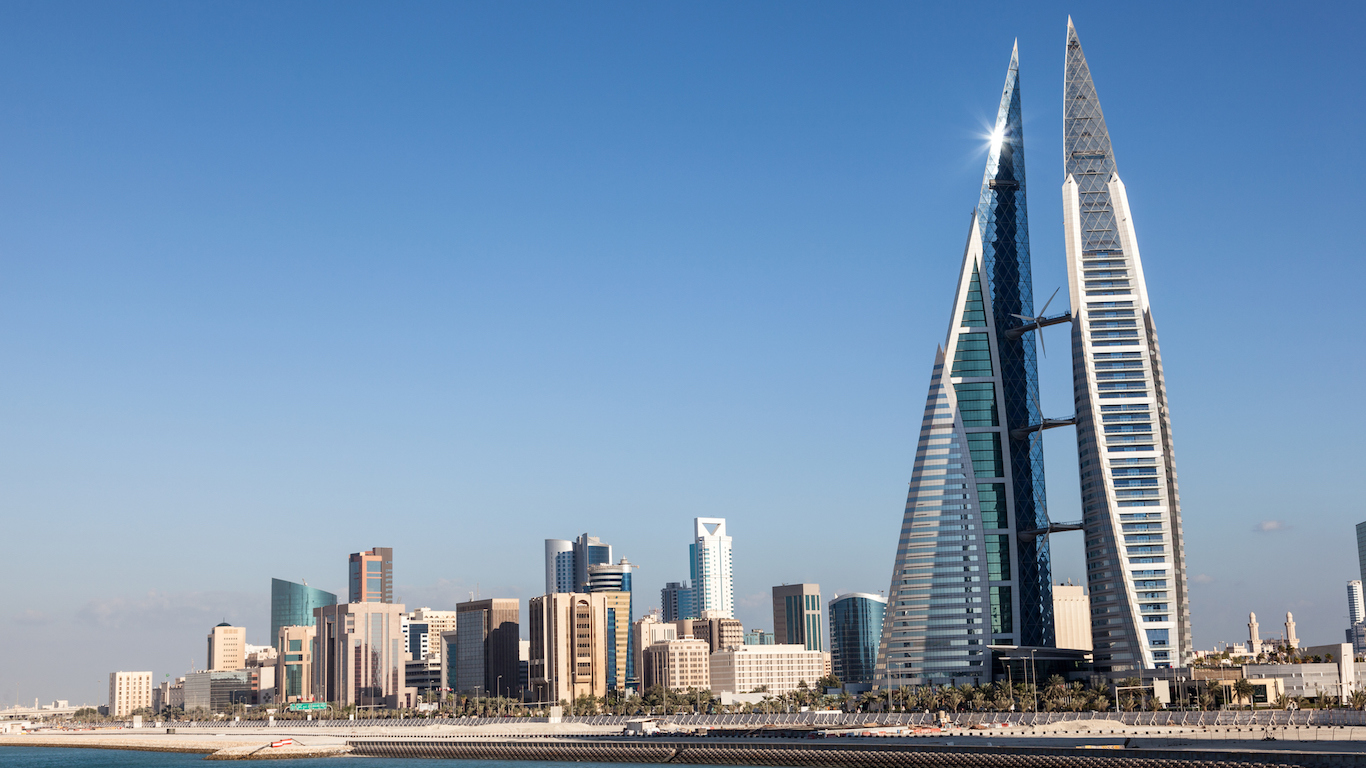
6. Bahrain
> People per square mile: 4,787.5
> Population: 1.4 million
> Land area: 297.7 square miles
> 25-yr. population change: 179.6%
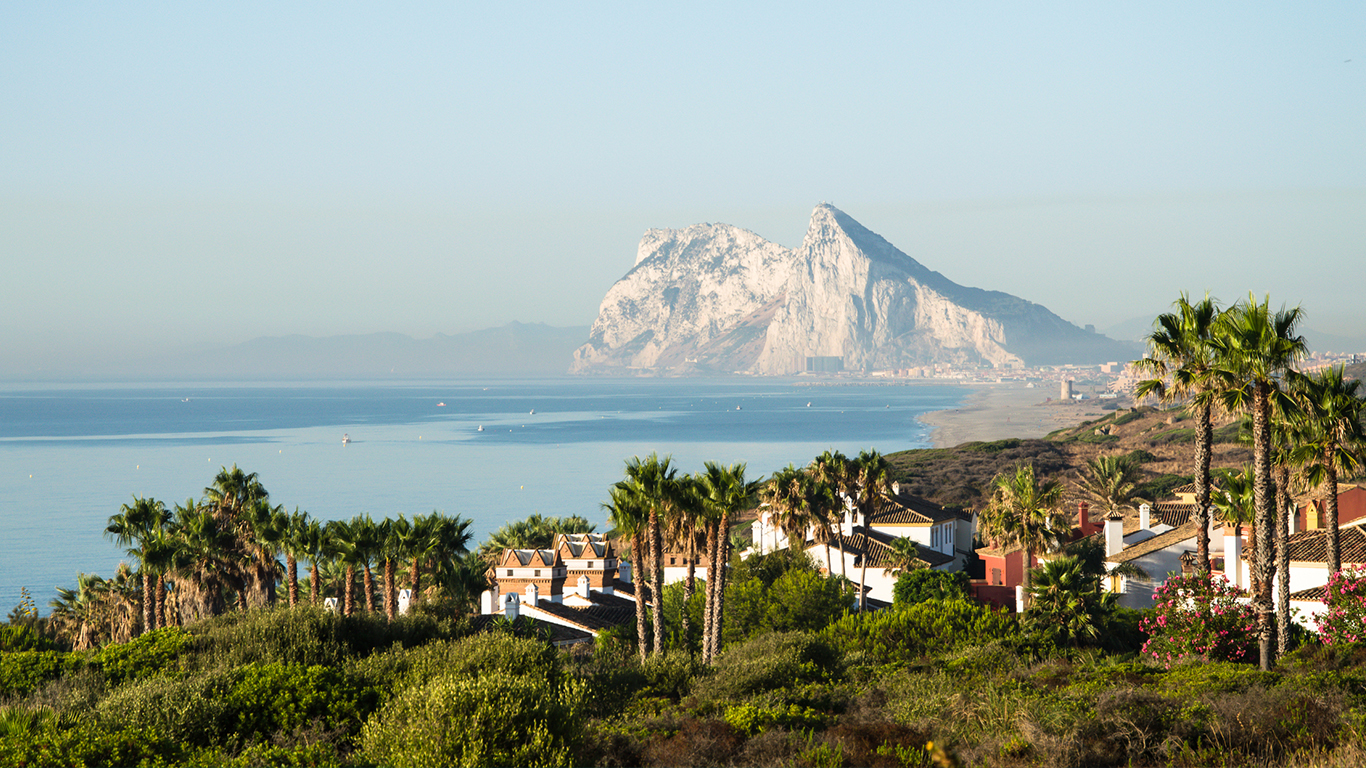
5. Gibraltar
> People per square mile: 8,911.6
> Population: 34,408
> Land area: 3.9 square miles
> 25-yr. population change: 17.8%
[in-text-ad]

4. Hong Kong SAR, China
> People per square mile: 18,121.8
> Population: 7.3 million
> Land area: 405.4 square miles
> 25-yr. population change: 27.7%
[recirclink id=405409]

3. Singapore
> People per square mile: 20,483.5
> Population: 5.6 million
> Land area: 273.7 square miles
> 25-yr. population change: 78.9%

2. Monaco
> People per square mile: 49,856.0
> Population: 38,499
> Land area: 0.8 square miles
> 25-yr. population change: 30.0%
[in-text-ad-2]

1. Macao SAR, China
> People per square mile: 52,326.9
> Population: 612,167
> Land area: 11.7 square miles
> 25-yr. population change: 73.0%
The Least Crowded Countries in the World
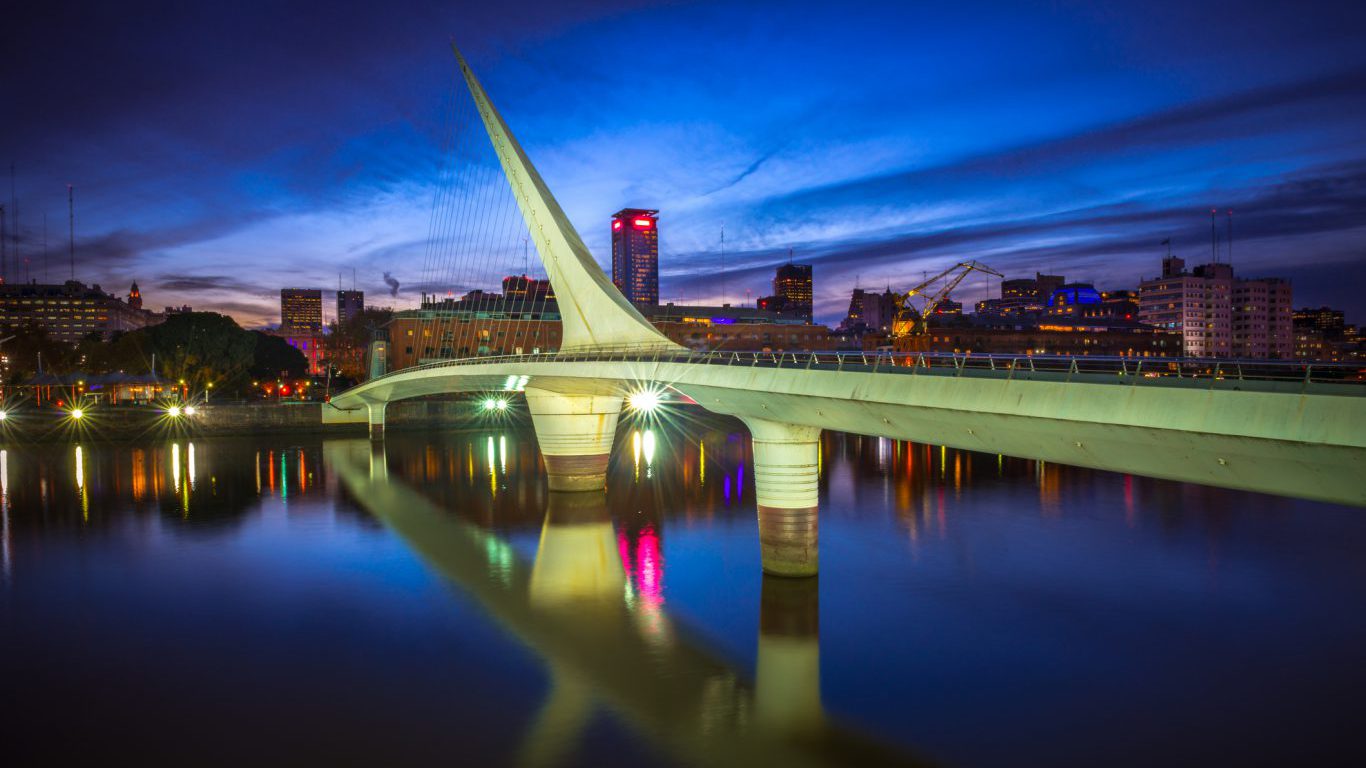
25. Argentina
> People per square mile: 41.5
> Population: 43.8 million
> Land area: 1.1 million square miles
> 25-yr. population change: 32.1%
[in-text-ad]
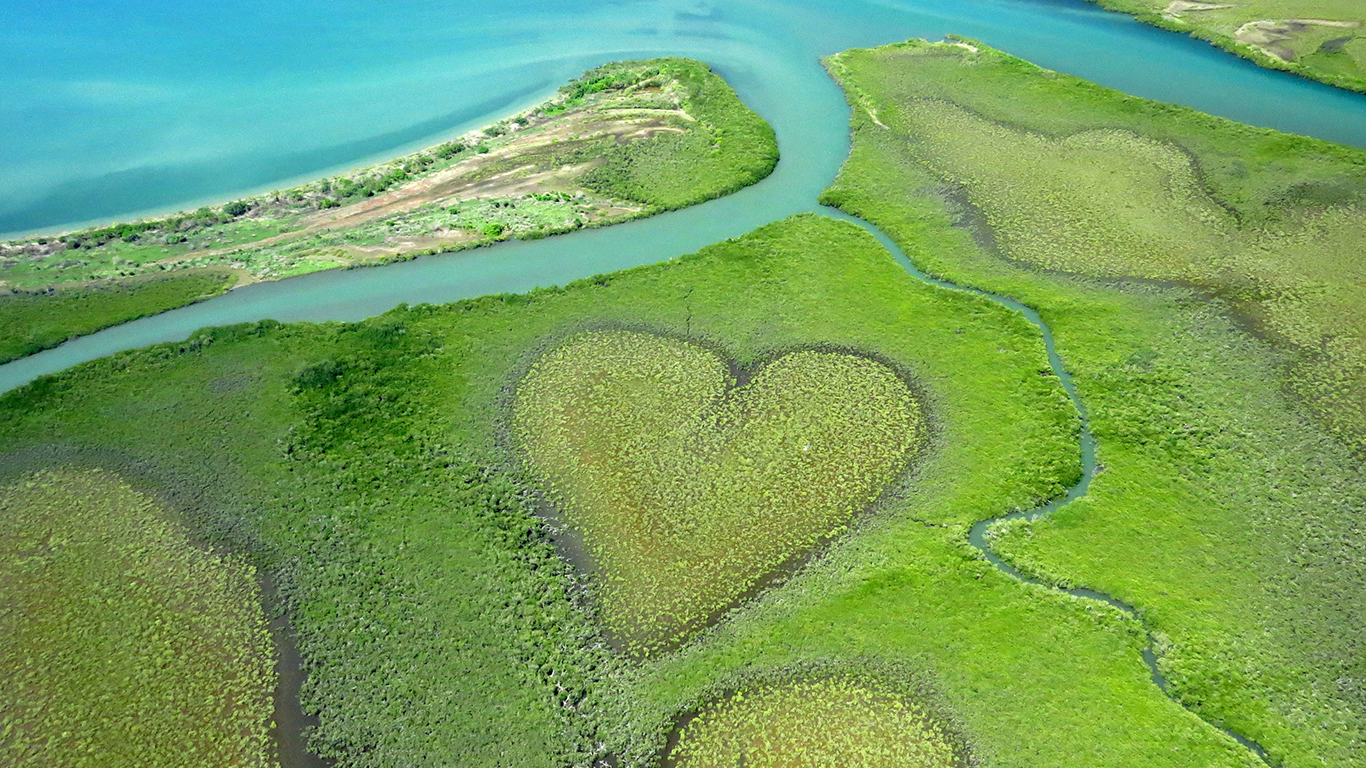
24. New Caledonia
> People per square mile: 39.4
> Population: 278,000
> Land area: 7,057.9 square miles
> 25-yr. population change: 58.5%
[recirclink id=404324]
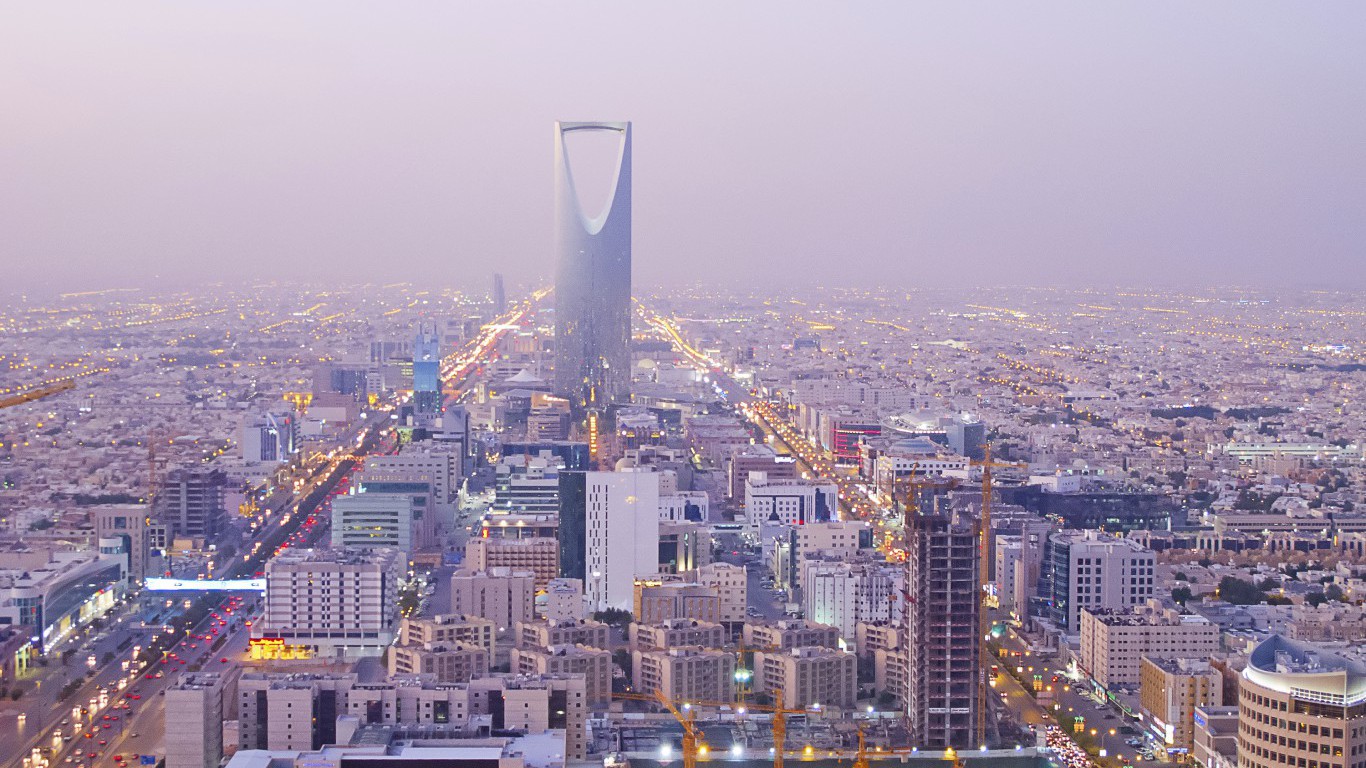
23. Saudi Arabia
> People per square mile: 38.9
> Population: 32.3 million
> Land area: 829,999.6 square miles
> 25-yr. population change: 91.3%
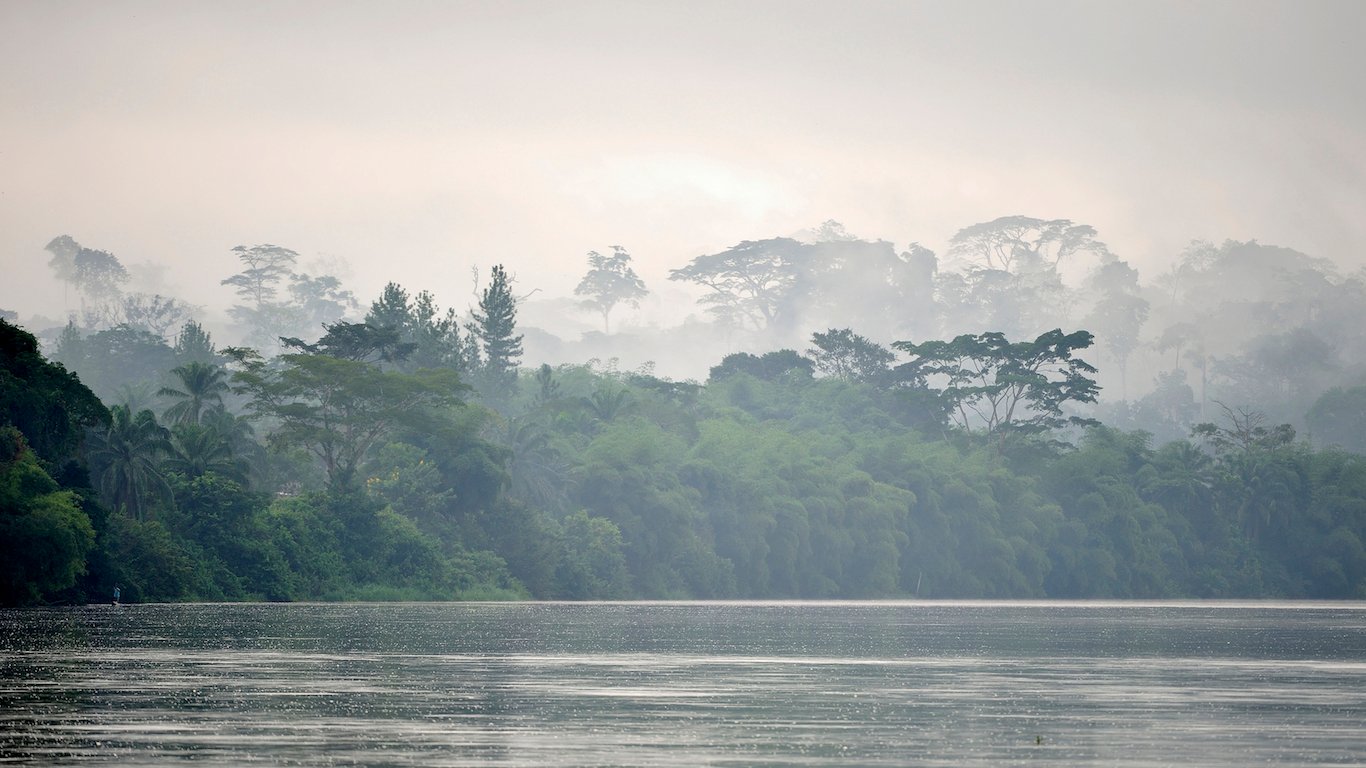
22. Congo
> People per square mile: 38.9
> Population: 5.1 million
> Land area: 131,853.8 square miles
> 25-yr. population change: 104.4%
[in-text-ad-2]
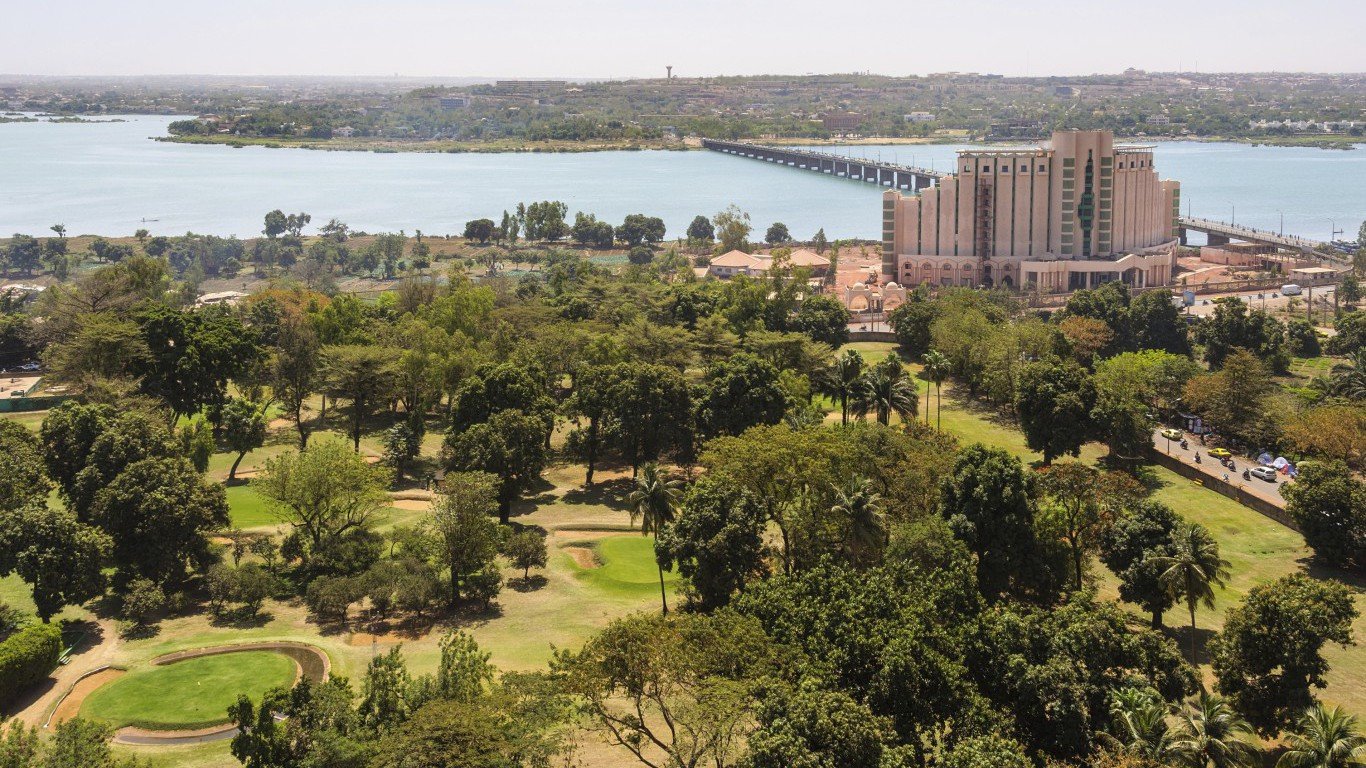
21. Mali
> People per square mile: 38.2
> Population: 18.0 million
> Land area: 471,117.8 square miles
> 25-yr. population change: 108.0%
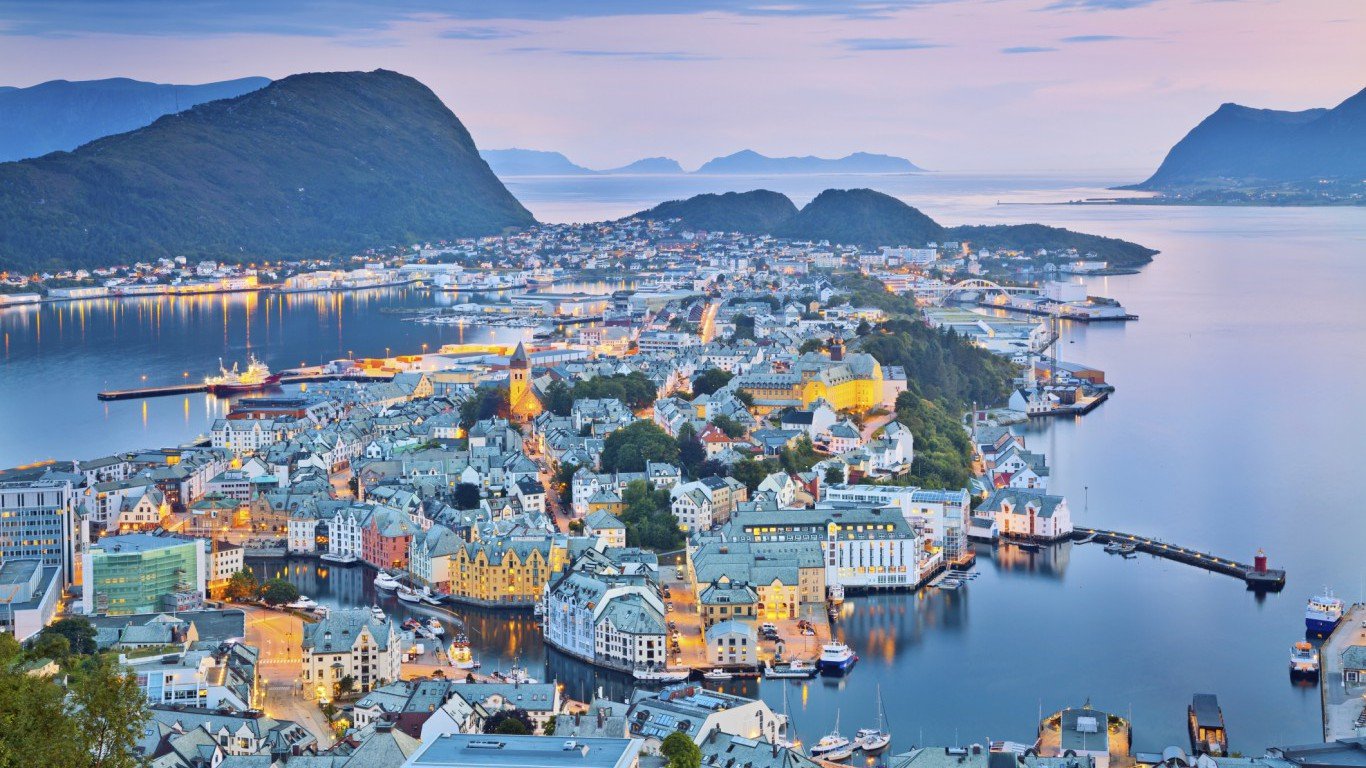
20. Norway
> People per square mile: 37.1
> Population: 5.2 million
> Land area: 141,021.8 square miles
> 25-yr. population change: 22.8%
[in-text-ad]
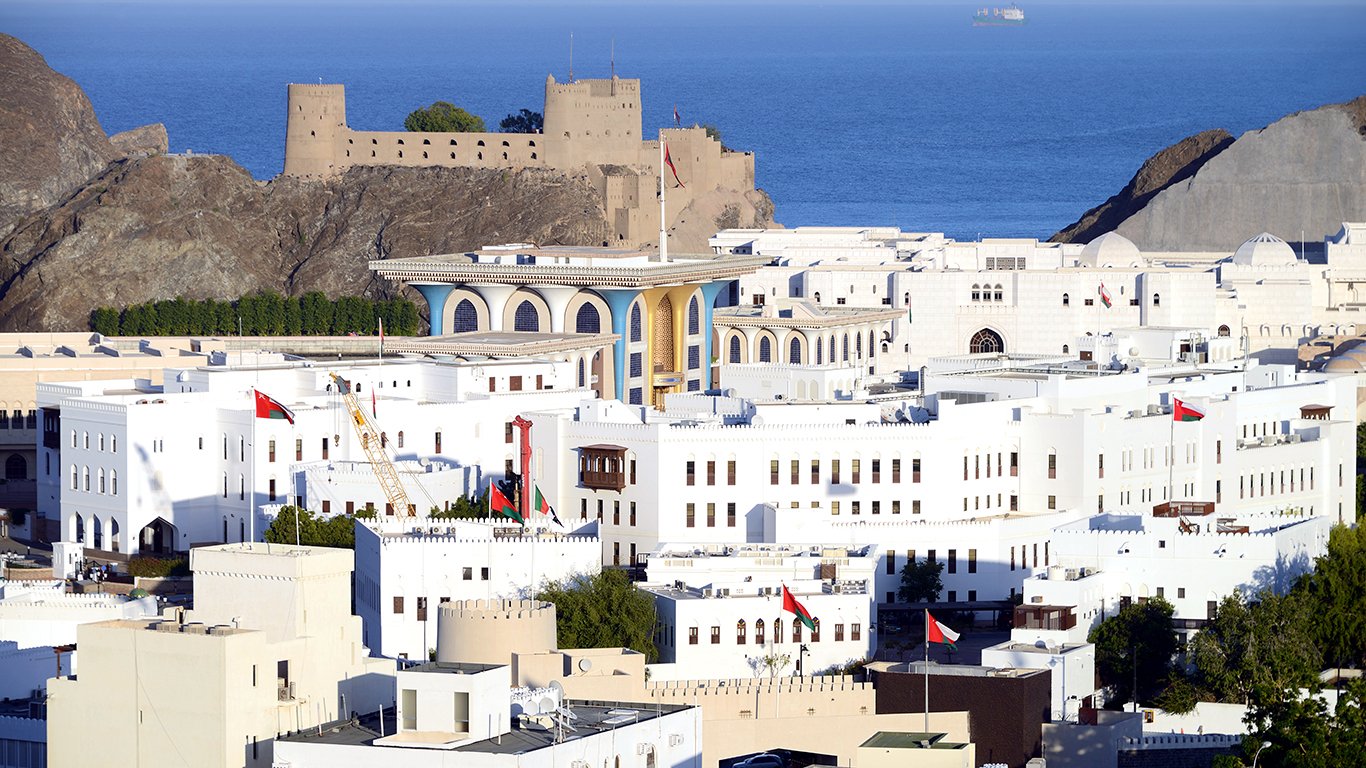
19. Oman
> People per square mile: 37.0
> Population: 4.4 million
> Land area: 119,498.6 square miles
> 25-yr. population change: 133.6%
[recirclink id=405048]
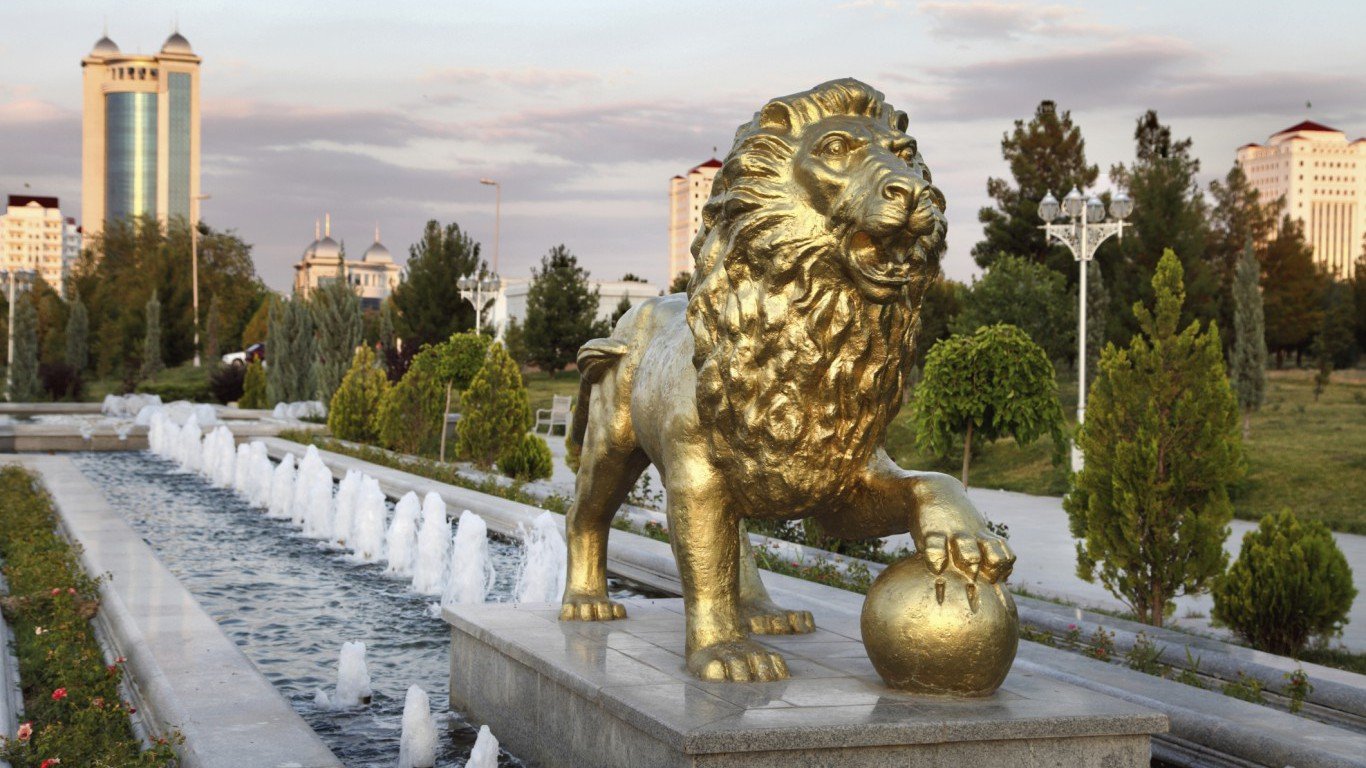
18. Turkmenistan
> People per square mile: 31.2
> Population: 5.7 million
> Land area: 181,440.9 square miles
> 25-yr. population change: 49.4%
17. Chad
> People per square mile: 29.7
> Population: 14.5 million
> Land area: 486,179.6 square miles
> 25-yr. population change: 135.0%
[in-text-ad-2]
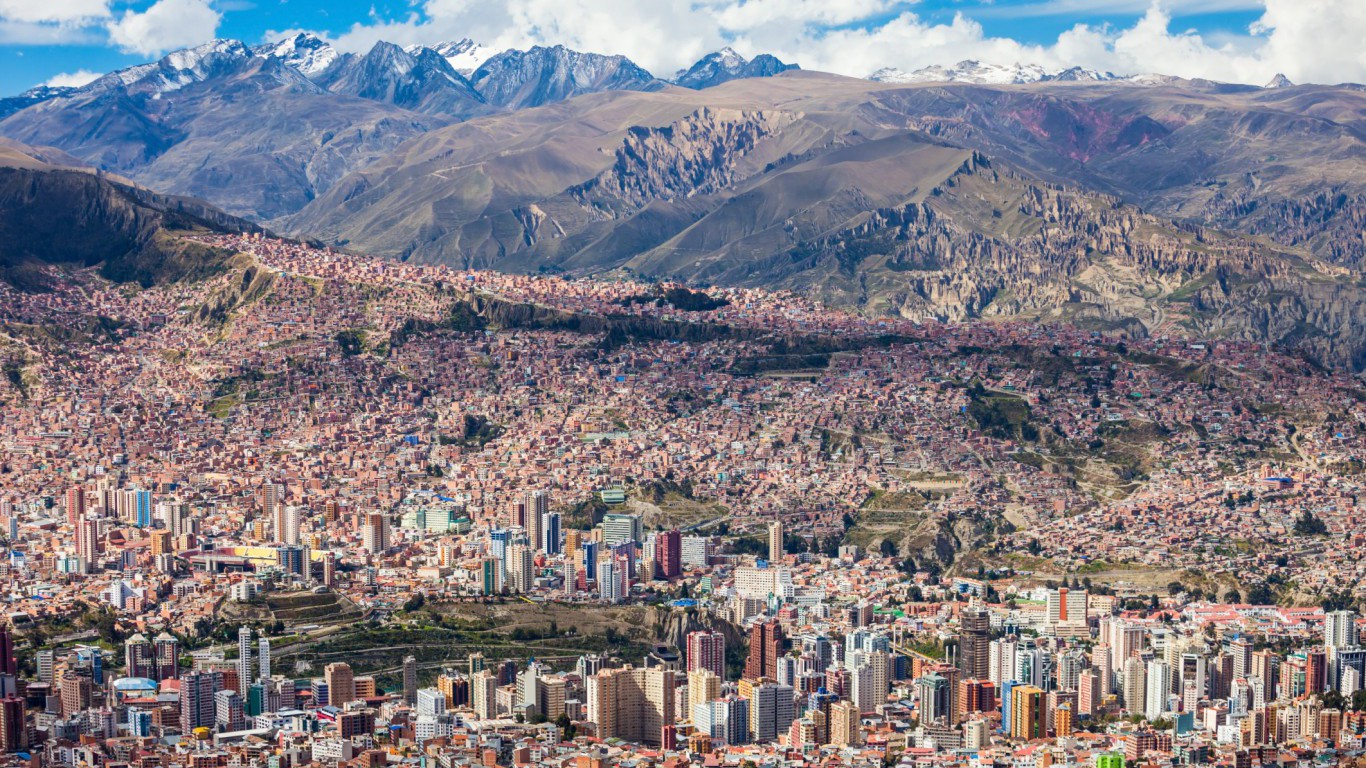
16. Bolivia
> People per square mile: 26.0
> Population: 10.9 million
> Land area: 418,264.3 square miles
> 25-yr. population change: 55.7%

15. Russian Federation
> People per square mile: 22.8
> Population: 144.3 million
> Land area: 6.3 million square miles
> 25-yr. population change: -2.9%
[in-text-ad]
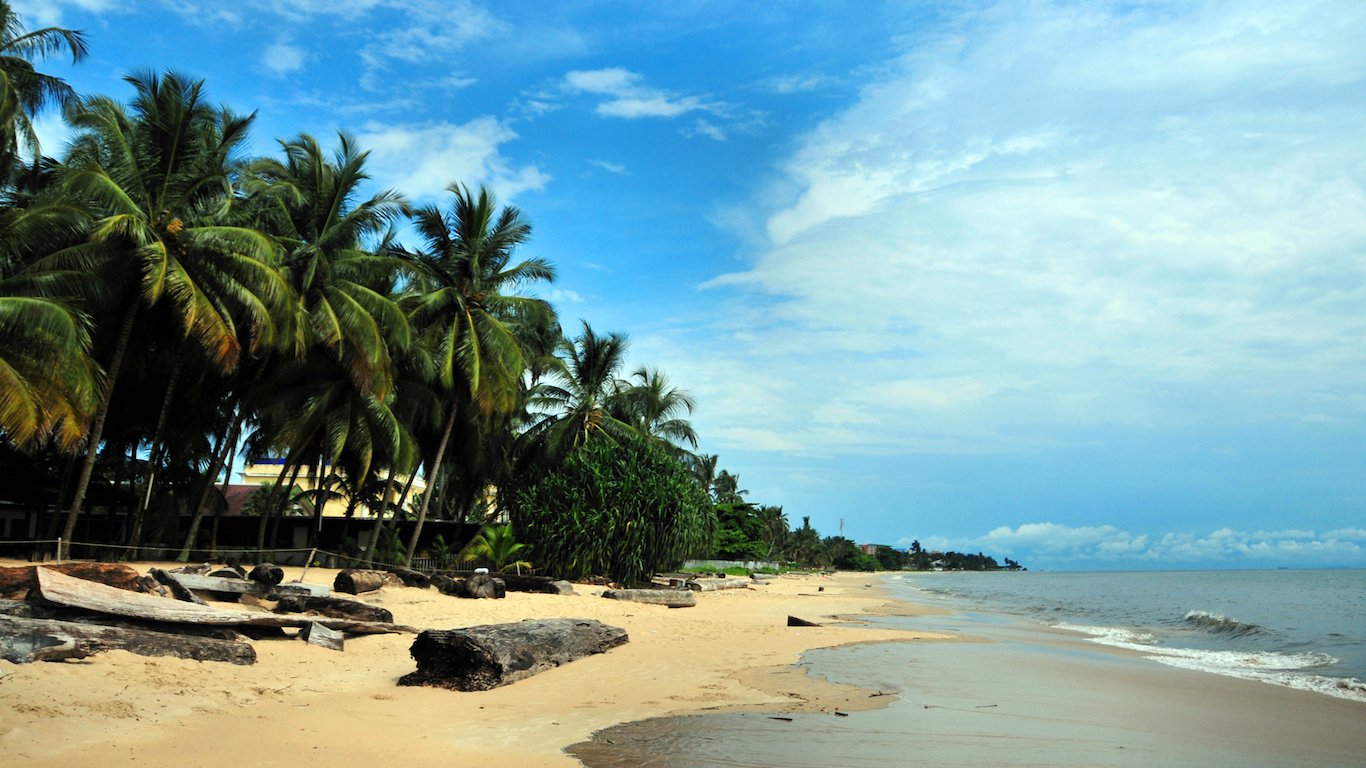
14. Gabon
> People per square mile: 19.9
> Population: 2.0 million
> Land area: 99,486.9 square miles
> 25-yr. population change: 102.4%
[recirclink id=404324]
13. Central African Republic
> People per square mile: 19.1
> Population: 4.6 million
> Land area: 240,533.8 square miles
> 25-yr. population change: 52.4%
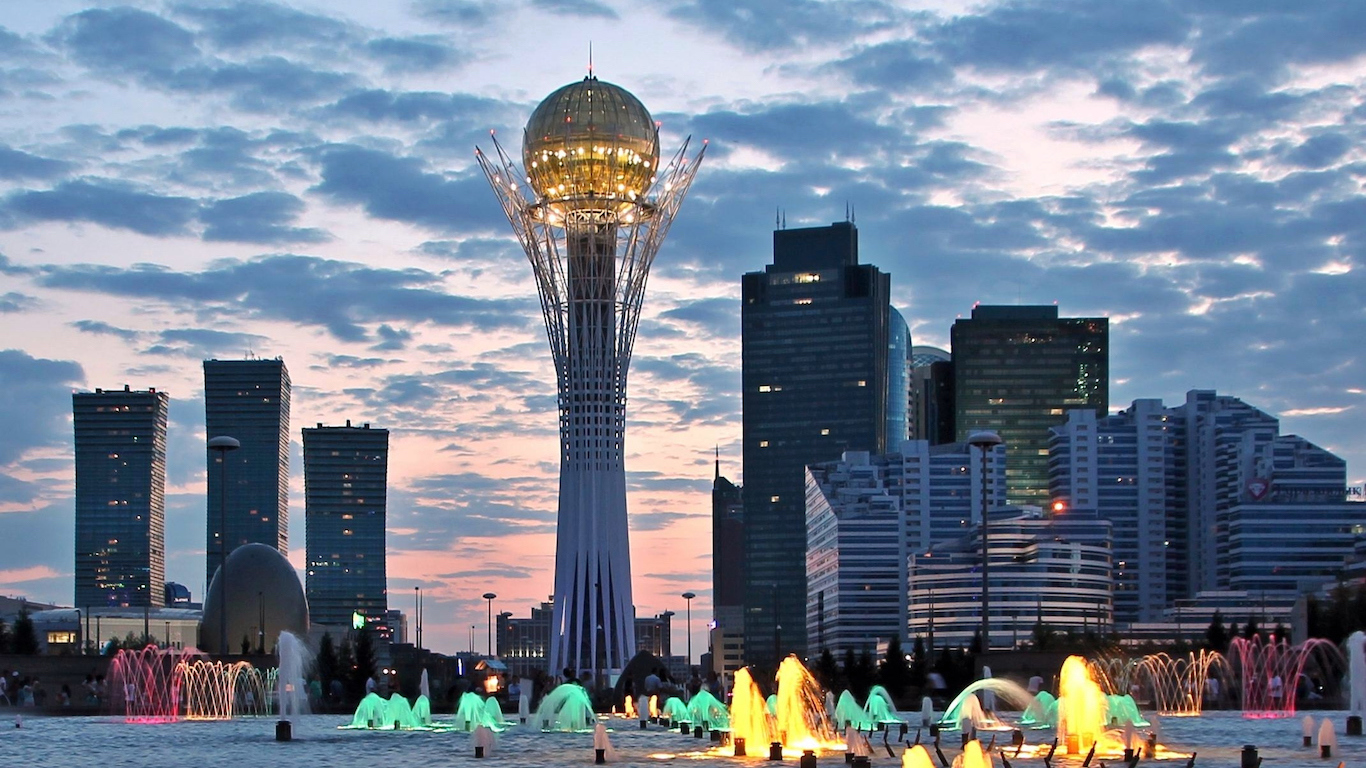
12. Kazakhstan
> People per square mile: 17.1
> Population: 17.8 million
> Land area: 1.0 million square miles
> 25-yr. population change: 8.2%
[in-text-ad-2]
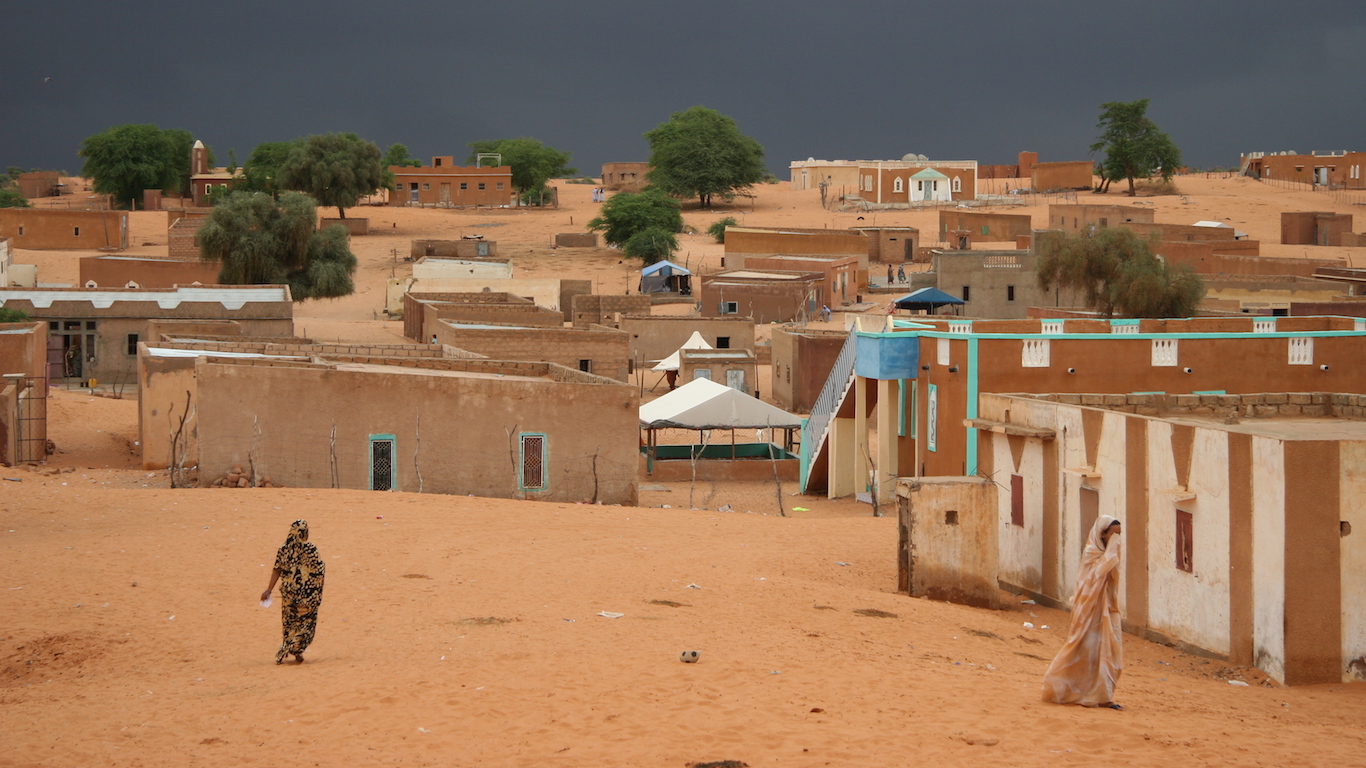
11. Mauritania
> People per square mile: 10.8
> Population: 4.3 million
> Land area: 397,955.3 square miles
> 25-yr. population change: 106.3%
10. Canada
> People per square mile: 10.3
> Population: 36.3 million
> Land area: 3.5 million square miles
> 25-yr. population change: 28.8%
[in-text-ad]
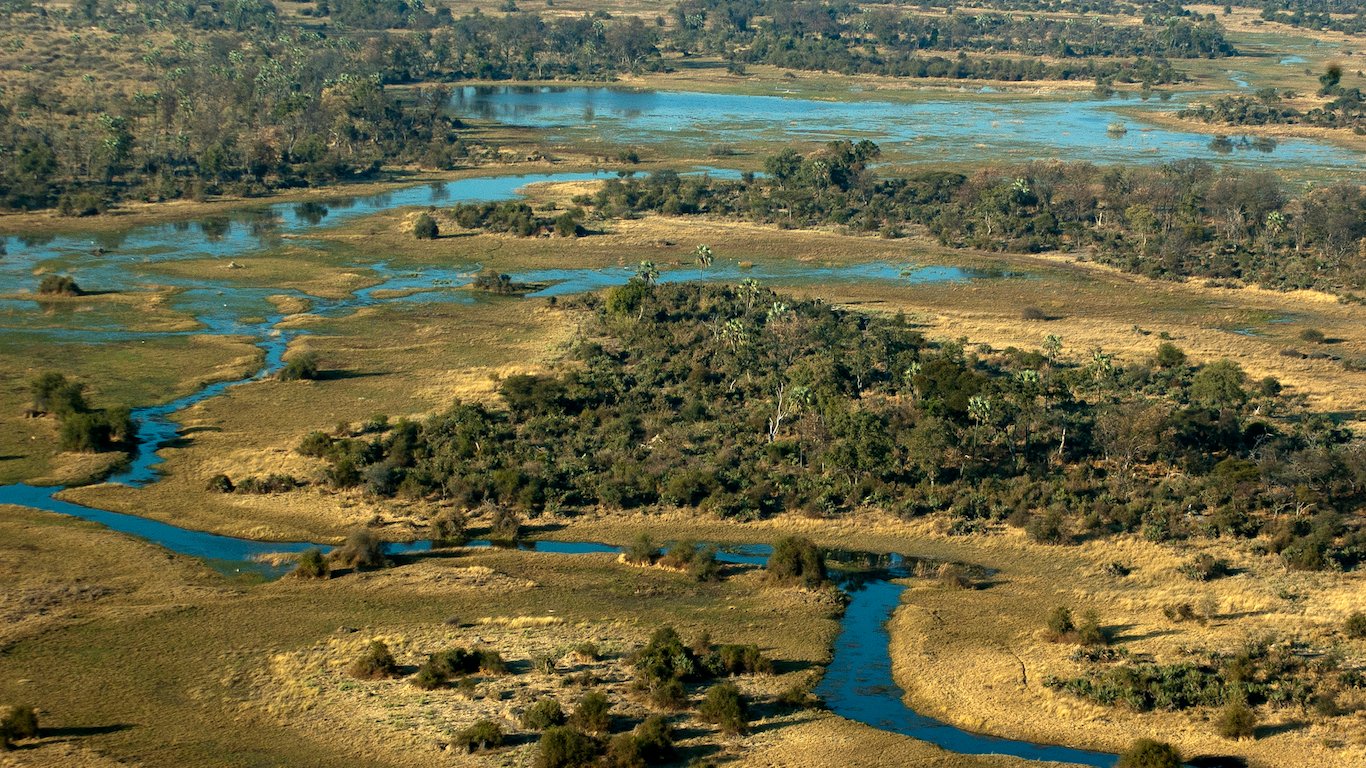
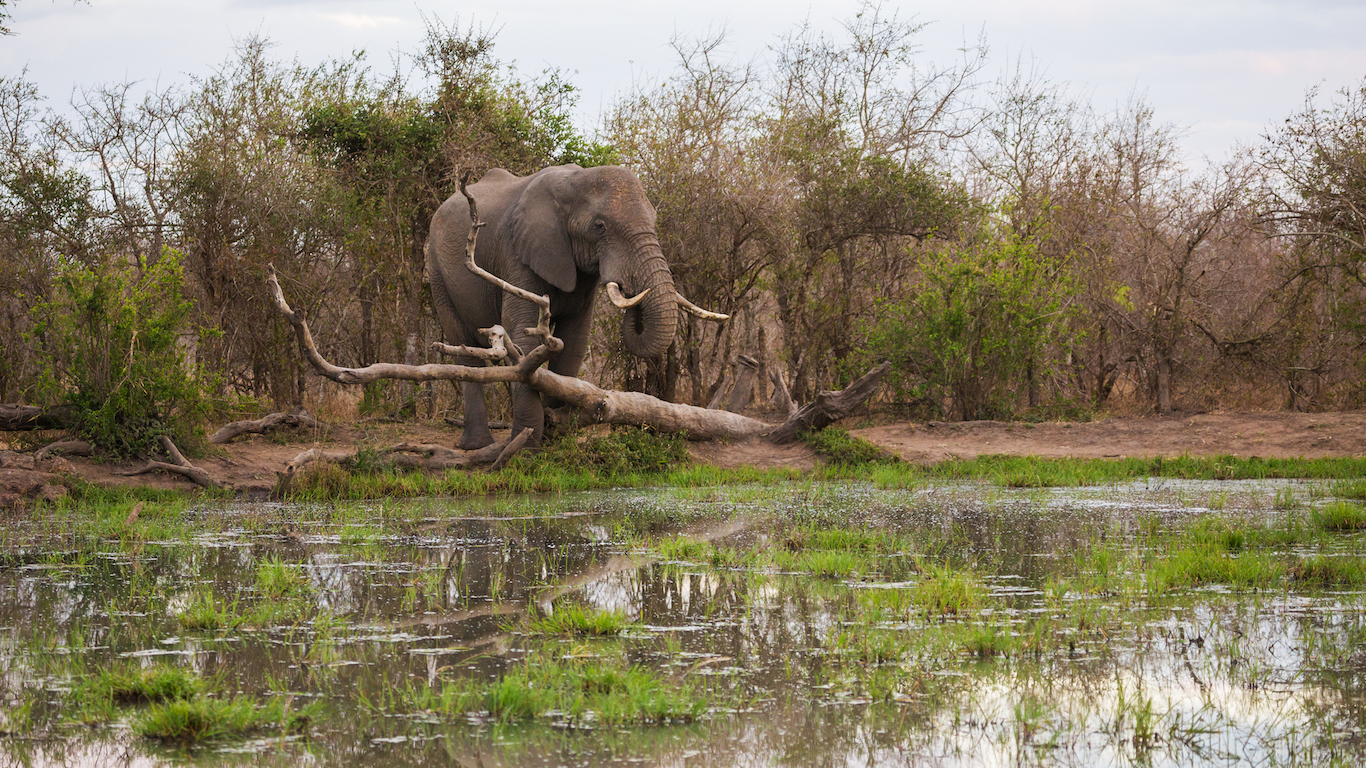
9. Botswana
> People per square mile: 10.3
> Population: 2.3 million
> Land area: 218,815.6 square miles
> 25-yr. population change: 58.8%
[recirclink id=397441]
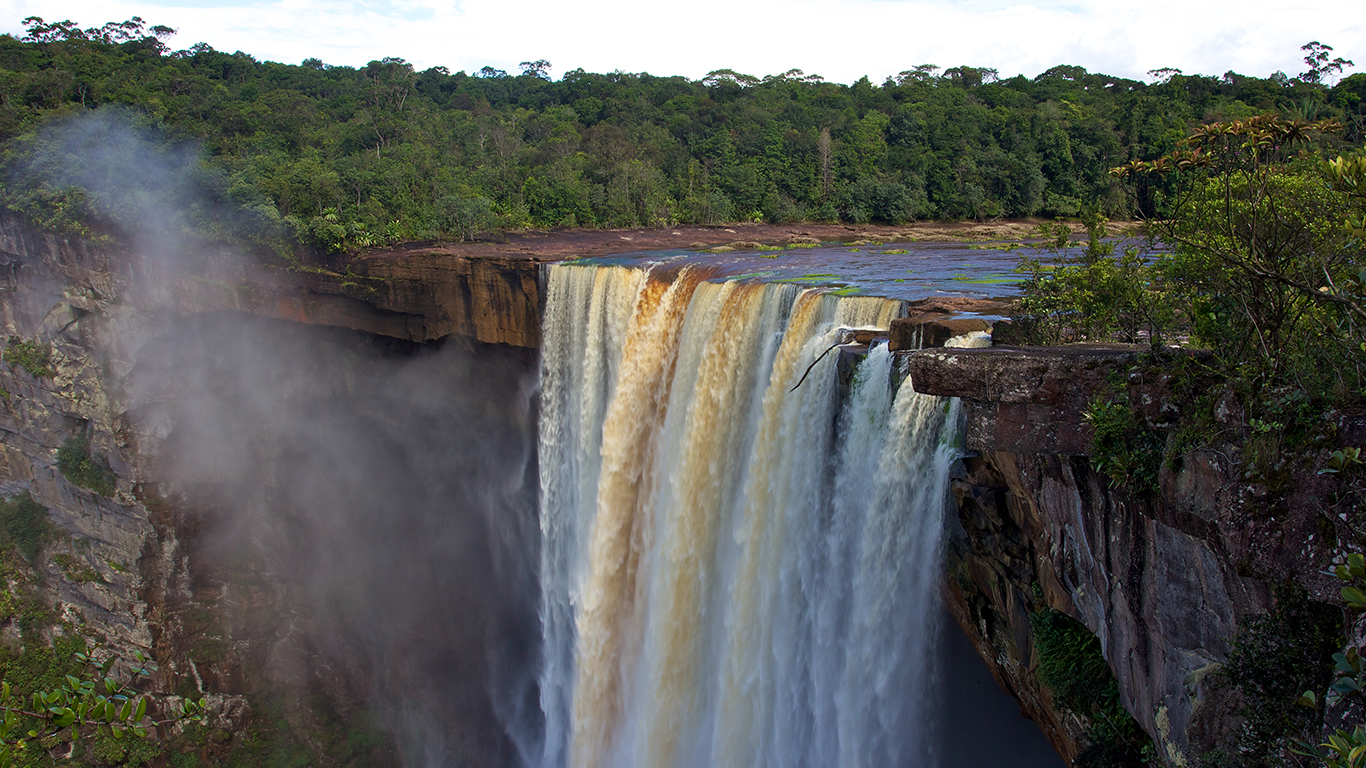
8. Guyana
> People per square mile: 10.2
> Population: 773,303
> Land area: 76,004.2 square miles
> 25-yr. population change: 3.9%
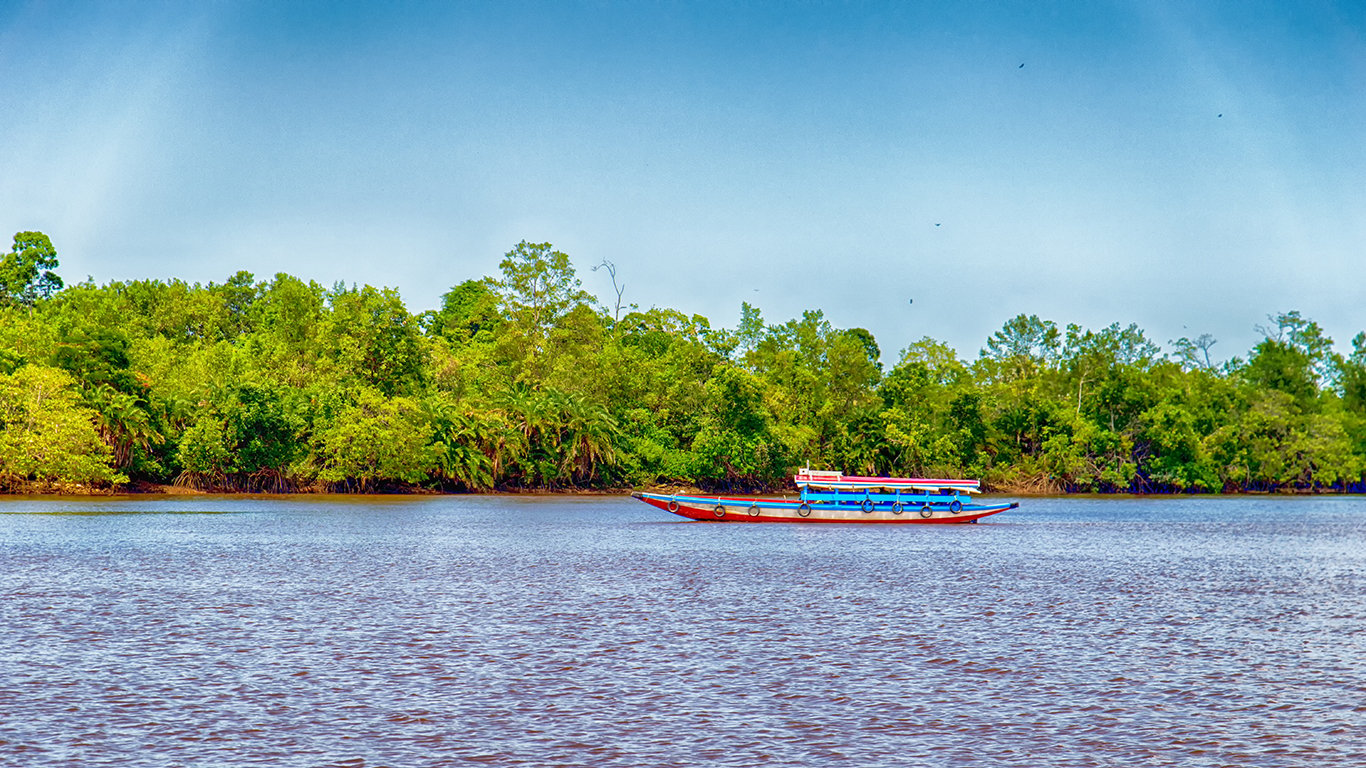
7. Suriname
> People per square mile: 9.3
> Population: 558,368
> Land area: 60,231.9 square miles
> 25-yr. population change: 34.5%
[in-text-ad-2]
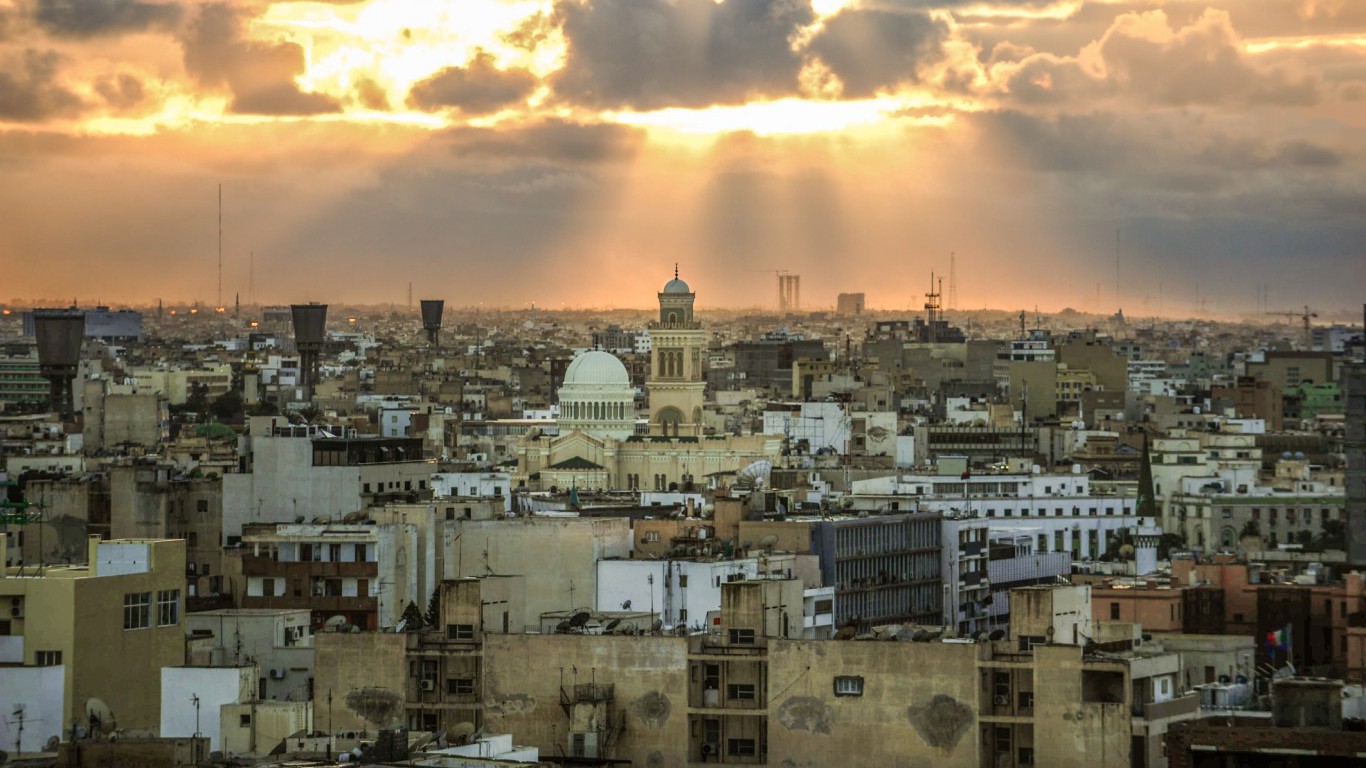
6. Libya
> People per square mile: 9.3
> Population: 6.3 million
> Land area: 679,361.9 square miles
> 25-yr. population change: 38.5%
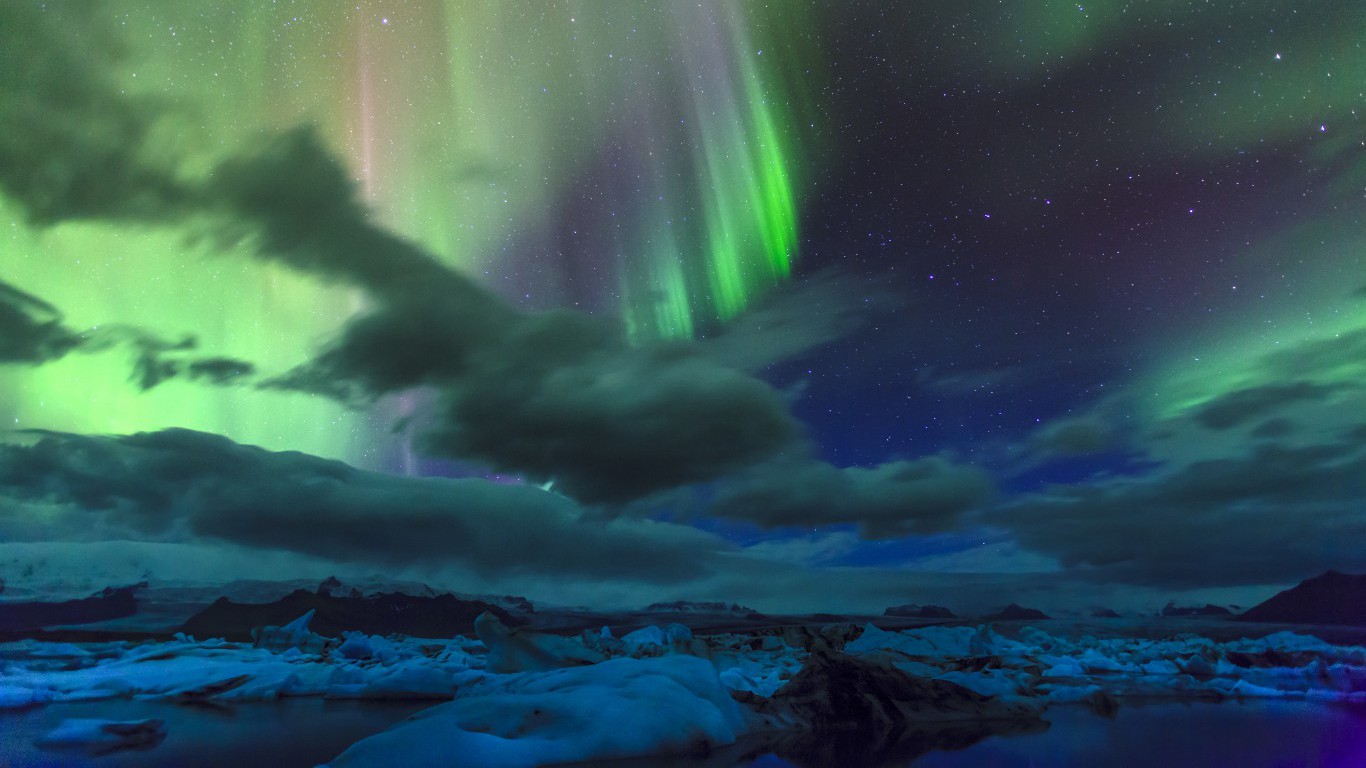
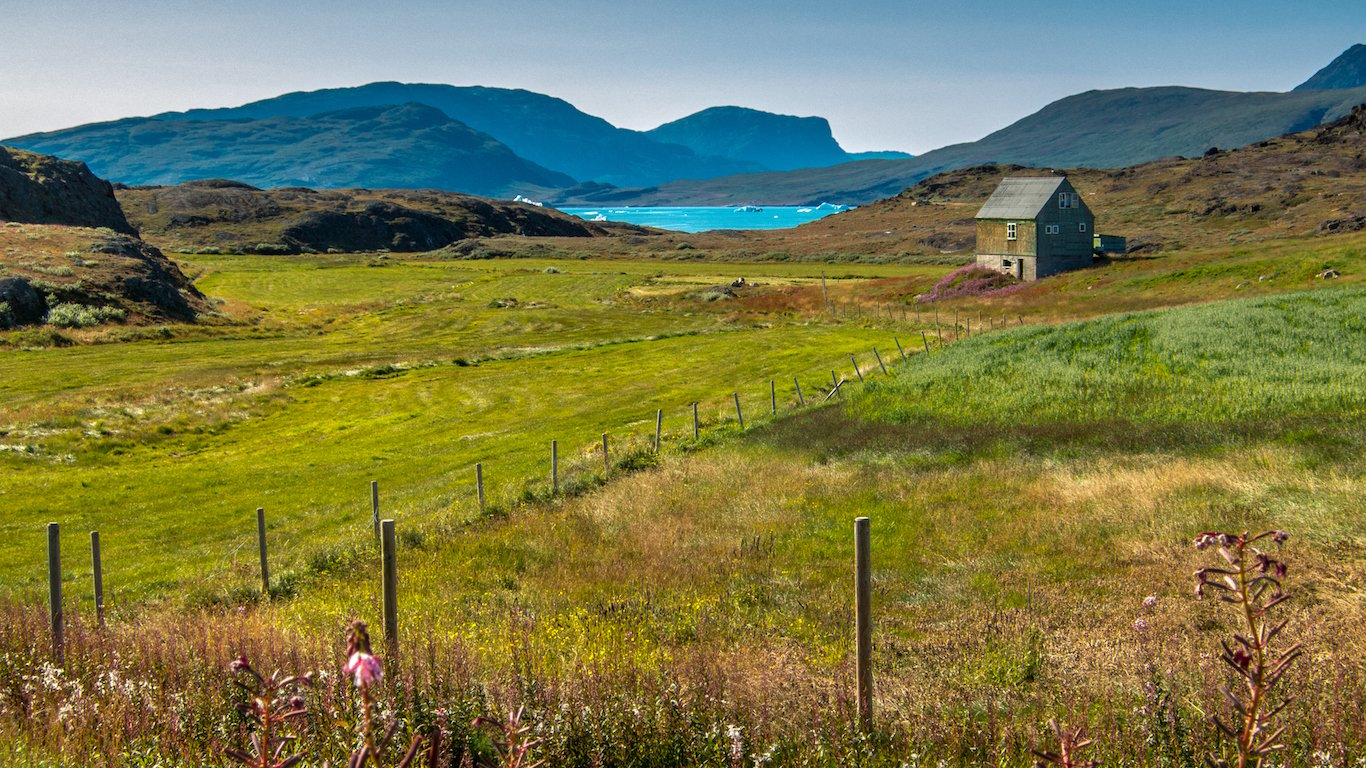
5. Iceland
> People per square mile: 8.6
> Population: 334,252
> Land area: 38,706.7 square miles
> 25-yr. population change: 29.7%
[in-text-ad]
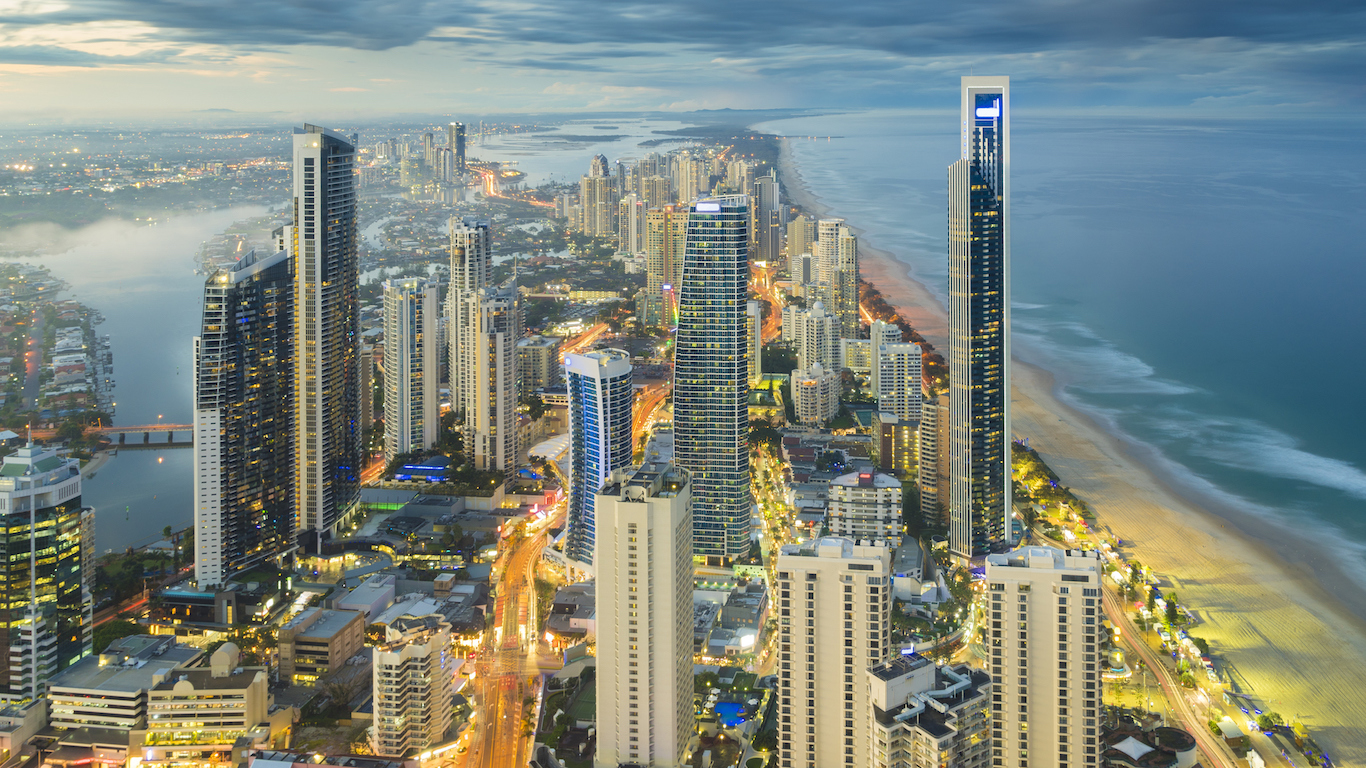
4. Australia
> People per square mile: 8.1
> Population: 24.1 million
> Land area: 3.0 million square miles
> 25-yr. population change: 39.6%
[recirclink id=404324]
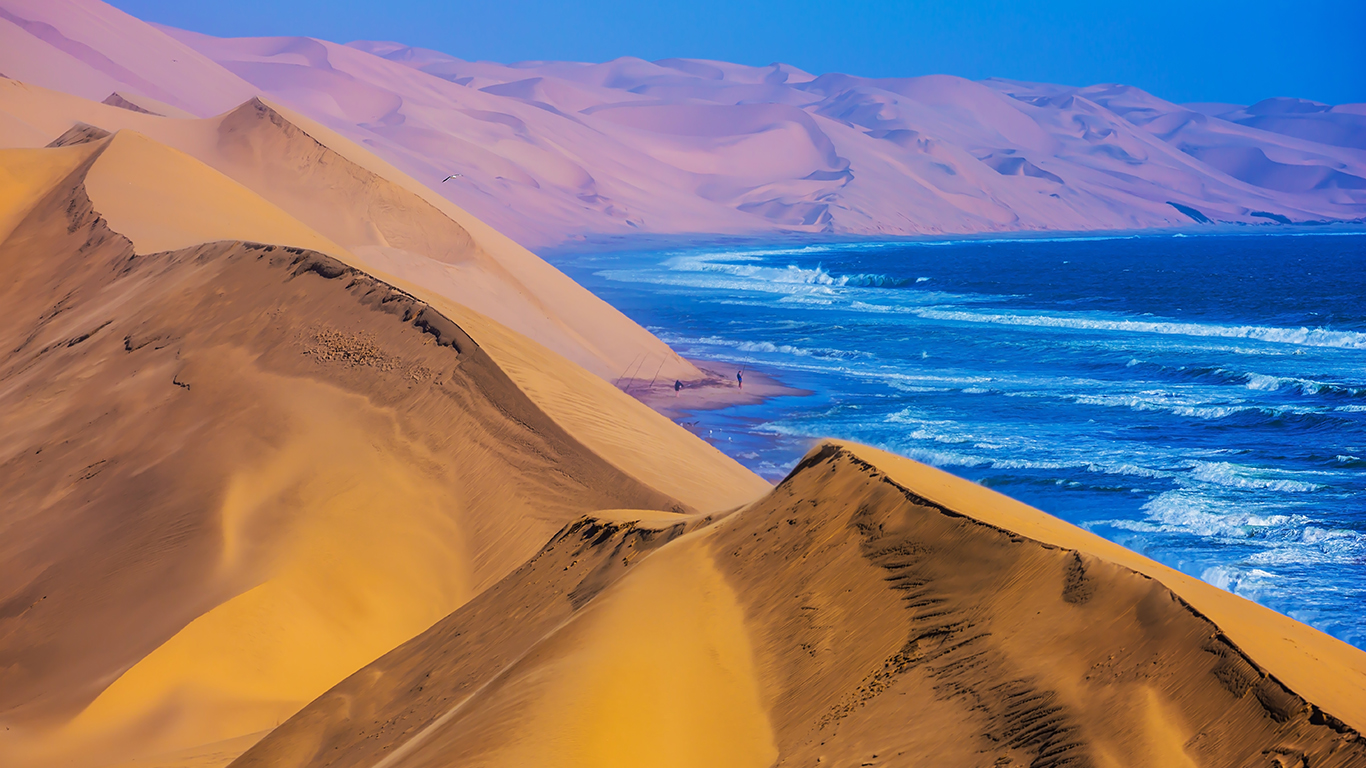
3. Namibia
> People per square mile: 7.8
> Population: 2.5 million
> Land area: 317,873.9 square miles
> 25-yr. population change: 69.2%
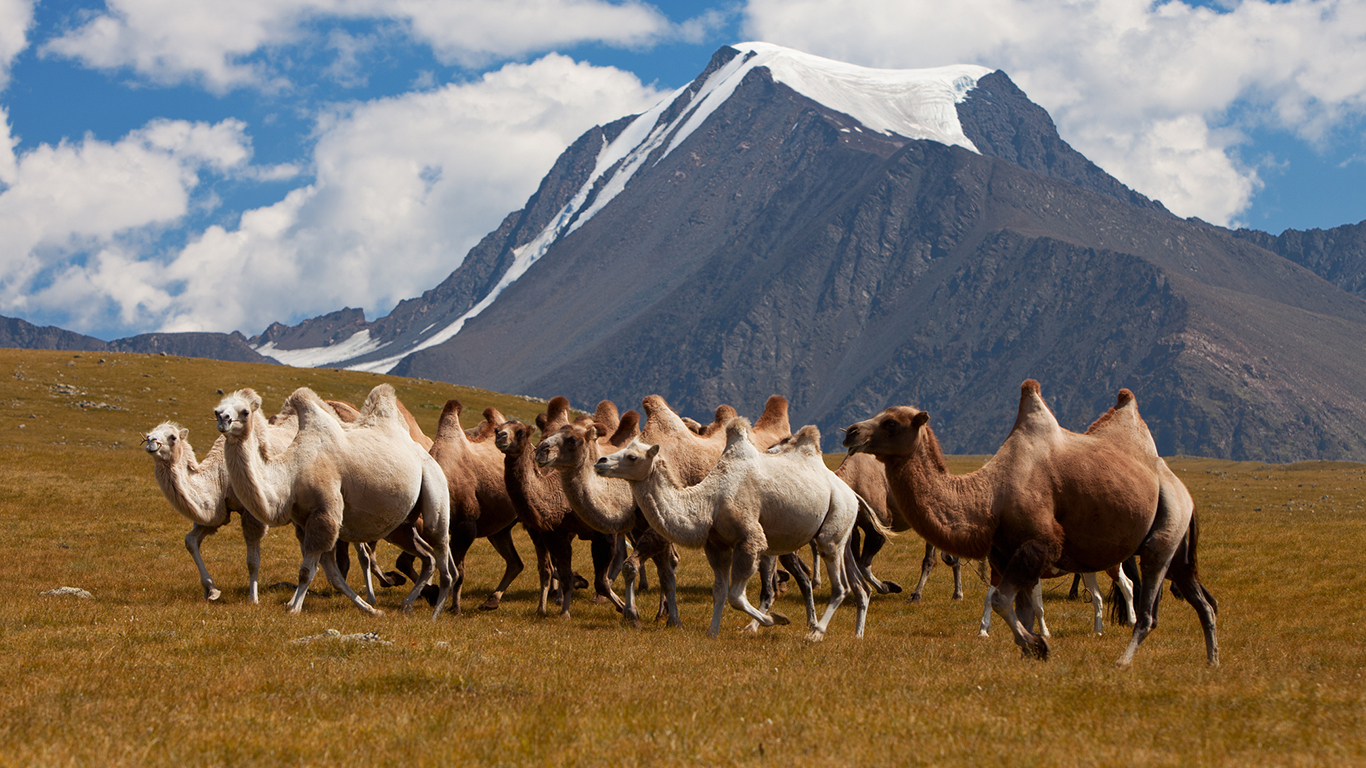
2. Mongolia
> People per square mile: 5.0
> Population: 3.0 million
> Land area: 599,832.6 square miles
> 25-yr. population change: 36.5%
[in-text-ad-2]
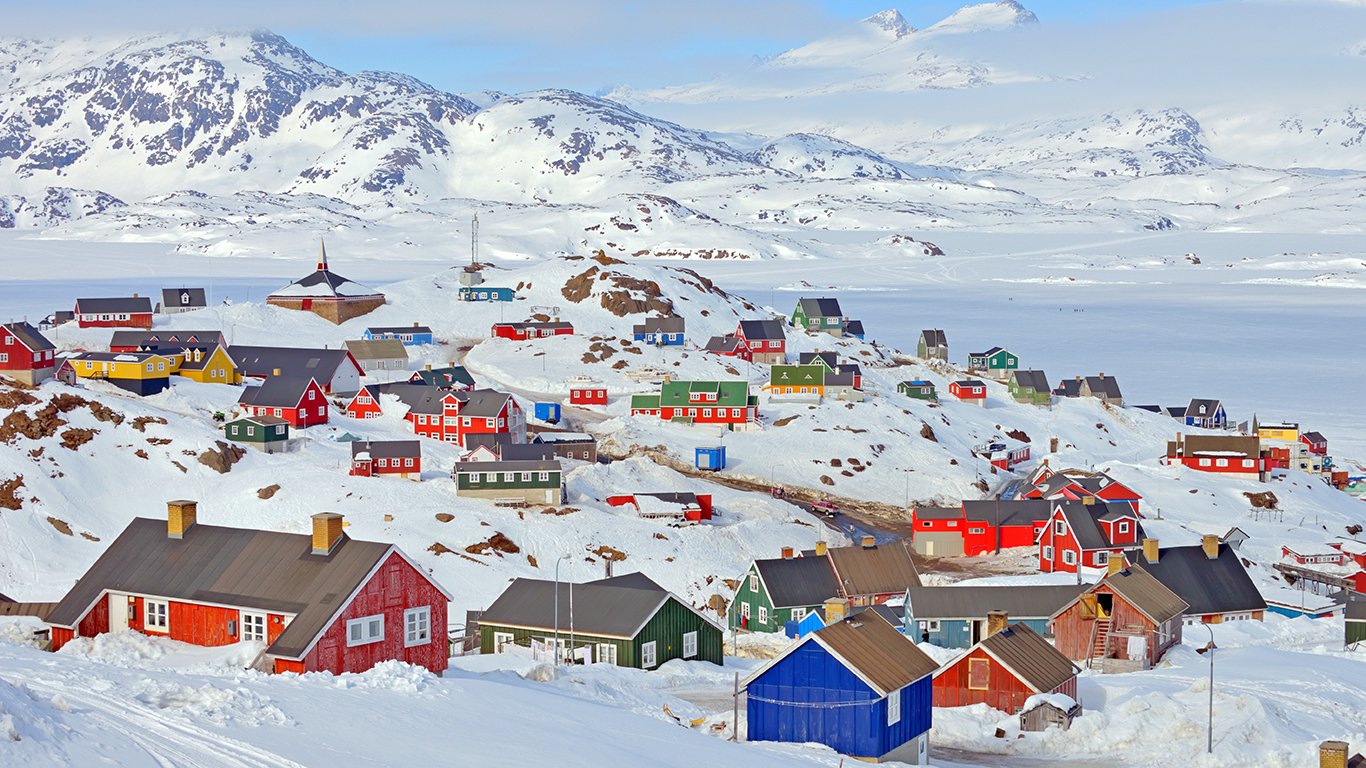
1. Greenland
> People per square mile: 0.4
> Population: 56,186
> Land area: 158,475.6 square miles
> 25-yr. population change: 1.2%
Detailed Findings and Methodology:
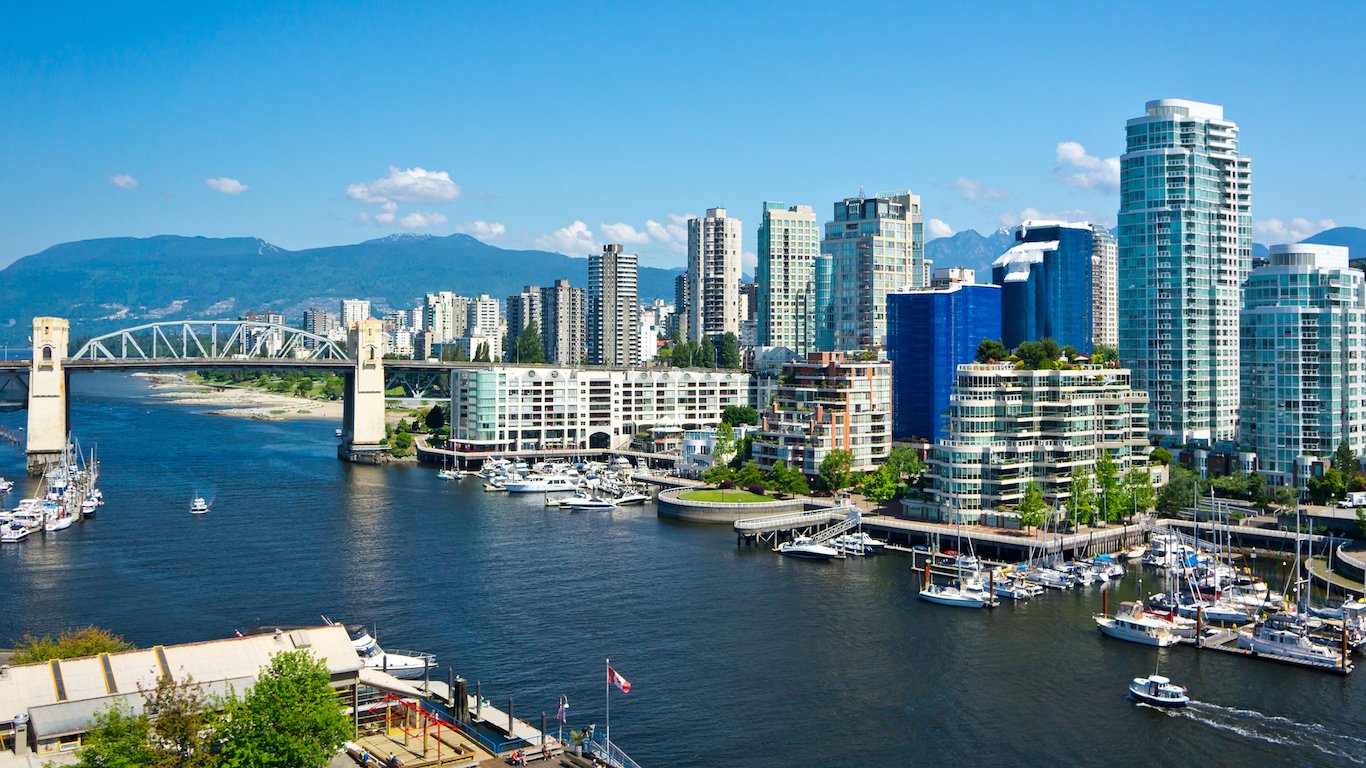
Many of the densest countries are islands, where growth is limited by physical boundaries. Of the 10 densest countries in the world, eight are either islands or peninsulas. To facilitate population growth, countries often build upward instead of outward and develop creative methods of expanding their usable land area. Hong Kong has approximately 300 buildings taller than 500 feet and is home to the 10th tallest skyscraper in the world. As Macau’s population increases and the small nation runs out of room to grow, the special administrative region’s government has facilitated new development by filling in waterways with sand, dirt, and other materials to create more habitable land.
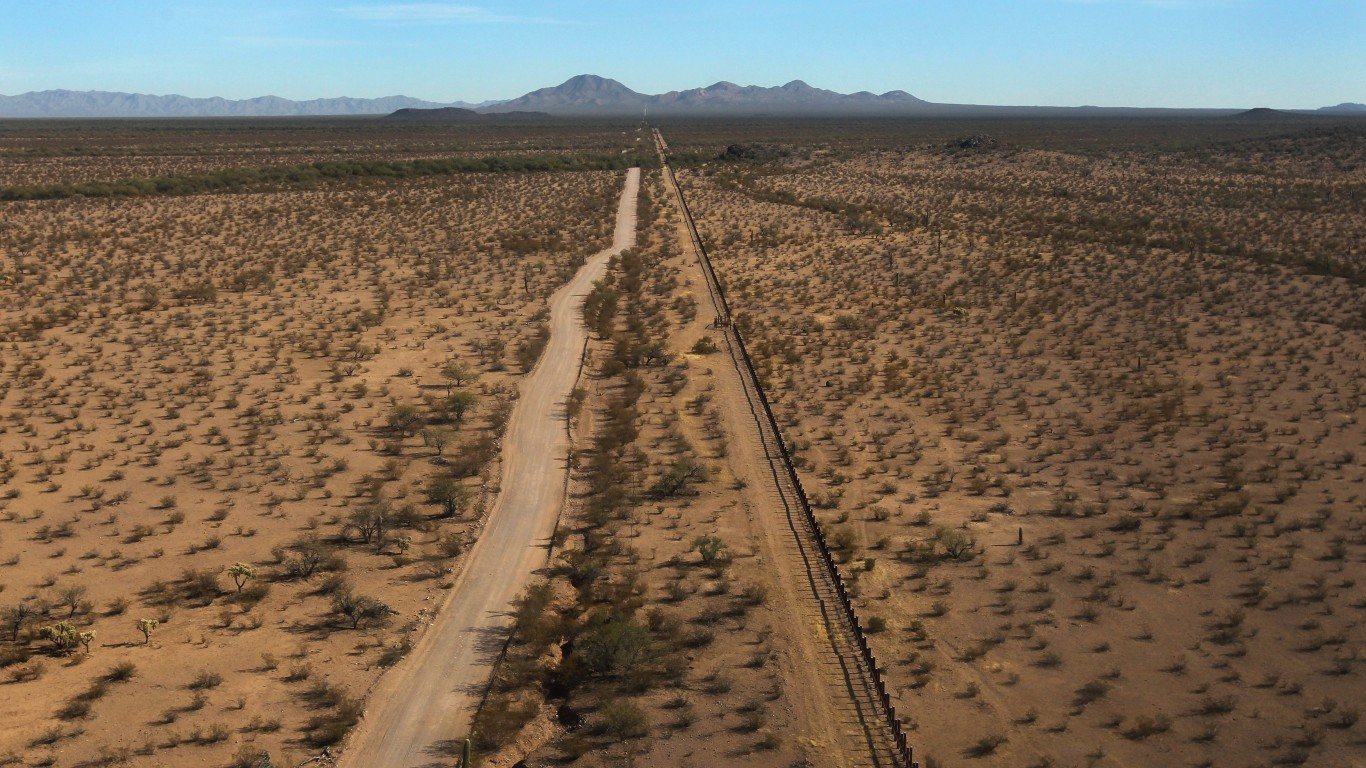
Countries with low population density do not necessarily consist of entirely rural settlements. Many of the least dense places in the world have vast expanses of undeveloped, uninhabitable land, with the majority of residents concentrated in cities with more favorable living conditions. Most of Mongolia, for example, is covered by discontinuous permafrost that makes construction and urban development difficult. The southern part of the country is covered by the Gobi desert, where arid conditions make it difficult for vegetation to grow and for livestock to survive. While Mongolia is the second least dense nation in the world, an estimated 64% of residents live in Ulaanbaatar, one of the densest cities on the planet. In eight of the 10 least crowded countries, more than half of the population lives in urban areas.
Cities have long facilitated advances in culture, politics, and economics throughout human history. Today, however, many of the densest countries on Earth face a number of problems due to overpopulation. The population of Macao, for example, has increased 73.0% over the past 25 years, nearly twice the global population growth rate. The increase in population has led to an increase in environmental problems. Greenhouse gas emissions caused by vehicles and other land transport increased 70% between 2001 and 2009, and the concentration of pollutants such as nitrogen dioxide and carbon monoxide has also been rising.
In Singapore, rapid urbanization has led to the depletion of nearly all of the country’s natural resources. One recent report ranks Singapore as the worst environmental offender in the world, largely due to the country’s rising urban density. Other problems common in the densest countries are traffic congestion, water shortages, and food insecurity.
To determine the most and least crowded countries in the world, 24/7 Wall St. reviewed the population density of 215 countries with data from the World Bank. Data on population and land area also came from the World Bank. Population density and land area was converted from square kilometers to square miles. The measurement for land area includes a country’s total geographic area, minus area under inland water bodies such as major rivers and lakes. The 25-year population change was calculated using World Bank population estimates for 1991 and 2016. All data are for the most recent year available.
Contact [email protected] for any questions or corrections.