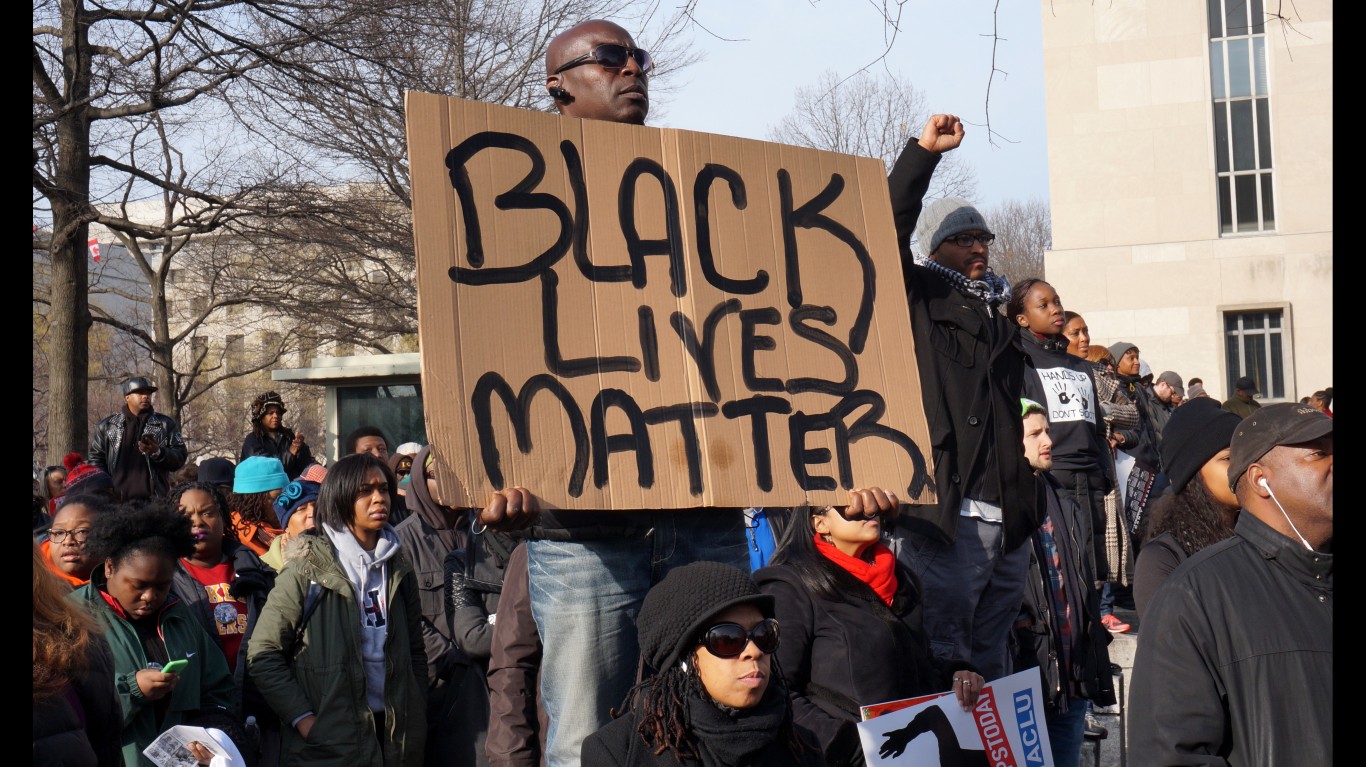
[cnxvideo id=”509259″ placement=”ros”]In the wake of Charlottesville, racial issues dominate the news. As much of the country rallies against racism, data suggests that the United States is a long way from full social or material equality. While racism may no longer be entrenched in laws, the result of years of discrimination is clear in today’s racial divide and myriad inequalities. Recent growing visibility of white supremacist, neo-Nazi and alt-right groups have further strained race relations.
Important pieces of legislation, including the Civil Rights Act of 1964 and the Voting Rights Act of 1965, represent important landmarks in ensuring that people of all racial backgrounds have the same opportunities. However, even decades later, vast inequalities remain between whites and blacks in the United States.
Today, the typical white household’s income is nearly double the typical black household’s income. Black Americans are twice as likely to be unemployed and two and a half times more likely to live in poverty compared to white Americans. Just 1 in 5 African American adults have a college education, compared to 1 in 3 white adults.
Racial inequalities can be found in even the most progressive parts of the country. However, racially-driven outcomes are far more pronounced in some areas than in others. In South Dakota, the black poverty rate is 52.5%, over five times the white poverty rate. In New Mexico, the black infant mortality rate is nearly three times that of the white infant mortality rate. Considering 10 separate social and economic measures that tend to be unequal along racial lines, 24/7 Wall St. reviewed and ranked all 50 U.S. states based on inequality, from most to least equal.
Click here to see how all 50 states rank in terms of black/white inequality.
Click here to see our detailed findings and methodology.

50. Hawaii
> African American population: 1.9% (10th smallest)
> Median household income: $69,448 (black), $74,197 (white)
> Unemployment rate: N/A, 3.4% (white)
> Homeownership rate: 22.3% (black), 53.6% (white)
> Incarceration rate (per 100,000): 585 (black), 246 (white)
[in-text-ad]
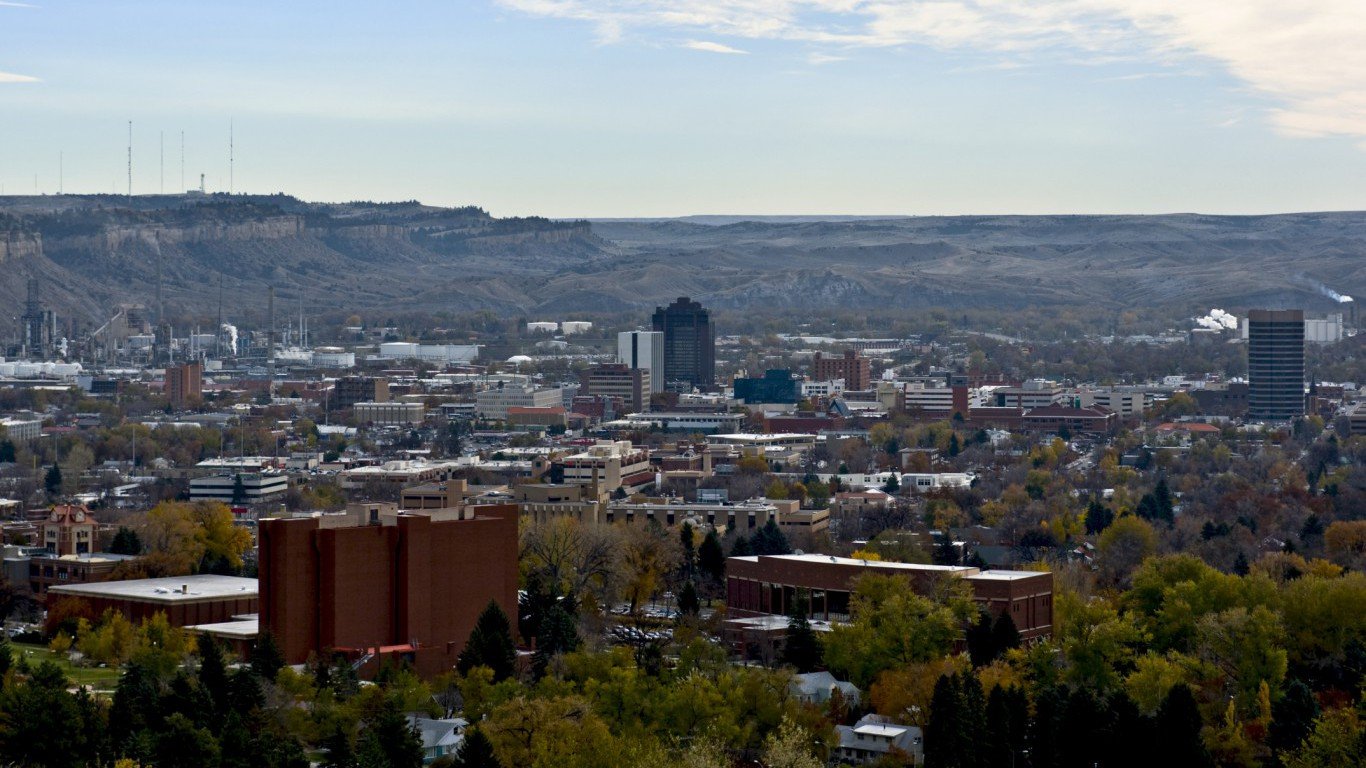
49. Montana
> African American population: 0.4% (the smallest)
> Median household income: $55,809 (black), $50,858 (white)
> Unemployment rate: N/A, 4.0% (white)
> Homeownership rate: 40.3% (black), 68.8% (white)
> Incarceration rate (per 100,000): 1,985 (black), 316 (white)
[recirclink id=405812]

48. Idaho
> African American population: 0.5% (2nd smallest)
> Median household income: $40,278 (black), $49,245 (white)
> Unemployment rate: N/A, 3.8% (white)
> Homeownership rate: 30.1% (black), 71.3% (white)
> Incarceration rate (per 100,000): 2,160 (black), 458 (white)
47. West Virginia
> African American population: 3.8% (16th smallest)
> Median household income: $31,740 (black), $42,349 (white)
> Unemployment rate: 6.6% (black), 6.0% (white)
> Homeownership rate: 38.8% (black), 74.0% (white)
> Incarceration rate (per 100,000): 1,234 (black), 348 (white)
[in-text-ad-2]
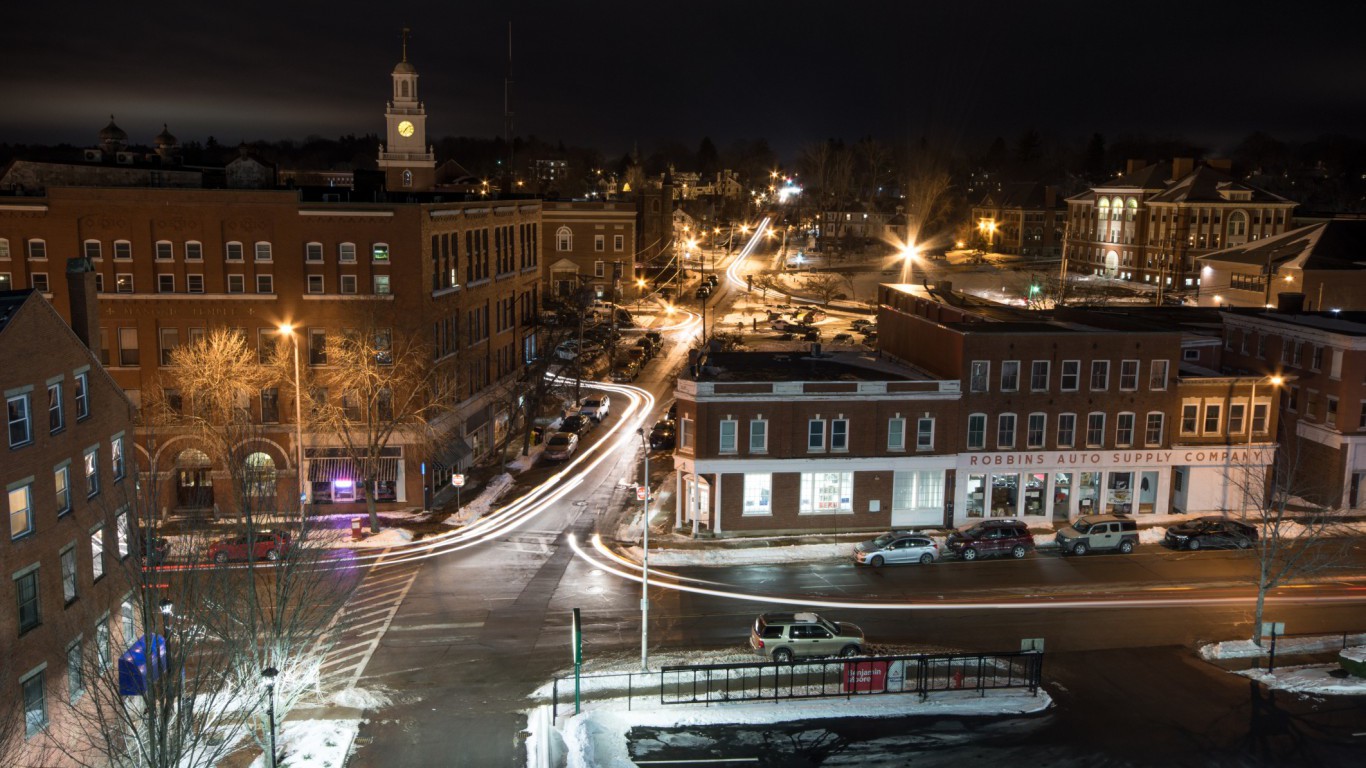
46. New Hampshire
> African American population: 1.4% (7th smallest)
> Median household income: $36,821 (black), $70,659 (white)
> Unemployment rate: N/A, 2.8% (white)
> Homeownership rate: 42.5% (black), 72.4% (white)
> Incarceration rate (per 100,000): 1,040 (black), 202 (white)
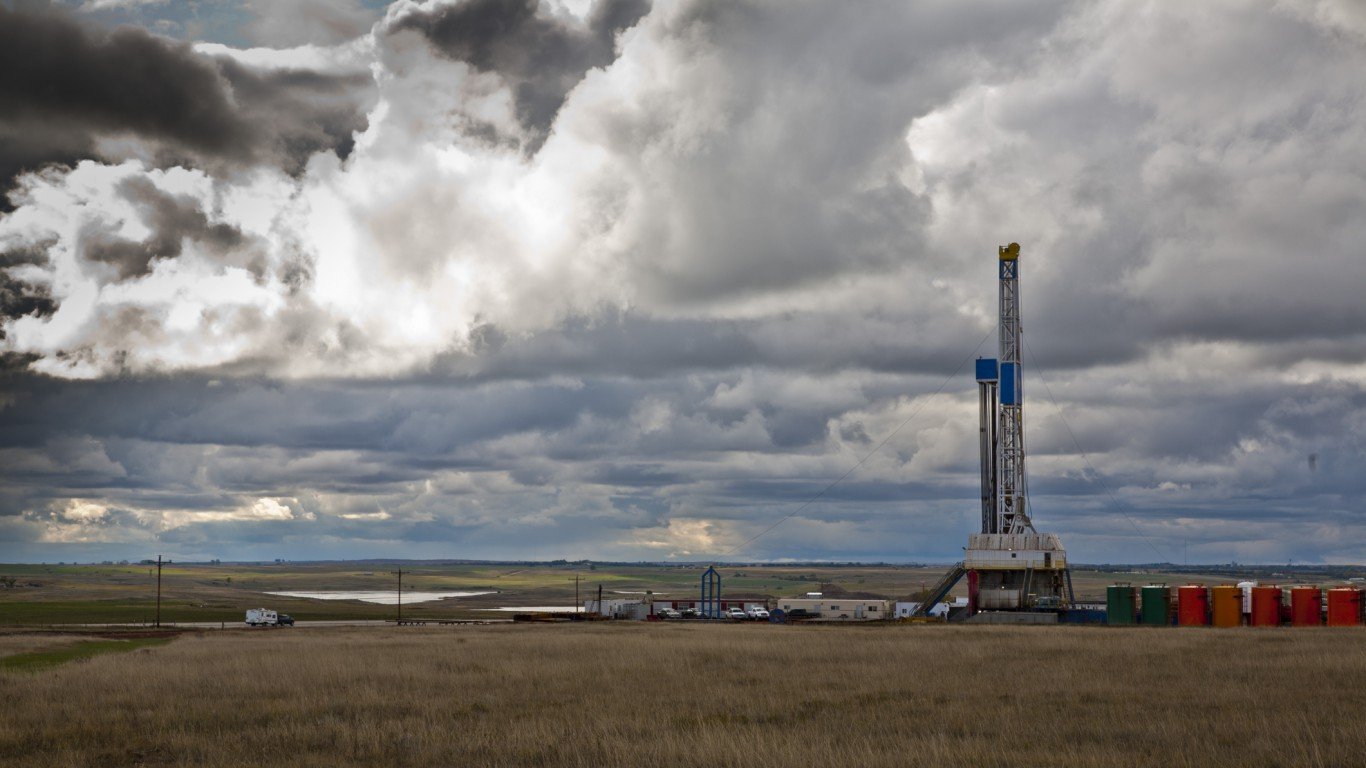
45. North Dakota
> African American population: 2.0% (12th smallest)
> Median household income: $31,456 (black), $62,480 (white)
> Unemployment rate: N/A, 2.6% (white)
> Homeownership rate: 6.3% (black), 64.9% (white)
> Incarceration rate (per 100,000): 888 (black), 170 (white)
[in-text-ad]
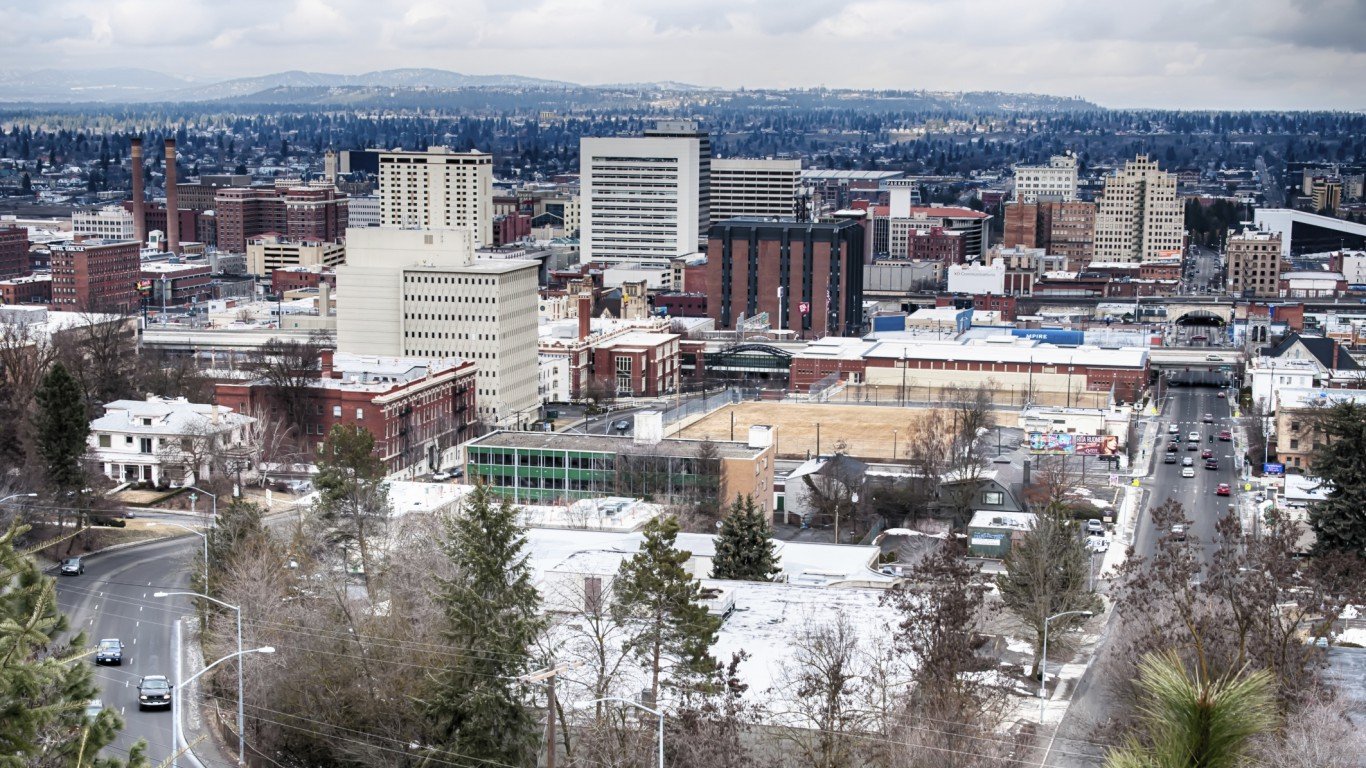
44. Washington
> African American population: 3.5% (15th smallest)
> Median household income: $45,866 (black), $66,681 (white)
> Unemployment rate: 6.1% (black), 5.3% (white)
> Homeownership rate: 34.5% (black), 66.9% (white)
> Incarceration rate (per 100,000): 1,272 (black), 224 (white)
[recirclink id=409096]
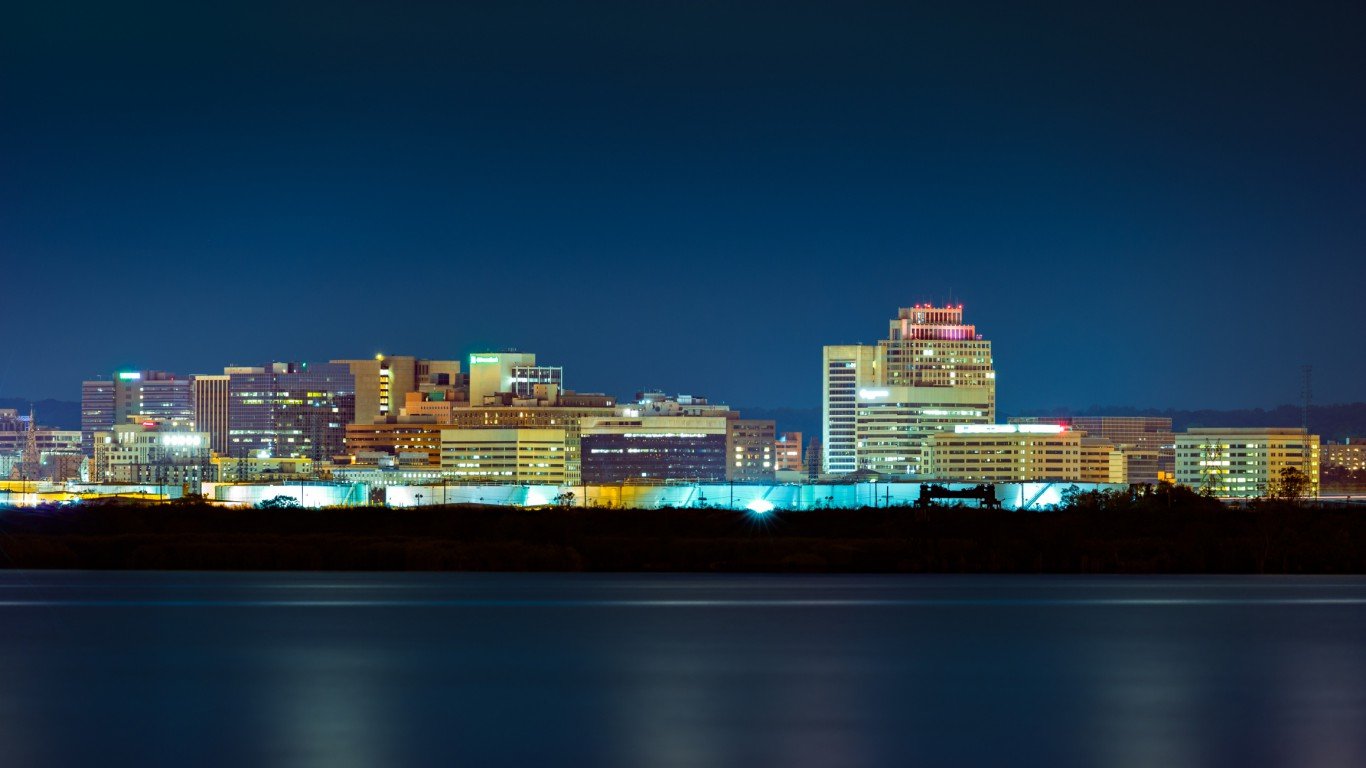
43. Delaware
> African American population: 21.2% (8th largest)
> Median household income: $47,189 (black), $65,267 (white)
> Unemployment rate: 6.2% (black), 3.7% (white)
> Homeownership rate: 51.4% (black), 79.5% (white)
> Incarceration rate (per 100,000): 1,238 (black), 259 (white)
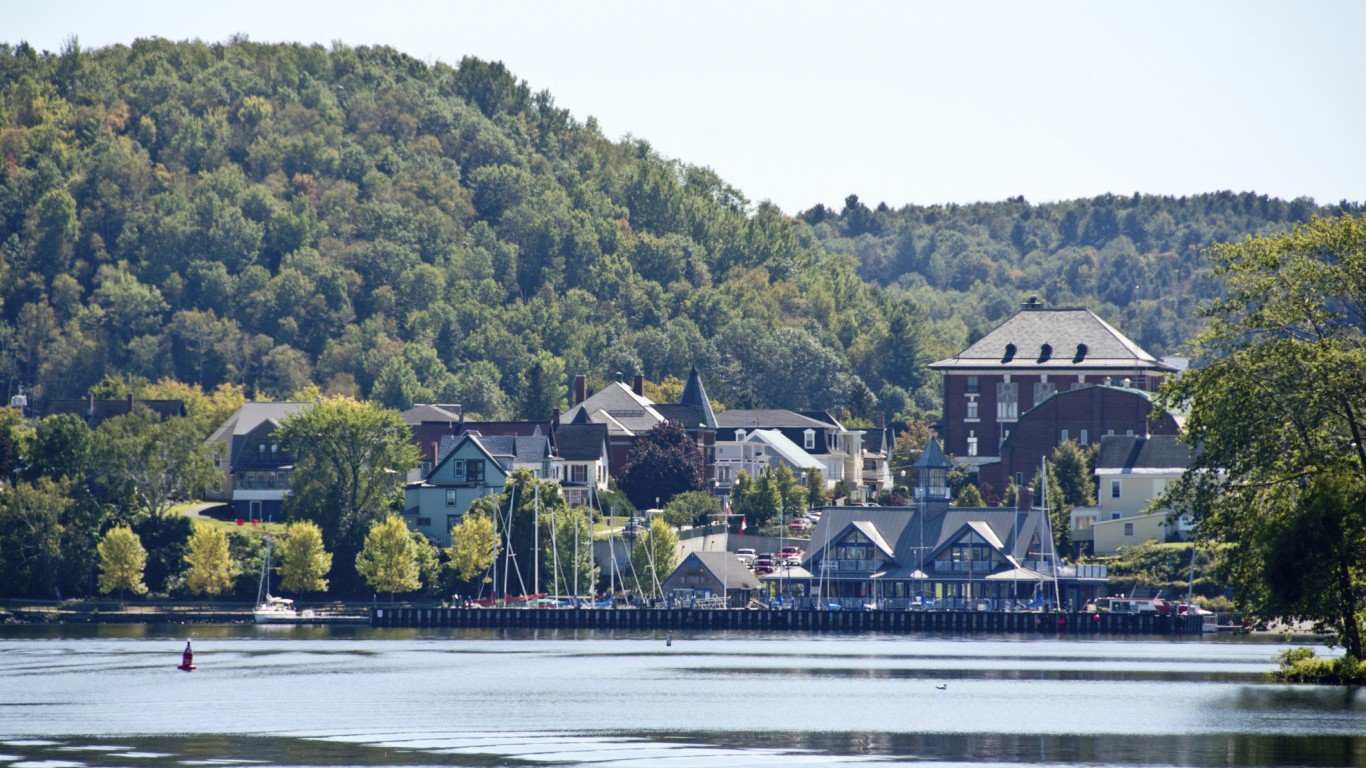
42. Vermont
> African American population: 1.2% (6th smallest)
> Median household income: $40,201 (black), $58,031 (white)
> Unemployment rate: N/A, 3.2% (white)
> Homeownership rate: 12.8% (black), 71.9% (white)
> Incarceration rate (per 100,000): 2,357 (black), 225 (white)
[in-text-ad-2]

41. Oregon
> African American population: 1.8% (9th smallest)
> Median household income: $31,833 (black), $55,803 (white)
> Unemployment rate: N/A, 4.9% (white)
> Homeownership rate: 33.2% (black), 64.3% (white)
> Incarceration rate (per 100,000): 2,061 (black), 366 (white)

40. Rhode Island
> African American population: 5.4% (20th smallest)
> Median household income: $36,719 (black), $64,284 (white)
> Unemployment rate: 6.9% (black), 5.1% (white)
> Homeownership rate: 30.1% (black), 66.3% (white)
> Incarceration rate (per 100,000): 934 (black), 112 (white)
[in-text-ad]

39. Maryland
> African American population: 29.0% (4th largest)
> Median household income: $60,618 (black), $85,530 (white)
> Unemployment rate: 6.8% (black), 3.1% (white)
> Homeownership rate: 50.5% (black), 76.1% (white)
> Incarceration rate (per 100,000): 862 (black), 185 (white)
[recirclink id=405297]
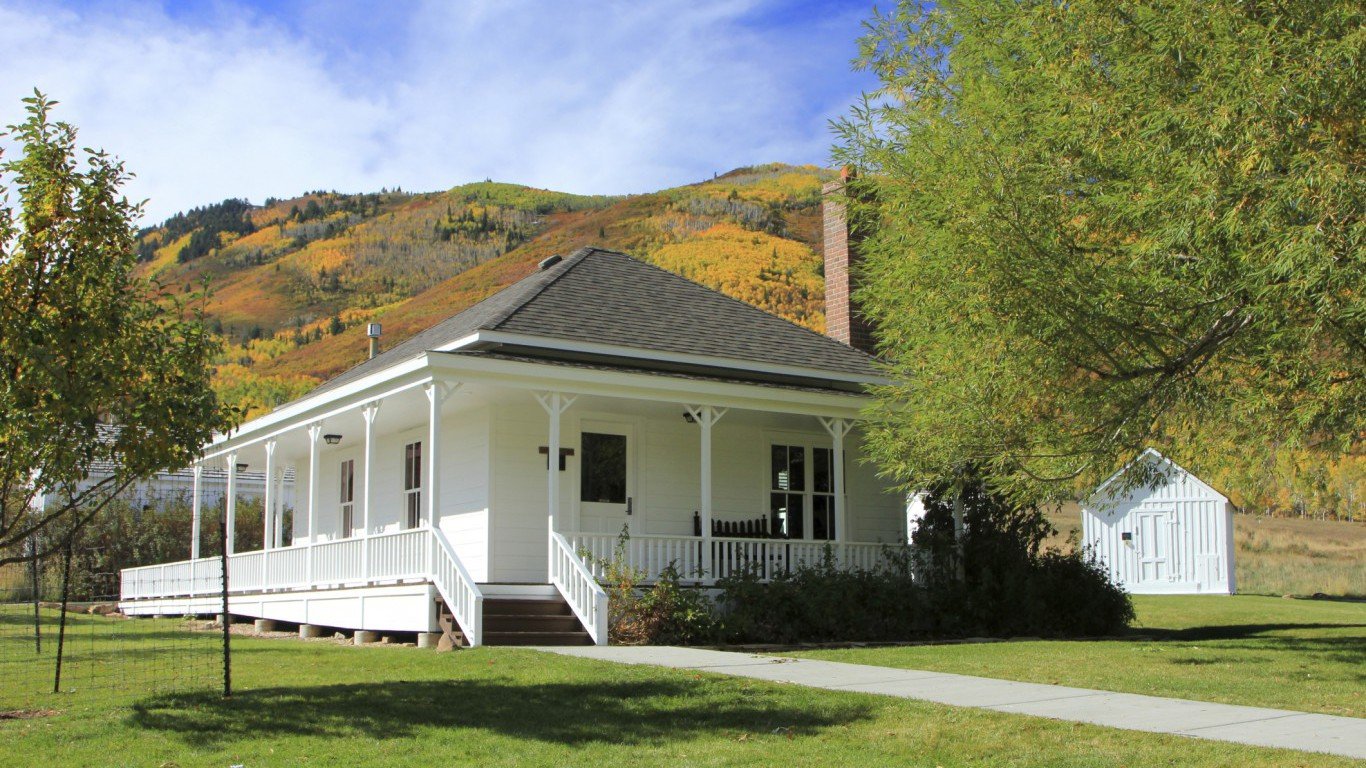
38. Utah
> African American population: 1.1% (5th smallest)
> Median household income: $40,590 (black), $66,516 (white)
> Unemployment rate: N/A, 3.6% (white)
> Homeownership rate: 33.1% (black), 72.7% (white)
> Incarceration rate (per 100,000): 1,481 (black), 202 (white)

37. New Mexico
> African American population: 2.0% (11th smallest)
> Median household income: $32,490 (black), $54,864 (white)
> Unemployment rate: 2.1% (black), 5.4% (white)
> Homeownership rate: 43.1% (black), 71.6% (white)
> Incarceration rate (per 100,000): 1,326 (black), 208 (white)
[in-text-ad-2]

36. Alaska
> African American population: 3.4% (14th smallest)
> Median household income: $52,562 (black), $81,711 (white)
> Unemployment rate: 6.1% (black), 5.0% (white)
> Homeownership rate: 32.5% (black), 69.1% (white)
> Incarceration rate (per 100,000): 1,053 (black), 278 (white)

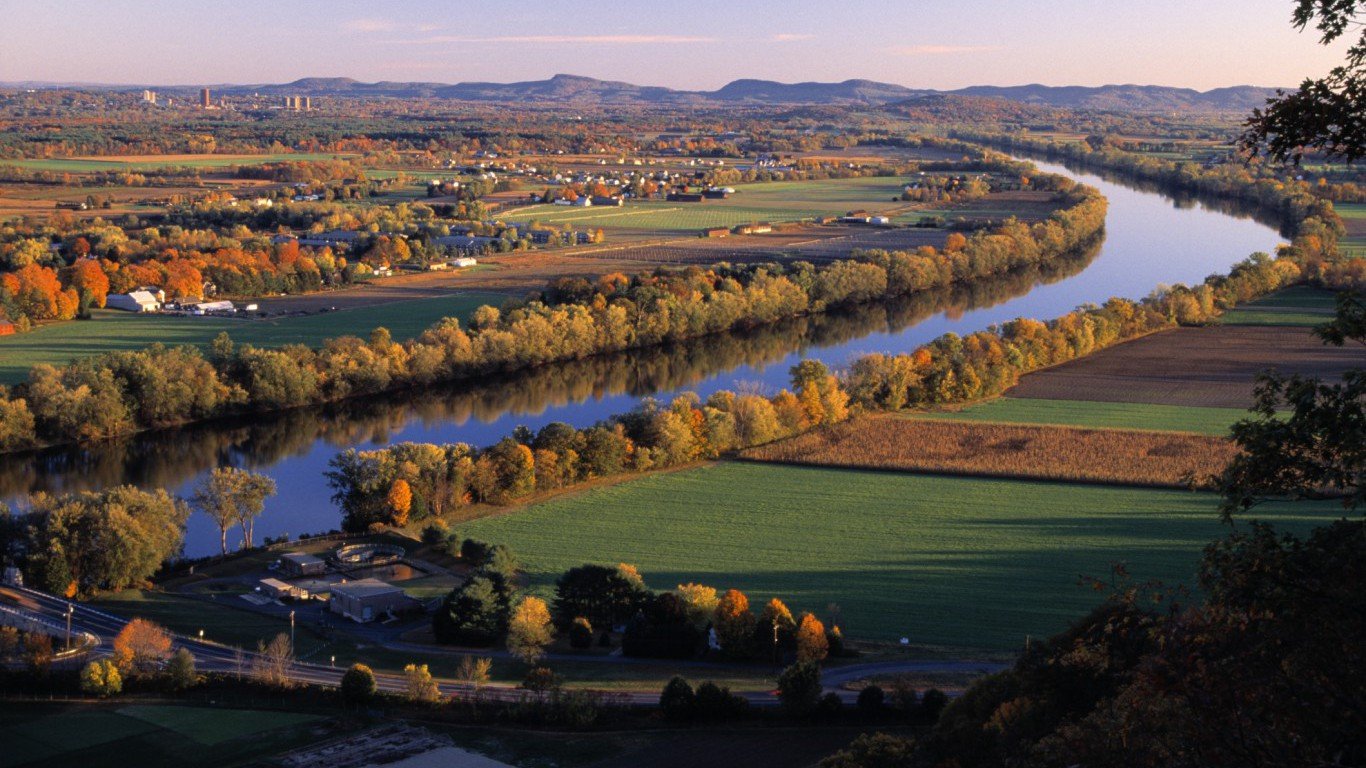
35. Massachusetts
> African American population: 6.8% (25th smallest)
> Median household income: $41,732 (black), $77,091 (white)
> Unemployment rate: 6.0% (black), 3.5% (white)
> Homeownership rate: 31.6% (black), 69.0% (white)
> Incarceration rate (per 100,000): 605 (black), 81 (white)
[in-text-ad]
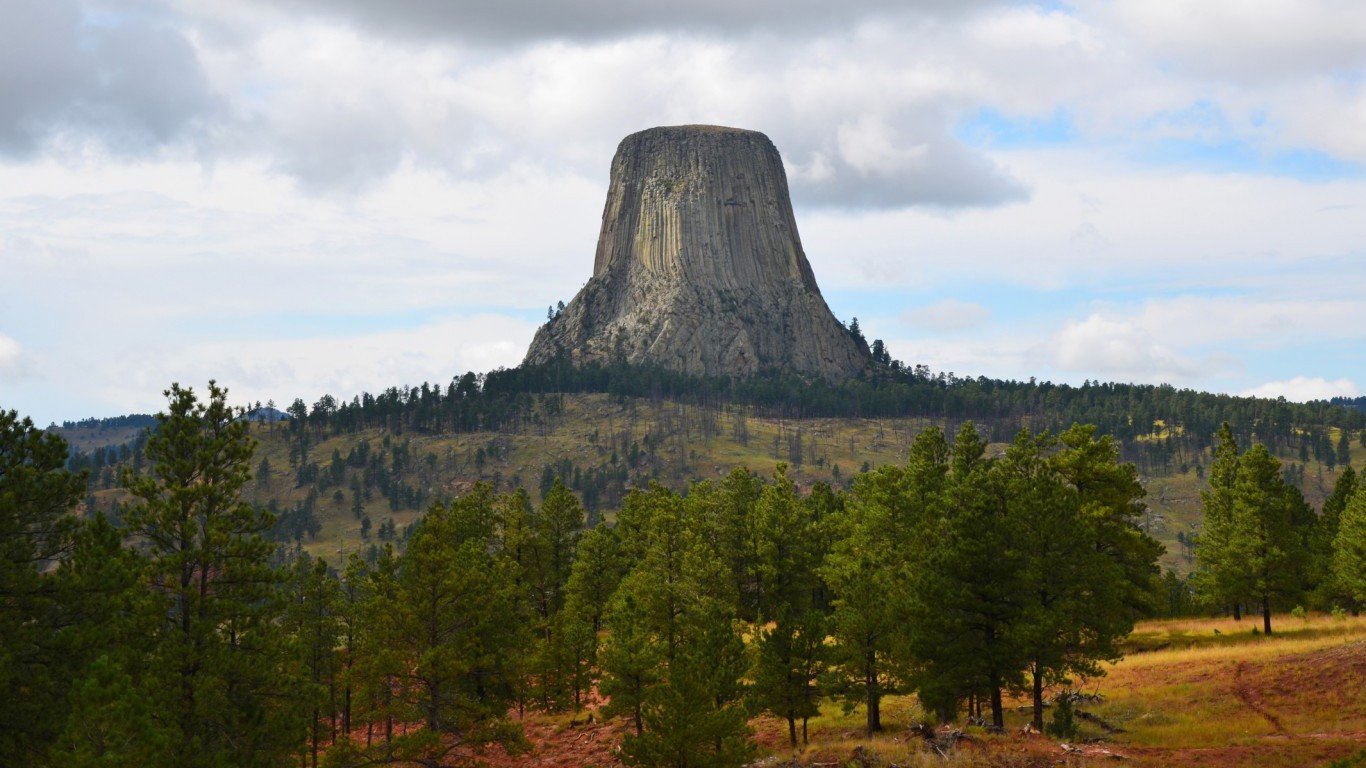
34. Wyoming
> African American population: 0.8% (3rd smallest)
> Median household income: $41,471 (black), $61,683 (white)
> Unemployment rate: N/A, 5.2% (white)
> Homeownership rate: 34.8% (black), 70.0% (white)
> Incarceration rate (per 100,000): 1,307 (black), 375 (white)
[recirclink id=409096]
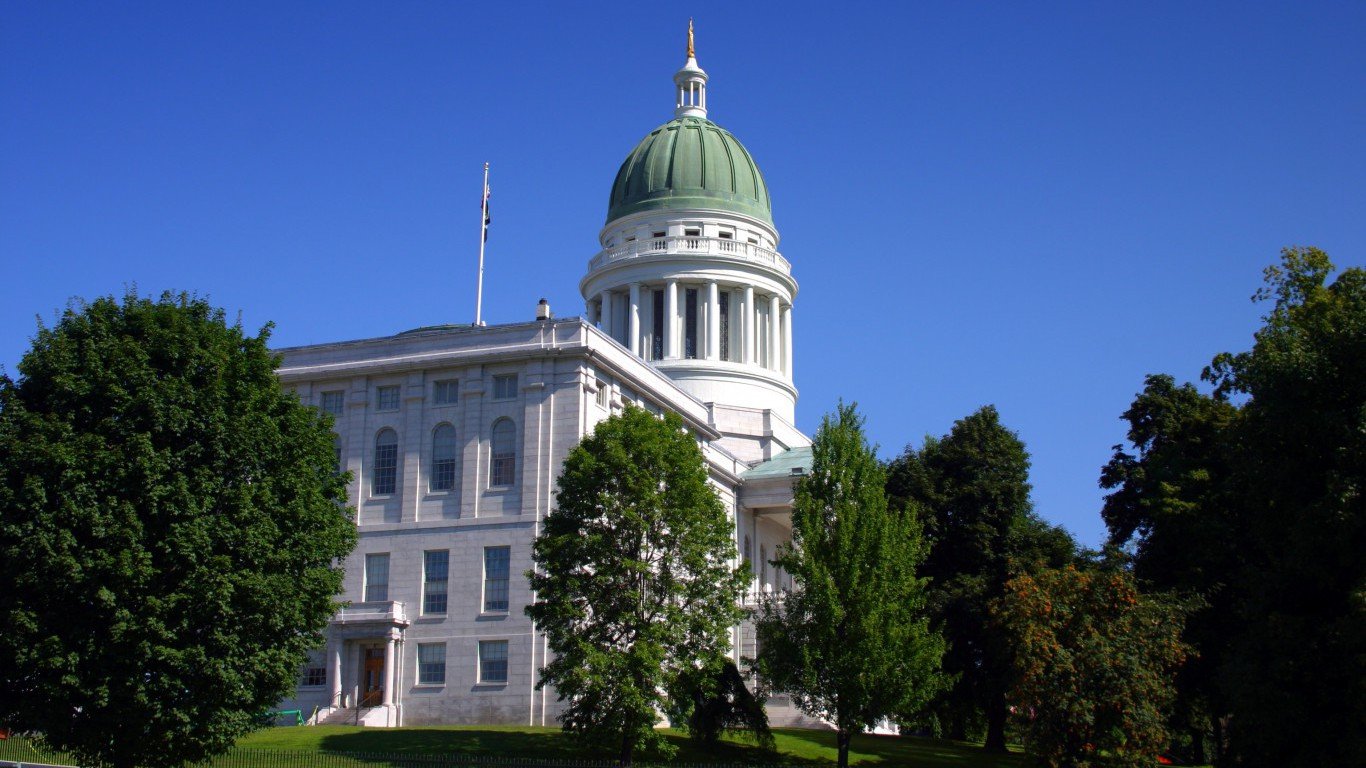
33. Maine
> African American population: 1.0% (4th smallest)
> Median household income: $27,137 (black), $52,062 (white)
> Unemployment rate: N/A, 3.9% (white)
> Homeownership rate: 16.6% (black), 72.3% (white)
> Incarceration rate (per 100,000): 839 (black), 140 (white)

32. Georgia
> African American population: 30.9% (3rd largest)
> Median household income: $37,855 (black), $60,125 (white)
> Unemployment rate: 8.2% (black), 3.9% (white)
> Homeownership rate: 45.1% (black), 72.3% (white)
> Incarceration rate (per 100,000): 1,066 (black), 329 (white)
[in-text-ad-2]

31. New York
> African American population: 14.4% (13th largest)
> Median household income: $42,652 (black), $70,379 (white)
> Unemployment rate: 7.5% (black), 4.2% (white)
> Homeownership rate: 30.9% (black), 66.1% (white)
> Incarceration rate (per 100,000): 896 (black), 112 (white)
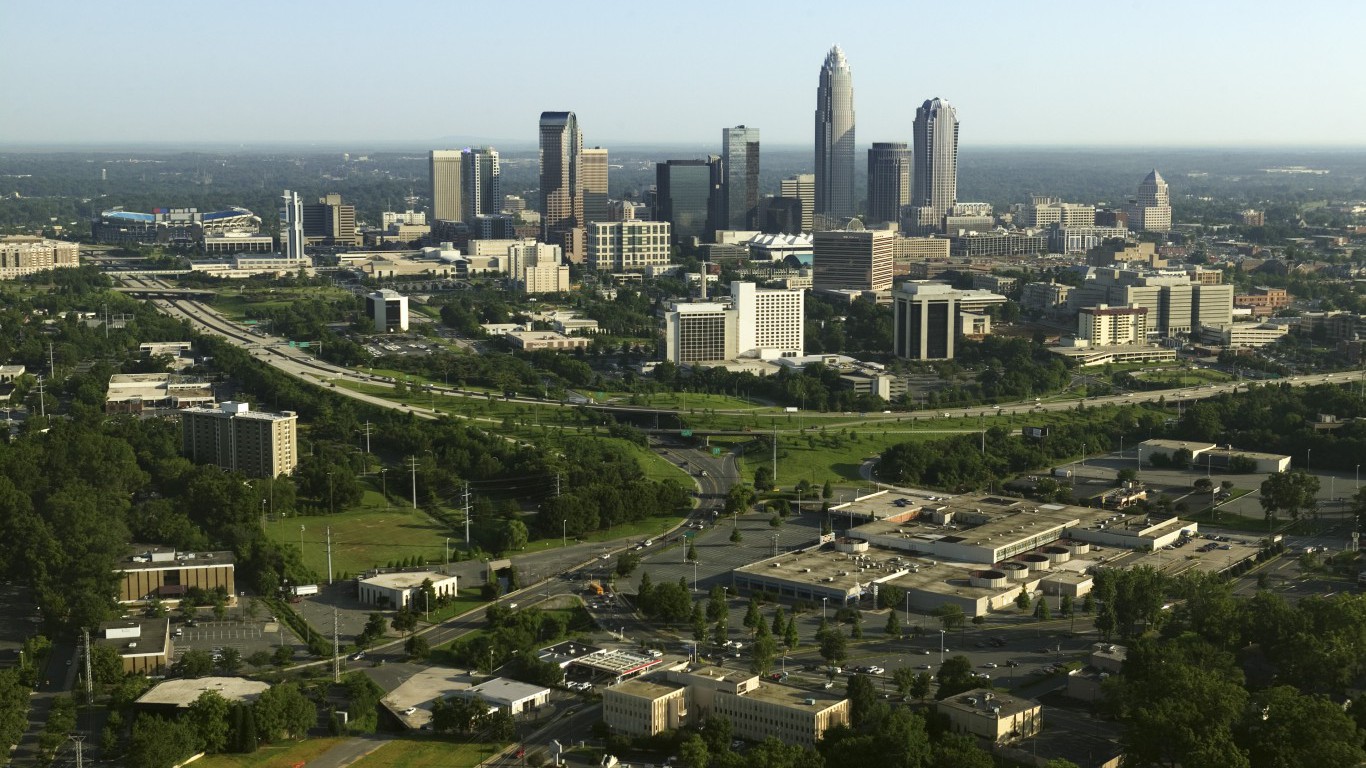
30. North Carolina
> African American population: 21.3% (7th largest)
> Median household income: $32,884 (black), $54,700 (white)
> Unemployment rate: 8.1% (black), 4.0% (white)
> Homeownership rate: 44.7% (black), 72.0% (white)
> Incarceration rate (per 100,000): 951 (black), 221 (white)
[in-text-ad]

29. South Carolina
> African American population: 27.2% (5th largest)
> Median household income: $31,230 (black), $55,677 (white)
> Unemployment rate: 7.5% (black), 4.0% (white)
> Homeownership rate: 52.8% (black), 75.7% (white)
> Incarceration rate (per 100,000): 1,030 (black), 238 (white)
[recirclink id=404837]

28. Arkansas
> African American population: 15.7% (11th largest)
> Median household income: $27,256 (black), $46,393 (white)
> Unemployment rate: 7.7% (black), 3.2% (white)
> Homeownership rate: 42.0% (black), 70.8% (white)
> Incarceration rate (per 100,000): 1,665 (black), 443 (white)
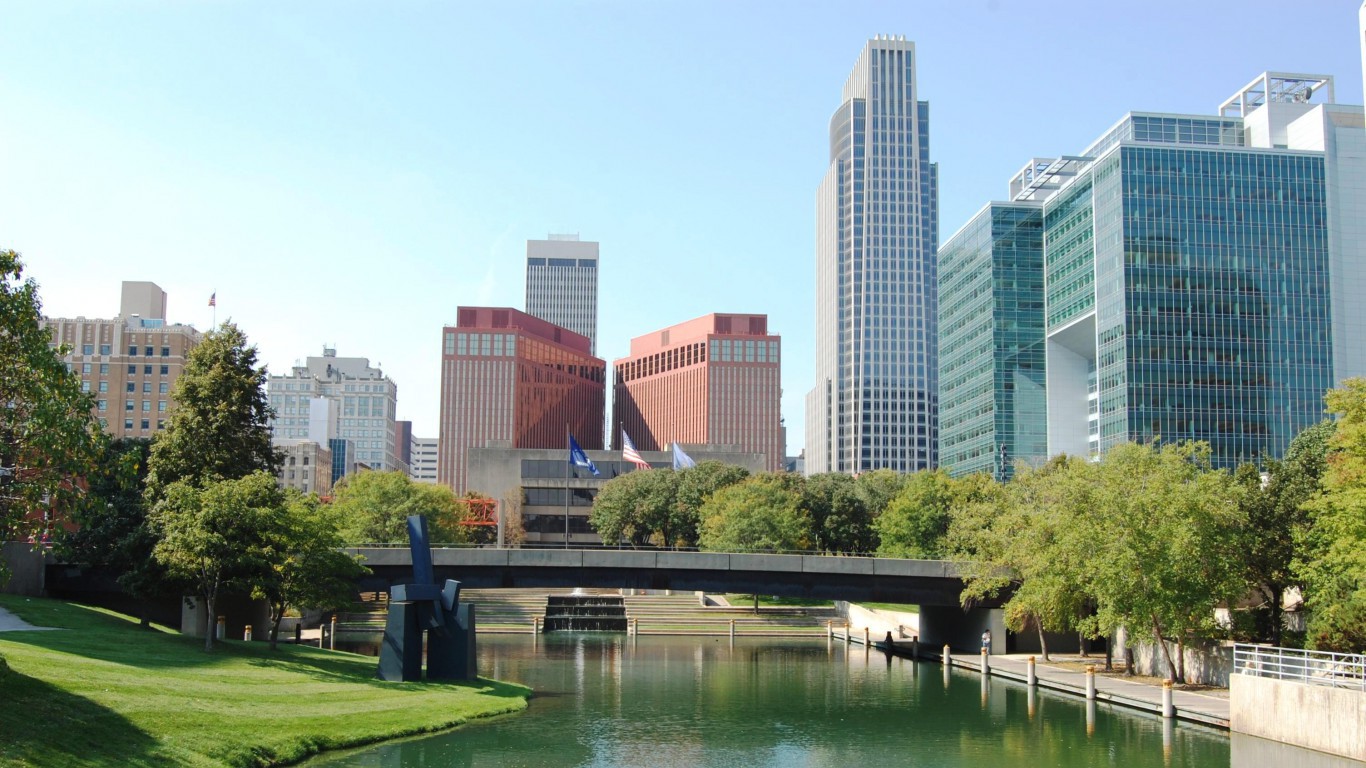
27. Nebraska
> African American population: 4.7% (19th smallest)
> Median household income: $32,019 (black), $59,078 (white)
> Unemployment rate: N/A, 2.7% (white)
> Homeownership rate: 31.9% (black), 70.0% (white)
> Incarceration rate (per 100,000): 1,680 (black), 201 (white)
[in-text-ad-2]

26. Arizona
> African American population: 4.1% (18th smallest)
> Median household income: $39,771 (black), $57,485 (white)
> Unemployment rate: 6.8% (black), 5.1% (white)
> Homeownership rate: 32.9% (black), 68.9% (white)
> Incarceration rate (per 100,000): 2,126 (black), 444 (white)
25. Mississippi
> African American population: 37.6% (the largest)
> Median household income: $26,818 (black), $50,609 (white)
> Unemployment rate: 7.8% (black), 4.5% (white)
> Homeownership rate: 53.5% (black), 76.5% (white)
> Incarceration rate (per 100,000): 1,052 (black), 346 (white)
[in-text-ad]

24. Oklahoma
> African American population: 7.2% (25th largest)
> Median household income: $31,438 (black), $51,874 (white)
> Unemployment rate: 7.9% (black), 4.2% (white)
> Homeownership rate: 36.6% (black), 70.6% (white)
> Incarceration rate (per 100,000): 2,625 (black), 580 (white)
[recirclink id=409096]
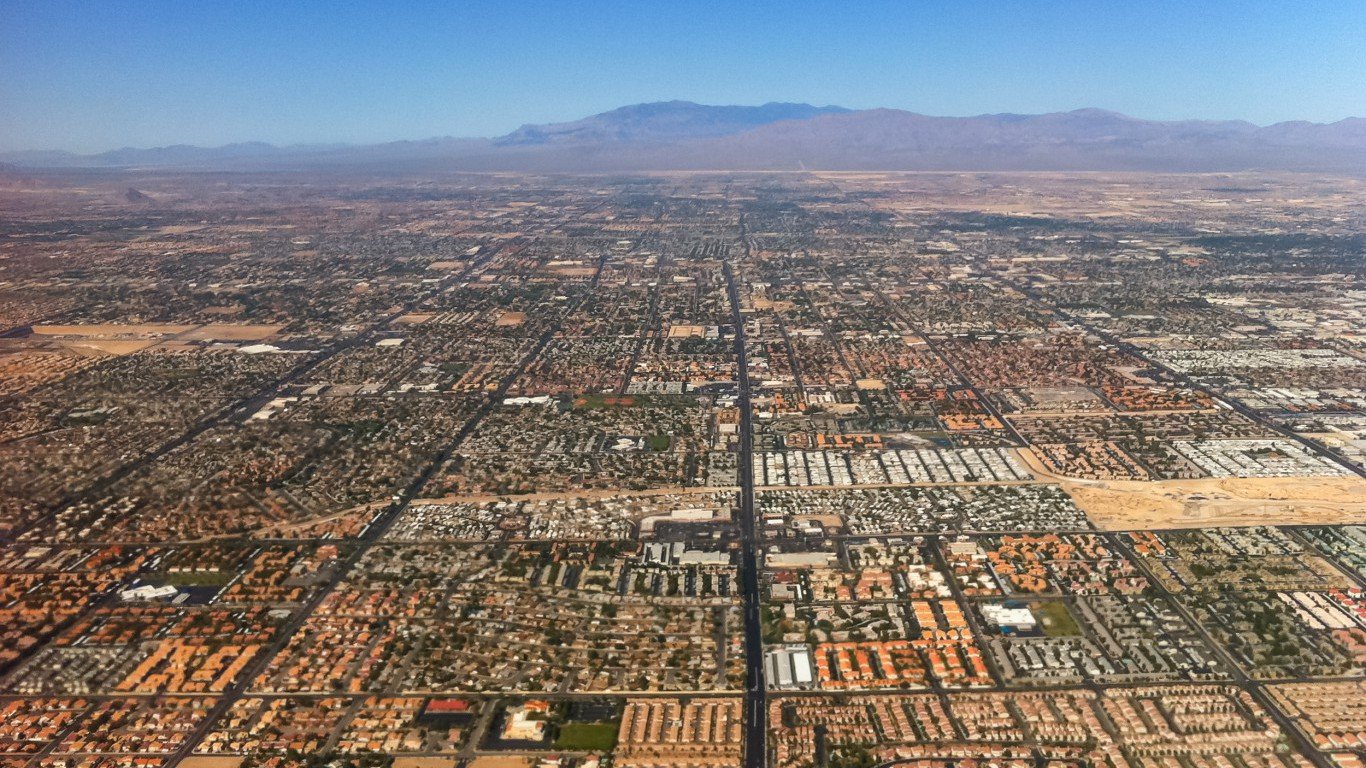
23. Nevada
> African American population: 8.2% (23rd largest)
> Median household income: $36,981 (black), $58,723 (white)
> Unemployment rate: 12.7% (black), 4.6% (white)
> Homeownership rate: 29.6% (black), 61.1% (white)
> Incarceration rate (per 100,000): 1,592 (black), 387 (white)

22. Missouri
> African American population: 11.6% (19th largest)
> Median household income: $33,501 (black), $52,707 (white)
> Unemployment rate: 9.0% (black), 3.7% (white)
> Homeownership rate: 38.2% (black), 71.0% (white)
> Incarceration rate (per 100,000): 1,654 (black), 404 (white)
[in-text-ad-2]

21. Texas
> African American population: 11.7% (18th largest)
> Median household income: $40,812 (black), $68,654 (white)
> Unemployment rate: 6.9% (black), 4.2% (white)
> Homeownership rate: 40.1% (black), 69.8% (white)
> Incarceration rate (per 100,000): 1,844 (black), 457 (white)

20. Kentucky
> African American population: 7.9% (24th largest)
> Median household income: $30,982 (black), $46,917 (white)
> Unemployment rate: 6.9% (black), 4.8% (white)
> Homeownership rate: 35.7% (black), 70.2% (white)
> Incarceration rate (per 100,000): 1,411 (black), 431 (white)
[in-text-ad]

19. Tennessee
> African American population: 16.7% (10th largest)
> Median household income: $34,462 (black), $50,779 (white)
> Unemployment rate: 8.9% (black), 3.8% (white)
> Homeownership rate: 43.5% (black), 72.0% (white)
> Incarceration rate (per 100,000): 1,166 (black), 316 (white)
[recirclink id=405409]
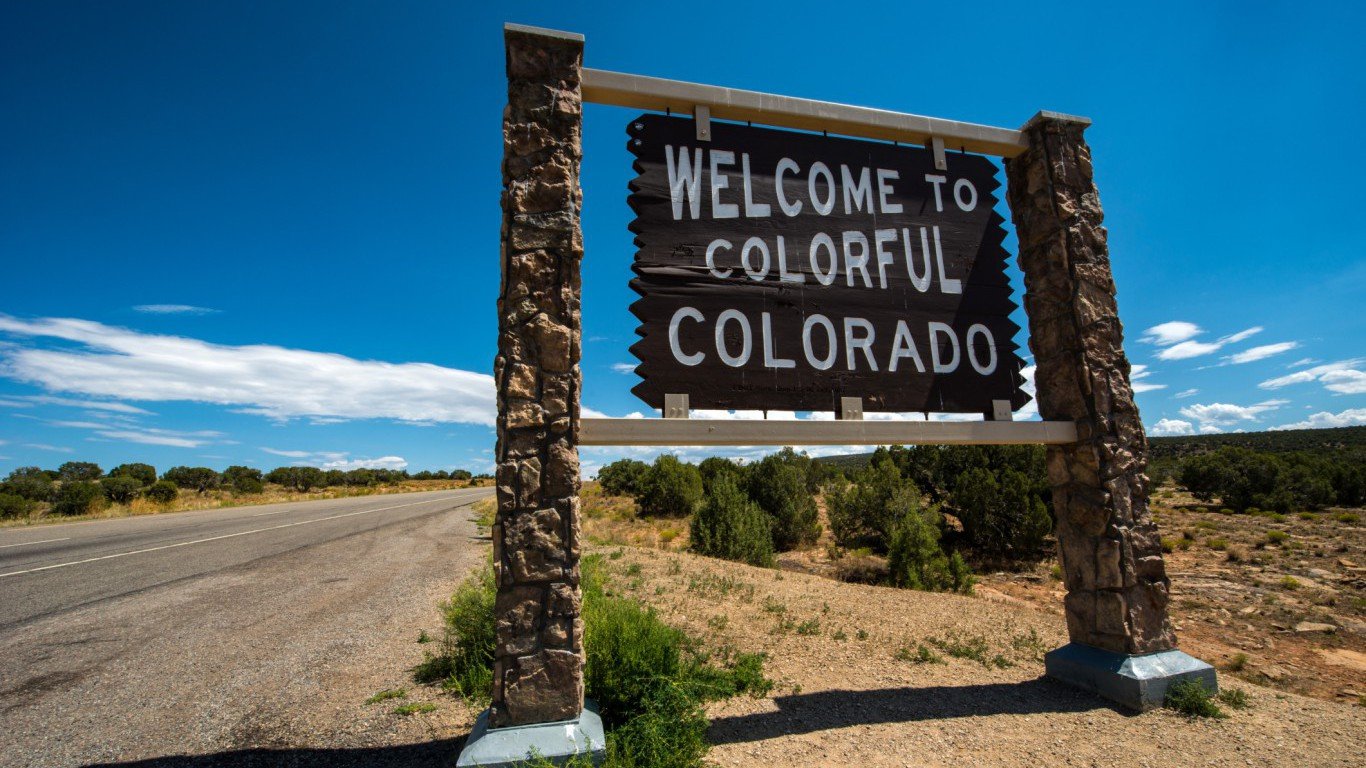
18. Colorado
> African American population: 3.9% (17th smallest)
> Median household income: $45,793 (black), $70,332 (white)
> Unemployment rate: 4.8% (black), 3.2% (white)
> Homeownership rate: 38.2% (black), 68.8% (white)
> Incarceration rate (per 100,000): 1,891 (black), 260 (white)

17. Indiana
> African American population: 9.0% (22nd largest)
> Median household income: $31,639 (black), $53,080 (white)
> Unemployment rate: 8.9% (black), 4.1% (white)
> Homeownership rate: 36.2% (black), 73.1% (white)
> Incarceration rate (per 100,000): 1,616 (black), 339 (white)
[in-text-ad-2]
16. Connecticut
> African American population: 9.9% (21st largest)
> Median household income: $44,418 (black), $81,324 (white)
> Unemployment rate: 10.8% (black), 4.7% (white)
> Homeownership rate: 39.5% (black), 75.7% (white)
> Incarceration rate (per 100,000): 1,392 (black), 148 (white)

15. New Jersey
> African American population: 12.7% (16th largest)
> Median household income: $47,268 (black), $83,881 (white)
> Unemployment rate: 7.3% (black), 4.4% (white)
> Homeownership rate: 36.8% (black), 76.1% (white)
> Incarceration rate (per 100,000): 1,140 (black), 94 (white)
[in-text-ad]
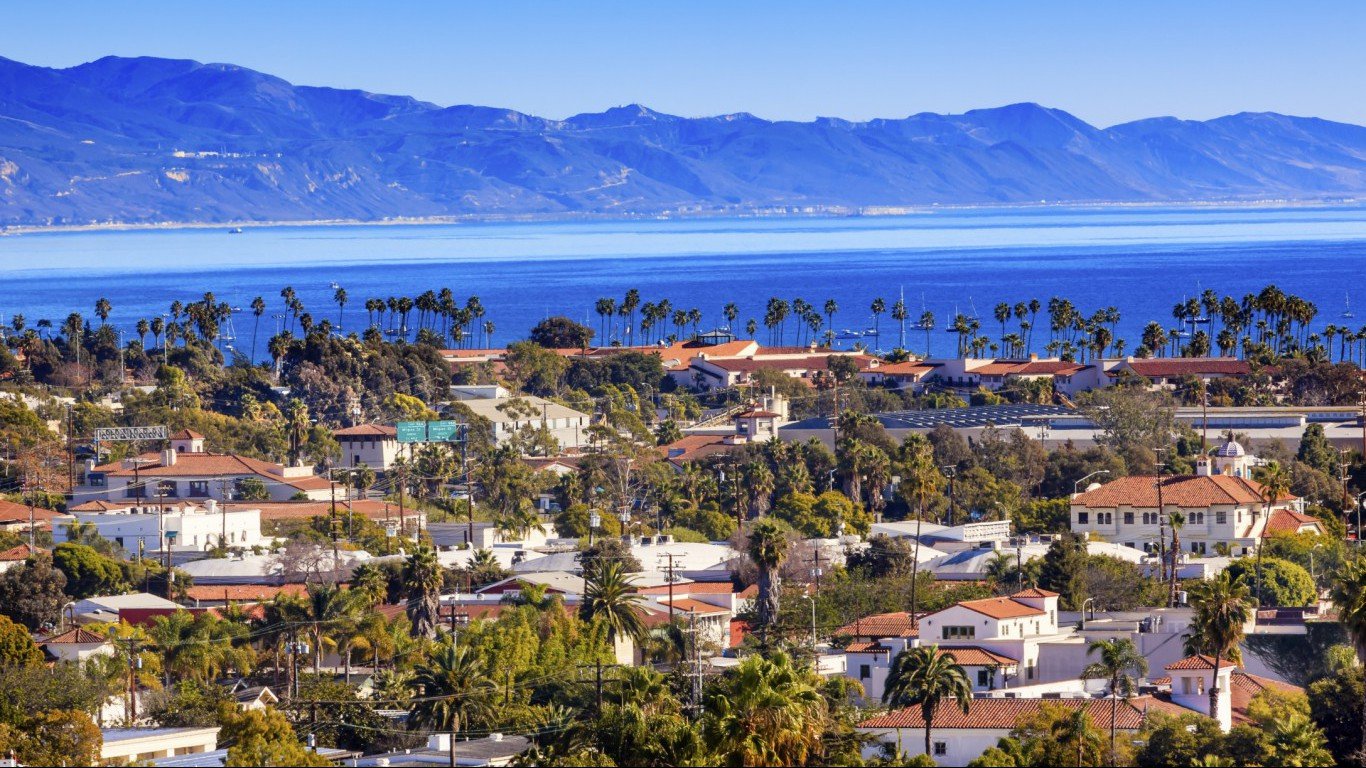
14. California
> African American population: 5.6% (21st smallest)
> Median household income: $45,217 (black), $75,933 (white)
> Unemployment rate: 8.8% (black), 5.4% (white)
> Homeownership rate: 33.3% (black), 62.5% (white)
> Incarceration rate (per 100,000): 1,767 (black), 201 (white)
[recirclink id=409096]

13. Alabama
> African American population: 26.7% (6th largest)
> Median household income: $29,854 (black), $51,754 (white)
> Unemployment rate: 10.1% (black), 4.6% (white)
> Homeownership rate: 49.7% (black), 75.8% (white)
> Incarceration rate (per 100,000): 1,417 (black), 425 (white)
12. Florida
> African American population: 15.5% (12th largest)
> Median household income: $35,936 (black), $54,626 (white)
> Unemployment rate: 7.9% (black), 4.3% (white)
> Homeownership rate: 43.3% (black), 72.5% (white)
> Incarceration rate (per 100,000): 1,621 (black), 448 (white)
[in-text-ad-2]

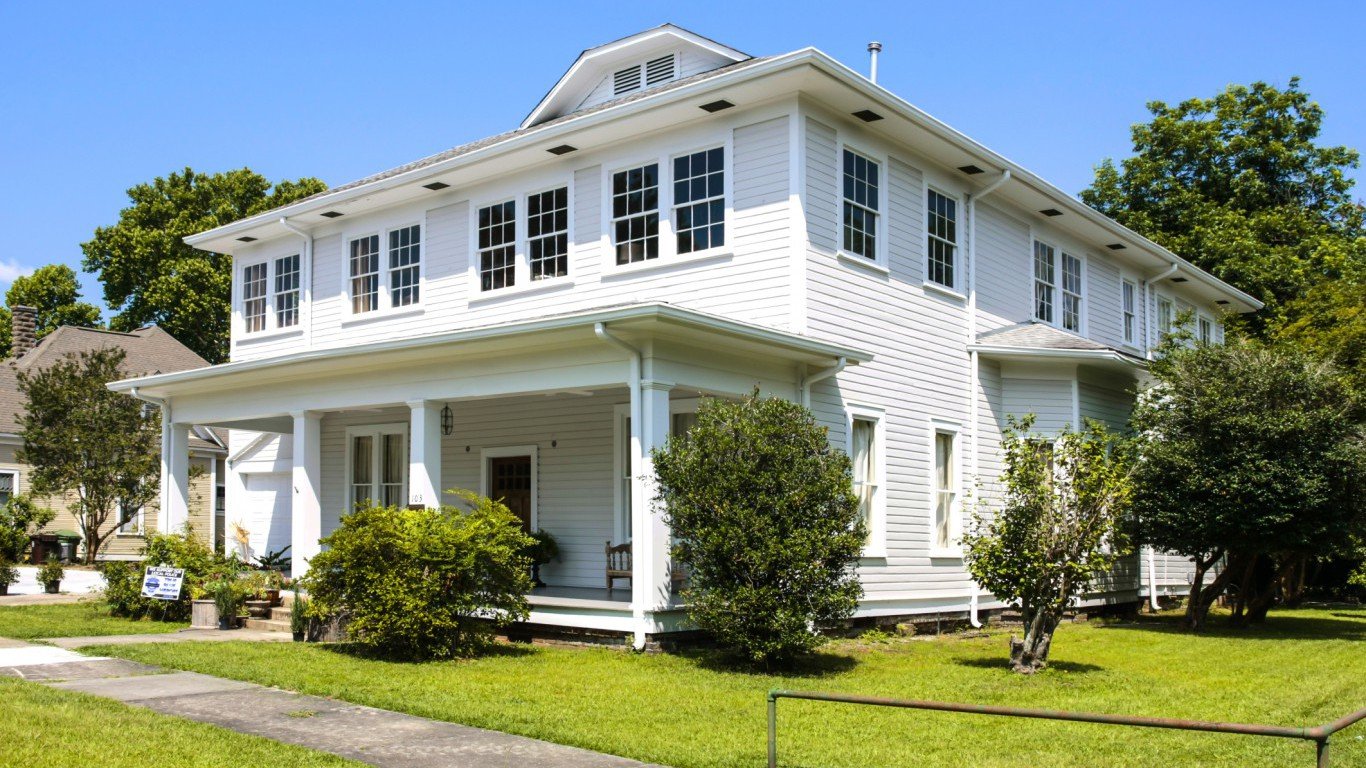
11. Louisiana
> African American population: 31.9% (2nd largest)
> Median household income: $27,537 (black), $56,661 (white)
> Unemployment rate: 10.5% (black), 4.3% (white)
> Homeownership rate: 46.3% (black), 74.4% (white)
> Incarceration rate (per 100,000): 1,740 (black), 438 (white)
10. Kansas
> African American population: 5.8% (23rd smallest)
> Median household income: $35,350 (black), $57,799 (white)
> Unemployment rate: 10.4% (black), 3.7% (white)
> Homeownership rate: 34.9% (black), 71.1% (white)
> Incarceration rate (per 100,000): 1,734 (black), 246 (white)
[in-text-ad]

9. Ohio
> African American population: 12.1% (17th largest)
> Median household income: $29,608 (black), $55,448 (white)
> Unemployment rate: 9.6% (black), 4.2% (white)
> Homeownership rate: 34.9% (black), 71.5% (white)
> Incarceration rate (per 100,000): 1,625 (black), 289 (white)
[recirclink id=405048]

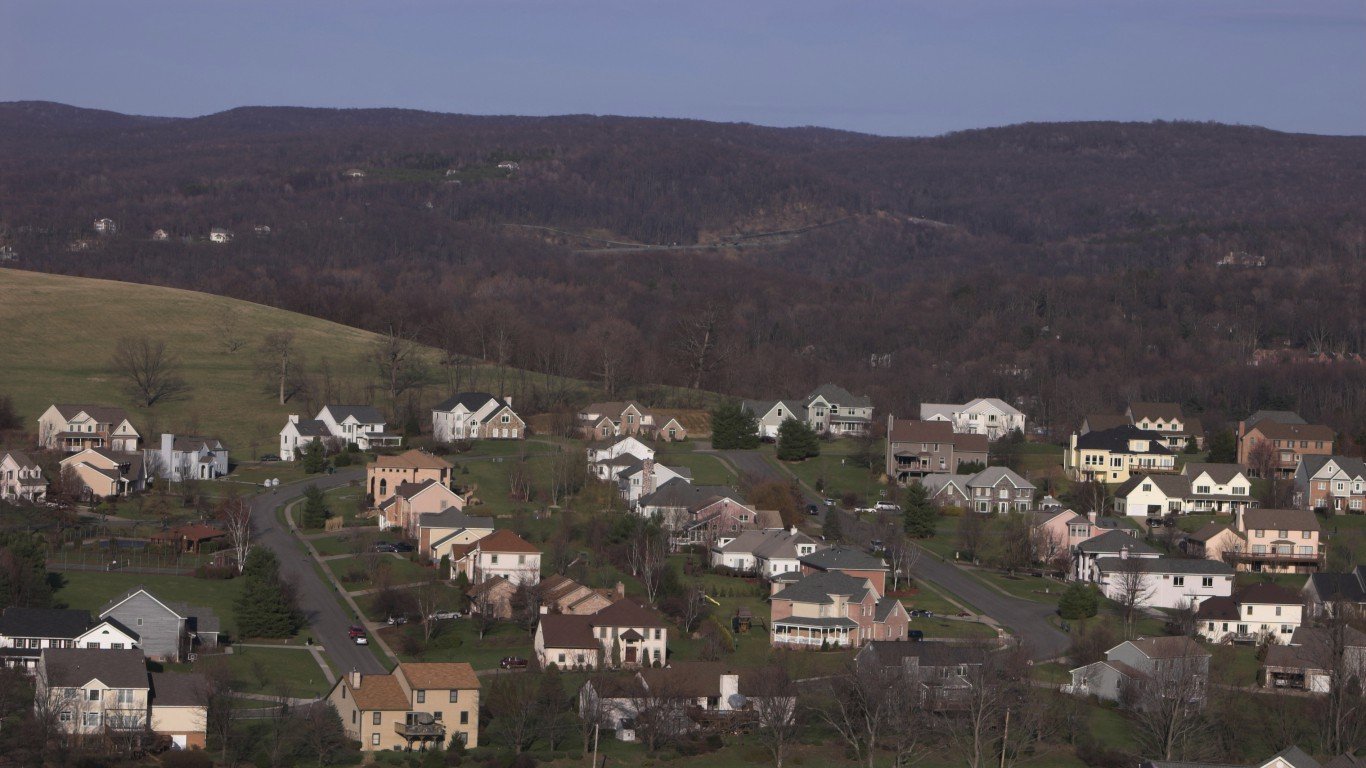
8. Virginia
> African American population: 18.9% (9th largest)
> Median household income: $44,480 (black), $71,403 (white)
> Unemployment rate: 7.1% (black), 3.1% (white)
> Homeownership rate: 45.5% (black), 72.2% (white)
> Incarceration rate (per 100,000): 1,386 (black), 280 (white)

7. Michigan
> African American population: 13.7% (15th largest)
> Median household income: $31,099 (black), $55,083 (white)
> Unemployment rate: 10.1% (black), 4.1% (white)
> Homeownership rate: 40.8% (black), 76.8% (white)
> Incarceration rate (per 100,000): 1,682 (black), 253 (white)
[in-text-ad-2]
6. Pennsylvania
> African American population: 10.5% (20th largest)
> Median household income: $33,487 (black), $60,327 (white)
> Unemployment rate: 11.4% (black), 4.9% (white)
> Homeownership rate: 42.9% (black), 74.2% (white)
> Incarceration rate (per 100,000): 1,810 (black), 204 (white)
5. Iowa
> African American population: 3.3% (13th smallest)
> Median household income: $28,425 (black), $56,646 (white)
> Unemployment rate: N/A, 3.6% (white)
> Homeownership rate: 26.2% (black), 73.5% (white)
> Incarceration rate (per 100,000): 2,349 (black), 211 (white)
[in-text-ad]
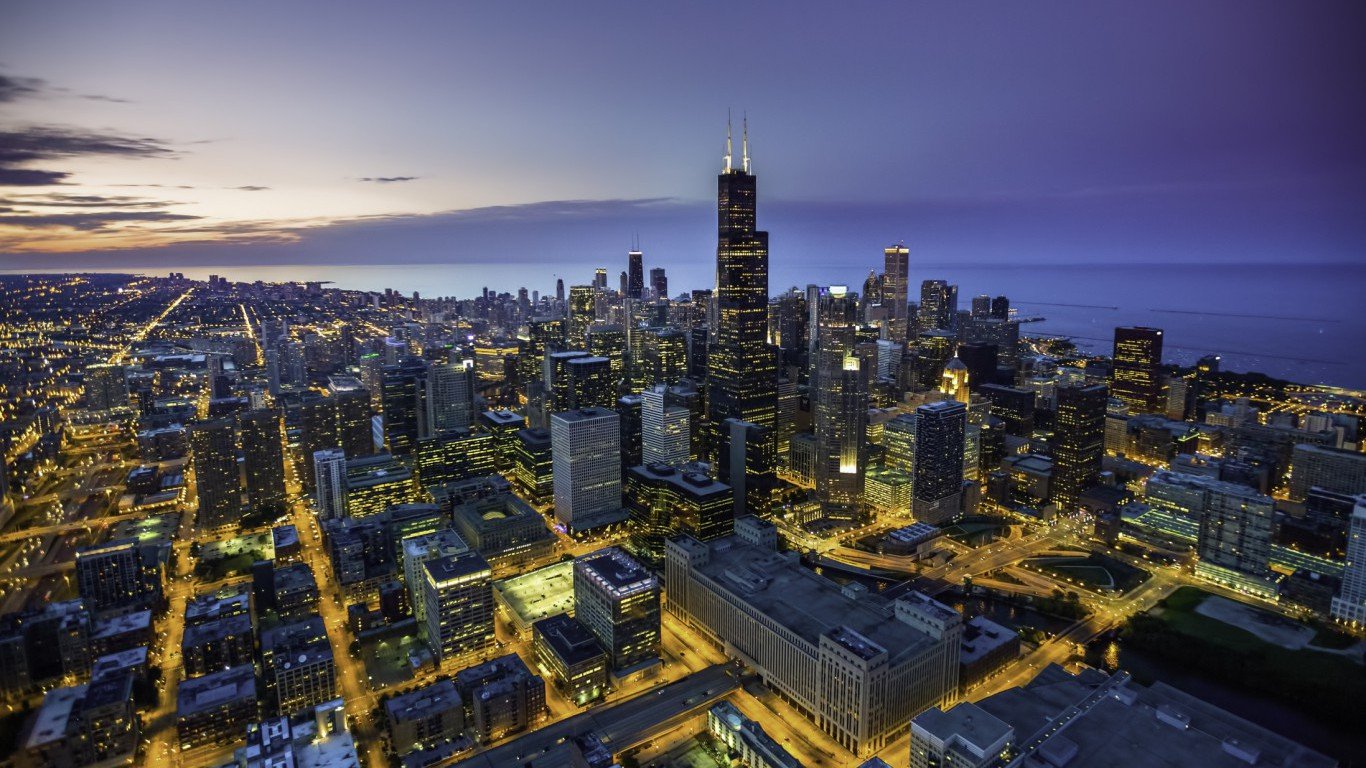
4. Illinois
> African American population: 14.1% (14th largest)
> Median household income: $33,950 (black), $66,237 (white)
> Unemployment rate: 12.7% (black), 5.0% (white)
> Homeownership rate: 38.0% (black), 74.0% (white)
> Incarceration rate (per 100,000): 1,533 (black), 174 (white)
[recirclink id=409096]
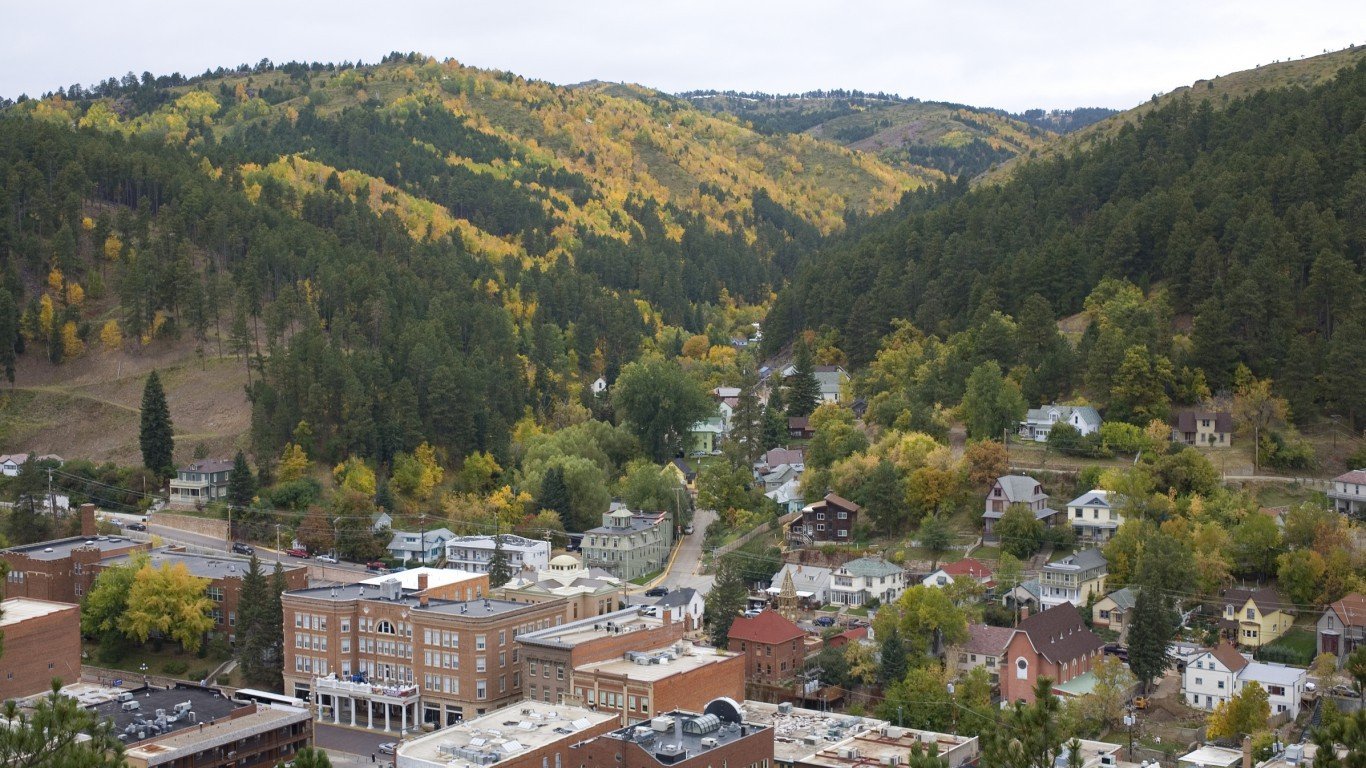
3. South Dakota
> African American population: 1.5% (8th smallest)
> Median household income: $22,399 (black), $56,177 (white)
> Unemployment rate: N/A, 1.5% (white)
> Homeownership rate: 21.3% (black), 71.8% (white)
> Incarceration rate (per 100,000): 1,493 (black), 309 (white)
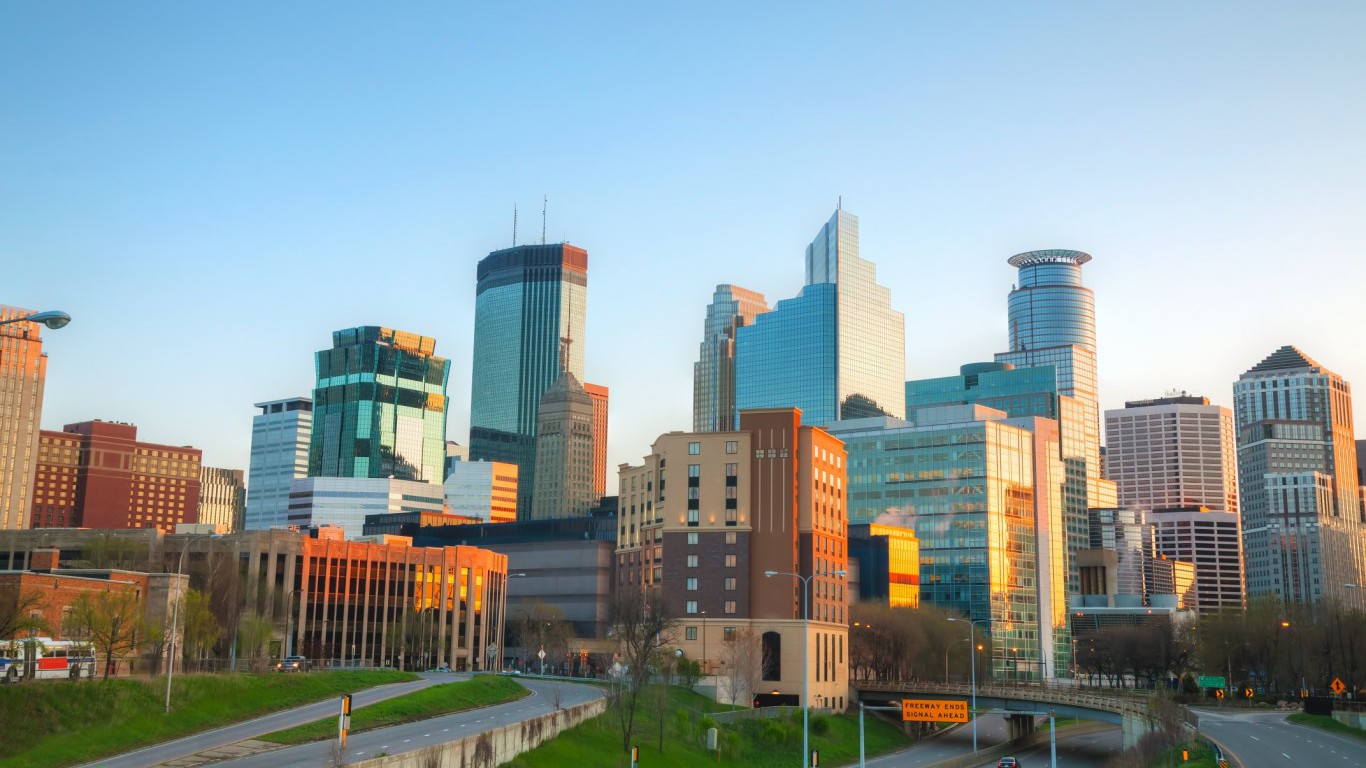
2. Minnesota
> African American population: 5.7% (22nd smallest)
> Median household income: $30,306 (black), $66,979 (white)
> Unemployment rate: 8.8% (black), 3.0% (white)
> Homeownership rate: 21.7% (black), 76.0% (white)
> Incarceration rate (per 100,000): 1,219 (black), 111 (white)
[in-text-ad-2]

1. Wisconsin
> African American population: 6.2% (24th smallest)
> Median household income: $29,223 (black), $59,056 (white)
> Unemployment rate: 10.6% (black), 3.8% (white)
> Homeownership rate: 26.2% (black), 71.6% (white)
> Incarceration rate (per 100,000): 2,542 (black), 221 (white)
Detailed Findings and Methodology
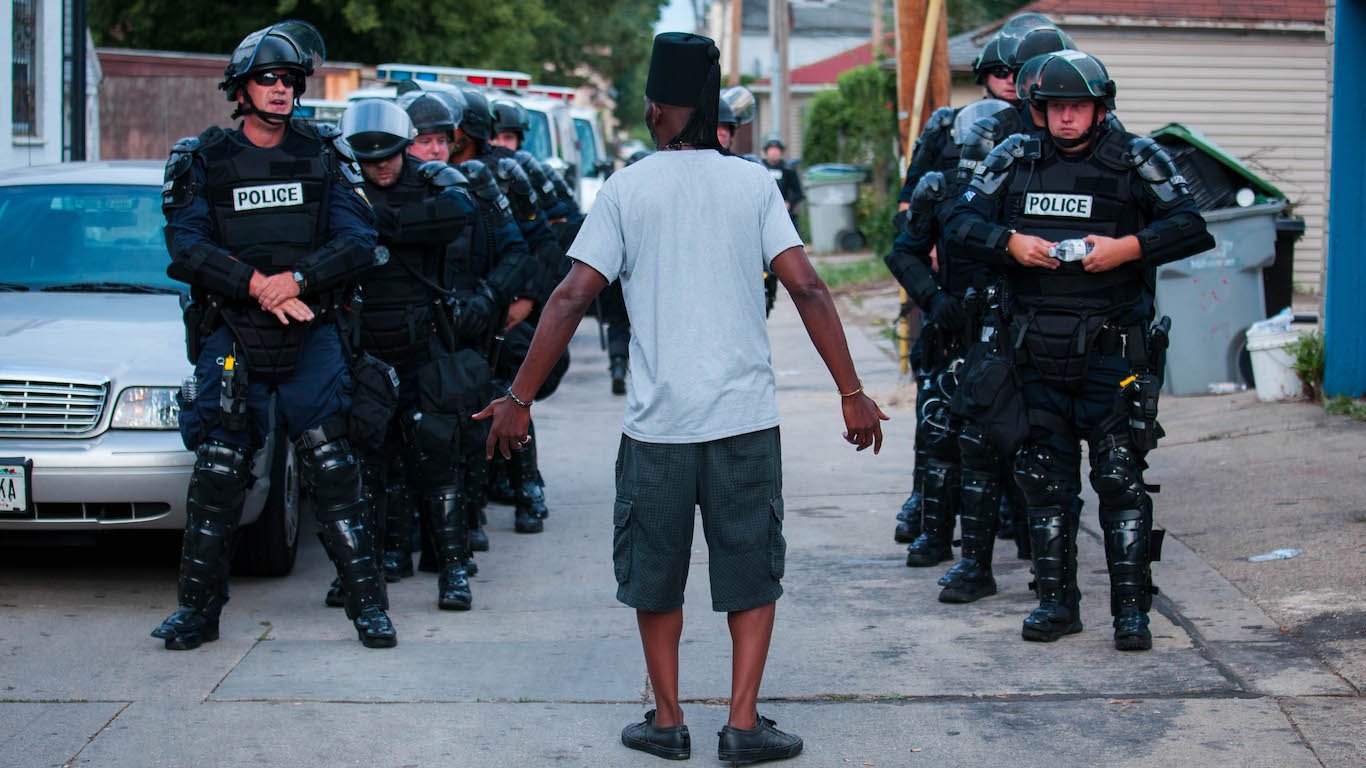
The differences in imprisonment might be the most shockingly unequal outcome of ongoing race-related disparities in the United States. While 275 out of every 100,000 While Americans are incarcerated, 1,408 out of every 100,000 black Americans are, resulting in a black incarceration rate that is over five times as high as the white incarceration rate.
Many underlying causes contribute to the ongoing racial inequality in the United States — and mostly they are interconnected. Higher poverty often leads to less education, poorer health outcomes, and more crime.
Those who are incarcerated are less likely to be able to find employment. Harvard professor of sociology Devah Pager said of the relationship between black incarceration and employment: “The criminal justice system really casts a shadow over all black men and strengthens that association between blackness and criminality in a way that affects the entire black population.“ This phenomenon is not limited to those with a record. “Being black in America today is sort of like having a felony conviction in terms of how employers view these applicants,“ Pager added.
Another way inequality tends to be a self-perpetuating cycle is education. In the United States, a large share of public school funding comes from local property taxes. African Americans are about five times as likely to live in poverty and in high poverty neighborhoods as white Americans. For this reason, they are also far more likely to attend underfunded schools. The effects of attending schools with meaningfully different quality as a result of simply growing up in a particular neighborhood can affect people throughout their lives.
To review black and white racial inequality in all 50 states, 24/7 Wall St. created an index of 10 measures to assess racial gaps in achievement and access to resources and opportunities in each state. A index score was constructed based on the gap between black and white Americans for each measure. Ranking states based on racial gaps in various socioeconomic measures highlights the states with the largest disparities between racial groups, and not just the states with the worst socioeconomic climates for whites and blacks overall.
The index includes data on median household income, poverty, high school and bachelor’s educational attainment, and homeownership rate for whites and blacks from the U.S. Census Bureau’s 2015 American Community Survey. Data on white and black 2016 unemployment came from the Bureau of Labor Statistics. Incarceration rates for 2014 and felony disenfranchisement rates were included and came from the Sentencing Project, a nonprofit dedicated to criminal justice reform. Infant mortality rates for 2014 and age-adjusted mortality rates for 2015 came from the Centers for Disease Control and Prevention. All data are for the most recent year available.
Contact [email protected] for any questions or corrections.