
[cnxvideo id=”510431″ placement=”ros”]One of the more sobering realities of 21st-century American life is divorce. Marriages end over a host of issues, including infidelity, stress, money troubles, and personal changes by one or both partners over the course of a marriage. Divorce can be an emotionally wrenching experience and can fracture families. For many children, divorce leaves scars that never heal.
About 40% to 50% of married couples in the United States divorce, according to the American Psychological Association. The divorce rate among those who remarry is even higher.
While divorce is a fact of life in every part of the country, in some states divorce rates are higher than in others. Within all states, there is at least one city where the divorce rate tops the statewide rate.
24/7 Wall St. reviewed Census Bureau data to identify the city in each state that has the highest percentage of divorces among those 15 years and older.
Click here to see the divorce capitals of every state.
Click here to read our detailed findings and methodology.

1. Demopolis, Alabama
> Divorced population: 18.9%
> Divorced population, statewide: 12.5%
> Married population: 33.4%
> Median household income: $25,942
> Households earning less than $10,000: 22.8%
[in-text-ad]

2. Kenai, Alaska
> Divorced population: 18.9%
> Divorced population, statewide: 11.6%
> Married population: 48.8%
> Median household income: $58,732
> Households earning less than $10,000: 4.3%
[recirclink id=434202]

3. Florence, Arizona
> Divorced population: 20.2%
> Divorced population, statewide: 12.4%
> Married population: 33.3%
> Median household income: $48,919
> Households earning less than $10,000: 7.7%

4. Newport, Arkansas
> Divorced population: 23.2%
> Divorced population, statewide: 13.1%
> Married population: 24.8%
> Median household income: $26,853
> Households earning less than $10,000: 18.9%
[in-text-ad-2]
![]()
5. Clearlake, California
> Divorced population: 22.1%
> Divorced population, statewide: 9.5%
> Married population: 33.1%
> Median household income: $25,426
> Households earning less than $10,000: 15.9%

6. Aspen, Colorado
> Divorced population: 23.1%
> Divorced population, statewide: 12.0%
> Married population: 34.8%
> Median household income: $67,776
> Households earning less than $10,000: 5.7%
[in-text-ad]

7. Putnam, Connecticut
> Divorced population: 20.8%
> Divorced population, statewide: 10.7%
> Married population: 35.6%
> Median household income: $47,436
> Households earning less than $10,000: 6.0%
[recirclink id=434095]

8. Elsmere, Delaware
> Divorced population: 18.8%
> Divorced population, statewide: 11.4%
> Married population: 32.0%
> Median household income: $48,021
> Households earning less than $10,000: 5.0%
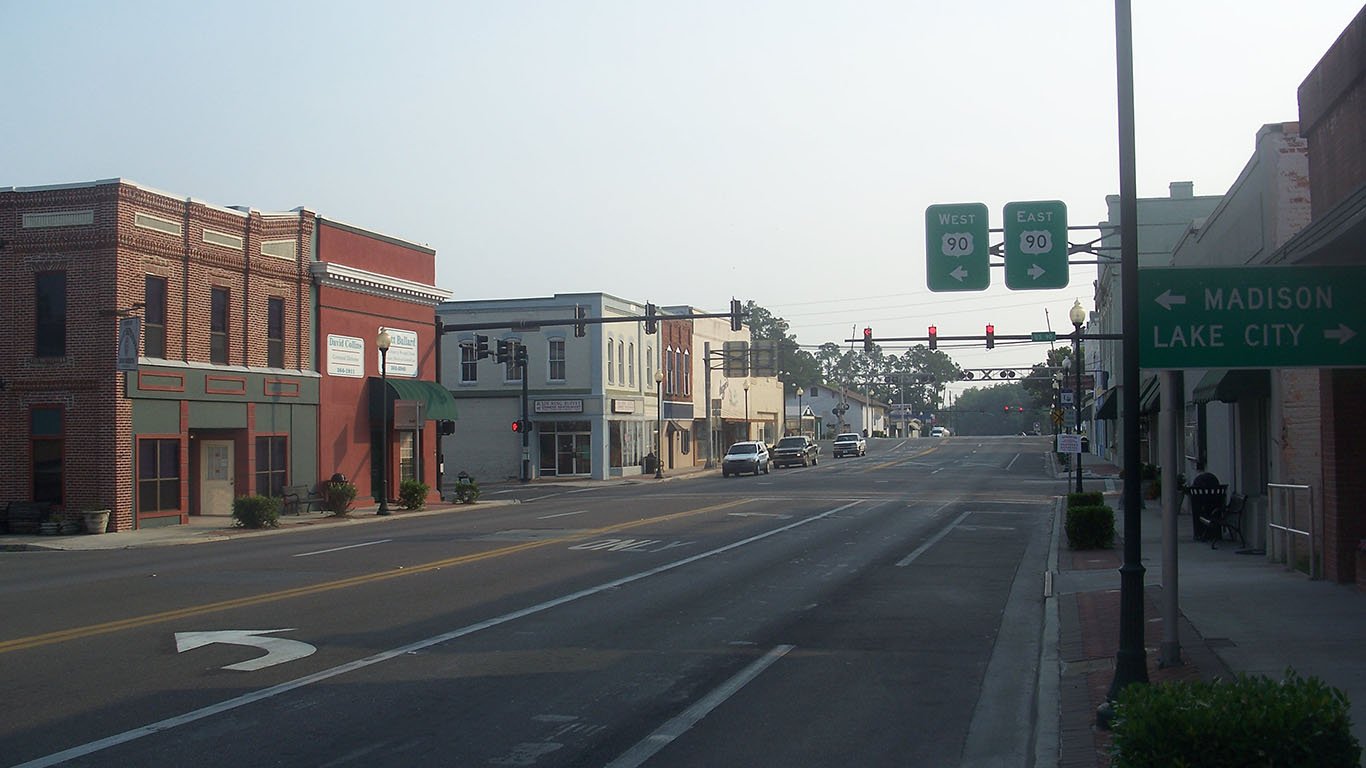
9. Live Oak, Florida
> Divorced population: 23.0%
> Divorced population, statewide: 13.0%
> Married population: 32.3%
> Median household income: $30,060
> Households earning less than $10,000: 16.4%
[in-text-ad-2]
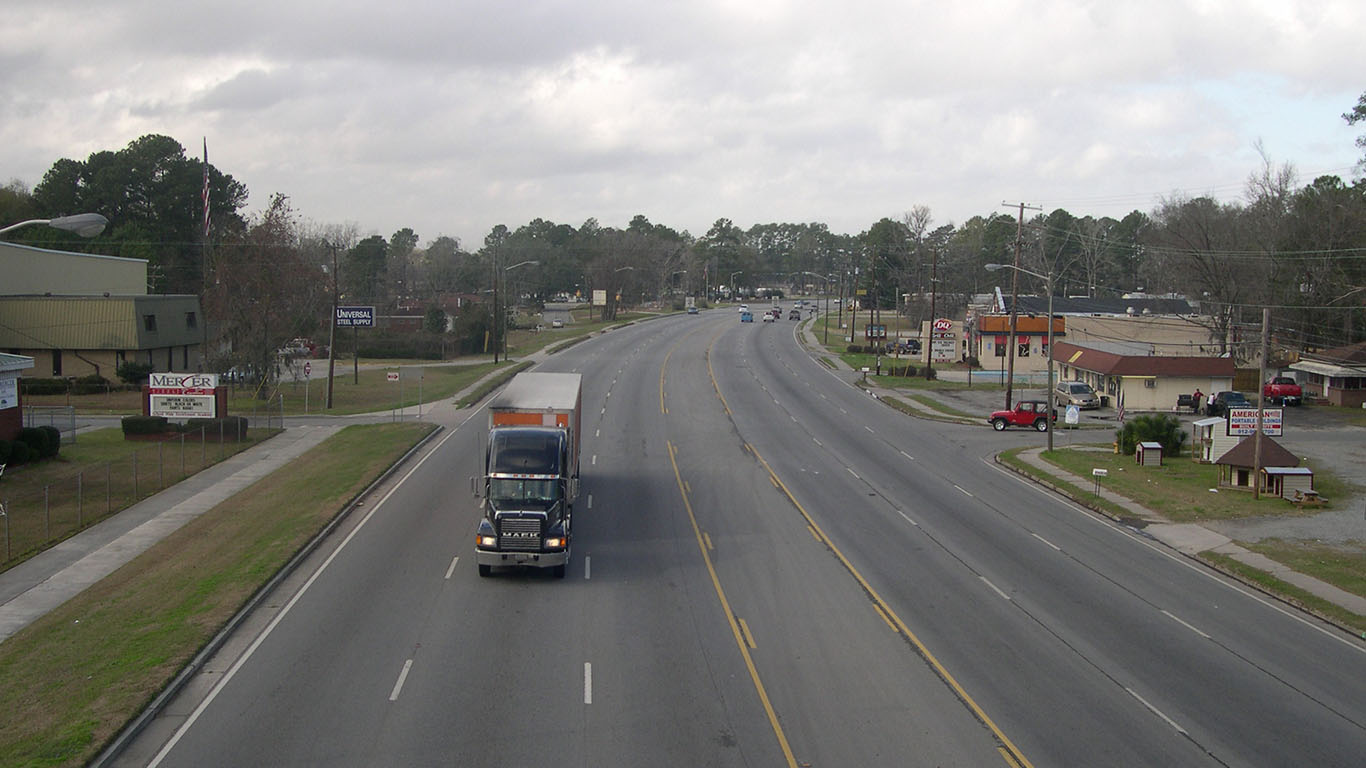
10. Garden City, Georgia
> Divorced population: 18.9%
> Divorced population, statewide: 11.4%
> Married population: 30.1%
> Median household income: $36,097
> Households earning less than $10,000: 12.4%

11. Hawaiian Paradise Park, Hawaii
> Divorced population: 17.2%
> Divorced population, statewide: 9.4%
> Married population: 46.1%
> Median household income: $47,181
> Households earning less than $10,000: 15.5%
[in-text-ad]

12. Sandpoint, Idaho
> Divorced population: 21.2%
> Divorced population, statewide: 12.2%
> Married population: 43.1%
> Median household income: $34,662
> Households earning less than $10,000: 10.4%
[recirclink id=433891]

13. Litchfield, Illinois
> Divorced population: 19.8%
> Divorced population, statewide: 9.8%
> Married population: 44.9%
> Median household income: $38,629
> Households earning less than $10,000: 12.8%
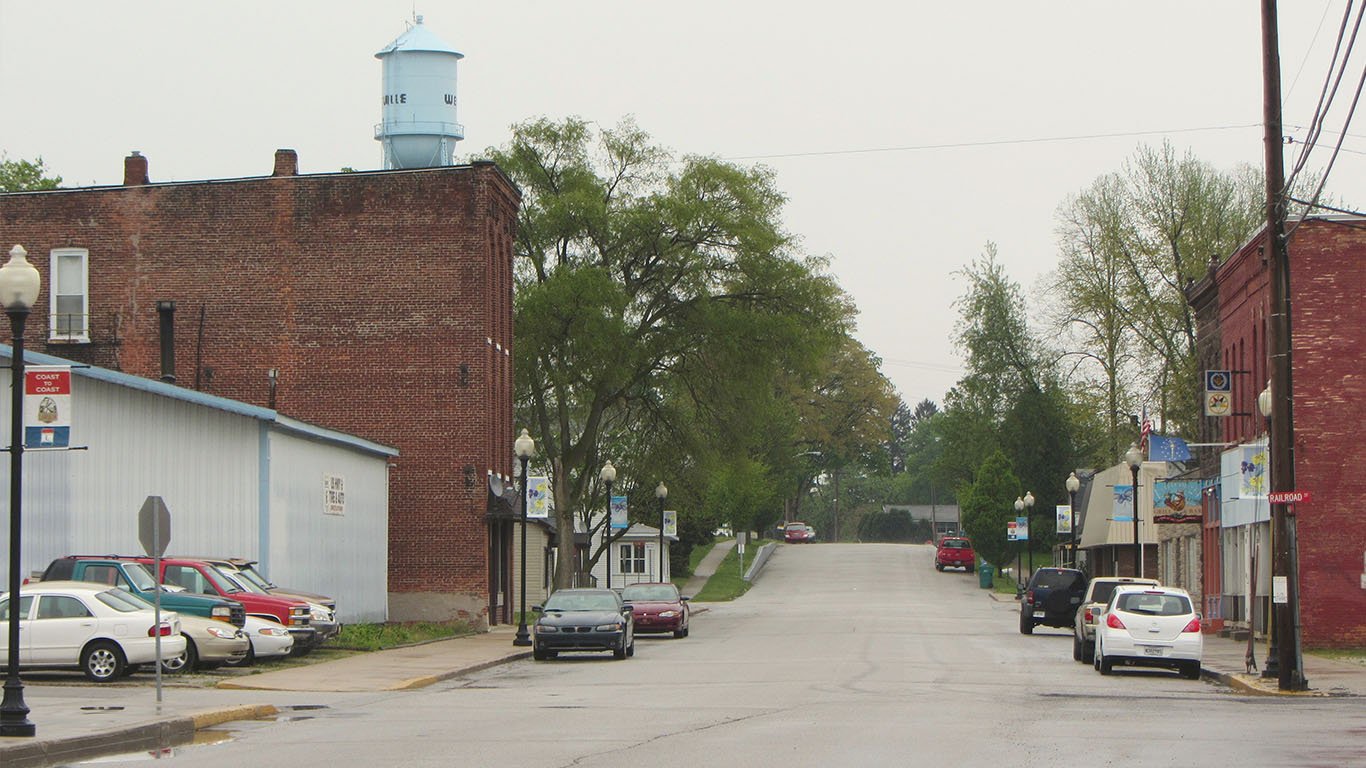
14. Westville, Indiana
> Divorced population: 22.7%
> Divorced population, statewide: 12.7%
> Married population: 20.2%
> Median household income: $42,250
> Households earning less than $10,000: 8.2%
[in-text-ad-2]

15. Fort Madison, Iowa
> Divorced population: 16.4%
> Divorced population, statewide: 10.8%
> Married population: 45.4%
> Median household income: $42,448
> Households earning less than $10,000: 8.8%

16. Chanute, Kansas
> Divorced population: 18.3%
> Divorced population, statewide: 11.5%
> Married population: 47.1%
> Median household income: $37,887
> Households earning less than $10,000: 12.2%
[in-text-ad]

17. Lawrenceburg, Kentucky
> Divorced population: 22.2%
> Divorced population, statewide: 13.2%
> Married population: 50.2%
> Median household income: $51,977
> Households earning less than $10,000: 6.6%
[recirclink id=433818]

18. Westwego, Louisiana
> Divorced population: 19.3%
> Divorced population, statewide: 12.0%
> Married population: 34.0%
> Median household income: $33,898
> Households earning less than $10,000: 8.8%
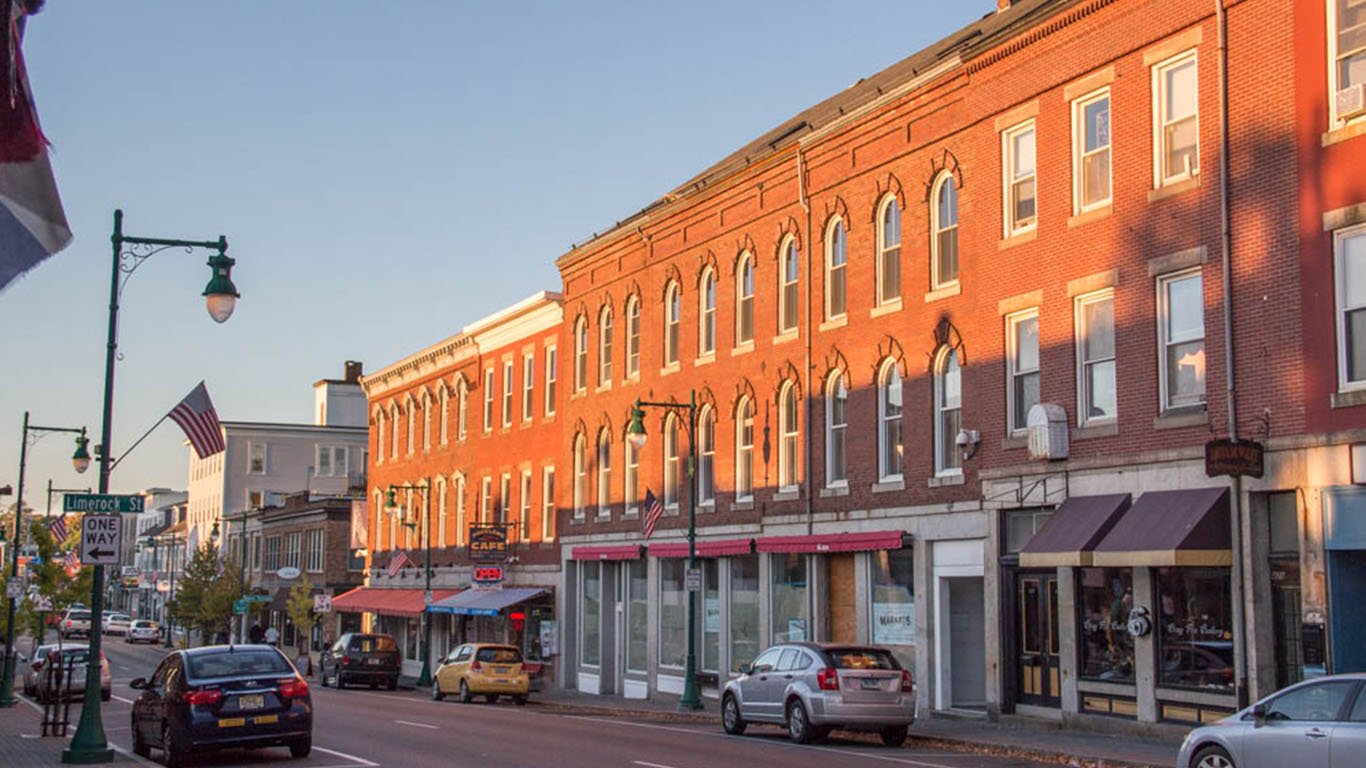
19. Rockland, Maine
> Divorced population: 22.2%
> Divorced population, statewide: 14.1%
> Married population: 39.5%
> Median household income: $40,987
> Households earning less than $10,000: 8.5%
[in-text-ad-2]

20. Edgewater, Maryland
> Divorced population: 16.2%
> Divorced population, statewide: 10.0%
> Married population: 50.8%
> Median household income: $90,718
> Households earning less than $10,000: 2.0%

21. North Adams, Massachusetts
> Divorced population: 16.0%
> Divorced population, statewide: 9.6%
> Married population: 38.1%
> Median household income: $32,804
> Households earning less than $10,000: 11.1%
[in-text-ad]
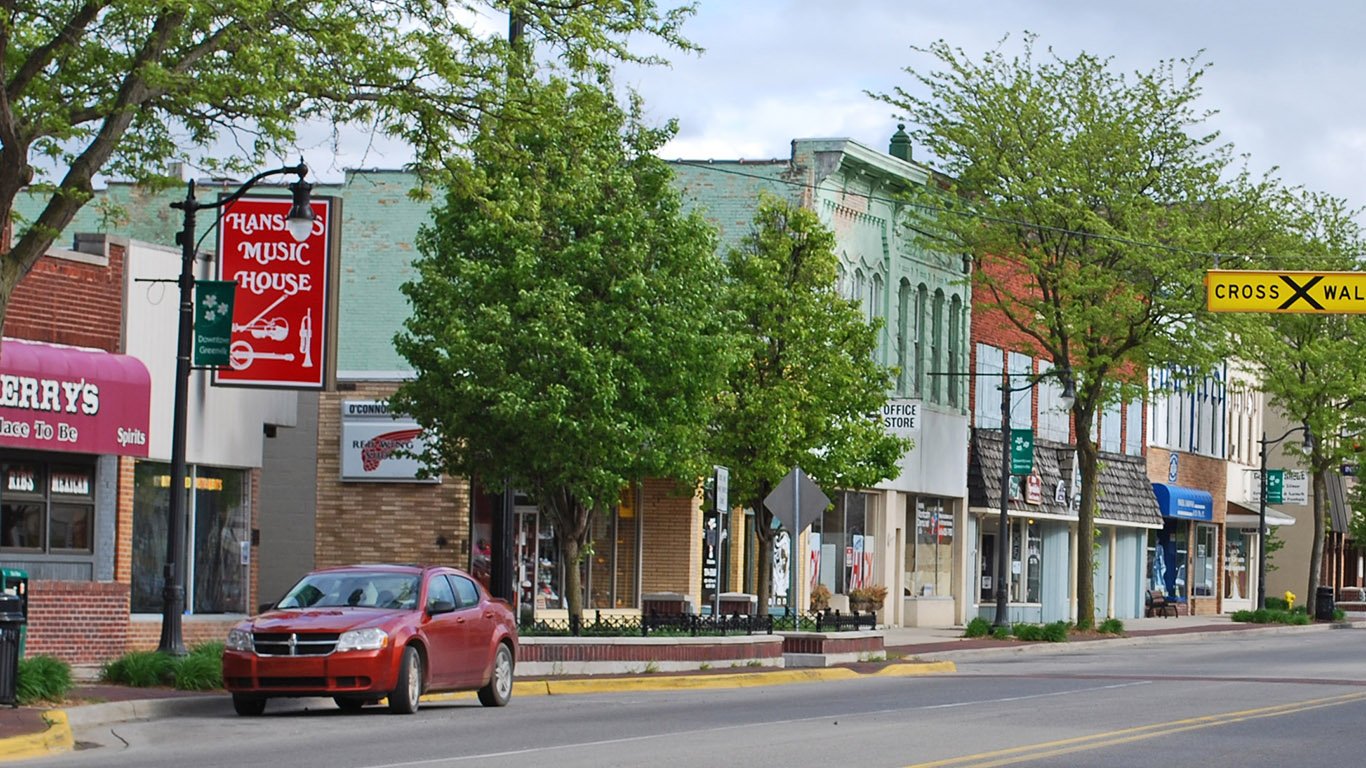
22. Greenville, Michigan
> Divorced population: 20.1%
> Divorced population, statewide: 11.6%
> Married population: 41.2%
> Median household income: $32,641
> Households earning less than $10,000: 13.3%
[recirclink id=433549]

23. Spring Lake Park, Minnesota
> Divorced population: 18.1%
> Divorced population, statewide: 10.0%
> Married population: 42.4%
> Median household income: $57,993
> Households earning less than $10,000: 1.8%
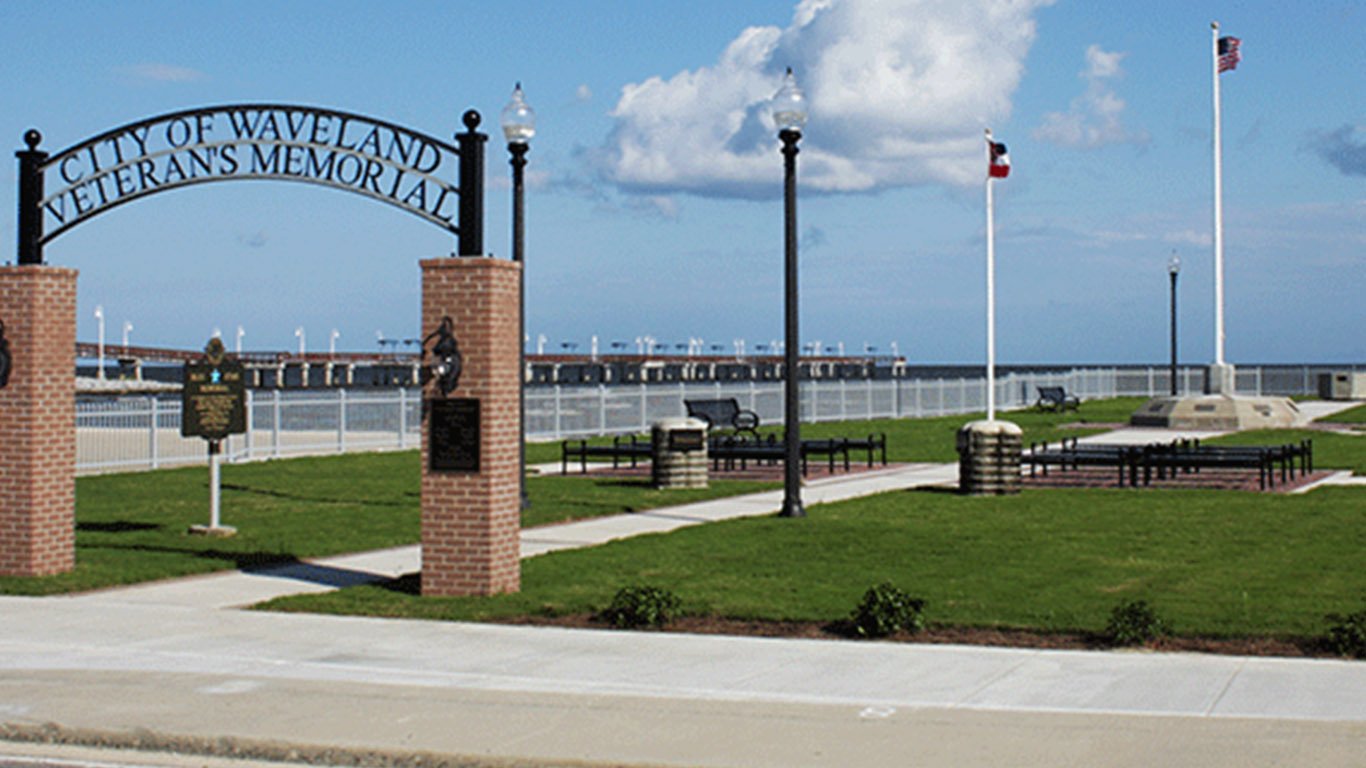
24. Waveland, Mississippi
> Divorced population: 20.0%
> Divorced population, statewide: 11.8%
> Married population: 33.1%
> Median household income: $38,207
> Households earning less than $10,000: 12.5%
[in-text-ad-2]
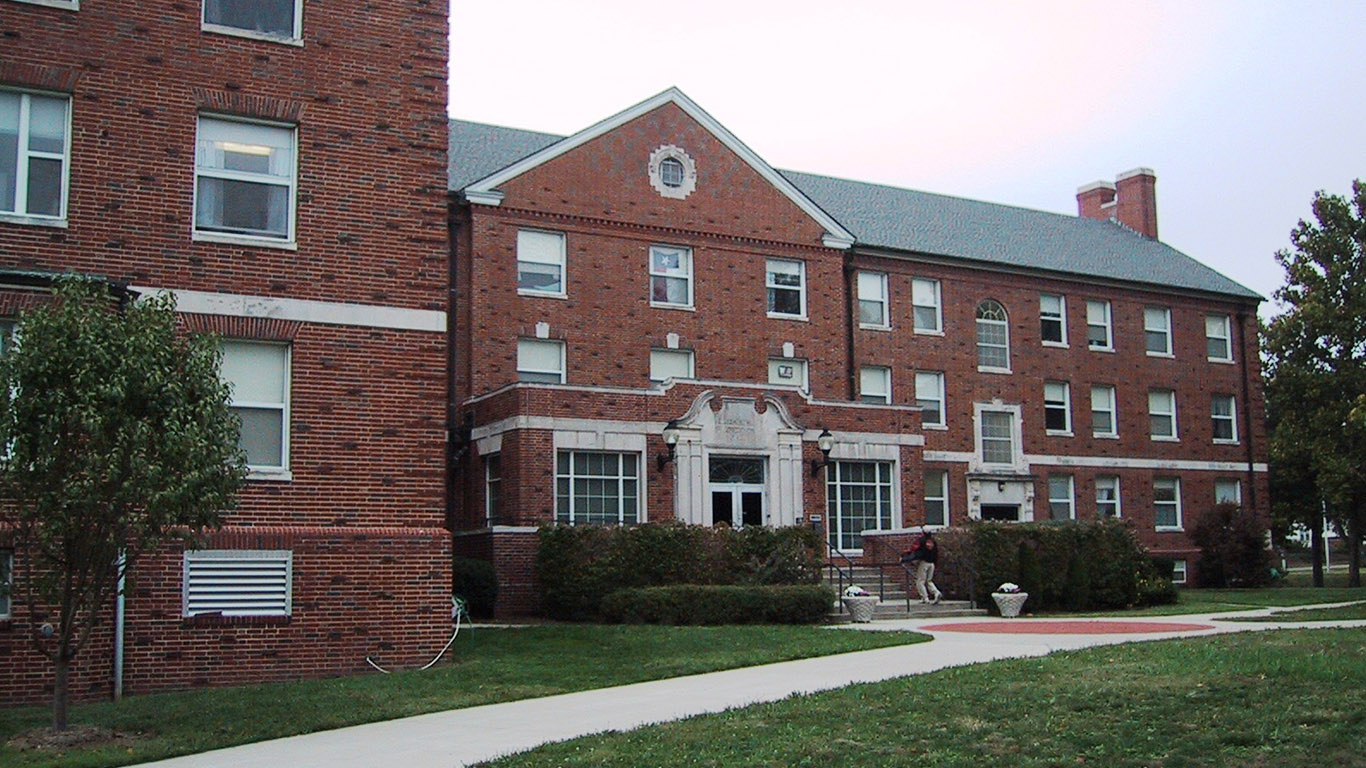
25. Nevada, Missouri
> Divorced population: 19.4%
> Divorced population, statewide: 12.2%
> Married population: 39.9%
> Median household income: $29,738
> Households earning less than $10,000: 15.6%

26. Helena Valley Southeast, Montana
> Divorced population: 18.1%
> Divorced population, statewide: 12.6%
> Married population: 44.5%
> Median household income: $50,585
> Households earning less than $10,000: 3.4%
[in-text-ad]

27. La Vista, Nebraska
> Divorced population: 15.7%
> Divorced population, statewide: 10.4%
> Married population: 47.9%
> Median household income: $59,401
> Households earning less than $10,000: 3.1%
[recirclink id=432660]

28. Fallon, Nevada
> Divorced population: 23.0%
> Divorced population, statewide: 14.1%
> Married population: 38.5%
> Median household income: $37,848
> Households earning less than $10,000: 12.5%

29. Exeter, New Hampshire
> Divorced population: 17.8%
> Divorced population, statewide: 12.0%
> Married population: 45.8%
> Median household income: $66,964
> Households earning less than $10,000: 4.6%
[in-text-ad-2]

30. Crestwood Village, New Jersey
> Divorced population: 16.4%
> Divorced population, statewide: 8.5%
> Married population: 44.1%
> Median household income: $28,282
> Households earning less than $10,000: 8.0%

31. Truth or Consequences, New Mexico
> Divorced population: 24.8%
> Divorced population, statewide: 12.9%
> Married population: 40.3%
> Median household income: $26,844
> Households earning less than $10,000: 18.6%
[in-text-ad]

32. Hudson, New York
> Divorced population: 16.7%
> Divorced population, statewide: 8.7%
> Married population: 29.6%
> Median household income: $31,042
> Households earning less than $10,000: 13.3%
[recirclink id=433303]

33. King, North Carolina
> Divorced population: 19.1%
> Divorced population, statewide: 10.9%
> Married population: 51.3%
> Median household income: $54,471
> Households earning less than $10,000: 2.7%
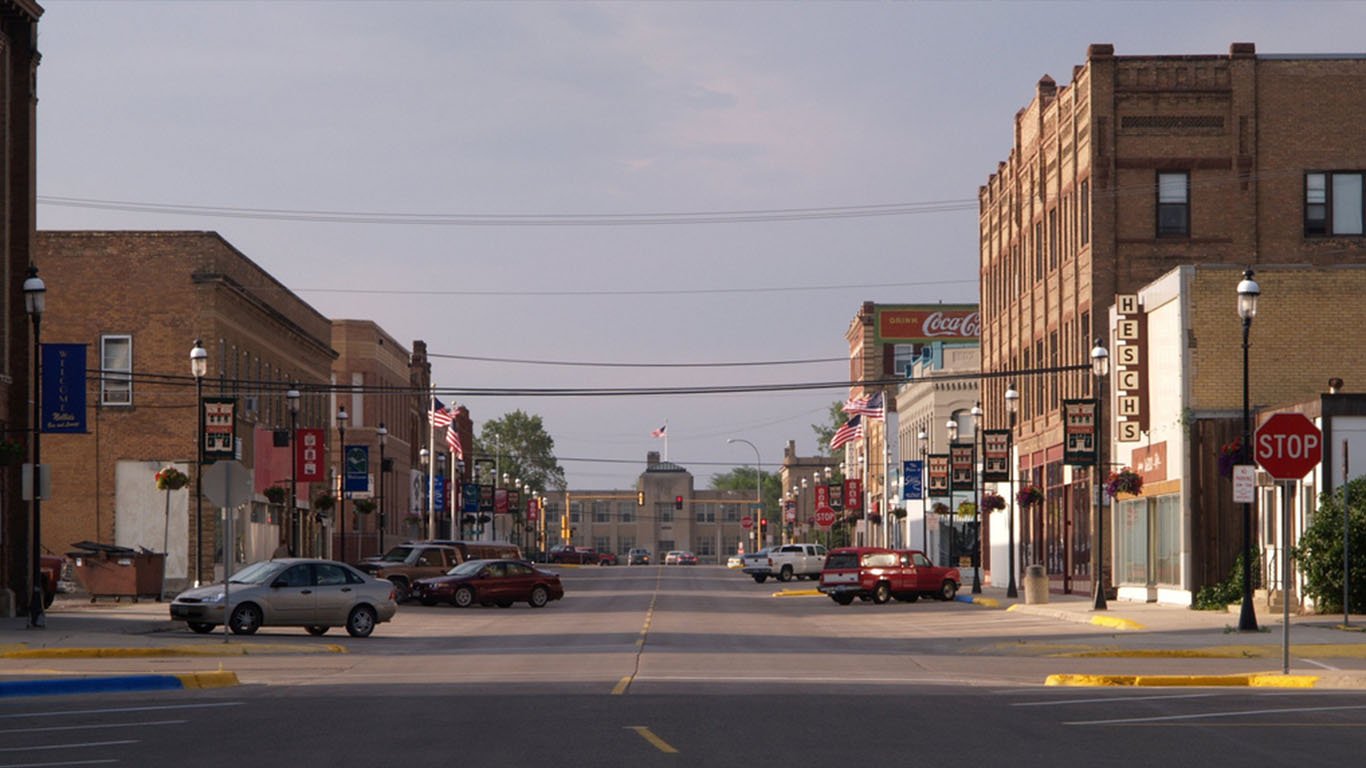
34. Devils Lake, North Dakota
> Divorced population: 14.4%
> Divorced population, statewide: 9.5%
> Married population: 39.3%
> Median household income: $40,453
> Households earning less than $10,000: 10.5%
[in-text-ad-2]

35. Bedford Heights, Ohio
> Divorced population: 19.3%
> Divorced population, statewide: 12.1%
> Married population: 32.1%
> Median household income: $37,692
> Households earning less than $10,000: 12.0%

36. Grove, Oklahoma
> Divorced population: 19.1%
> Divorced population, statewide: 13.3%
> Married population: 54.2%
> Median household income: $39,321
> Households earning less than $10,000: 5.7%
[in-text-ad]

37. Sheridan, Oregon
> Divorced population: 20.8%
> Divorced population, statewide: 13.2%
> Married population: 38.3%
> Median household income: $40,882
> Households earning less than $10,000: 6.9%
[recirclink id=433280]

38. Butler, Pennsylvania
> Divorced population: 20.1%
> Divorced population, statewide: 9.6%
> Married population: 32.9%
> Median household income: $29,477
> Households earning less than $10,000: 15.8%

39. Westerly, Rhode Island
> Divorced population: 15.8%
> Divorced population, statewide: 11.4%
> Married population: 48.7%
> Median household income: $57,275
> Households earning less than $10,000: 5.7%
[in-text-ad-2]

40. Little River, South Carolina
> Divorced population: 19.5%
> Divorced population, statewide: 10.9%
> Married population: 51.1%
> Median household income: $45,833
> Households earning less than $10,000: 4.9%

41. Yankton, South Dakota
> Divorced population: 14.6%
> Divorced population, statewide: 10.6%
> Married population: 46.1%
> Median household income: $41,174
> Households earning less than $10,000: 10.1%
[in-text-ad]
42. McMinnville, Tennessee
> Divorced population: 24.1%
> Divorced population, statewide: 12.6%
> Married population: 39.1%
> Median household income: $30,136
> Households earning less than $10,000: 13.0%
[recirclink id=433167]

43. Bonham, Texas
> Divorced population: 18.9%
> Divorced population, statewide: 10.8%
> Married population: 39.3%
> Median household income: $33,869
> Households earning less than $10,000: 16.0%

44. Vernal, Utah
> Divorced population: 16.7%
> Divorced population, statewide: 9.2%
> Married population: 47.2%
> Median household income: $56,387
> Households earning less than $10,000: 9.3%
[in-text-ad-2]

45. Brattleboro, Vermont
> Divorced population: 23.5%
> Divorced population, statewide: 12.4%
> Married population: 33.4%
> Median household income: $49,000
> Households earning less than $10,000: 9.2%

46. Dumbarton, Virginia
> Divorced population: 18.9%
> Divorced population, statewide: 10.2%
> Married population: 29.9%
> Median household income: $36,808
> Households earning less than $10,000: 10.3%
[in-text-ad]

47. Clarkston, Washington
> Divorced population: 25.7%
> Divorced population, statewide: 12.1%
> Married population: 38.7%
> Median household income: $33,353
> Households earning less than $10,000: 10.4%
[recirclink id=433018]

48. Nitro, West Virginia
> Divorced population: 21.2%
> Divorced population, statewide: 13.3%
> Married population: 51.6%
> Median household income: $48,212
> Households earning less than $10,000: 7.1%

49. Wisconsin Rapids, Wisconsin
> Divorced population: 19.1%
> Divorced population, statewide: 10.8%
> Married population: 44.9%
> Median household income: $35,775
> Households earning less than $10,000: 4.7%
[in-text-ad-2]
50. Riverton, Wyoming
> Divorced population: 16.7%
> Divorced population, statewide: 12.8%
> Married population: 46.5%
> Median household income: $50,020
> Households earning less than $10,000: 4.7%
Detailed Findings & Methodology
The cost of a divorce can range from a few hundred dollars to many thousands. The average cost of a contested divorce ranges from $15,000 to $30,000, according to Forbes.com. This figure varies depending on the type of divorce and how contentious it is.
Some researchers estimate divorced spouses would, on average, need more than a 30% increase in their income to maintain the same standard of living they were accustomed to before their divorce.
Though child support payments are calculated by the state in which the divorce is granted, most state guidelines try to account for factors such as the income of both parents, the number of children involved, custody, and the amount of time each parent spends with the children.
Despite a parent’s legal obligation to pay court-ordered child support, about half of all court-ordered child support in the United States are actually paid.
Another financial obligation in a divorce may be spousal support or alimony. This spousal support payment can be financially significant for the spouse receiving it, but it can also cause financial distress to the spouse paying it, especially if that spouse has lost his or her job.
Clarkston, Washington, has the highest divorce rate of any city on the 24/7 Wall St. list at 25.7%. Clarkston also has the biggest percentage-point difference between any city and its respective state divorce rate on the list at 13.6.
All of the cities on this list surpass the national average of people divorced at 11%. Clarkston is one of 19 cities where the divorce rate exceeds 20%. Divorce correlates strongly with lower income and poverty in cities where divorce rates are elevated in those cities.
In 33 states, the cities with the highest divorce rates have higher percentages of households earning incomes of less than $10,000 than the national share. In 24 cities, the percentage of total households earning less than $10,000 is greater than the statewide share. In 32 states, the city with the highest divorce rate has a poverty rate that exceeds the national rate of 15.1%. In addition, 24 cities have a poverty rate greater than their state rate. The median household income in the city with the highest divorce rate topped the national median annual household income of $55,322 in just eight states.
The five cities with the highest divorce rates — Clarkston; Truth or Consequences, New Mexico; McMinnville, Tennessee; Brattleboro, Vermont; and Newport, Arkansas — all have higher percentages of households earning incomes of less than $10,000 than the national percentage, higher poverty rates than the the national rate, and lower median household income than both national and statewide medians. The exception is Brattleboro, which has a lower percentage of households earning less than $10,000 in comparison with the share across Vermont.
To identify the divorce capital of every state, 24/7 Wall St. reviewed the Census Bureau’s 2016 American Community Survey to find the percentage of the 15-year-and-older population that is divorced. The population data are five-year averages through 2016. Data on household income and poverty rate also came from the ACS. The Census definition of those who are divorced includes only people who are legally divorced and who have not remarried. Those without a final divorce decree are classified as separated.
Contact [email protected] for any questions or corrections.