[cnxvideo id=”620993″ placement=”ros”]The Dow Jones Industrial Average reached its all-time high of 26,616.71 on Jan. 26. Driving the market’s surge over the decade have been a strengthening economy, rising corporate profits, and a massive tax cut signed into law late last year.
The Dow has been building on its 25% gain in 2017, its best year since 2013. It took 14 years for the index to rise from 10,000 to 15,000 but just three and a half to reach 20,000 in 2017.
Since late January, the closely watched stock market gauge has given back all of its gains this year as investors are concerned about President Donald Trump’s tariff announcement and the possibility the Federal Reserve will continue to hike rates to curb inflation.
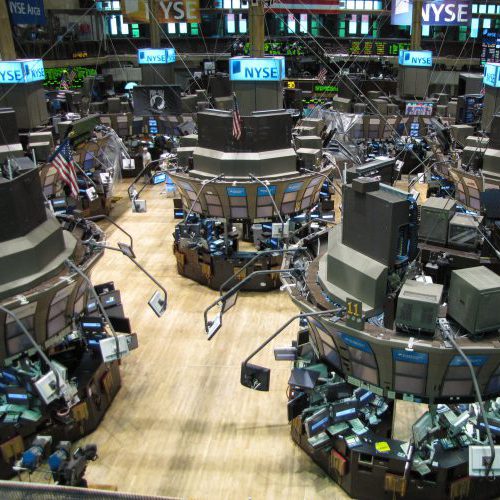
The DJIA is a price-weighted average of 30 large American companies. Fluctuations in the Dow often reflect overall market conditions. The index currently contains companies such as the world’s largest retailer Walmart, media juggernaut Disney, global financial institution J.P. Morgan, aerospace and defense giant Boeing, and the newest member as of 2015, tech behemoth Apple. The only company remaining from the original list of 12 is industrial conglomerate General Electric.
The companies comprising the Dow change over time to reflect the changing economy. Since the creator of the index, Charles Dow, was also the founding editor of The Wall Street Journal, editors at the publication select the companies that comprise the index. Since its inception in 1896, when only 12 companies comprised the average, the Dow has changed 51 times.
The companies currently listed in the Dow are: 3M, American Express, Apple, Boeing, Caterpillar, Chevron, Cisco, Coca-Cola, Disney, DowDuPont Inc, Exxon Mobil, General Electric, Goldman Sachs, Home Depot, IBM, Intel, Johnson & Johnson, JPMorgan Chase, McDonald’s, Merck, Microsoft, Nike, Pfizer, Procter & Gamble, Travelers Companies Inc, United Technologies, UnitedHealth, Verizon, Visa, Wal-Mart,
24/7 Wall St. determined the value of the Dow Jones Industrial Average each year since 1929.
Click here to see the value of the Dow the year you were born.
Click here to see our detailed findings.
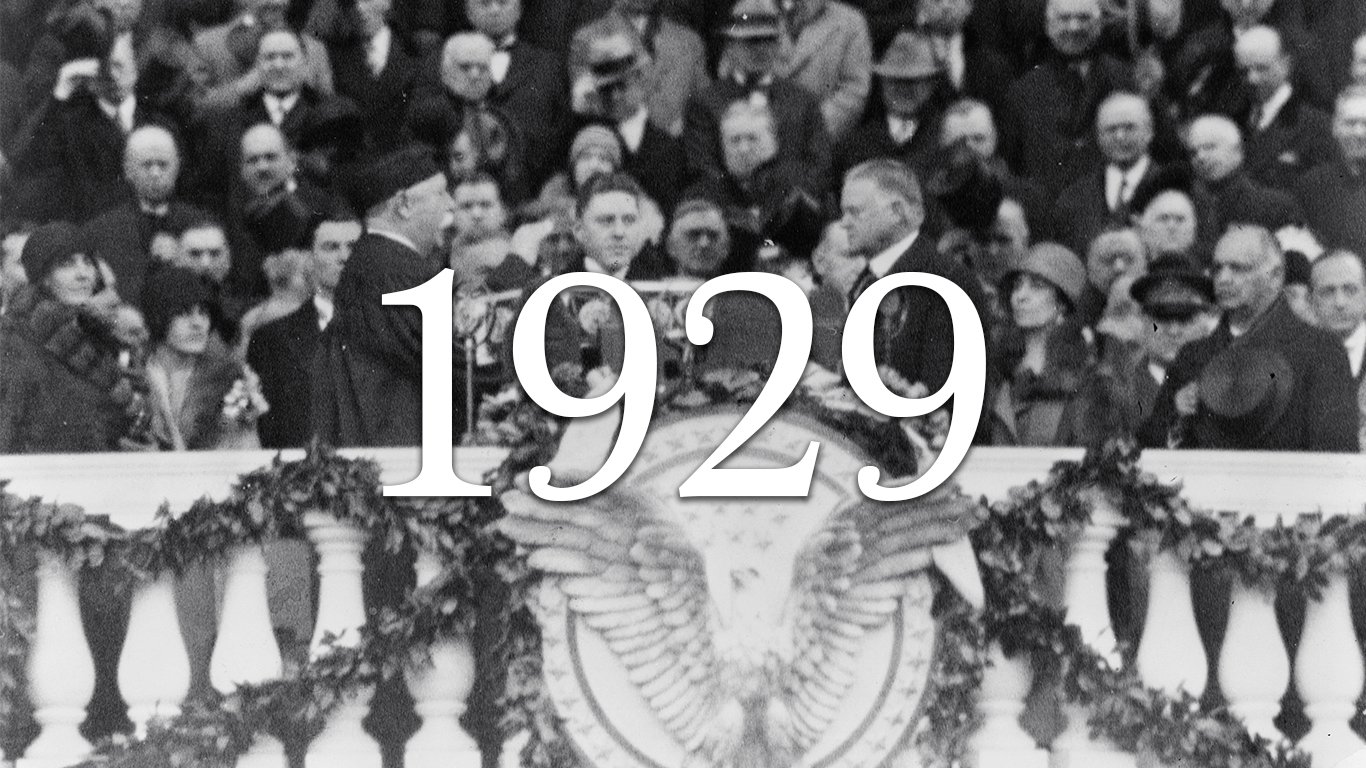
1929
> Start: 4,314.2
> End: 3,491.7
> High: 5,356.3
> Change: -19.1%
[in-text-ad]
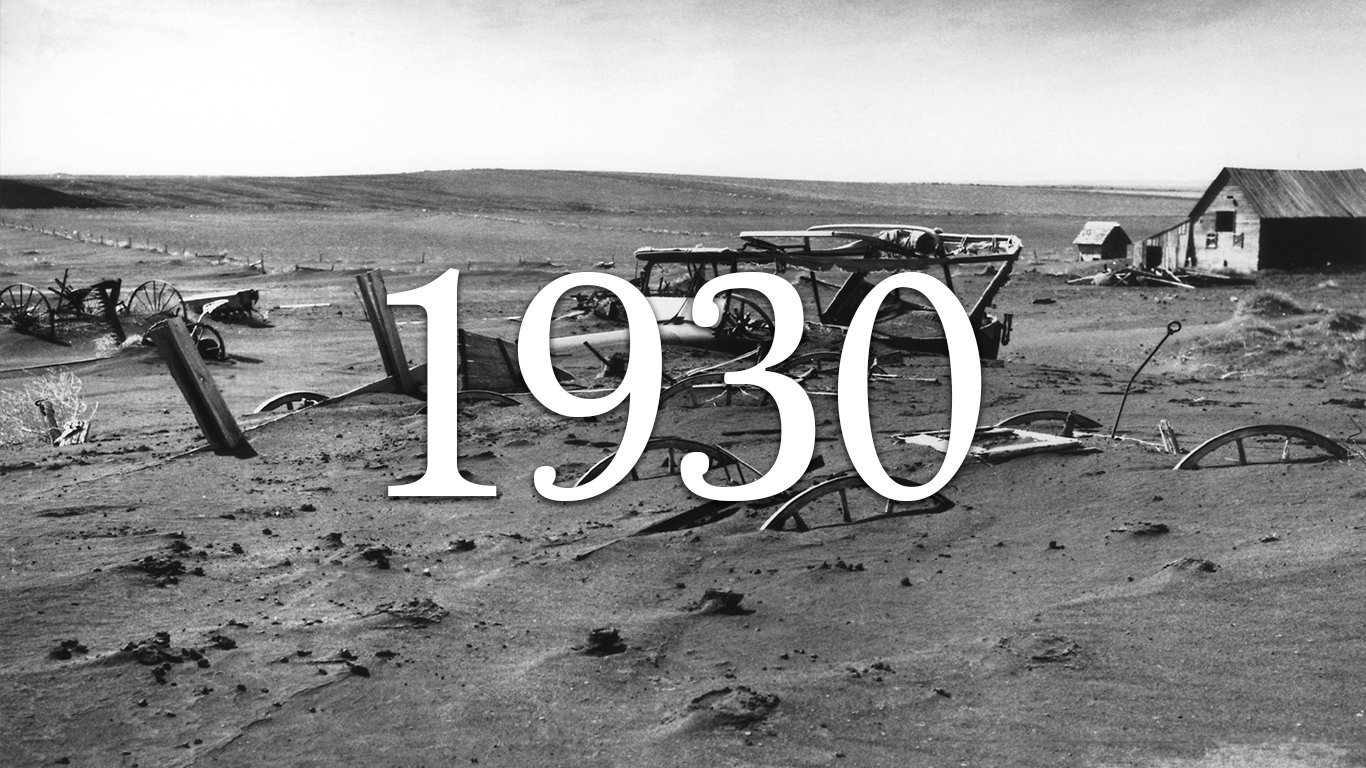
1930
> Start: 3,519.9
> End: 2,372.3
> High: 4,238.8
> Change: -32.6%
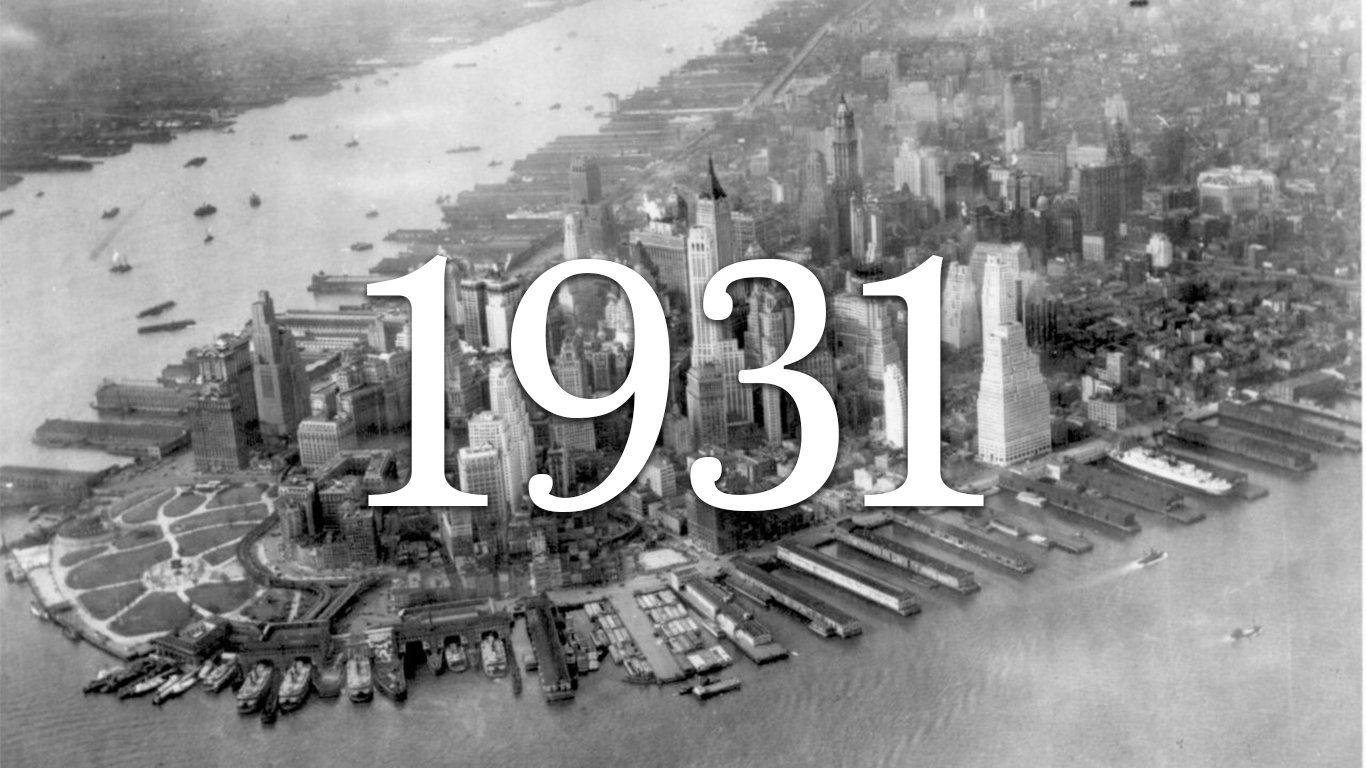
1931
> Start: 2,684.4
> End: 1,231.2
> High: 3,071.9
> Change: -54.1%
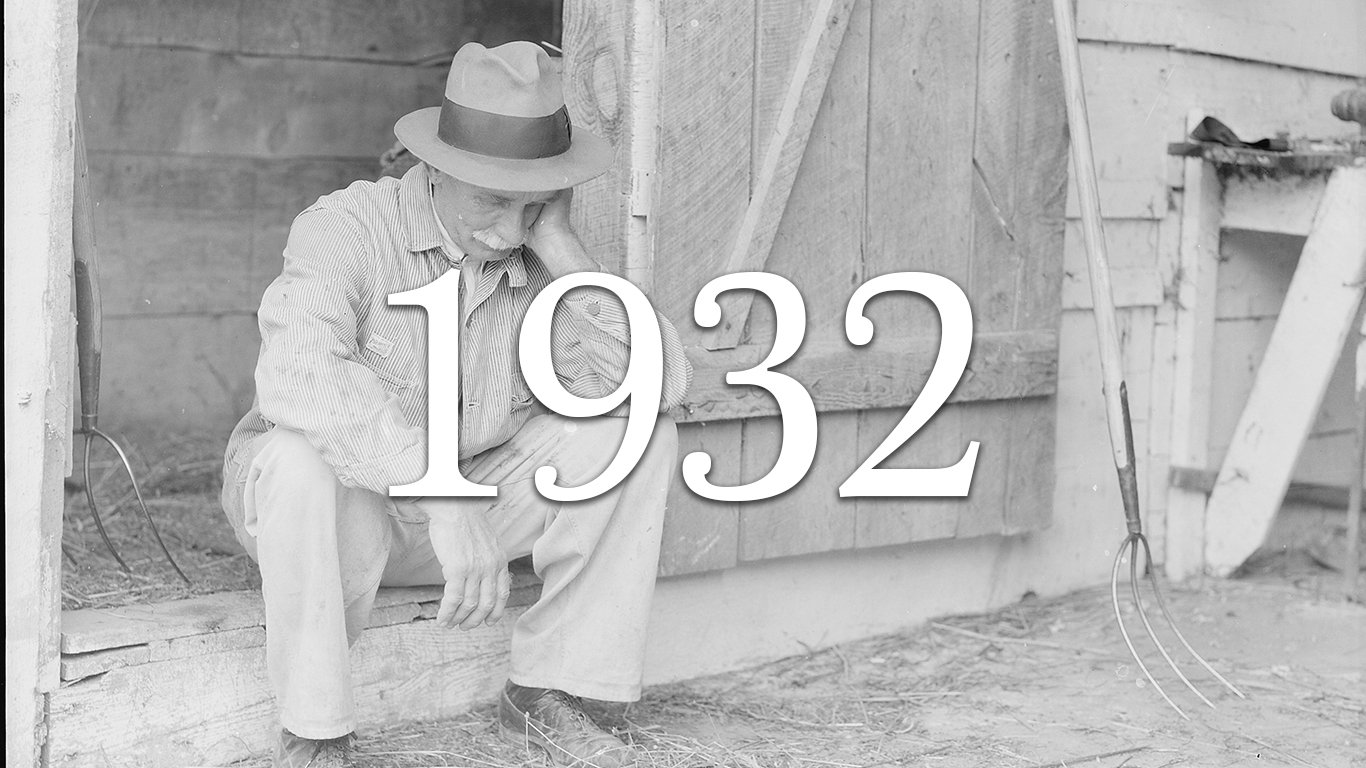
1932
> Start: 1,315.0
> End: 1,056.1
> High: 1,564.5
> Change: -19.7%
[recirclink id=444492]

1933
> Start: 1,101.2
> End: 1,855.5
> High: 2,018.4
> Change: 68.5%

1934
> Start: 1,804.2
> End: 1,870.4
> High: 1,990.8
> Change: 3.7%
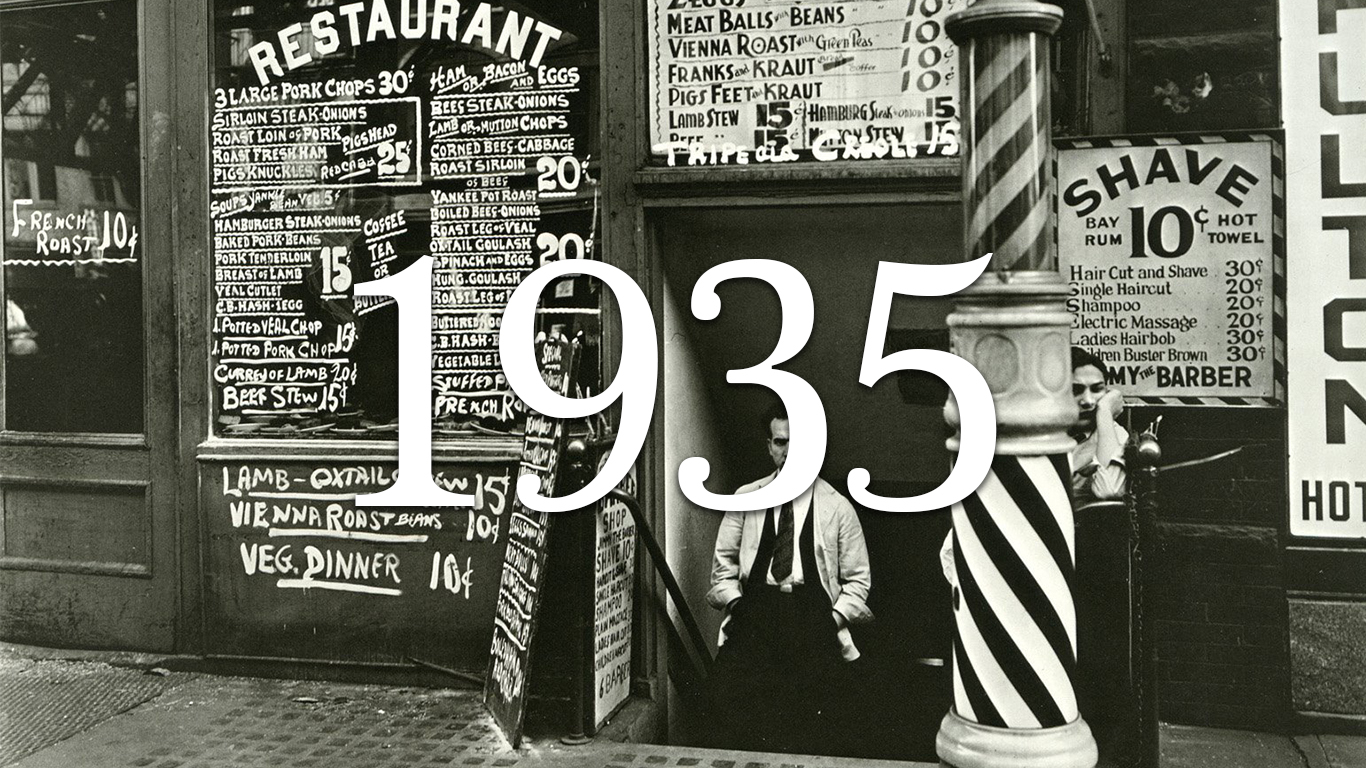
1935
> Start: 1,832.3
> End: 2,526.9
> High: 2,602.5
> Change: 37.9%
[in-text-ad-2]

1936
> Start: 2,503.2
> End: 3,124.5
> High: 3,211.3
> Change: 24.8%

1937
> Start: 2,992.5
> End: 2,025.8
> High: 3,258.7
> Change: -32.3%
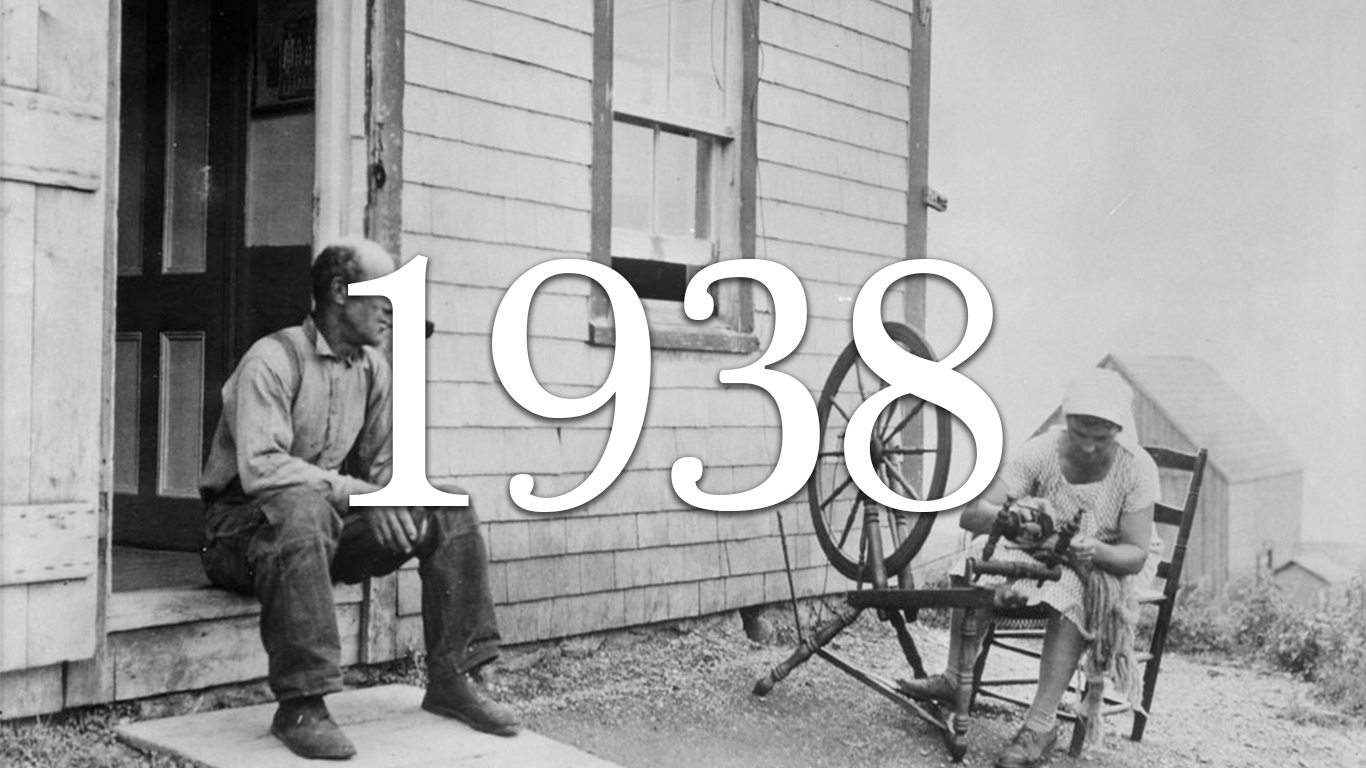
1938
> Start: 2,059.8
> End: 2,644.0
> High: 2,706.3
> Change: 28.4%
1939
> Start: 2,662.6
> End: 2,603.7
> High: 2,702.1
> Change: -2.2%
[in-text-ad]
1940
> Start: 2,598.1
> End: 2,249.8
> High: 2,621.6
> Change: -13.4%
1941
> Start: 2,133.8
> End: 1,813.3
> High: 2,183.1
> Change: -15.0%

1942
> Start: 1,665.4
> End: 1,763.3
> High: 1,767.9
> Change: 5.9%
[recirclink id=444468]

1943
> Start: 1,668.7
> End: 1,890.8
> High: 2,029.0
> Change: 13.3%

1944
> Start: 1,859.0
> End: 2,083.3
> High: 2,086.2
> Change: 12.1%
1945
> Start: 2,040.5
> End: 2,579.8
> High: 2,618.7
> Change: 26.4%
[in-text-ad-2]
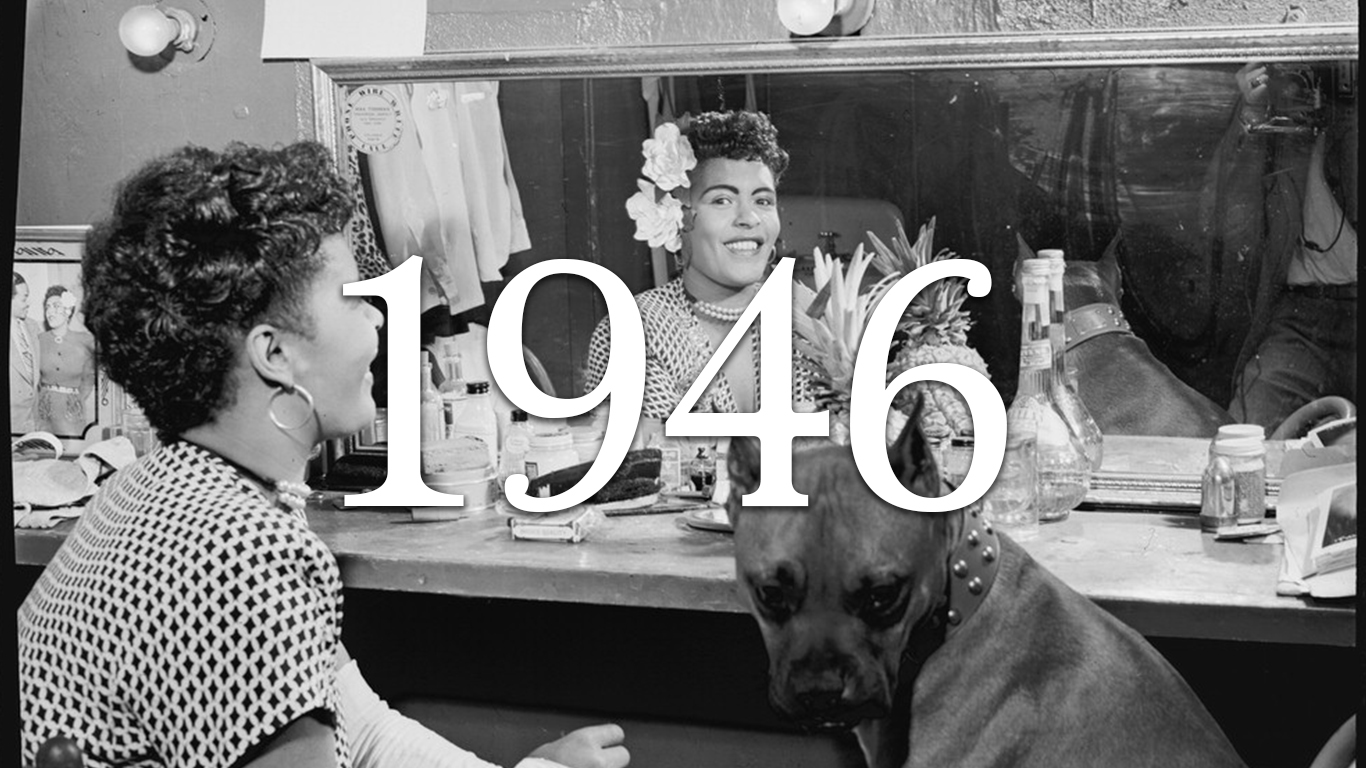
1946
> Start: 2,361.1
> End: 2,183.0
> High: 2,617.8
> Change: -7.5%

1947
> Start: 1,900.6
> End: 1,952.0
> High: 2,013.3
> Change: 2.7%

1948
> Start: 1,809.8
> End: 1,772.4
> High: 1,930.9
> Change: -2.1%

1949
> Start: 1,766.6
> End: 2,019.9
> High: 2,023.8
> Change: 14.3%
[in-text-ad]
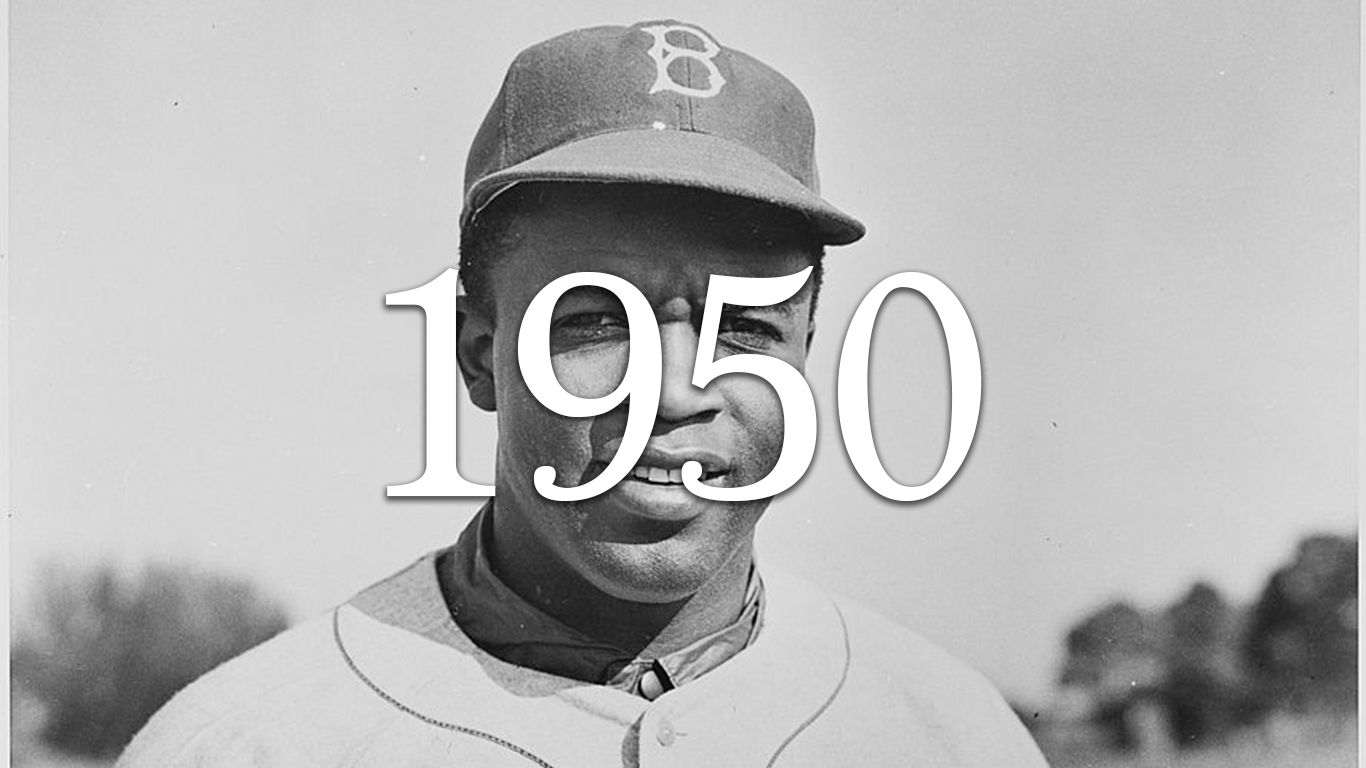
1950
> Start: 1,988.2
> End: 2,353.3
> High: 2,353.9
> Change: 18.4%
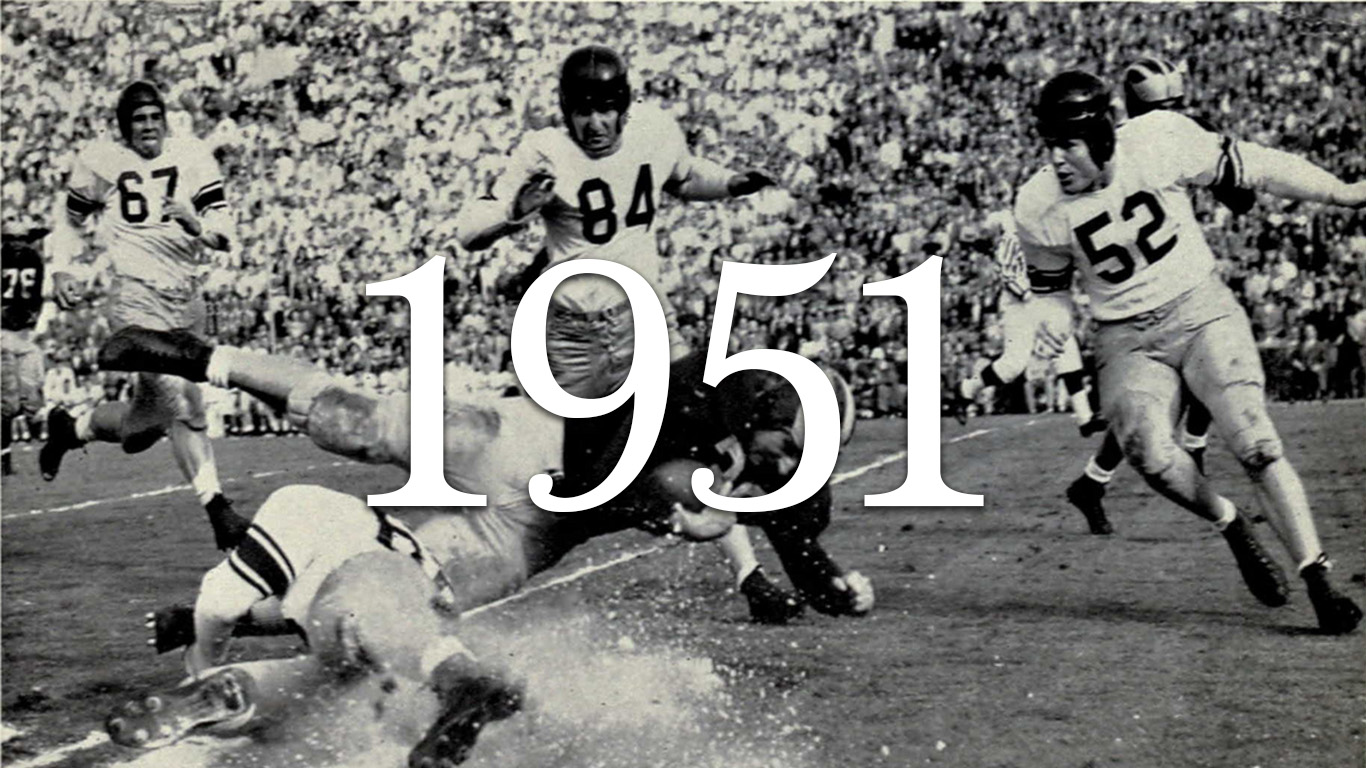
1951
> Start: 2,223.0
> End: 2,494.5
> High: 2,560.7
> Change: 12.2%
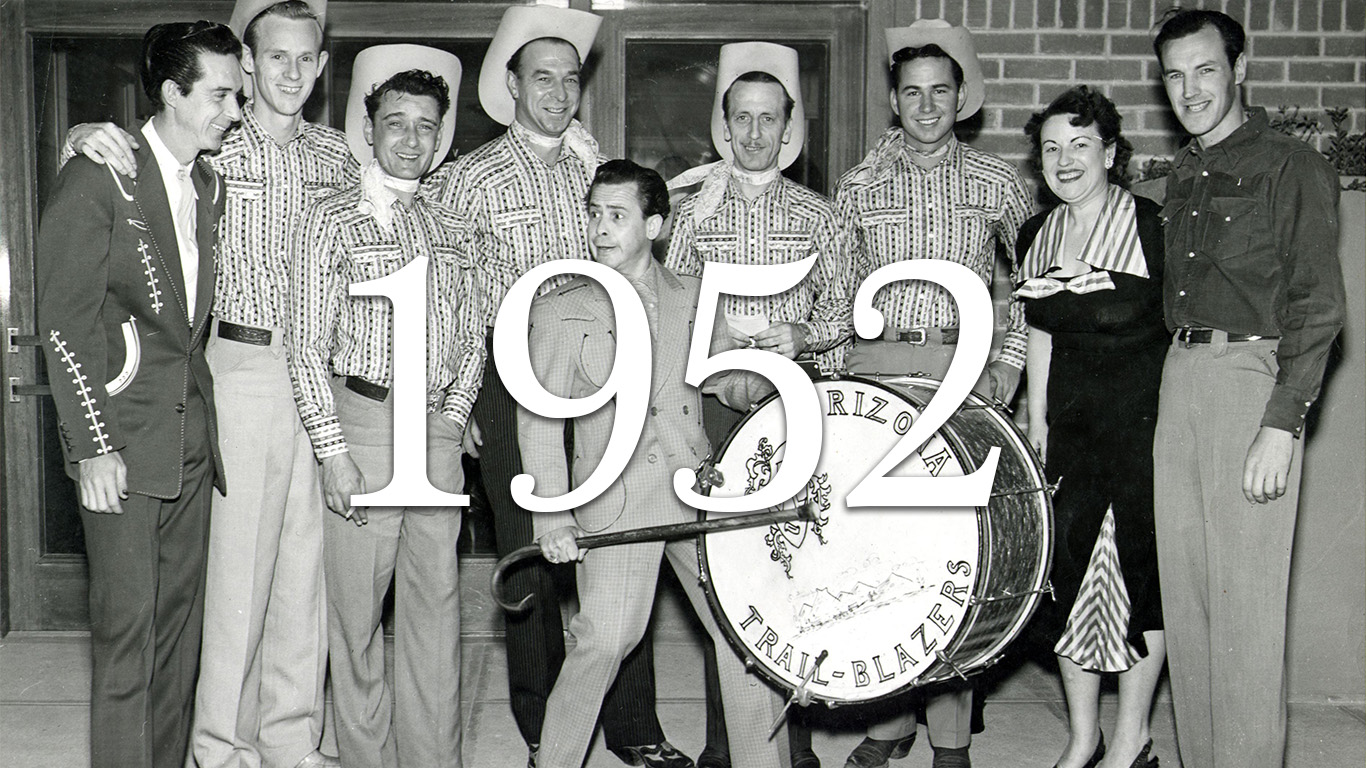
1952
> Start: 2,446.7
> End: 2,646.5
> High: 2,647.4
> Change: 8.2%
[recirclink id=444391]
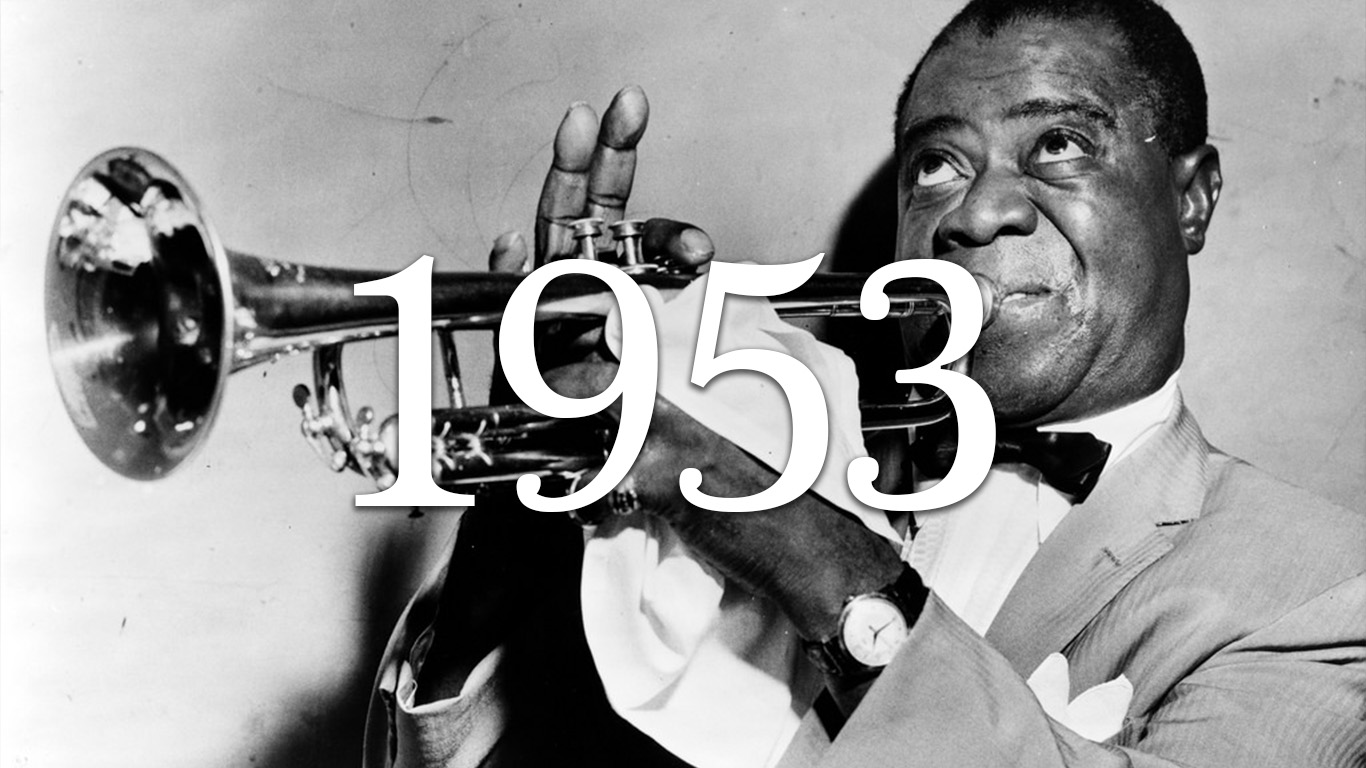
1953
> Start: 2,628.9
> End: 2,527.7
> High: 2,643.7
> Change: -3.8%

1954
> Start: 2,533.3
> End: 3,621.4
> High: 3,621.4
> Change: 42.9%
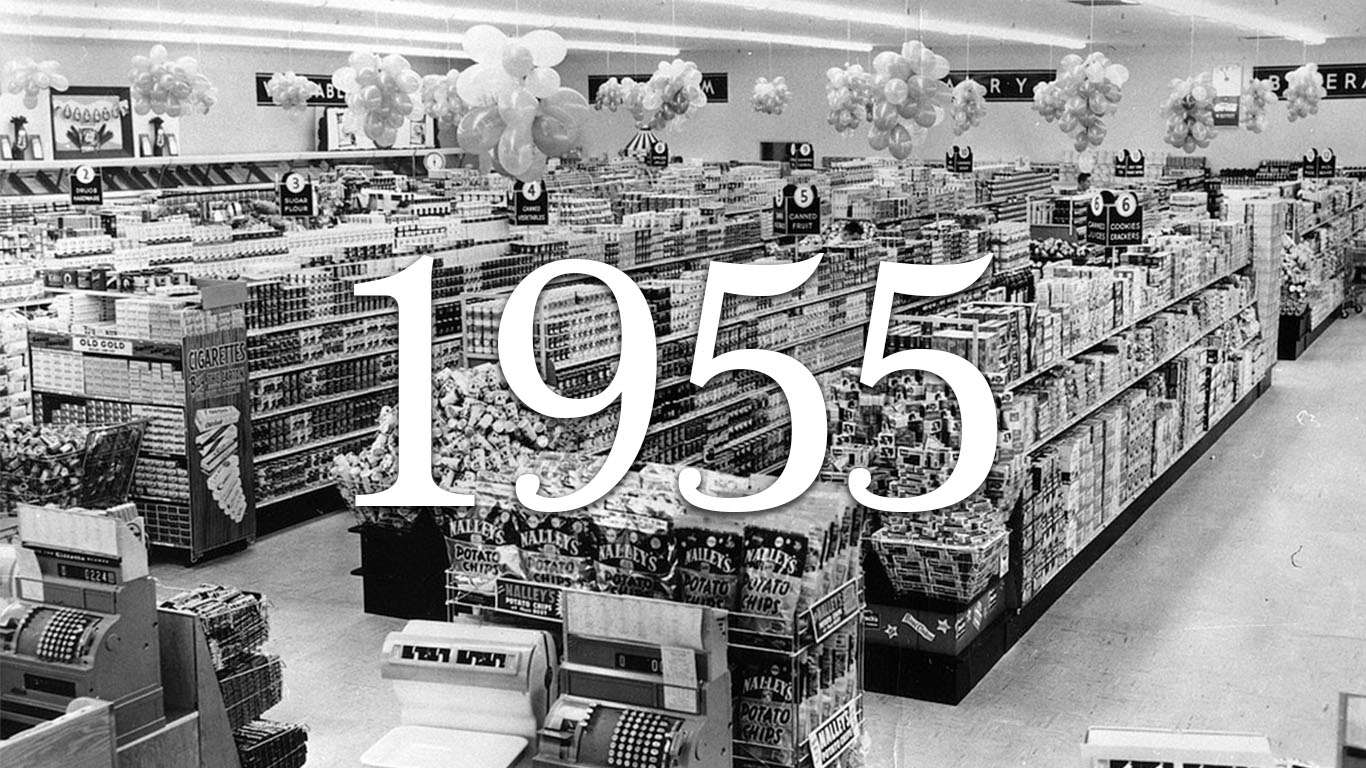
1955
> Start: 3,675.4
> End: 4,390.1
> High: 4,390.1
> Change: 19.4%
[in-text-ad-2]
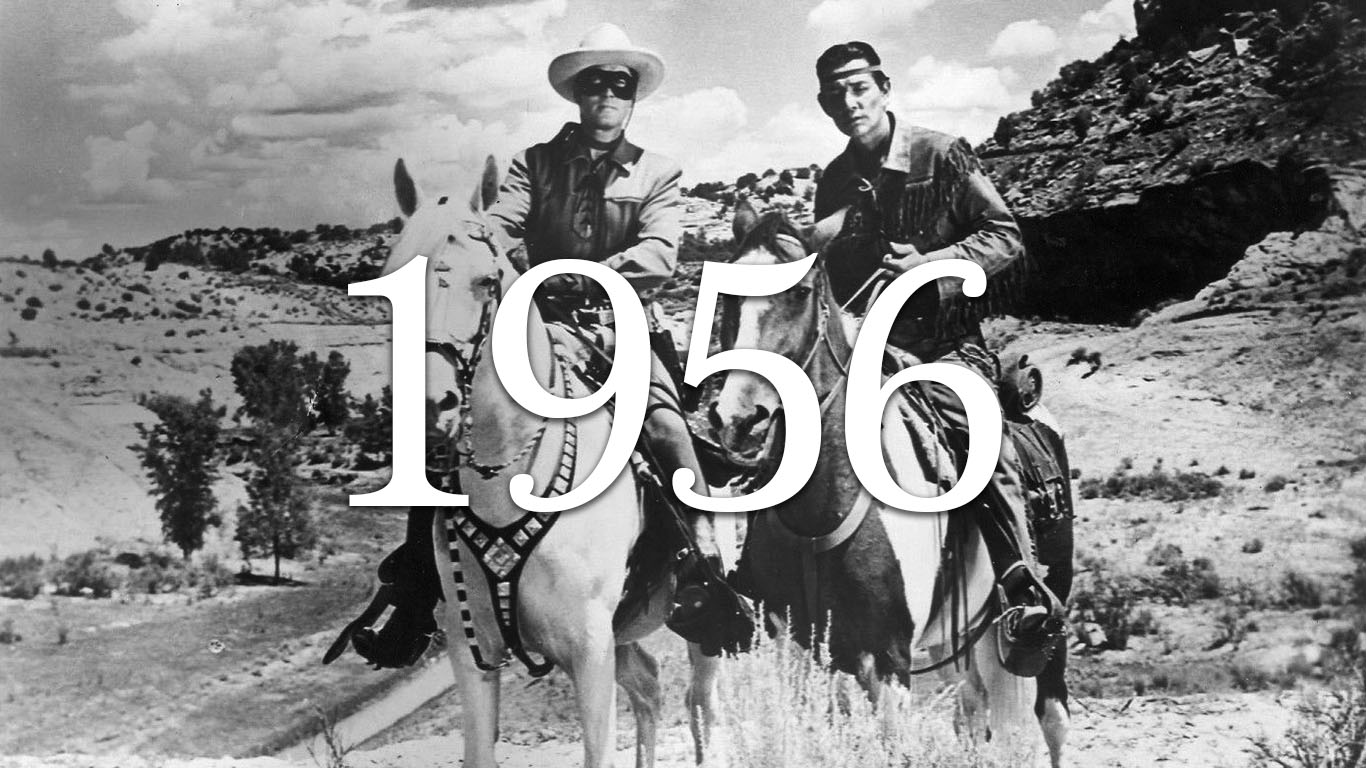
1956
> Start: 4,302.3
> End: 4,423.5
> High: 4,614.6
> Change: 2.8%
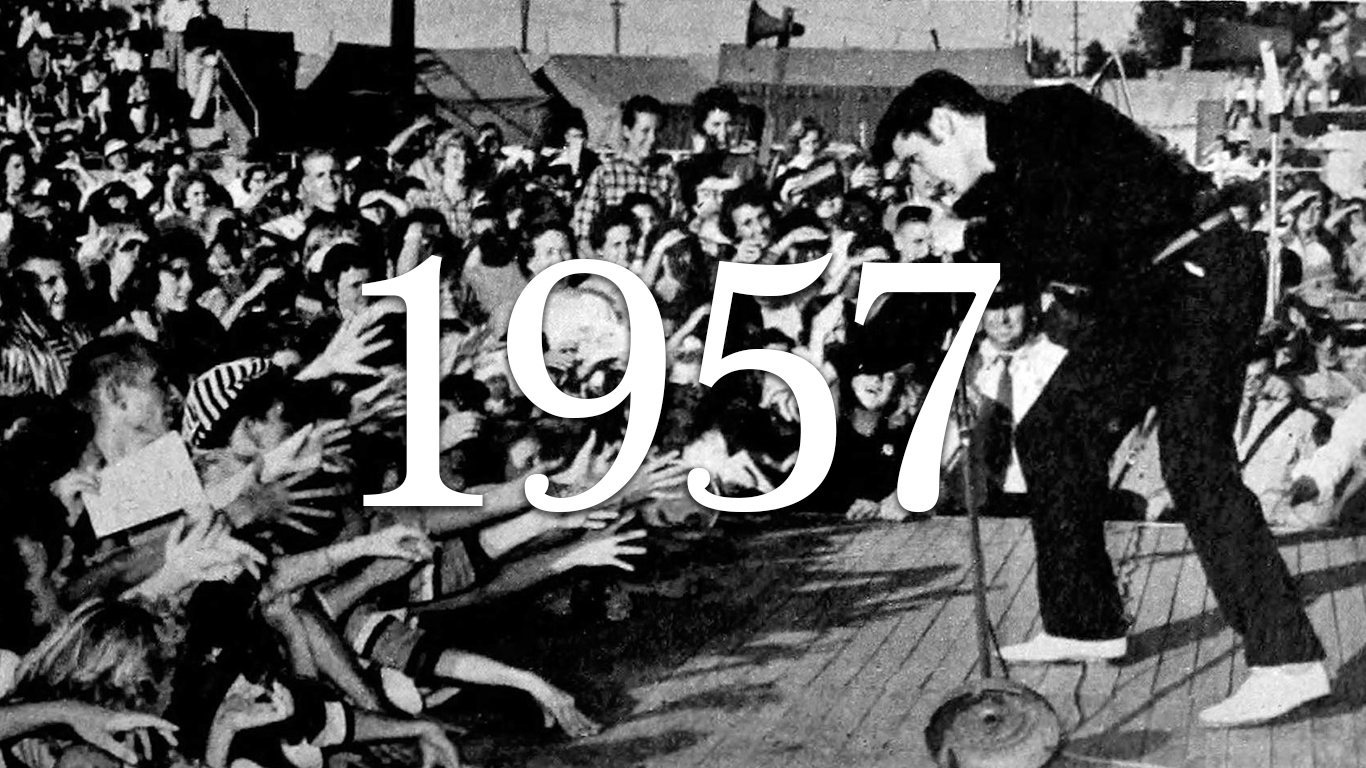
1957
> Start: 4,241.7
> End: 3,725.7
> High: 4,453.2
> Change: -12.2%
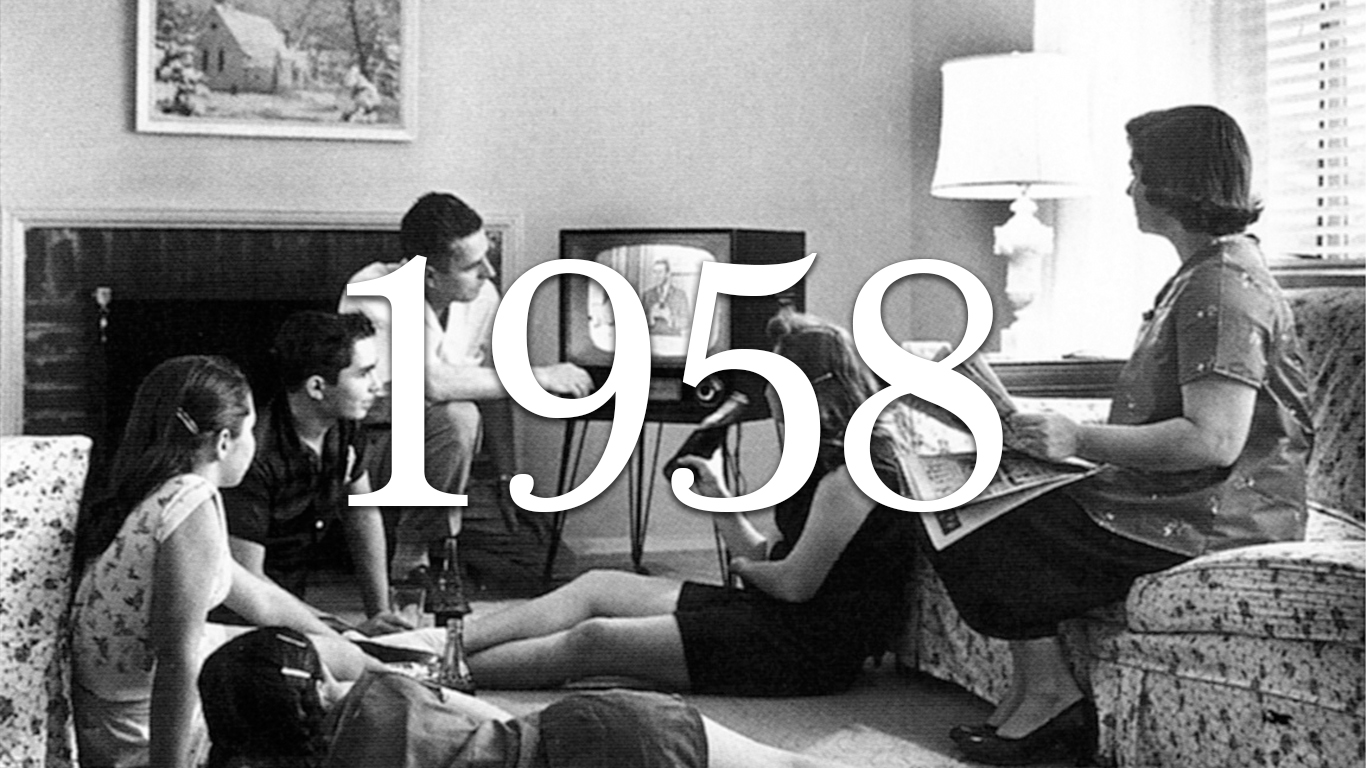
1958
> Start: 3,656.3
> End: 4,858.0
> High: 4,858.0
> Change: 32.9%
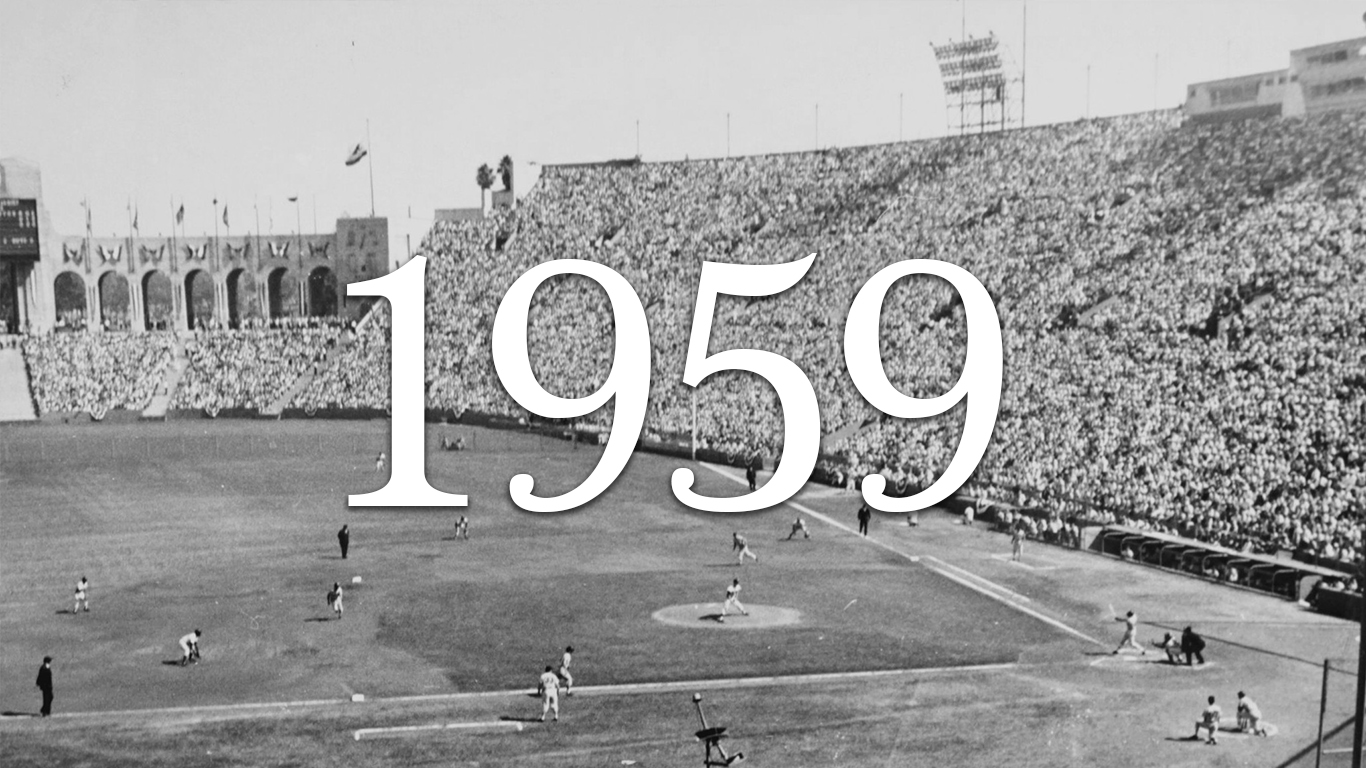
1959
> Start: 4,850.6
> End: 5,608.1
> High: 5,608.1
> Change: 15.6%
[in-text-ad]
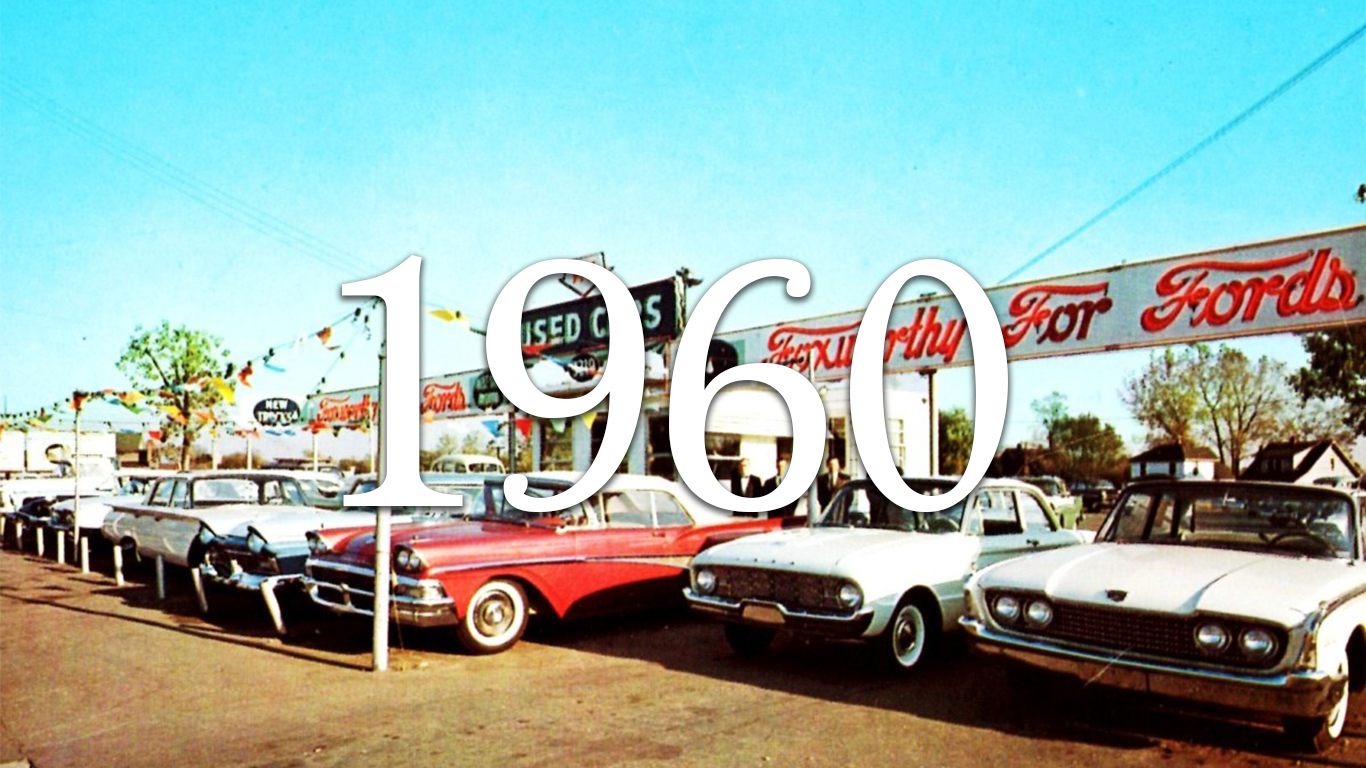
1960
> Start: 5,518.6
> End: 5,005.2
> High: 5,570.7
> Change: -9.3%
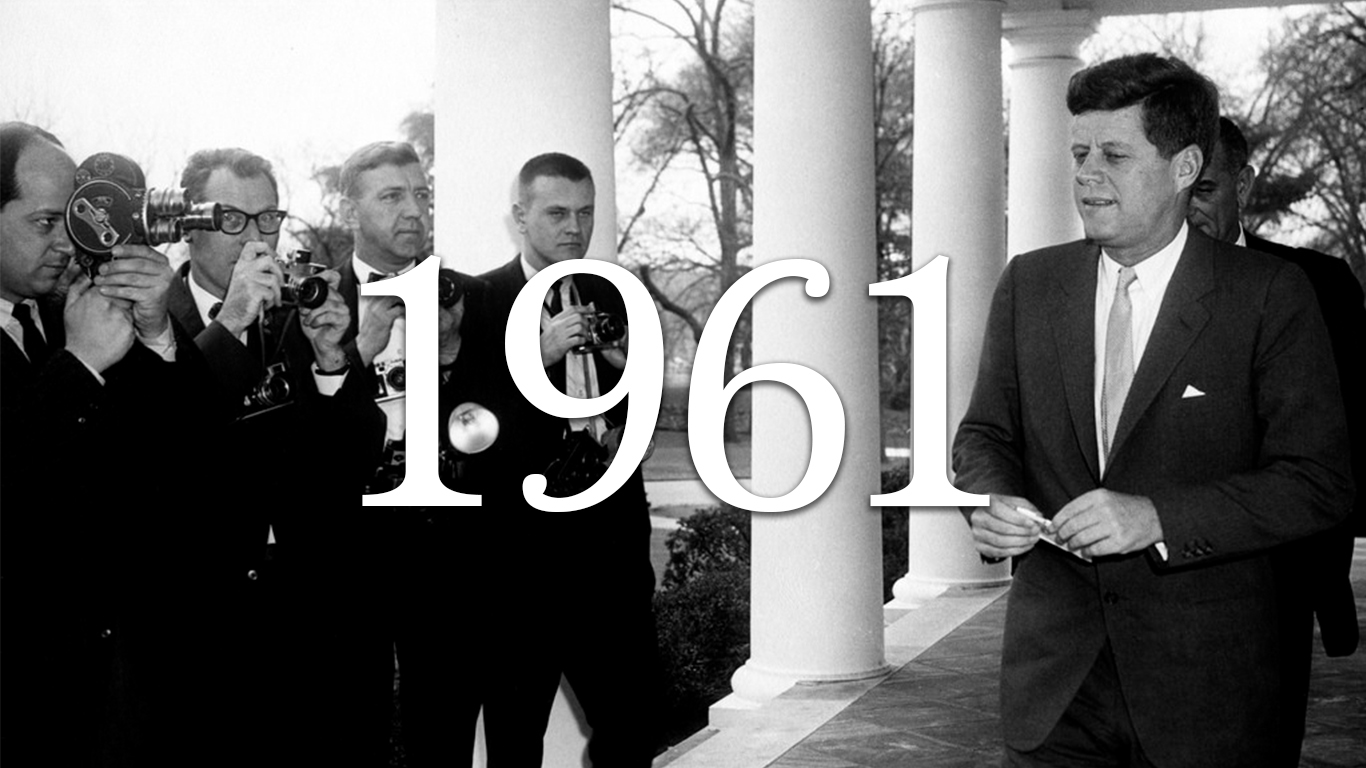
1961
> Start: 4,909.7
> End: 5,882.3
> High: 5,912.6
> Change: 19.8%
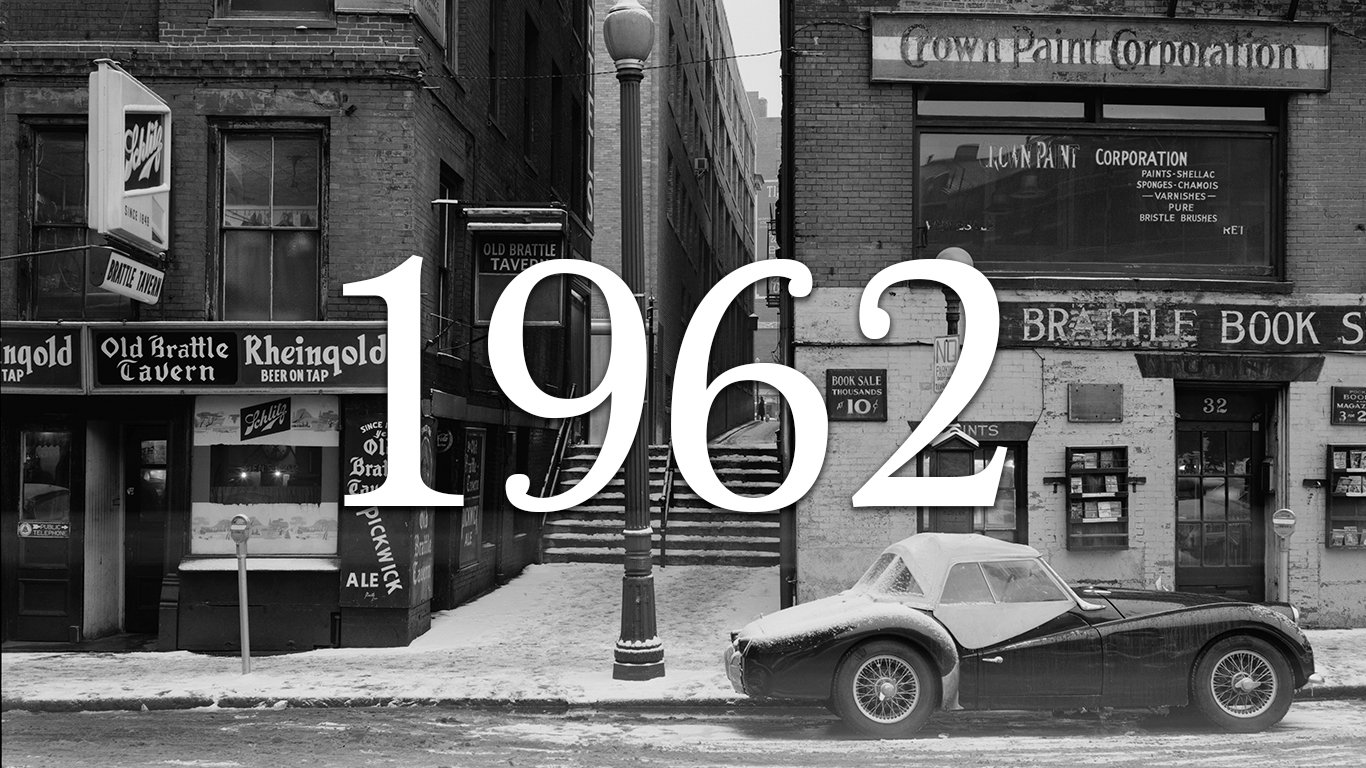
1962
> Start: 5,765.0
> End: 5,187.4
> High: 5,775.4
> Change: -10.0%
[recirclink id=444326]
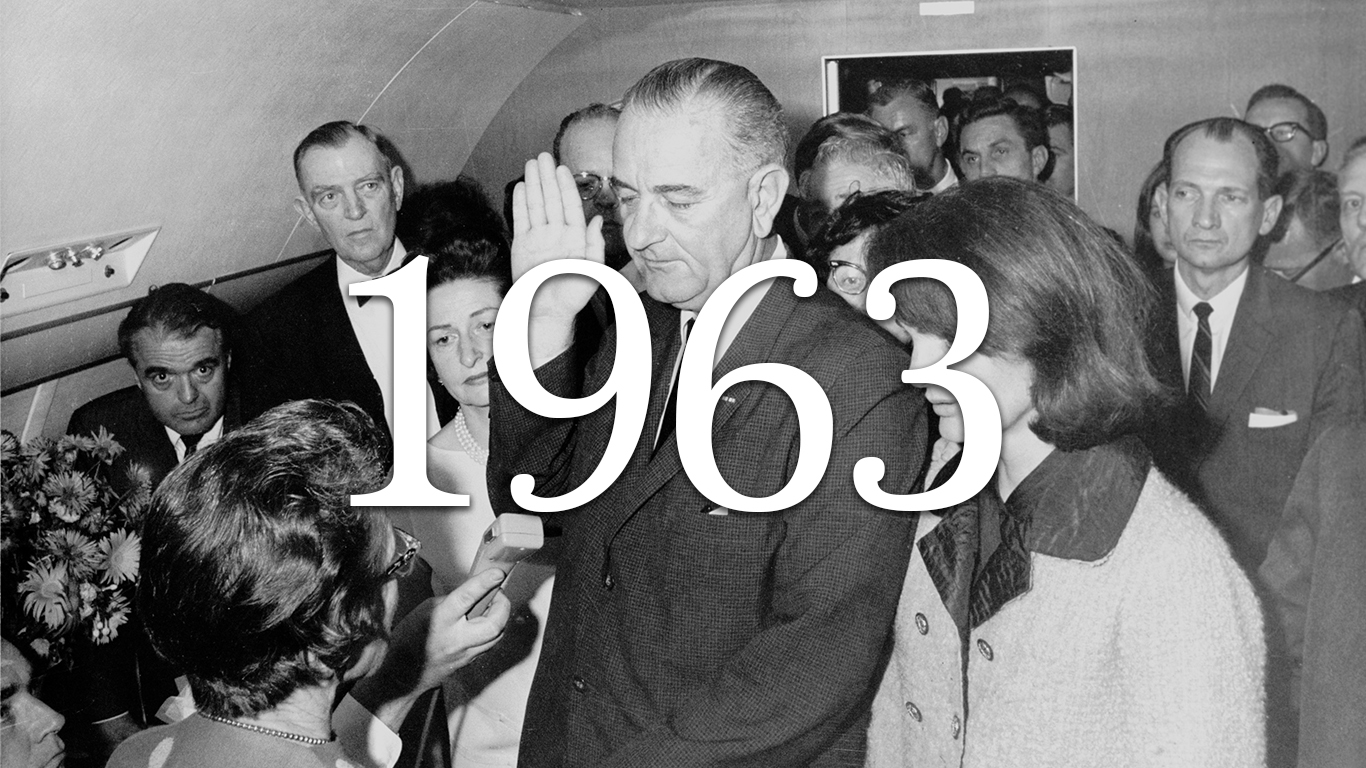
1963
> Start: 5,084.7
> End: 5,997.9
> High: 6,031.4
> Change: 18.0%
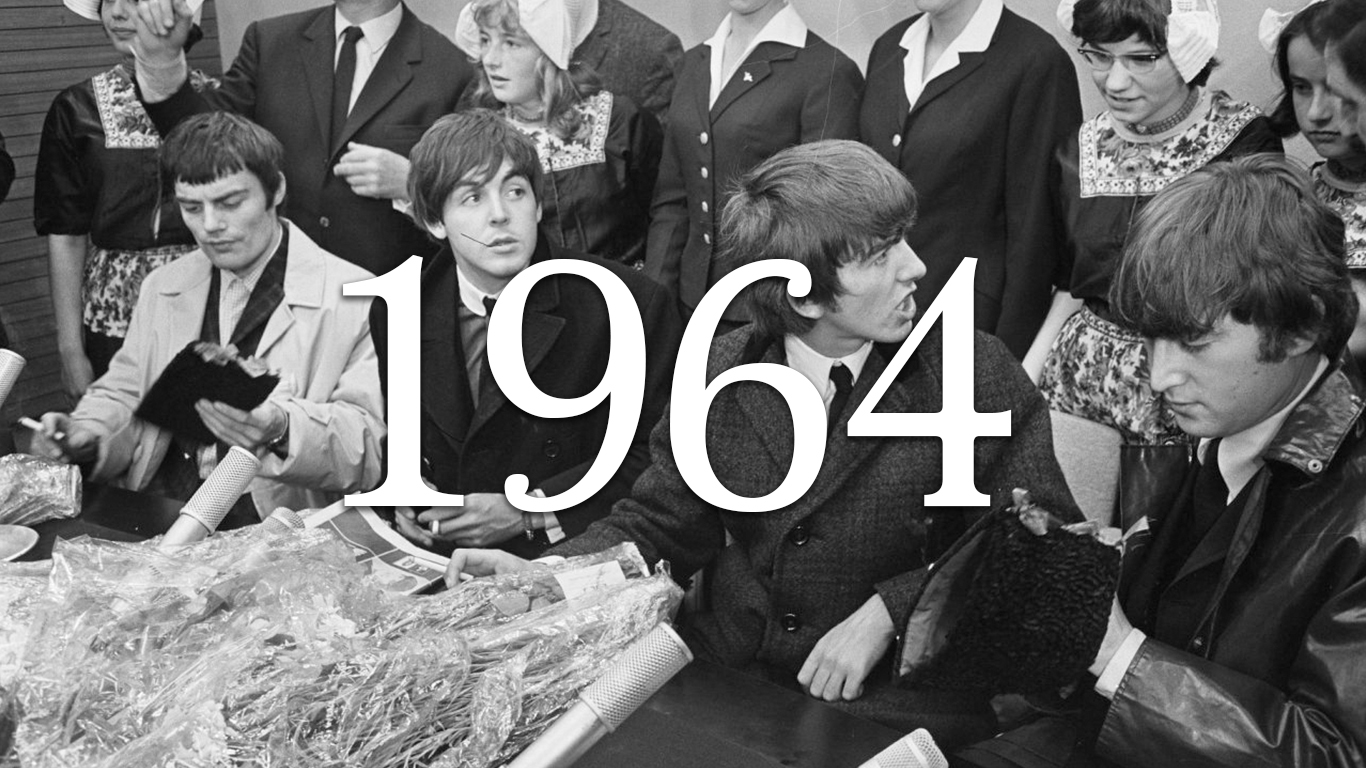
1964
> Start: 5,942.9
> End: 6,781.1
> High: 6,917.5
> Change: 14.1%
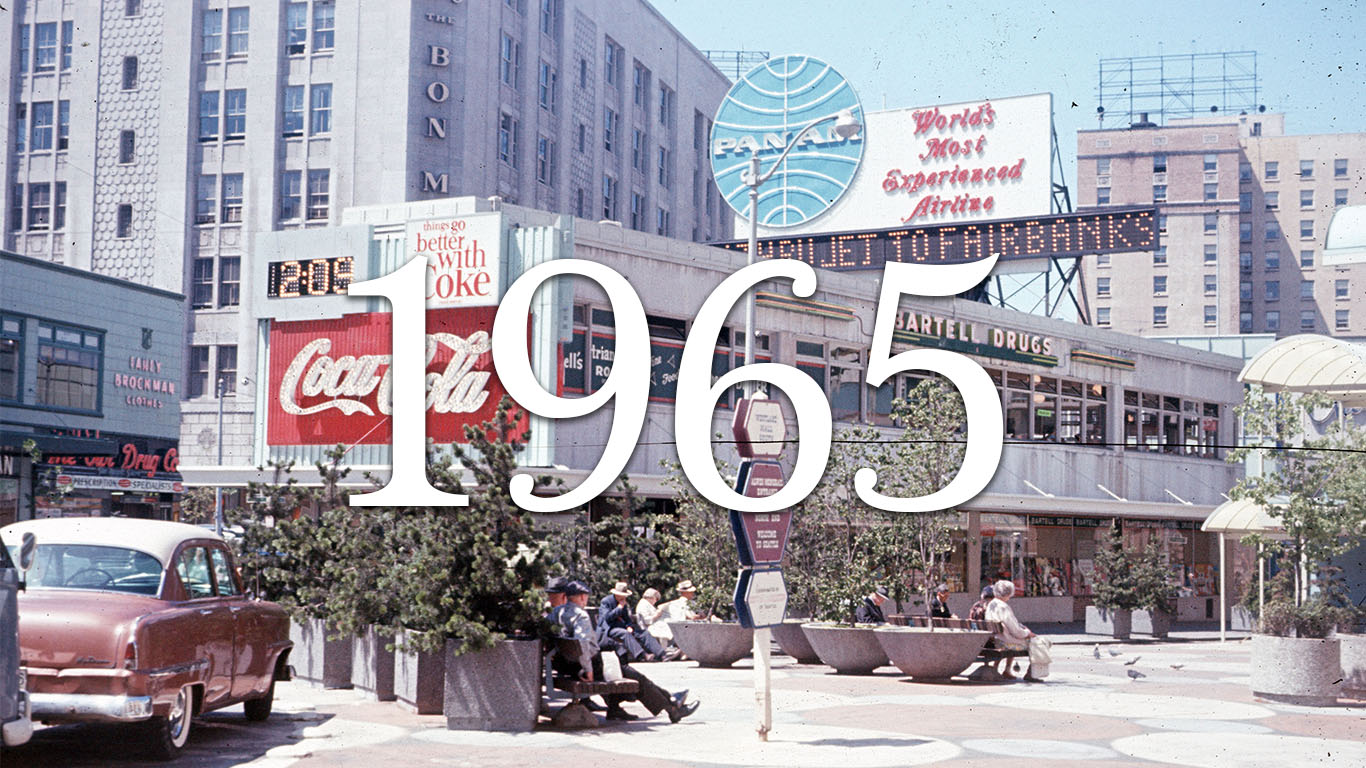
1965
> Start: 6,634.0
> End: 7,392.8
> High: 7,392.8
> Change: 11.4%
[in-text-ad-2]

1966
> Start: 7,182.5
> End: 5,826.5
> High: 7,379.8
> Change: -18.9%

1967
> Start: 5,667.7
> End: 6,523.2
> High: 6,796.9
> Change: 15.1%
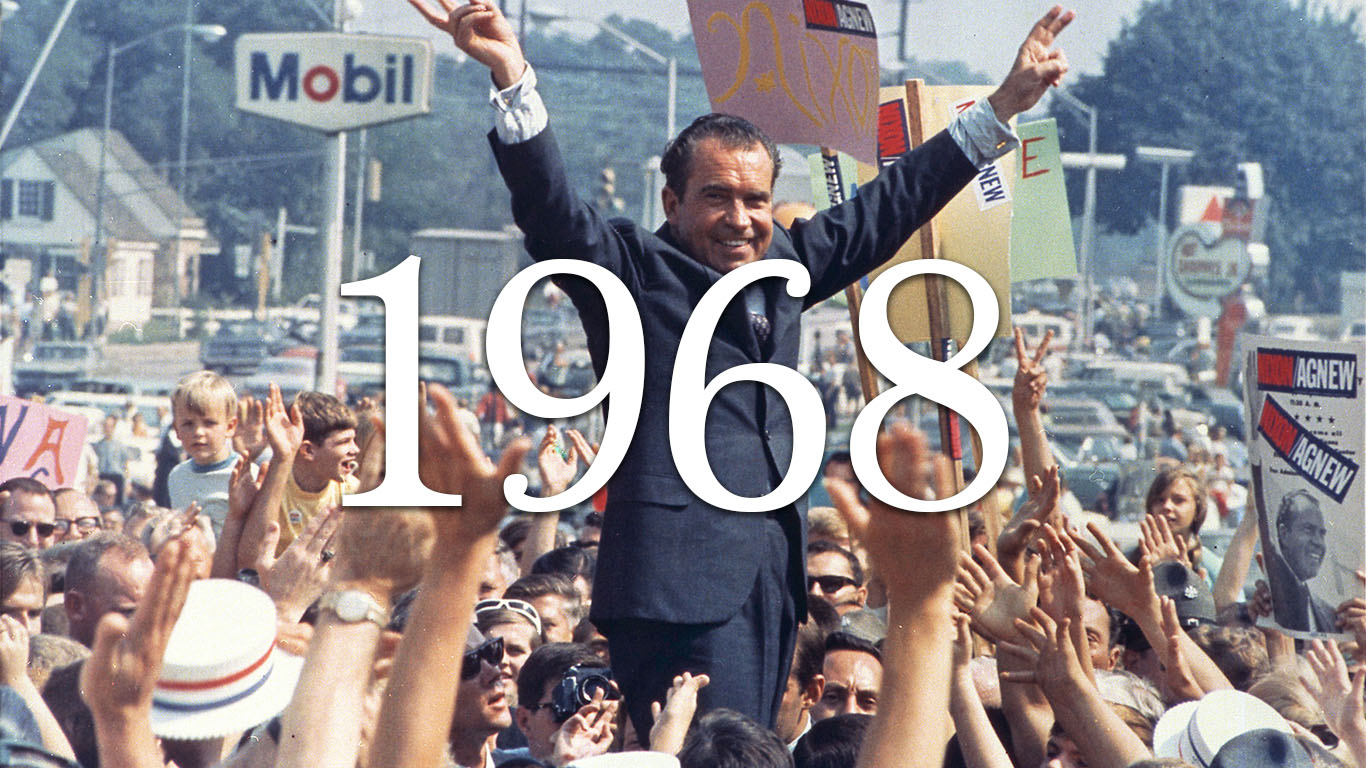
1968
> Start: 6,272.7
> End: 6,528.1
> High: 6,814.8
> Change: 4.1%
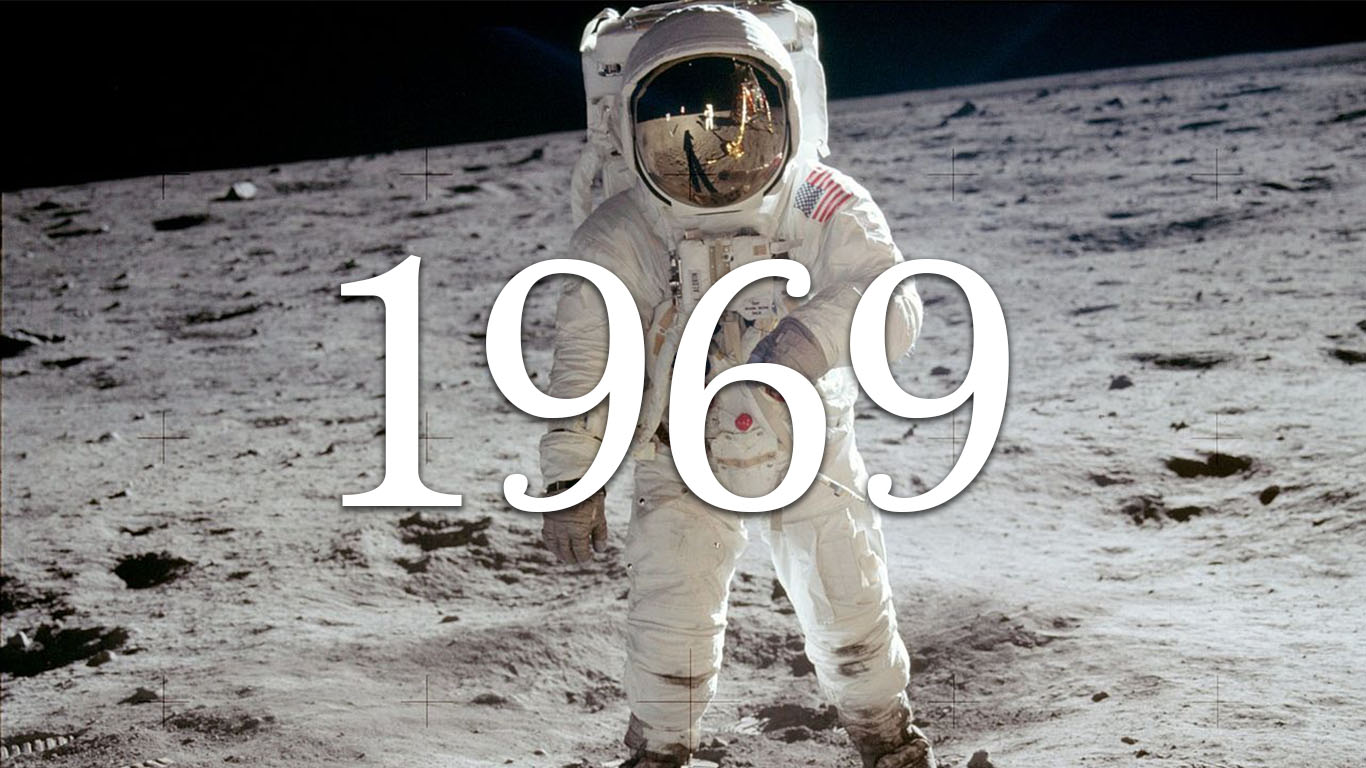
1969
> Start: 6,221.3
> End: 5,253.9
> High: 6,359.9
> Change: -15.5%
[in-text-ad]
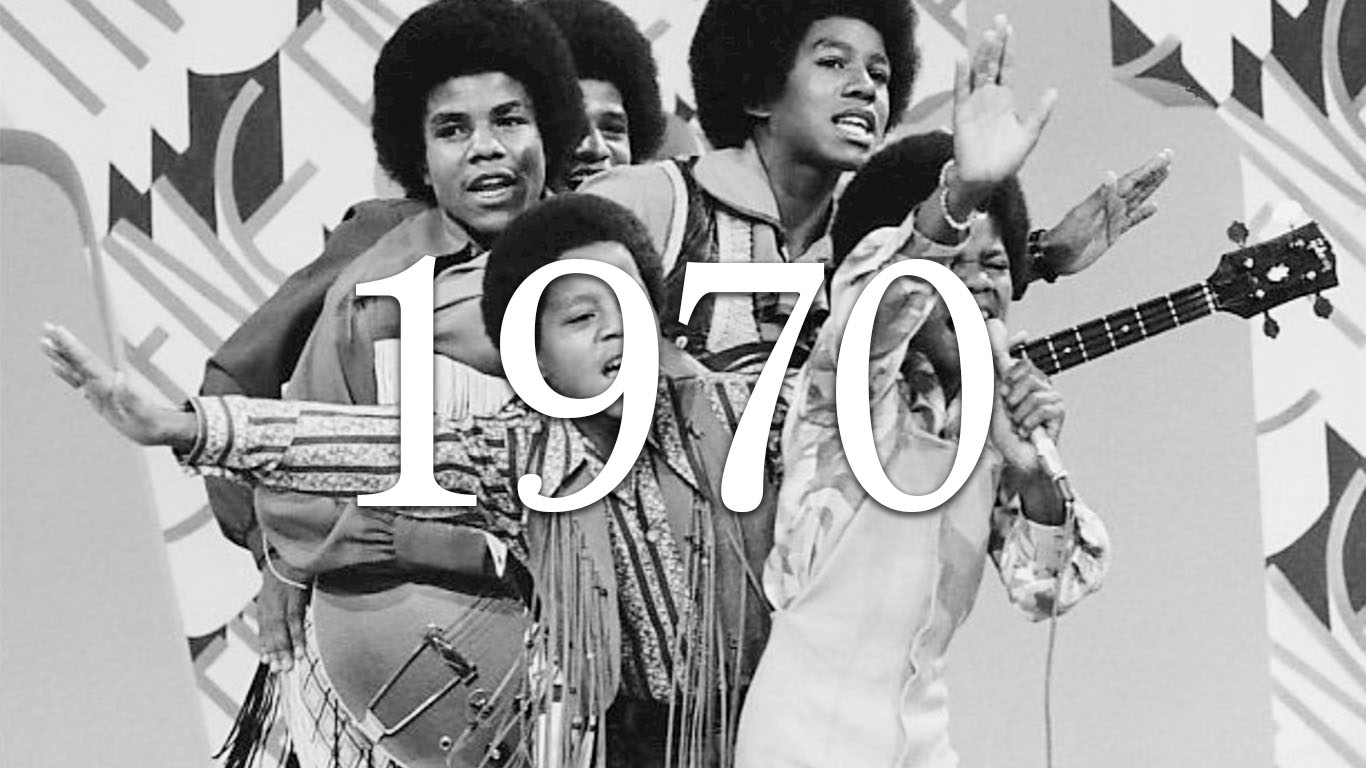
1970
> Start: 5,015.1
> End: 5,199.3
> High: 5,218.4
> Change: 3.7%

1971
> Start: 4,935.4
> End: 5,289.7
> High: 5,649.9
> Change: 7.2%
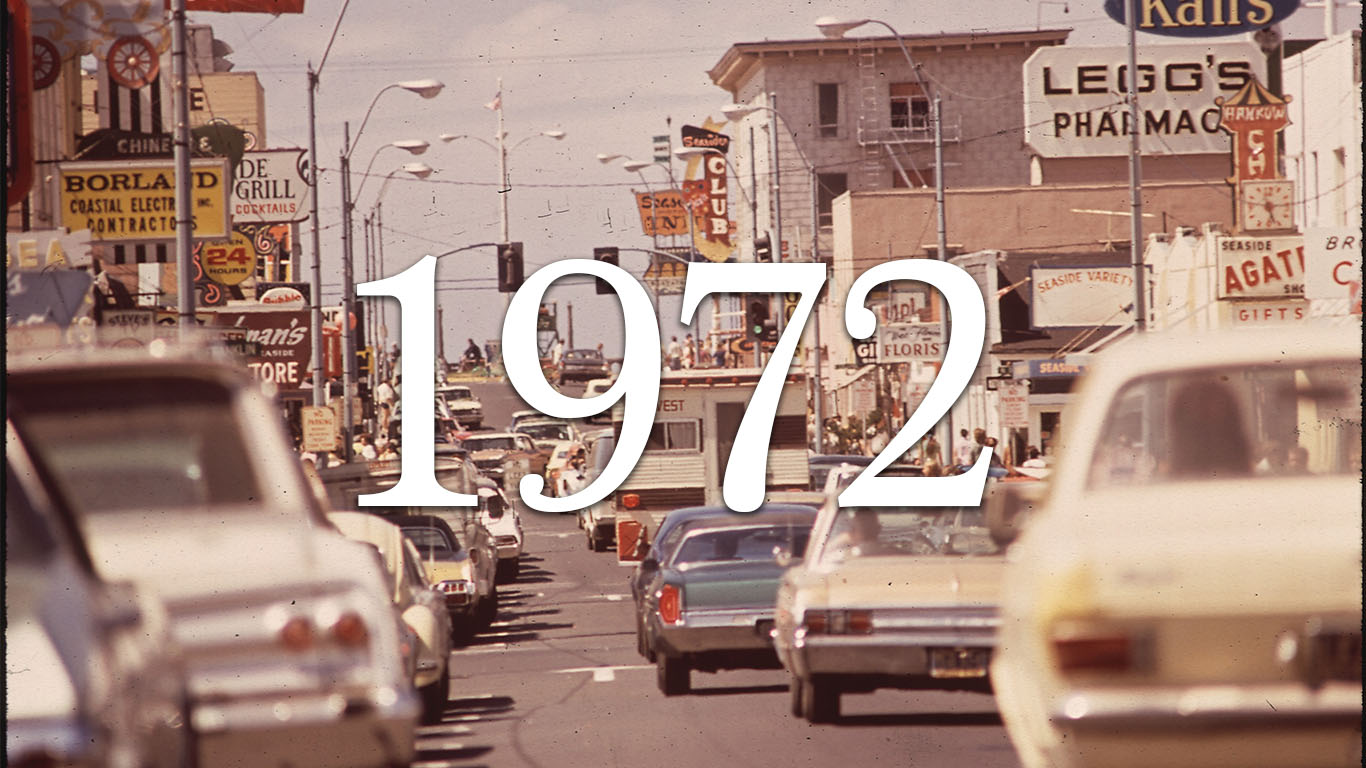
1972
> Start: 5,115.2
> End: 5,867.0
> High: 5,960.5
> Change: 14.7%
[recirclink id=444046]

1973
> Start: 5,587.0
> End: 4,607.8
> High: 5,695.4
> Change: -17.5%

1974
> Start: 4,173.7
> End: 3,007.1
> High: 4,351.1
> Change: -28.0%
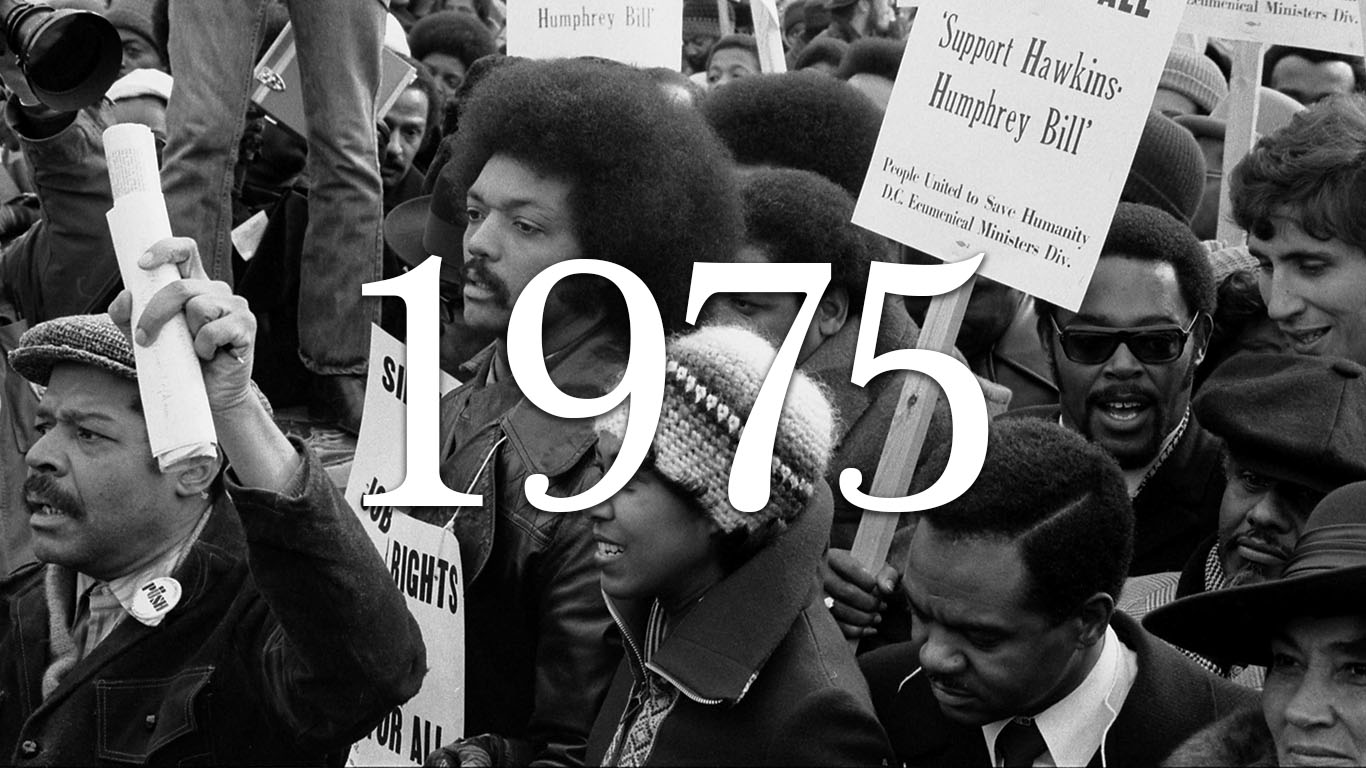
1975
> Start: 2,825.8
> End: 3,811.1
> High: 3,942.5
> Change: 34.9%
[in-text-ad-2]
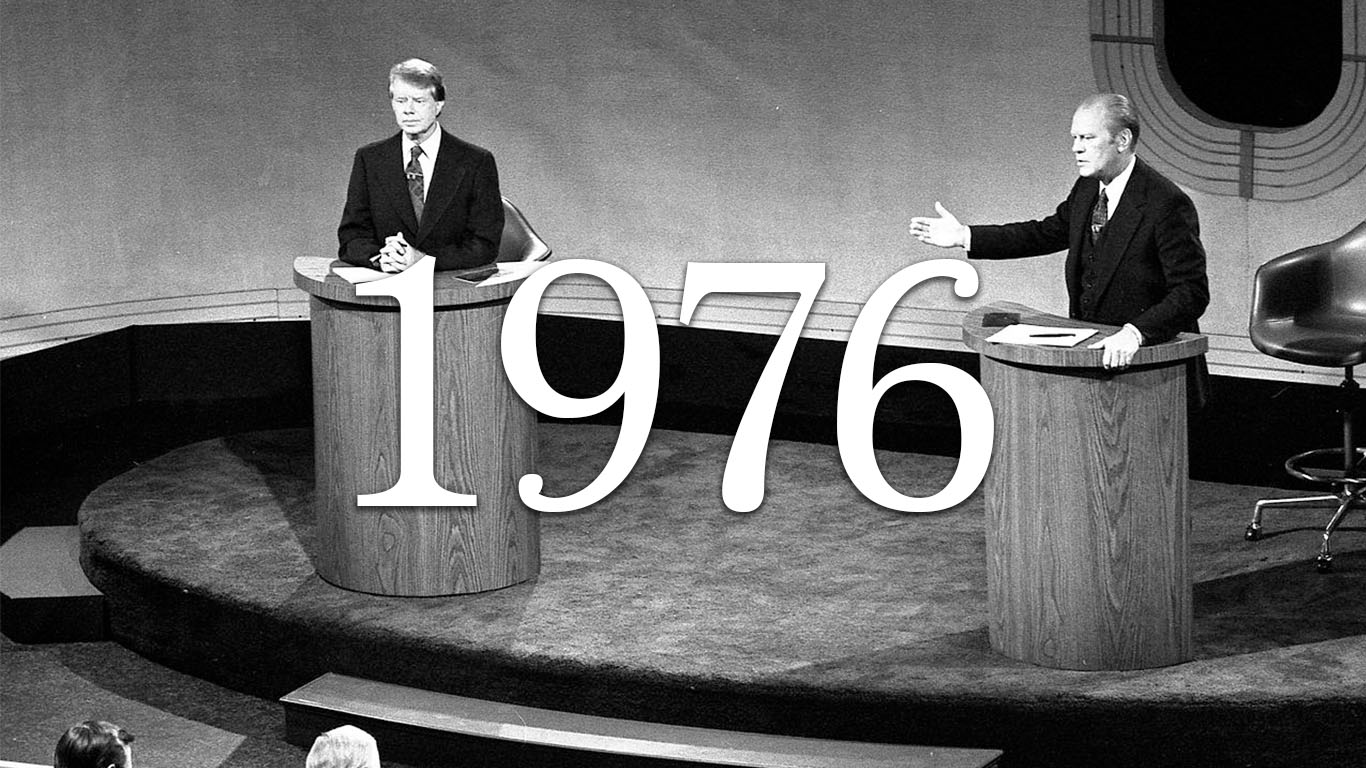
1976
> Start: 3,630.2
> End: 4,247.2
> High: 4,290.1
> Change: 17.0%
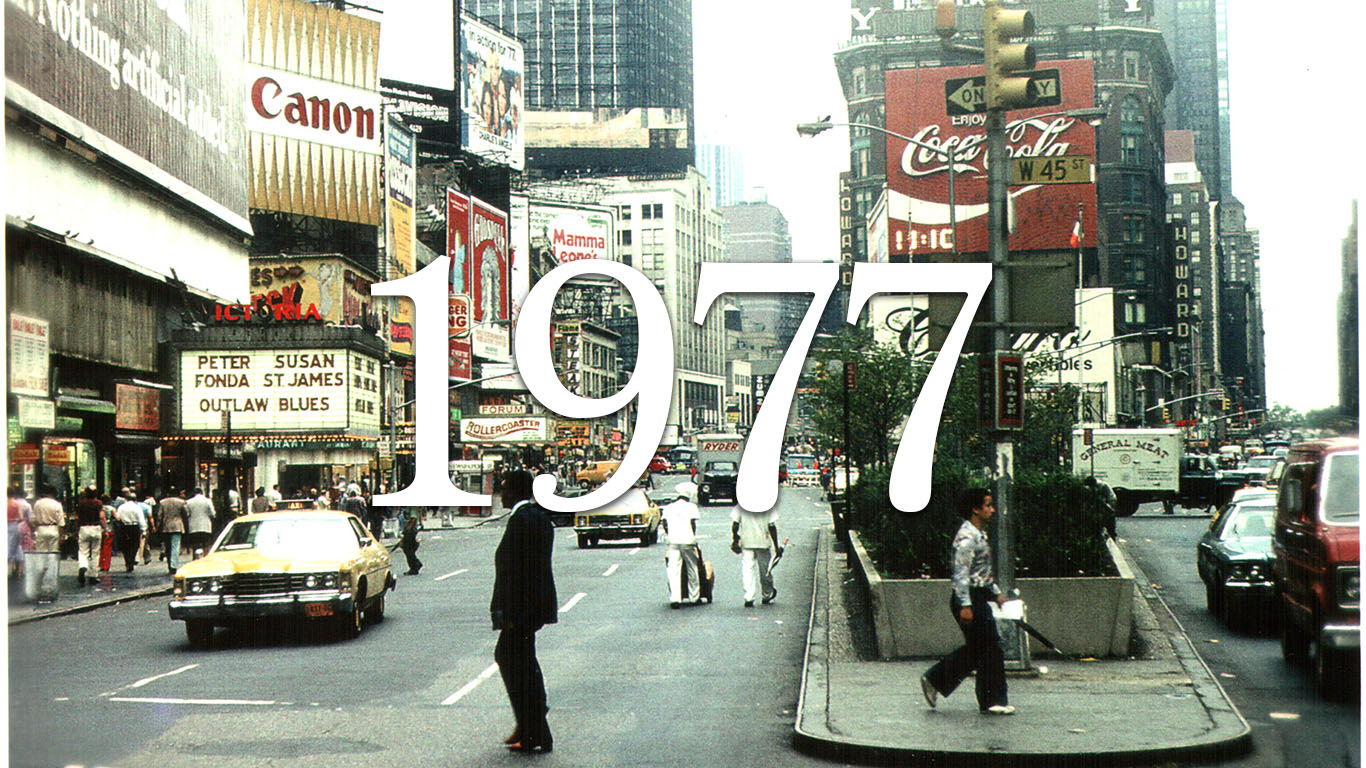
1977
> Start: 3,970.6
> End: 3,301.0
> High: 3,970.6
> Change: -16.9%
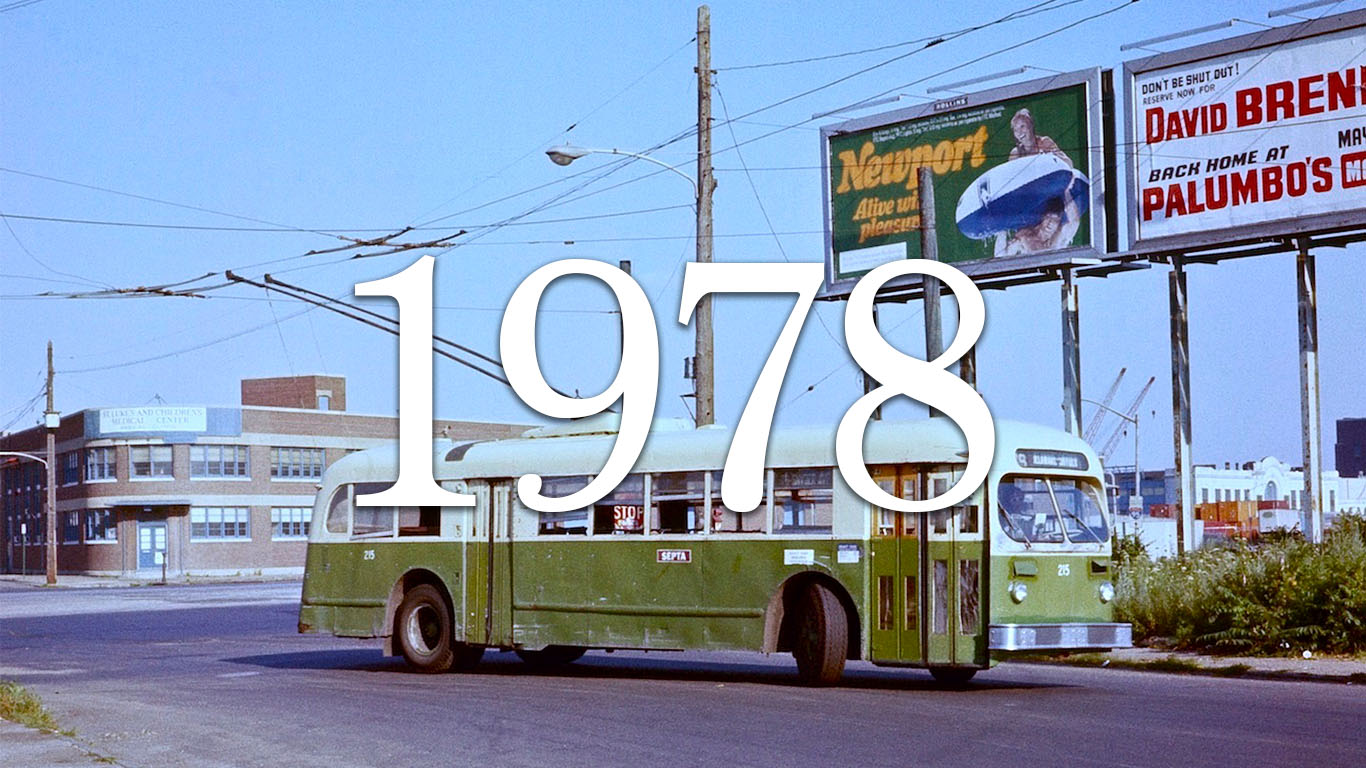
1978
> Start: 3,018.1
> End: 2,971.2
> High: 3,350.3
> Change: -1.6%
1979
> Start: 2,691.5
> End: 2,782.0
> High: 2,977.4
> Change: 3.4%
[in-text-ad]
1980
> Start: 2,409.4
> End: 2,816.8
> High: 2,922.5
> Change: 16.9%

1981
> Start: 2,575.2
> End: 2,316.4
> High: 2,710.9
> Change: -10.1%
1982
> Start: 2,201.4
> End: 2,610.6
> High: 2,670.5
> Change: 18.6%
[recirclink id=443940]
1983
> Start: 2,482.2
> End: 3,041.9
> High: 3,110.9
> Change: 22.6%
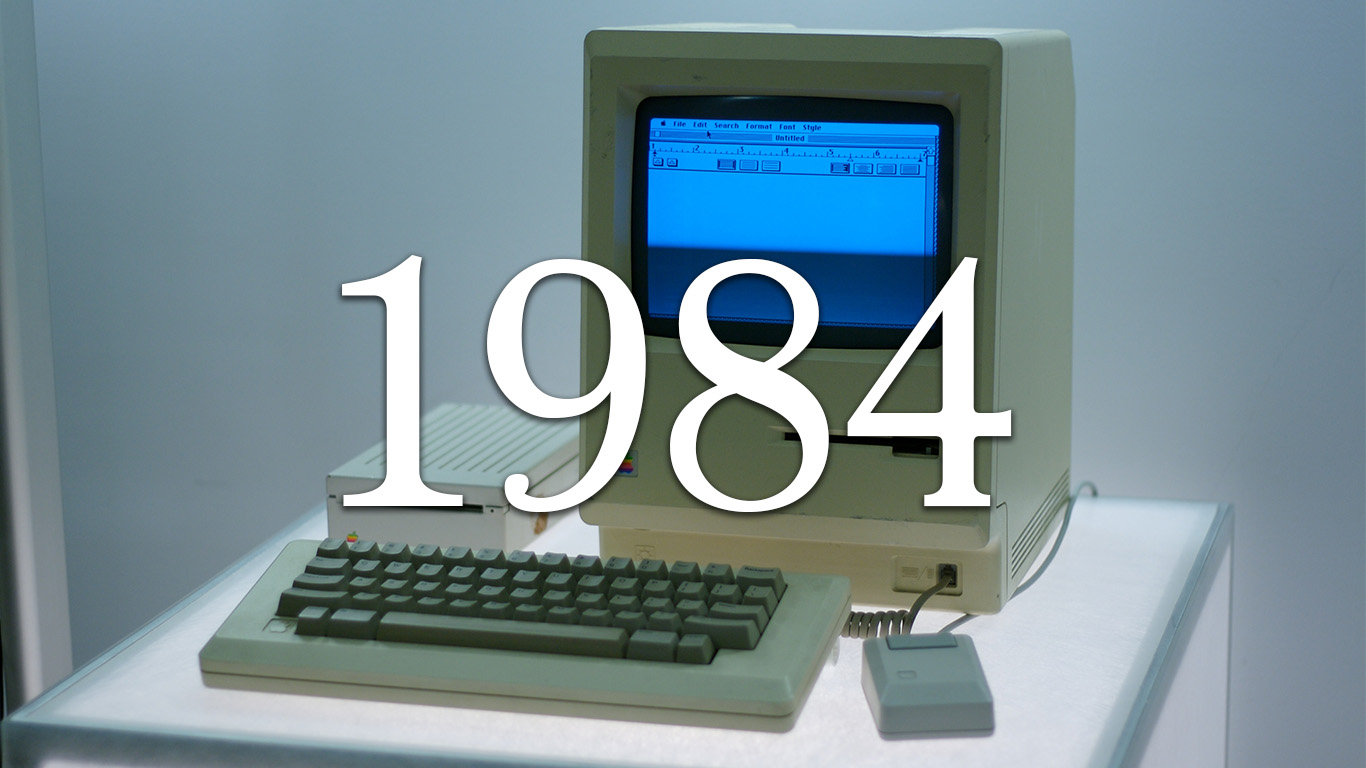
1984
> Start: 2,902.4
> End: 2,807.0
> High: 2,980.9
> Change: -3.3%

1985
> Start: 2,682.0
> End: 3,460.1
> High: 3,474.5
> Change: 29.0%
[in-text-ad-2]

1986
> Start: 3,377.3
> End: 4,164.1
> High: 4,295.1
> Change: 23.3%

1987
> Start: 4,083.9
> End: 4,108.4
> High: 5,768.8
> Change: 0.6%

1988
> Start: 4,100.6
> End: 4,412.6
> High: 4,443.0
> Change: 7.6%
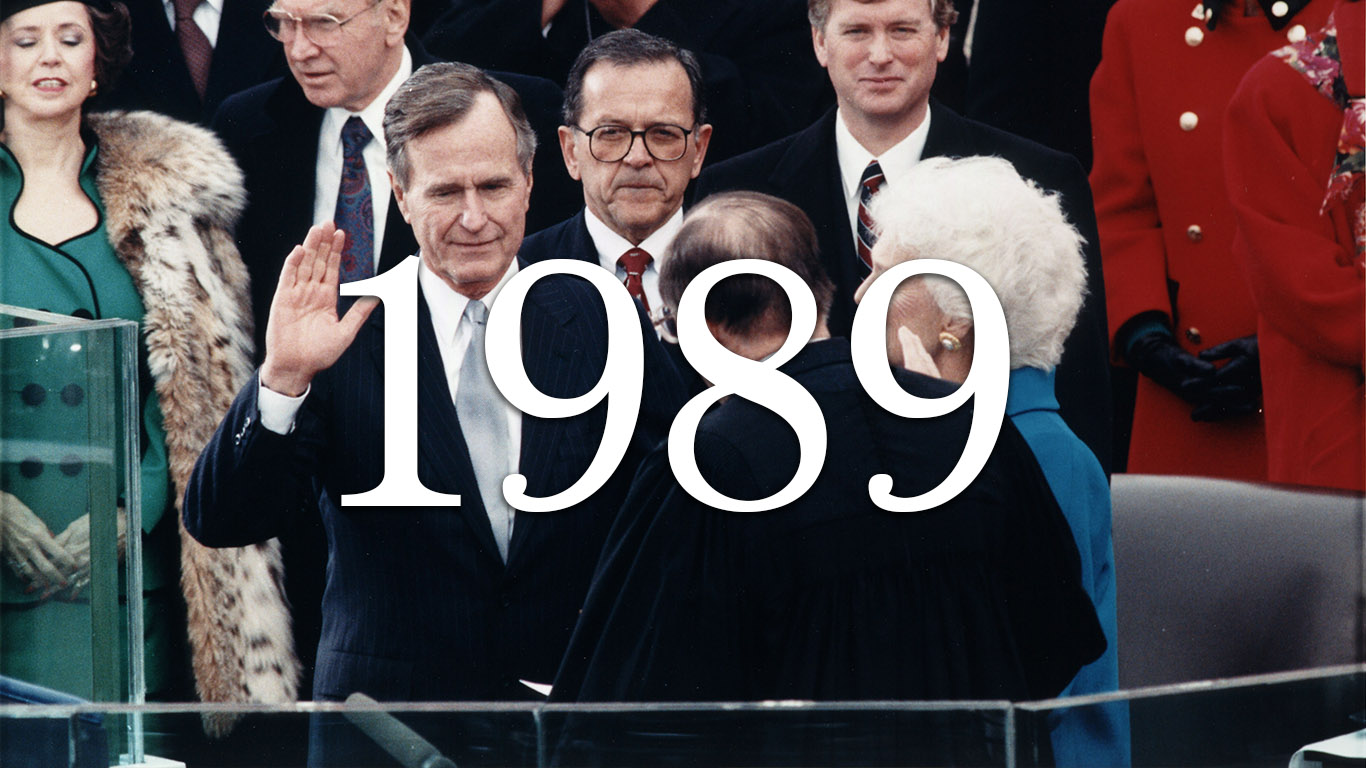
1989
> Start: 4,163.3
> End: 5,344.7
> High: 5,418.9
> Change: 28.4%
[in-text-ad]

1990
> Start: 5,175.6
> End: 4,850.5
> High: 5,524.8
> Change: -6.3%

1991
> Start: 4,614.0
> End: 5,600.5
> High: 5,600.5
> Change: 21.4%
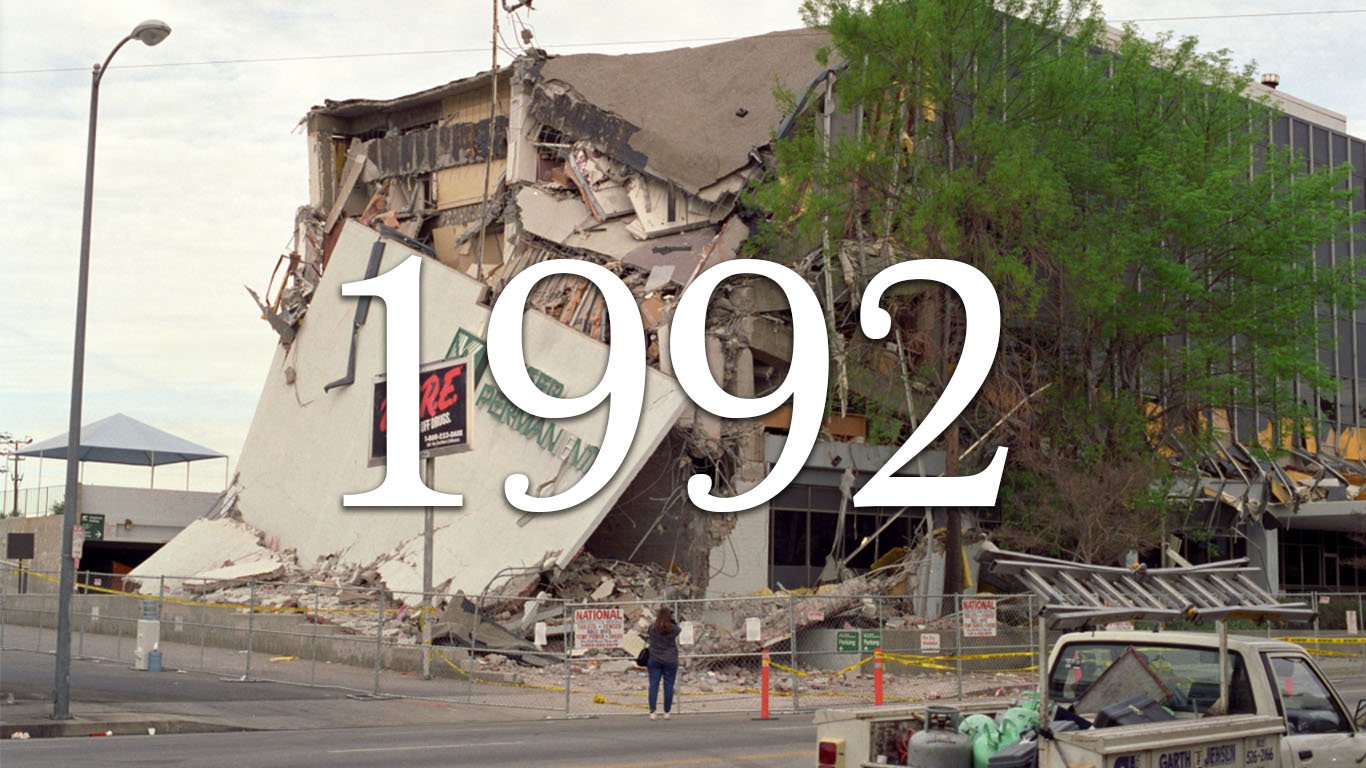
1992
> Start: 5,443.0
> End: 5,663.8
> High: 5,856.1
> Change: 4.1%
[recirclink id=443564]
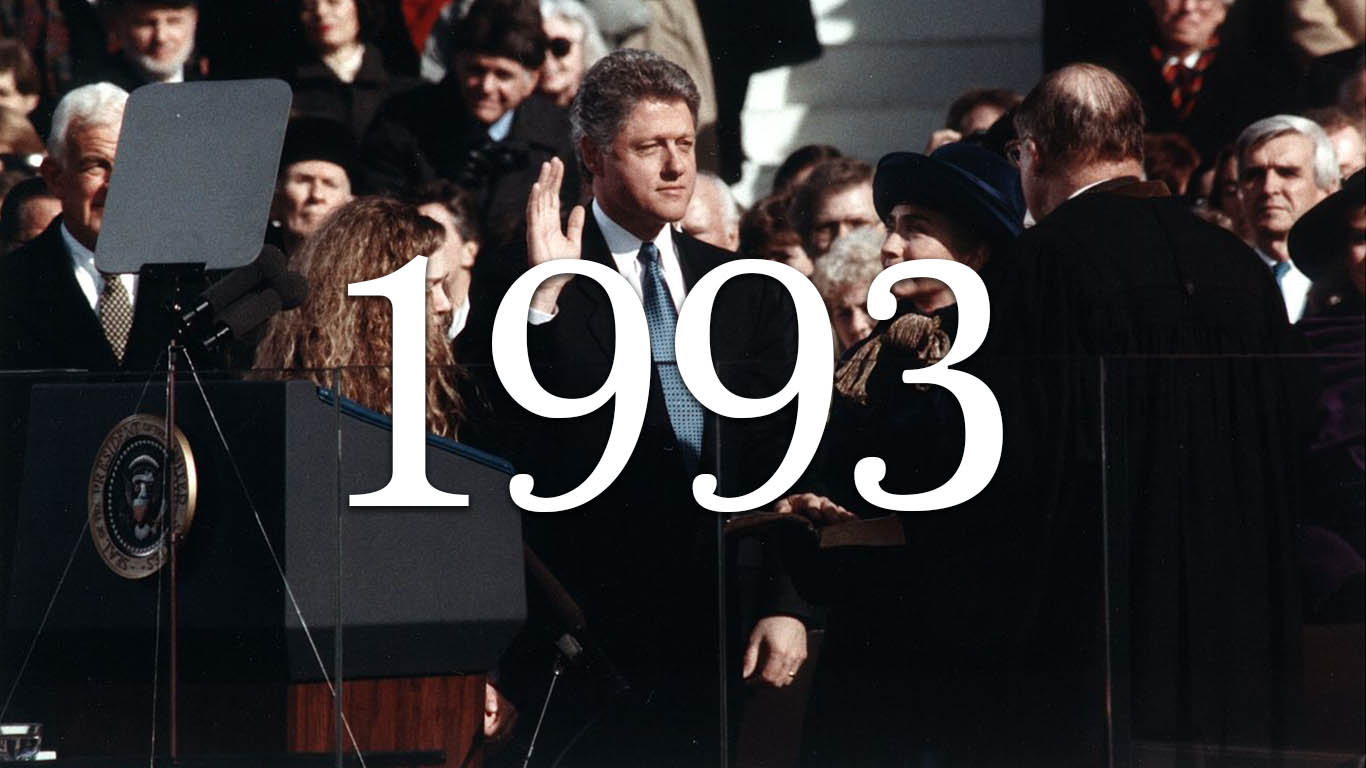
1993
> Start: 5,512.7
> End: 6,253.8
> High: 6,320.8
> Change: 13.4%
1994
> Start: 6,101.7
> End: 6,228.2
> High: 6,461.9
> Change: 2.1%

1995
> Start: 6,062.9
> End: 8,082.5
> High: 8,239.4
> Change: 33.3%
[in-text-ad-2]
1996
> Start: 7,943.3
> End: 9,893.0
> High: 10,065.8
> Change: 24.5%

1997
> Start: 9,662.4
> End: 11,860.7
> High: 12,387.2
> Change: 22.8%
1998
> Start: 11,762.7
> End: 13,559.0
> High: 13,843.8
> Change: 15.3%

1999
> Start: 13,270.1
> End: 16,611.9
> High: 16,611.9
> Change: 25.2%
[in-text-ad]

2000
> Start: 15,876.6
> End: 15,078.8
> High: 16,387.4
> Change: -5.0%

2001
> Start: 14,470.4
> End: 13,621.4
> High: 15,410.7
> Change: -5.9%

2002
> Start: 13,478.8
> End: 11,161.6
> High: 14,230.6
> Change: -17.2%
[recirclink id=443882]

2003
> Start: 11,260.7
> End: 13,676.3
> High: 13,676.3
> Change: 21.5%

2004
> Start: 13,265.3
> End: 13,740.9
> High: 13,832.0
> Change: 3.6%

2005
> Start: 13,224.5
> End: 13,209.8
> High: 13,484.8
> Change: -0.1%
[in-text-ad-2]
2006
> Start: 12,952.1
> End: 14,881.4
> High: 14,938.0
> Change: 14.9%

2007
> Start: 14,482.6
> End: 15,400.1
> High: 16,444.7
> Change: 6.3%
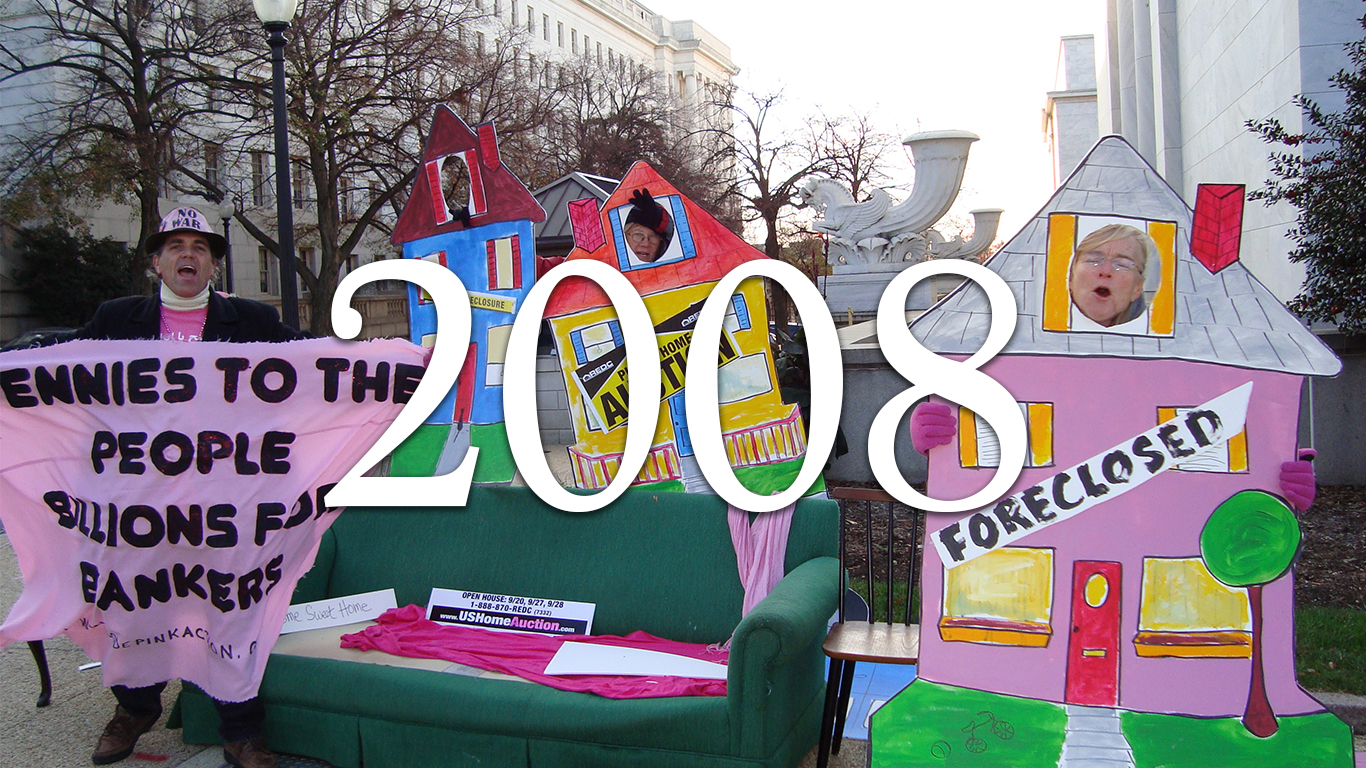
2008
> Start: 14,583.8
> End: 9,812.5
> High: 14,599.8
> Change: -32.7%
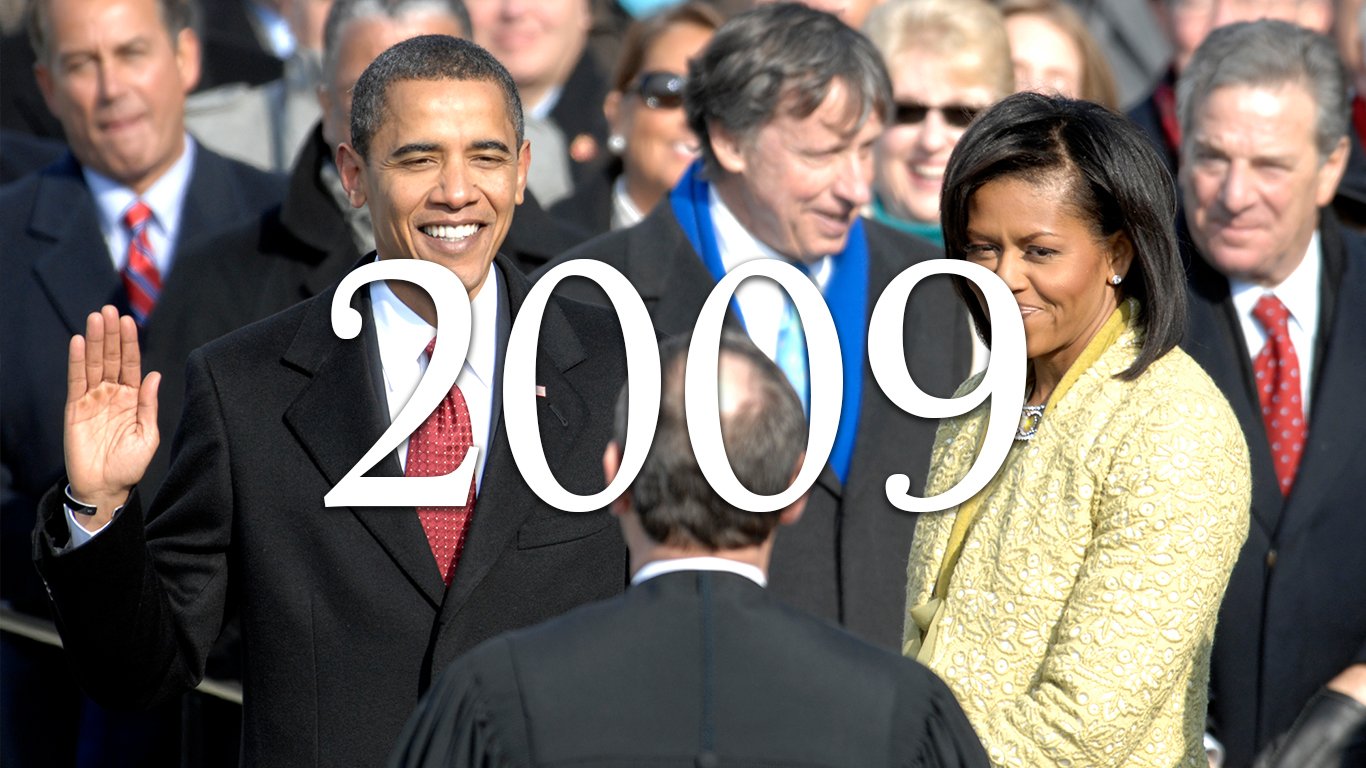
2009
> Start: 10,137.0
> End: 11,700.4
> High: 11,835.6
> Change: 15.4%

2010
> Start: 11,683.6
> End: 12,780.4
> High: 12,789.1
> Change: 9.4%

2011
> Start: 12,489.3
> End: 13,074.5
> High: 13,709.0
> Change: 4.7%

2012
> Start: 12,998.2
> End: 13,739.2
> High: 14,269.7
> Change: 5.7%

2013
> Start: 13,859.1
> End: 17,128.6
> High: 17,128.6
> Change: 23.6%

2014
> Start: 16,717.5
> End: 18,122.5
> High: 18,357.0
> Change: 8.4%

2015
> Start: 18,111.1
> End: 17,696.8
> High: 18,598.0
> Change: -2.3%

2016
> Start: 17,199.4
> End: 19,820.8
> High: 20,033.4
> Change: 15.2%

2017
> Start: 19,524.6
> End: 24,275.2
> High: 24,391.3
> Change: 24.3%

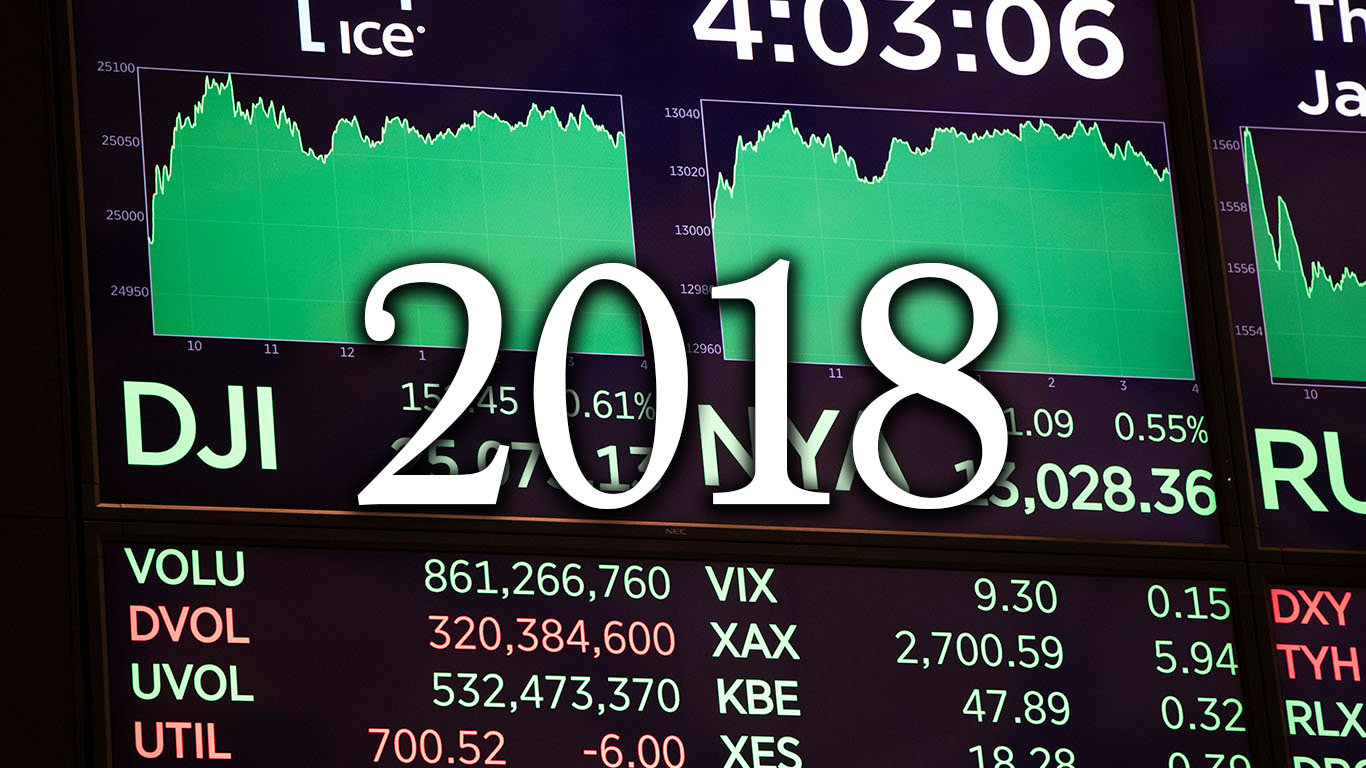
2018
> Start: 24,053.4
> End: 24,252.2
> High: 25,790.4
> Change: 0.8%
Like the economy as a whole, the stock market is much larger today than it was in 1917. While the economy has had its up and downs, the Dow has experienced much more extreme swings over the course of its history.
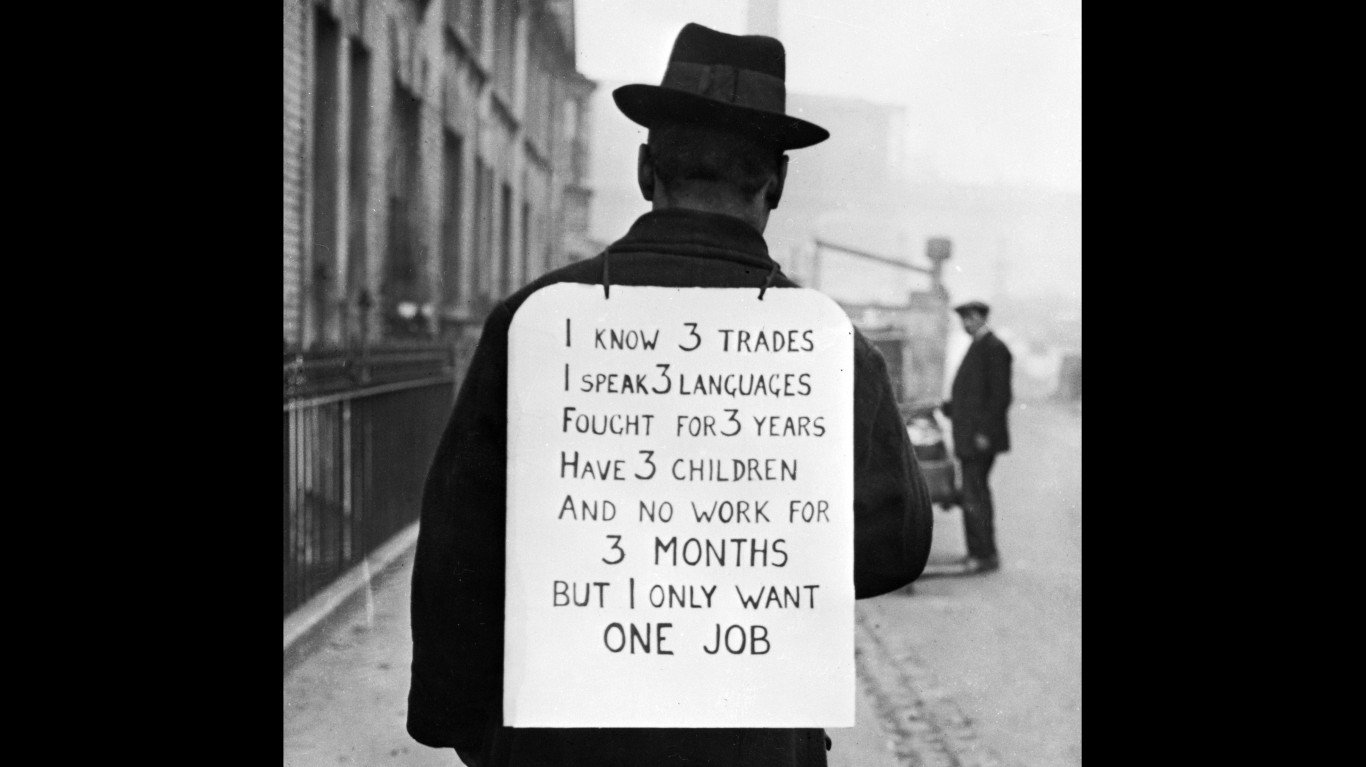
One of the most notable events in the history of the often-referenced index is the lows during the Great Depression. The Dow started the tumultuous 1929 year at an inflation-adjusted level of 4,314.2 points. In October of that year, the Dow lost nearly one-quarter of its value in just two days. The Dow reached its lowest point on July 8, 1932, with an adjusted value of 725.90 points — only 17% of its value at the start of 1929.
After the historic low, the Dow soared by nearly 70% in 1933, the largest single year growth in the history of the index. Still, the Dow did not return to its pre-Great Depression level until the mid 1950s.
There have been several other dramatic stock market swings since the Great Depression. The largest single day drop in the index’s history occurred during a stock market crash on Oct. 19, 1987, when the Dow nose-dived 22.6%. The Dow’s value doubled between 1995 and 1999 during the dot-com boom, only to collapse between 2000 and 2002. Relatively soon after, the Dow lost nearly a third of its value in 2008, as the financial crisis of the summer of 2007 hit global markets.
To determine the value of the Dow Jones Industrial Average the year you were born, 24/7 Wall St. reviewed daily Dow figures aggregated by economic research website MeasuringWorth.com. Historical Dow data are inflation-adjusted using annual headline CPI in chained 2016 dollars.
This is the value of the Dow the year you were born.
Contact [email protected] for any questions or corrections.