
[cnxvideo id=”506322″ placement=”ros”]The population of the United States increased by 2.2 million people in 2016. Natural growth — the number of births less the number of deaths — accounted for most of the population increase, while the rest was due to international migration.
Population growth was far from even across the country. While populations in the South and West together grew by 1.1% in 2016, the Northeast and Midwest grew by just 0.1%. There were eight states, mostly in the Northeast and Midwest, where the population declined. Meanwhile, the population of eight states grew by more than 1.6%.
A number of common factors affect migration patterns throughout the country. Americans move for economic and educational opportunities as well as quality of life factors such as environment and cost of living. Many of the fastest growing states are home to affordable, midsize cities with quality school systems and low unemployment.
To determine the fastest growing (and shrinking) states, 24/7 Wall St. reviewed the one-year population change of all 50 states from 2015 to 2016 with data from the U.S. Census Bureau. All population estimates are as of July 1 of each year.
Click here to see the fastest growing states.
Click here to see the fastest shrinking states.
Click here to see our detailed findings and methodology.
The Fastest Growing States
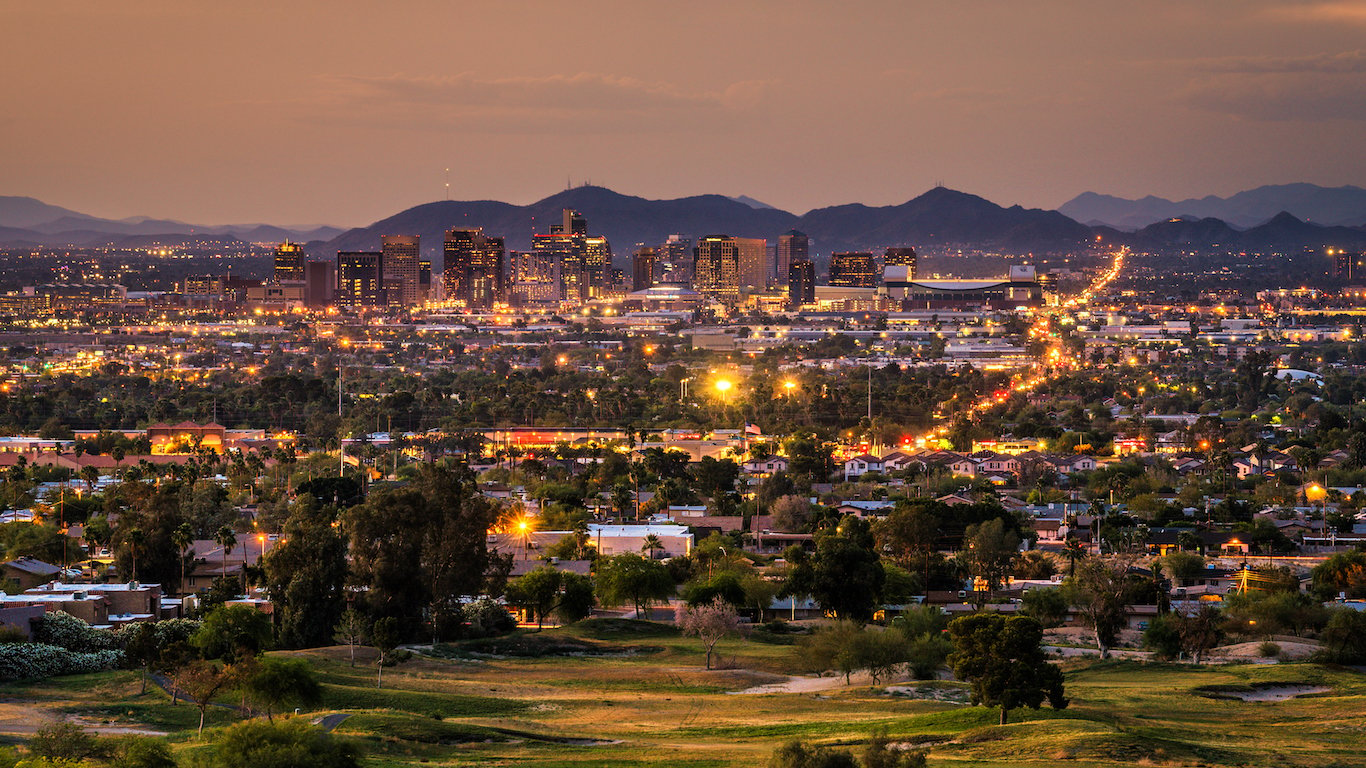
8. Arizona
> 1-yr pop. growth rate: 1.66%
> Current population: 6.93 million
> 2015 population: 6.82 million
> 10-yr pop. growth rate: 14.96%
Arizona’s population grew by 1.7% in 2016, more than twice the 0.7% national population growth rate. Much of Arizona’s growth was due to new residents migrating to the state. A net total of 61,544 Americans relocated to Arizona that year, the fourth most of any state. Many of those moving to Arizona likely came for employment opportunities. From 2015 to 2016, Arizona’s unemployment rate fell from 6.0% to 5.3% — one of the largest percentage-point drops of any state over the period.
[in-text-ad]

7. Colorado
> 1-yr pop. growth rate: 1.68%
> Current population: 5.54 million
> 2015 population: 5.45 million
> 10-yr pop. growth rate: 17.37%
Colorado’s population grew by 1.7% in 2016, among the fastest pace of any state. Like many of the fastest growing states, domestic migration contributed the most to Colorado’s rapid population growth. A net influx of 50,216 Americans relocated to Colorado in 2016, more than all but five other states. Colorado has sustained rapid population growth throughout the past decade. Since 2006, the state’s population has increased by 17.4%, the fastest pace of any state other than Texas and Utah. The population growth occurred alongside a steep decline in unemployment. Just 3.3% of the Colorado labor force is unemployed, tied with Vermont as the sixth lowest unemployment rate of any state.
[recirclink id=429078]
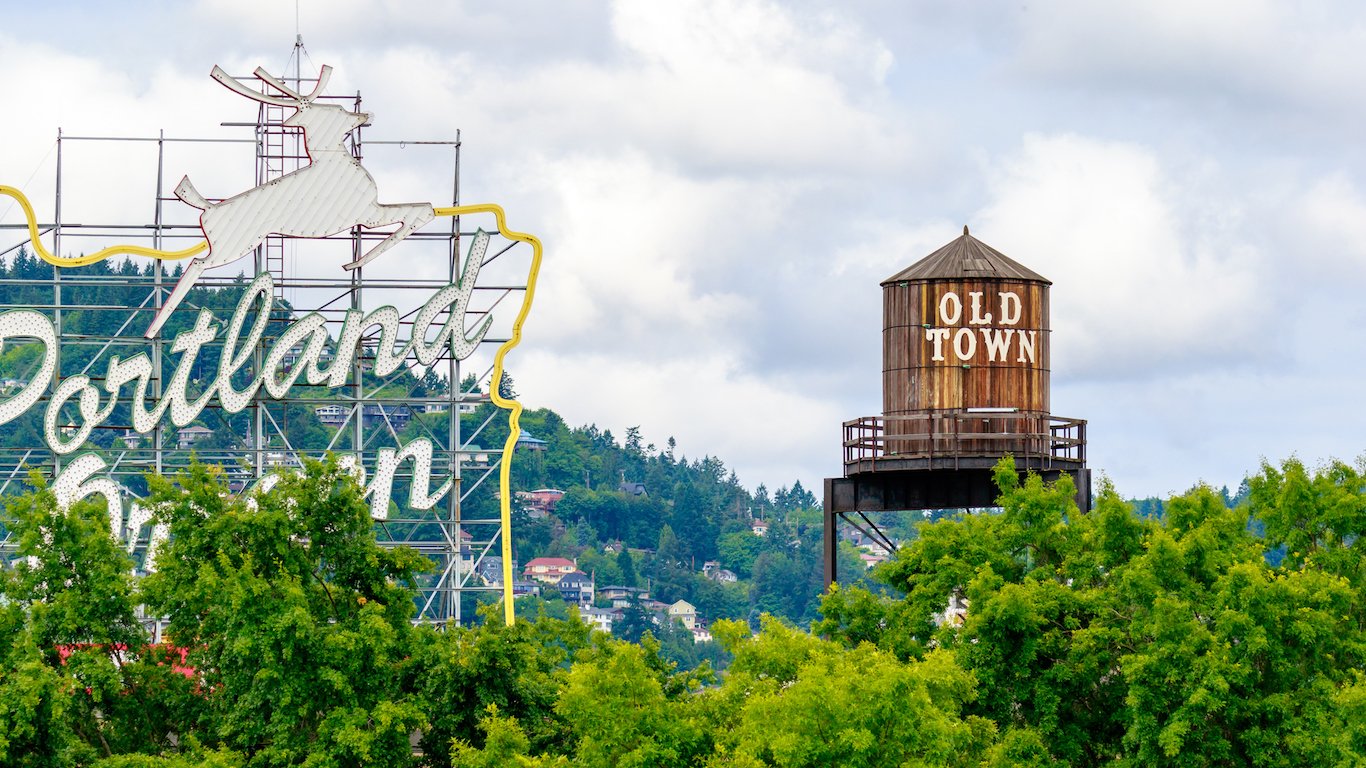
6. Oregon
> 1-yr pop. growth rate: 1.71%
> Current population: 4.09 million
> 2015 population: 4.02 million
> 10-yr pop. growth rate: 11.51%
Since 2006, Oregon’s population has grown at an average rate of 1.1%. The state’s population growth rate spiked in 2016, when the number of residents in the state grew 1.7% — faster than nearly any other state. Approximately 3 in every 4 new Oregonians in 2016 moved to the state from elsewhere in the country, with the remaining population increase due to natural growth — the number of births less the number of deaths. Many new residents likely came to Oregon for economic opportunity. The state’s unemployment rate fell from 5.6% in 2015 to 4.9% in 2016, one of the largest percentage-point declines of any state.

5. Washington
> 1-yr pop. growth rate: 1.78%
> Current population: 7.29 million
> 2015 population: 7.16 million
> 10-yr pop. growth rate: 14.40%
Washington state’s population grew by 1.8% in 2016, more than twice the 0.7% national population growth rate. Washington has sustained relatively fast population growth over the past decade. The state’s population increased by 14.4% from 2006 to 2016, the eighth fastest pace of any state. The state’s strong population growth over the past decade was accompanied by a substantial increase in GDP. From the second quarter of 2006 to the second quarter of 2016, Washington’s GDP grew at an average rate of 2.2% a year — the fourth fastest pace of any state. Washington’s information sector — which includes industry giants Microsoft, Amazon, and Expedia — grew faster than in any other state other than Pennsylvania over that period.

4. Florida
> 1-yr pop. growth rate: 1.82%
> Current population: 20.61 million
> 2015 population: 20.24 million
> 10-yr pop. growth rate: 13.46%
In 2014, Florida overtook New York as the third most populous state in the country. Florida has continued to grow at a near nation-leading pace. The state’s population grew by 1.8% in 2016, far more than the 0.7% national population growth rate. Like many of the fastest-growing states, Florida’s rapid population growth was largely due to migration. About 9 in every 10 new Floridians either moved to the state from elsewhere in the United States or from another country — one of the largest such shares nationwide — while the rest of the state’s population increase was due to natural growth.
[in-text-ad]

3. Idaho
> 1-yr pop. growth rate: 1.83%
> Current population: 1.68 million
> 2015 population: 1.65 million
> 10-yr pop. growth rate: 14.60%
The population of Idaho increased by 1.8% in 2016, the third fastest pace of any state. Idaho has a relatively high birth rate, and natural growth — births minus deaths — accounted for about one-third of all new Idahoans in 2016. The remaining population growth was due to the large influx of residents from other parts of the country. A net total of 17,143 Americans relocated to Idaho in 2016, far more than in most states. The state’s population growth coincided with a substantial decline in unemployment. Idaho’s unemployment rate fell from 4.2% in 2015 to just 3.8% in 2016, today one of the lowest unemployment rates in the country.
[recirclink id=429326]

2. Nevada
> 1-yr pop. growth rate: 1.95%
> Current population: 2.94 million
> 2015 population: 2.88 million
> 10-yr pop. growth rate: 16.55%
The population of Nevada increased by 2.0% in 2016, the second fastest pace of any state. Nevada has sustained strong population growth over the past decade, growing by 16.5% from 2006 to 2016 — nearly twice the 8.3% national growth rate. Despite strong population growth, Nevada’s overall economic output declined over that time. The state’s arts, entertainment, and recreation and accommodation and food sectors — which comprise a larger share of Nevada’s GDP than in any other state — shrunk 13.0% from the second quarter of 2006 to the second quarter of 2016, more than in any other state nationwide. Nevada’s GDP contracted by 9.0% overall during that time, the largest decline in the country. Industries that benefit from population growth, however, such as educational services and health care, grew at a faster pace than in a majority of states.

1. Utah
> 1-yr pop. growth rate: 2.03%
> Current population: 3.05 million
> 2015 population: 2.99 million
> 10-yr pop. growth rate: 20.82%
The population of Utah grew by 2.0% in 2016, nearly three times the 0.7% national population growth rate and the fastest pace of any state. Unlike most fast-growing states, the majority of Utah’s population increase was due to natural growth. Utah has the largest average family size in the country, and there were 1,854 births per 100,000 people in Utah in 2016 — far more than the national rate of 1,286 births per 100,000 Americans. Utah also has the lowest death rate in the country. While Utah’s high birth-to-death ratio accounted for most of the state’s population growth, Utah’s population also grew more from inbound migration than many other states. The state’s population increased by 0.8% due to net migration in 2016, more than double the 0.3% national figure and the ninth highest rate of any state.
The Fastest Shrinking States

8. New York
> 1-yr pop. growth rate: -0.01%
> Current population: 19.75 million
> 2015 population: 19.75 million
> 10-yr pop. growth rate: 3.35%
New York is one of many Northeastern states whose populations are shrinking due to rapid outbound migration. While the state gained a net total of 118,478 new residents from other countries — more than any state other than Florida and California — roughly 191,000 more Americans moved out of New York to another state in 2016 than moved in. Like the rest of the country, births outnumber deaths in New York approximately 3-to-2, and the state had positive natural population growth in 2016. Overall, the population of New York declined by 1,900 residents in 2016 — one of eight states to shrink in size that year.
[in-text-ad]
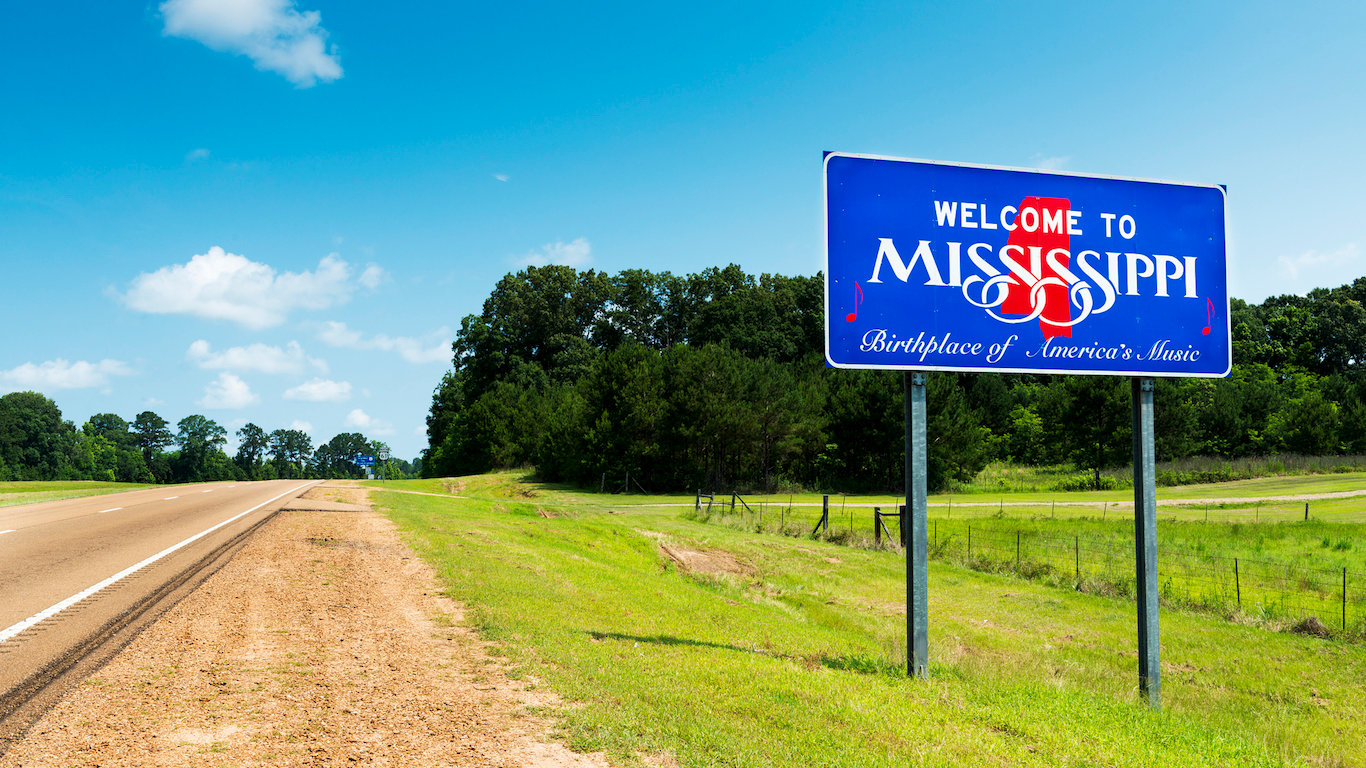
7. Mississippi
> 1-yr pop. growth rate: -0.02%
> Current population: 2.99 million
> 2015 population: 2.99 million
> 10-yr pop. growth rate: 2.88%
The population of Mississippi declined by approximately 660 residents in 2016 — one of eight states whose populations declined that year. Like most of those states, the population loss was largely the result of outbound migration to other states. Roughly 7,500 more Mississippi residents moved out of the state than moved in in 2016. While Mississippi had positive natural growth in 2016, the state’s death rate was relatively high, and the natural population growth was lower than across the country as a whole. Some 1,044 in every 100,000 Mississippi residents died in 2016, far more than the national rate of 888 deaths in every 100,000 Americans.
One push factor for many of those who left Mississippi was possibly the state’s low quality of life and depressed economy. Today, some 20.8% of state residents live in poverty, the largest share in the country. Additionally, 5.6% of the Mississippi workforce is unemployed, the seventh highest unemployment rate of any state.
[recirclink id=428335]

6. Pennsylvania
> 1-yr pop. growth rate: -0.06%
> Current population: 12.78 million
> 2015 population: 12.79 million
> 10-yr pop. growth rate: 2.19%
While the U.S. population grew by 0.7% in 2016, the population of Pennsylvania shrank by 0.1%. The change was largely due to the large number of Pennsylvanians who moved out of the state that year. Approximately 45,600 more Americans moved out of Pennsylvania to another part of the country than moved in — the largest domestic outflow of any state other than New Jersey, California, Illinois, and New York.
Pennsylvania’s population loss was also partially due to the state’s low birth-to-death ratio. There were 1,108 births and 1,047 deaths per 100,000 Pennsylvania residents in 2016, compared to the national rate of 1,286 births and 888 deaths per 100,000 Americans. Overall, Pennsylvania grew less from natural growth than any state other than New Hampshire, Maine, and West Virginia.
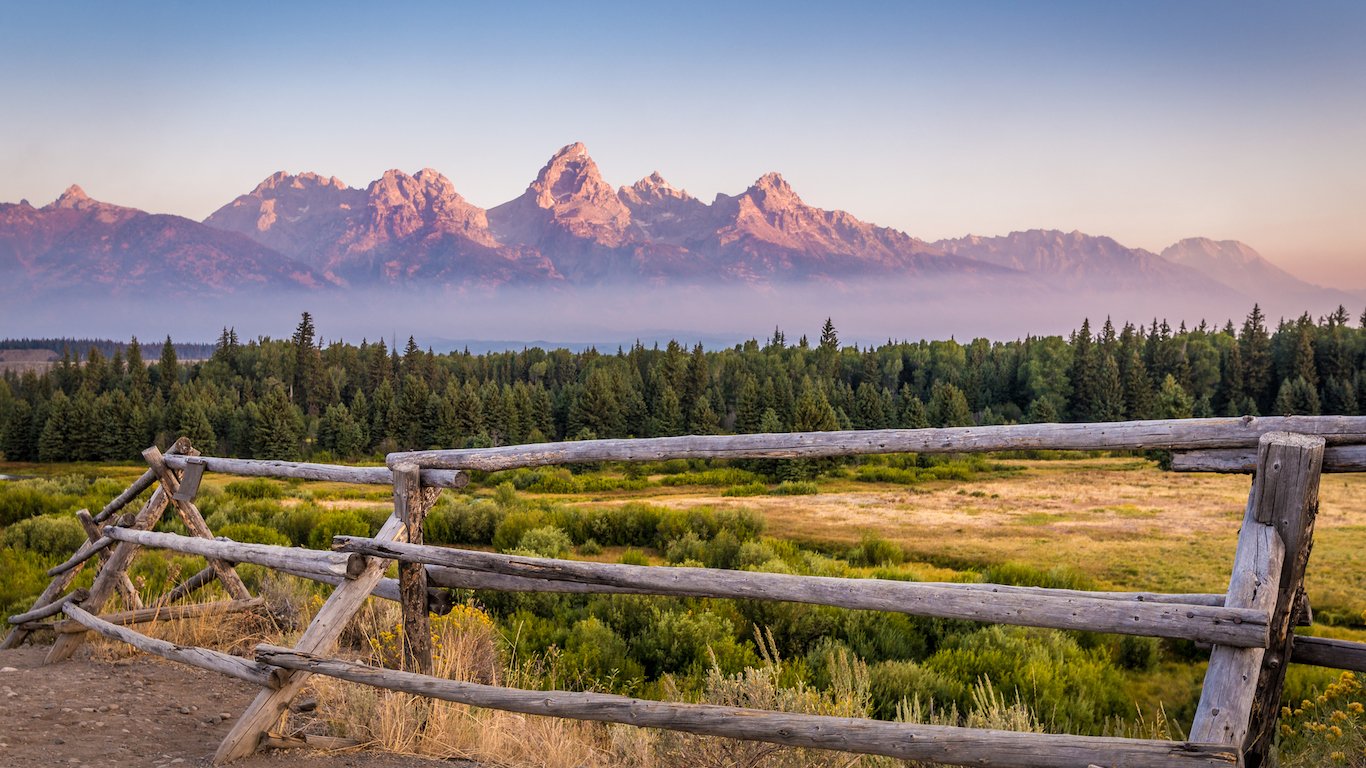
5. Wyoming
> 1-yr pop. growth rate: -0.18%
> Current population: 585,501
> 2015 population: 586,555
> 10-yr pop. growth rate: 12.02%
Wyoming was the only state to grow more from natural growth than the United States as whole in 2016 and still have population loss overall. There were 1,345 births and 857 deaths in the state in 2016 for every 100,000 residents, compared to the national rate of 1,286 births and 888 deaths per 100,000 Americans. Approximately 2,800 more new Wyomingites were born than died, which contributed more to Wyoming’s population growth than natural growth did in a majority of states.
Despite strong natural growth, heavy outbound migration led to negative population growth in Wyoming overall. Some 3,823 more residents moved out of Wyoming in 2016 than moved in, more than in any other state relative to population size.

4. Connecticut
> 1-yr pop. growth rate: -0.23%
> Current population: 3.58 million
> 2015 population: 3.58 million
> 10-yr pop. growth rate: 1.68%
The population of Connecticut shrank by 0.2% in 2016, the fourth largest decline of any state. Connecticut’s population has declined substantially in recent years, and the state has lost a net total of approximately 20,000 residents since 2013. Many of those leaving Connecticut are young, college-educated professionals. Since 2010, the median age in Connecticut has risen from 40.0 years to 40.9 years.
The population loss has likely hurt the state’s economic potential. While the U.S. GDP grew by 12.1% from the second quarter of 2006 to the second quarter of 2016, Connecticut’s GDP fell by 3.7%, the largest contraction of any state over that time other than Nevada.
[in-text-ad]

3. Vermont
> 1-yr pop. growth rate: -0.24%
> Current population: 624,594
> 2015 population: 626,088
> 10-yr pop. growth rate: 0.27%
The population of Vermont declined by 0.2% in 2016, the third largest contraction of any state. Like most Northeastern states with population loss, the population decline was largely due to outbound migration. Approximately 2,00 more residents moved out of Vermont in 2016 than moved in, nearly the largest loss of any state when adjusted for population size.
Population growth was also stymied by the state’s low birth rate. Vermont’s birth rate has been on a fairly steady decline over the past three decades, and in 2016, there were just 6,035 births in Vermont — nearly the fewest of any year since the 19th century.
[recirclink id=434206]

2. Illinois
> 1-yr pop. growth rate: -0.29%
> Current population: 12.80 million
> 2015 population: 12.84 million
> 10-yr pop. growth rate: 1.25%
While the population of Illinois has increased nearly every year in the past five decades, the state’s population declined in 2014, 2015 and 2016. The state’s population shrank by 0.3% in 2016, the second fastest pace of decline of any state. A large share of the population loss was due to residents leaving the Chicago-Naperville-Elgin metro area. In a survey conducted by the Chicago Tribune, residents who had moved out of the city in recent years cited high taxes, unemployment, poor weather, and violent crime as primary reasons for leaving Chicago. The population of Chicago decreased by 19,570 residents in 2016, more than half of the state’s overall population loss of 37,508 residents.
1. West Virginia
> 1-yr pop. growth rate: -0.54%
> Current population: 1.83 million
> 2015 population: 1.84 million
> 10-yr pop. growth rate: 0.17%
West Virginia was the only state to see both negative natural growth — births minus deaths — and net migration loss in 2016. West Virginia, which has one of the oldest populations of any state, has the highest death rate and one of the lowest birth rates in the country. Approximately 2,700 more West Virginians died than were born in 2016, accounting for one-fourth of the state’s total population loss.
A bulk of the population loss was due to people leaving the state. Some of the leading push factors causing people to migrate out of West Virginia were possibly high unemployment and poverty. While the state’s unemployment rate fell from 6.8% in 2015 to 6.0% in 2016, it remains one of the highest of any state. Some 17.9% of the state’s population lives in poverty, the fifth largest such share in the country.. In total, West Virginia’s population decreased by about 10,000 residents in 2016, the most of any state relative to population size.
Detailed Findings & Methodology
While natural growth accounted for 55% of the national population increase, domestic migration was the largest contributing factor to population growth in the fastest growing states. In seven of the eight states with the fastest population growth rates, at least half of all new residents relocated to the state from within the United States. In total, net migration accounted for 76% of all new residents among the eight fastest growing states in 2016.
International migration heavily contributed to population growth in a number of states. Fast-growing states that grew the most due to immigration from other countries include Florida, Washington, and Nevada.
Utah was the only the state that grew more than 1% in 2016 in which natural growth contributed more to population growth than net migration. Utah has both the highest birth rate and lowest death rate of any state. It also boasts the largest average family size in the country. Approximately 35,000 more Utahns were born in 2016 than died, the most of any state adjusted for population size.
New York and Florida are two states indicative of current domestic migration patterns. Many Americans are currently moving from the Northeast and Midwest to the South and West. In addition to traditional factors such as employment and education opportunities, Americans are increasingly considering weather and cost of living in their relocation decisions. As members of the baby boom generation reach retirement age, many choose to leave the expensive housing and cold weather of New York for the low cost of living and tropical climate of Florida. More people move from New York to Florida than any other state, and in 2014, Florida surpassed New York as the third most populous state.
To determine the fastest growing (and shrinking) states, 24/7 Wall St. reviewed the one-year population change of all 50 states from 2015 to 2016 with data from the U.S. Census Bureau. All population estimates are as of July 1 of each year. Data on births, deaths, population change due to natural growth, domestic migration, and international migration also came from the Census. Data on GDP and industry composition came from the Bureau of Economic Analysis and are for the second quarter of each year. Unemployment figures came from the Bureau of Labor Statistics and are annual averages for 2016. Data on educational attainment and poverty came from the American Community Survey of the U.S. Census Bureau and are for 2016.
Contact [email protected] for any questions or corrections.