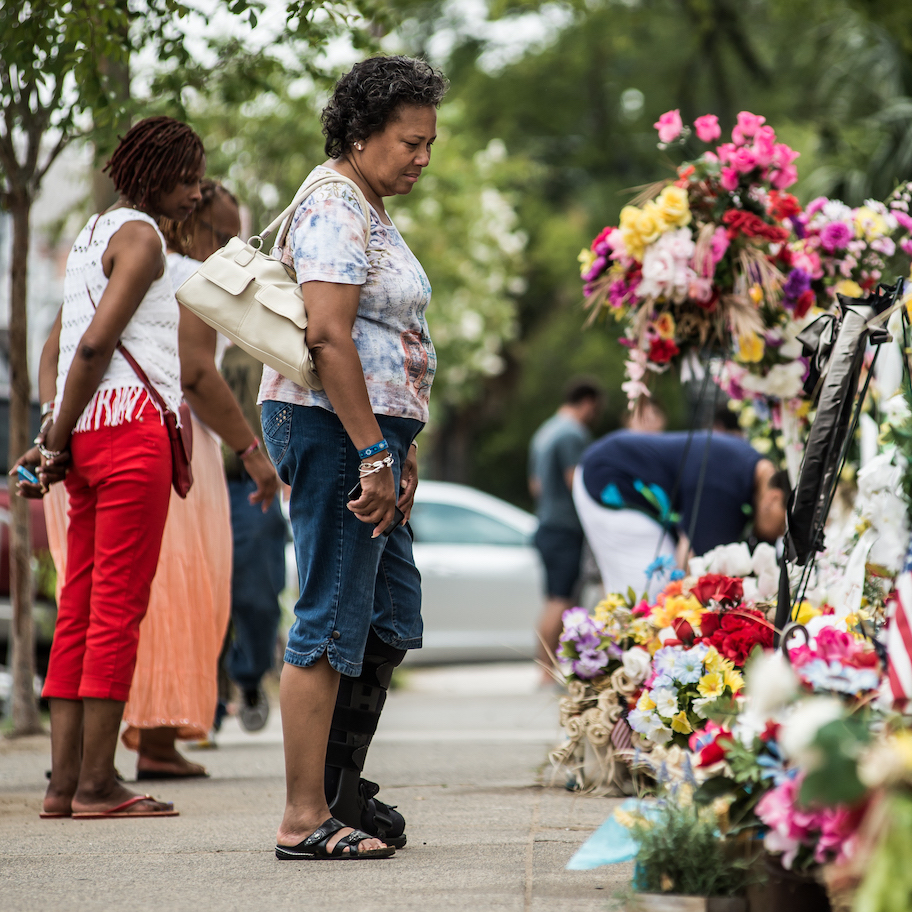

Hate crimes are a daily occurrence in the United States. But such crimes are for many reasons extremely difficult to verify, and grossly under-reported.
According to the FBI, hate crimes are those motivated by prejudice and committed against victims based on their race, color, religion, or national origin, as well as based on biases of actual or perceived sexual orientation, gender identity, disability, or gender.
The primary limitation in collecting accurate data on hate crimes is that police jurisdictions across the country are not required to report hate crimes. Further, because the content of the verbal exchanges between the perpetrator and the victim is almost always what qualifies a given altercation as a hate crime, the exact words that were exchanged need to be confirmed — obviously an extremely difficult endeavour.
In an interview with 24/7 Wall St., John Roman, criminologist and senior fellow at University of Chicago research institution NORC, noted that police departments often blame insufficient resources for not reporting hate crimes. He added, “[Hate crime reporting] also creates a level of accountability and not every agency is looking for that level of scrutiny.”
As a result of these limitations in reporting, the number of hate crimes on record is almost certainly a gross underestimation. Citing a national survey, Roman said that “about 10% of the time where there is some sort of violent incident the victim perceives it as having been a hate crime.” That would amount to well over 100,000 hate crimes annually, versus the just over 6,000 hate crimes reported nationwide in 2016.
To highlight where hate crime reporting practices are falling especially short, and to offer possible comparisons in hate crime levels between states, 24/7 Wall St. reviewed the latest FBI data. We calculated the share of each state’s population covered by law enforcement agencies participating in hate crime reporting, which ranges from no hate crime reporting at all in one state (Hawaii) and less than 20% in Mississippi to near total coverage in 16 states.
Click here to see the reported incidence of hate crimes in every state.
Click here to see our detailed findings and methodology.

1. Alabama
> Reported hate crimes: 1.4 per 100K covered pop.
> Population covered by police reporting hate crimes: 20.8%
> Reported hate crimes motivated by race: 12 (86%)
> Active hate groups: 4.7 per 1 million people (total: 23)
> Violent crime rate: 532.3 per 100,000 (7th highest)
[in-text-ad]

2. Alaska
> Reported hate crimes: 1.5 per 100K covered pop.
> Population covered by police reporting hate crimes: 99.6%
> Reported hate crimes motivated by race: 11 (100%)
> Active hate groups: 5.4 per 1 million people (total: 4)
> Violent crime rate: 804.2 per 100,000 (the highest)

3. Arizona
> Reported hate crimes: 3.3 per 100K covered pop.
> Population covered by police reporting hate crimes: 91.8%
> Reported hate crimes motivated by race: 110 (52%)
> Active hate groups: 3.2 per 1 million people (total: 22)
> Violent crime rate: 470.1 per 100,000 (12th highest)

4. Arkansas
> Reported hate crimes: 0.4 per 100K covered pop.
> Population covered by police reporting hate crimes: 95.5%
> Reported hate crimes motivated by race: 10 (83%)
> Active hate groups: 4.0 per 1 million people (total: 12)
> Violent crime rate: 550.9 per 100,000 (6th highest)
[in-text-ad-2]

5. California
> Reported hate crimes: 2.4 per 100K covered pop.
> Population covered by police reporting hate crimes: 100.0%
> Reported hate crimes motivated by race: 522 (56%)
> Active hate groups: 1.9 per 1 million people (total: 75)
> Violent crime rate: 445.3 per 100,000 (15th highest)
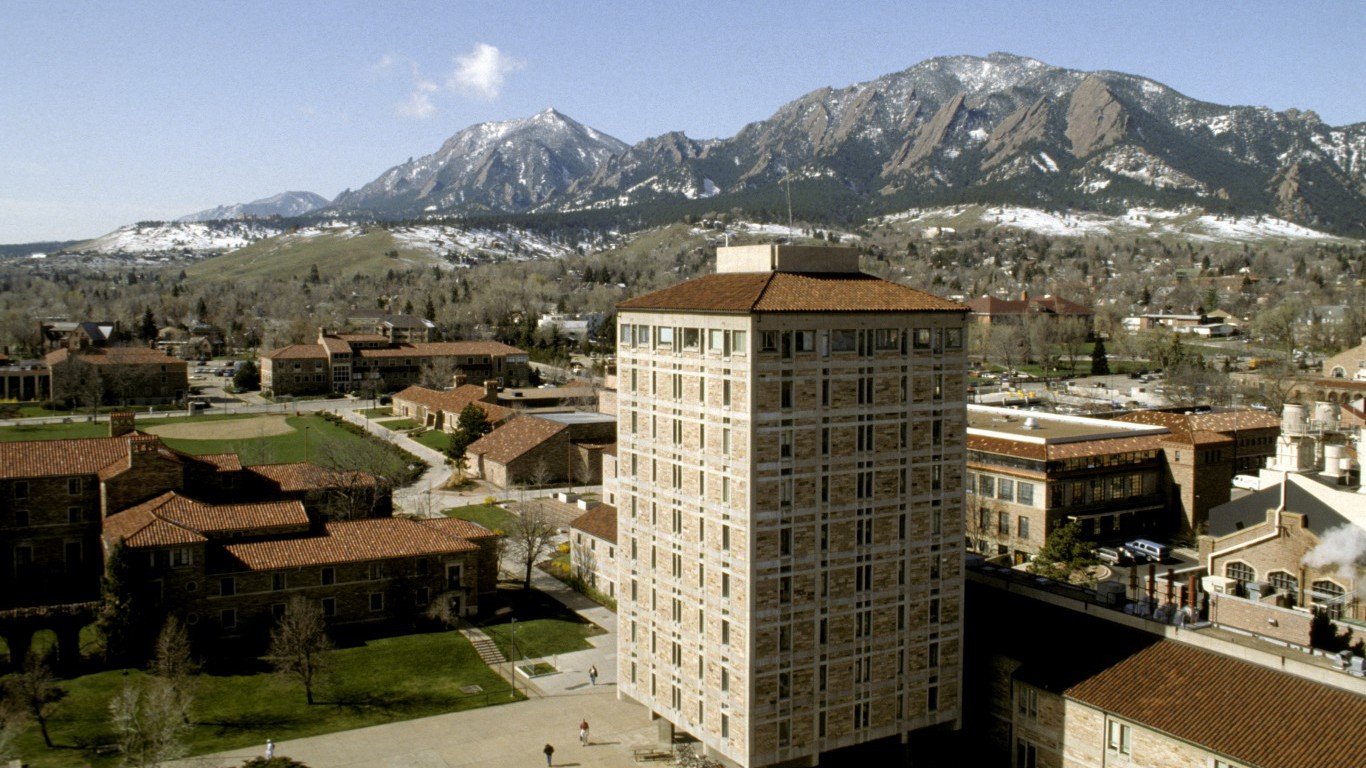
6. Colorado
> Reported hate crimes: 1.9 per 100K covered pop.
> Population covered by police reporting hate crimes: 99.6%
> Reported hate crimes motivated by race: 67 (64%)
> Active hate groups: 3.8 per 1 million people (total: 21)
> Violent crime rate: 342.6 per 100,000 (23rd lowest)
[in-text-ad]

7. Connecticut
> Reported hate crimes: 3.0 per 100K covered pop.
> Population covered by police reporting hate crimes: 100.0%
> Reported hate crimes motivated by race: 62 (58%)
> Active hate groups: 1.7 per 1 million people (total: 6)
> Violent crime rate: 227.1 per 100,000 (5th lowest)

8. Delaware
> Reported hate crimes: 1.6 per 100K covered pop.
> Population covered by police reporting hate crimes: 100.0%
> Reported hate crimes motivated by race: 11 (73%)
> Active hate groups: 2.1 per 1 million people (total: 2)
> Violent crime rate: 508.8 per 100,000 (9th highest)

9. Florida
> Reported hate crimes: 1.1 per 100K covered pop.
> Population covered by police reporting hate crimes: 43.6%
> Reported hate crimes motivated by race: 43 (45%)
> Active hate groups: 3.2 per 1 million people (total: 66)
> Violent crime rate: 430.3 per 100,000 (18th highest)
[in-text-ad-2]

10. Georgia
> Reported hate crimes: 0.5 per 100K covered pop.
> Population covered by police reporting hate crimes: 79.7%
> Reported hate crimes motivated by race: 25 (64%)
> Active hate groups: 3.9 per 1 million people (total: 40)
> Violent crime rate: 397.6 per 100,000 (21st highest)

11. Hawaii
> Reported hate crimes: 0.0 per 100K covered pop.
> Population covered by police reporting hate crimes: 0.0%
> Reported hate crimes motivated by race: N/A
> Active hate groups: 0.7 per 1 million people (total: 1)
> Violent crime rate: 309.2 per 100,000 (21st lowest)
[in-text-ad]

12. Idaho
> Reported hate crimes: 1.6 per 100K covered pop.
> Population covered by police reporting hate crimes: 100.0%
> Reported hate crimes motivated by race: 16 (59%)
> Active hate groups: 7.1 per 1 million people (total: 12)
> Violent crime rate: 230.3 per 100,000 (6th lowest)

13. Illinois
> Reported hate crimes: 0.9 per 100K covered pop.
> Population covered by police reporting hate crimes: 96.7%
> Reported hate crimes motivated by race: 73 (66%)
> Active hate groups: 2.7 per 1 million people (total: 35)
> Violent crime rate: 436.3 per 100,000 (16th highest)

14. Indiana
> Reported hate crimes: 2.7 per 100K covered pop.
> Population covered by police reporting hate crimes: 43.3%
> Reported hate crimes motivated by race: 52 (67%)
> Active hate groups: 4.5 per 1 million people (total: 30)
> Violent crime rate: 404.7 per 100,000 (20th highest)
[in-text-ad-2]

15. Iowa
> Reported hate crimes: 0.5 per 100K covered pop.
> Population covered by police reporting hate crimes: 99.3%
> Reported hate crimes motivated by race: 13 (76%)
> Active hate groups: 1.3 per 1 million people (total: 4)
> Violent crime rate: 290.6 per 100,000 (16th lowest)

16. Kansas
> Reported hate crimes: 1.9 per 100K covered pop.
> Population covered by police reporting hate crimes: 89.1%
> Reported hate crimes motivated by race: 36 (73%)
> Active hate groups: 1.4 per 1 million people (total: 4)
> Violent crime rate: 380.4 per 100,000 (22nd highest)
[in-text-ad]

17. Kentucky
> Reported hate crimes: 4.7 per 100K covered pop.
> Population covered by police reporting hate crimes: 99.8%
> Reported hate crimes motivated by race: 135 (66%)
> Active hate groups: 2.5 per 1 million people (total: 11)
> Violent crime rate: 232.3 per 100,000 (7th lowest)

18. Louisiana
> Reported hate crimes: 0.7 per 100K covered pop.
> Population covered by police reporting hate crimes: 76.1%
> Reported hate crimes motivated by race: 20 (77%)
> Active hate groups: 2.8 per 1 million people (total: 13)
> Violent crime rate: 566.1 per 100,000 (5th highest)

19. Maine
> Reported hate crimes: 3.0 per 100K covered pop.
> Population covered by police reporting hate crimes: 100.0%
> Reported hate crimes motivated by race: 21 (53%)
> Active hate groups: 2.3 per 1 million people (total: 3)
> Violent crime rate: 123.8 per 100,000 (the lowest)
[in-text-ad-2]

20. Maryland
> Reported hate crimes: 0.6 per 100K covered pop.
> Population covered by police reporting hate crimes: 100.0%
> Reported hate crimes motivated by race: 24 (65%)
> Active hate groups: 3.2 per 1 million people (total: 19)
> Violent crime rate: 472.0 per 100,000 (11th highest)

21. Massachusetts
> Reported hate crimes: 5.9 per 100K covered pop.
> Population covered by police reporting hate crimes: 97.4%
> Reported hate crimes motivated by race: 212 (54%)
> Active hate groups: 1.5 per 1 million people (total: 10)
> Violent crime rate: 376.9 per 100,000 (23rd highest)
[in-text-ad]

22. Michigan
> Reported hate crimes: 4.1 per 100K covered pop.
> Population covered by police reporting hate crimes: 99.2%
> Reported hate crimes motivated by race: 282 (71%)
> Active hate groups: 2.9 per 1 million people (total: 29)
> Violent crime rate: 459.0 per 100,000 (13th highest)

23. Minnesota
> Reported hate crimes: 2.3 per 100K covered pop.
> Population covered by police reporting hate crimes: 93.8%
> Reported hate crimes motivated by race: 77 (65%)
> Active hate groups: 2.2 per 1 million people (total: 12)
> Violent crime rate: 242.6 per 100,000 (9th lowest)

24. Mississippi
> Reported hate crimes: 1.2 per 100K covered pop.
> Population covered by police reporting hate crimes: 19.6%
> Reported hate crimes motivated by race: 4 (57%)
> Active hate groups: 5.0 per 1 million people (total: 15)
> Violent crime rate: 280.5 per 100,000 (15th lowest)
[in-text-ad-2]

25. Missouri
> Reported hate crimes: 1.4 per 100K covered pop.
> Population covered by police reporting hate crimes: 99.9%
> Reported hate crimes motivated by race: 65 (74%)
> Active hate groups: 3.0 per 1 million people (total: 18)
> Violent crime rate: 519.4 per 100,000 (8th highest)

26. Montana
> Reported hate crimes: 1.9 per 100K covered pop.
> Population covered by police reporting hate crimes: 100.0%
> Reported hate crimes motivated by race: 10 (50%)
> Active hate groups: 7.7 per 1 million people (total: 8)
> Violent crime rate: 368.3 per 100,000 (25th lowest)
[in-text-ad]

27. Nebraska
> Reported hate crimes: 1.7 per 100K covered pop.
> Population covered by police reporting hate crimes: 96.8%
> Reported hate crimes motivated by race: 23 (74%)
> Active hate groups: 4.7 per 1 million people (total: 9)
> Violent crime rate: 291.0 per 100,000 (17th lowest)

28. Nevada
> Reported hate crimes: 1.4 per 100K covered pop.
> Population covered by police reporting hate crimes: 100.0%
> Reported hate crimes motivated by race: 31 (76%)
> Active hate groups: 3.1 per 1 million people (total: 9)
> Violent crime rate: 678.1 per 100,000 (3rd highest)

29. New Hampshire
> Reported hate crimes: 2.2 per 100K covered pop.
> Population covered by police reporting hate crimes: 95.5%
> Reported hate crimes motivated by race: 15 (54%)
> Active hate groups: 6.7 per 1 million people (total: 9)
> Violent crime rate: 197.6 per 100,000 (3rd lowest)
[in-text-ad-2]
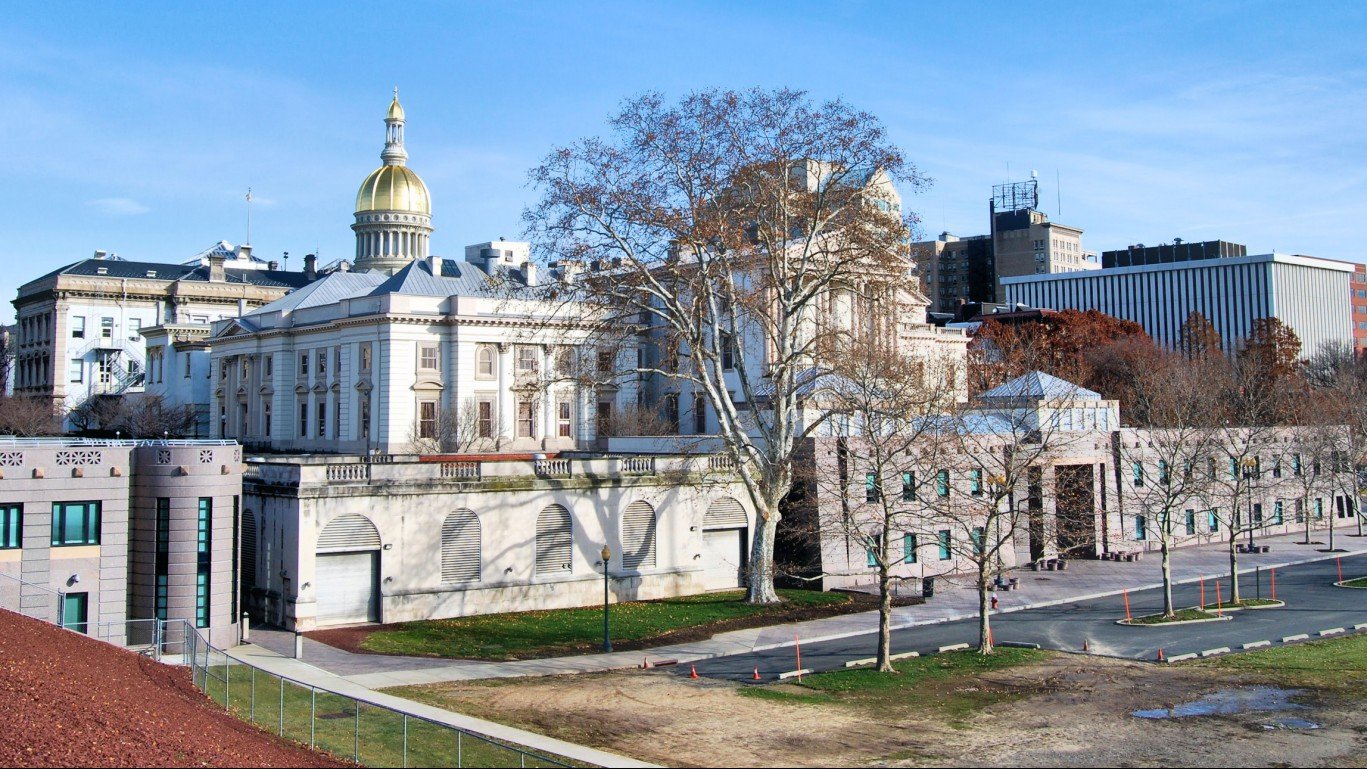
30. New Jersey
> Reported hate crimes: 3.2 per 100K covered pop.
> Population covered by police reporting hate crimes: 100.0%
> Reported hate crimes motivated by race: 137 (49%)
> Active hate groups: 1.9 per 1 million people (total: 17)
> Violent crime rate: 245.0 per 100,000 (12th lowest)

31. New Mexico
> Reported hate crimes: 4.5 per 100K covered pop.
> Population covered by police reporting hate crimes: 27.7%
> Reported hate crimes motivated by race: 8 (31%)
> Active hate groups: 0.5 per 1 million people (total: 1)
> Violent crime rate: 702.5 per 100,000 (2nd highest)
[in-text-ad]

32. New York
> Reported hate crimes: 3.0 per 100K covered pop.
> Population covered by police reporting hate crimes: 100.0%
> Reported hate crimes motivated by race: 155 (26%)
> Active hate groups: 2.4 per 1 million people (total: 48)
> Violent crime rate: 376.2 per 100,000 (24th highest)

33. North Carolina
> Reported hate crimes: 1.5 per 100K covered pop.
> Population covered by police reporting hate crimes: 100.0%
> Reported hate crimes motivated by race: 99 (67%)
> Active hate groups: 3.2 per 1 million people (total: 32)
> Violent crime rate: 372.2 per 100,000 (25th highest)

34. North Dakota
> Reported hate crimes: 1.1 per 100K covered pop.
> Population covered by police reporting hate crimes: 99.9%
> Reported hate crimes motivated by race: 7 (88%)
> Active hate groups: 2.6 per 1 million people (total: 2)
> Violent crime rate: 251.1 per 100,000 (13th lowest)
[in-text-ad-2]

35. Ohio
> Reported hate crimes: 4.6 per 100K covered pop.
> Population covered by police reporting hate crimes: 82.4%
> Reported hate crimes motivated by race: 336 (76%)
> Active hate groups: 2.7 per 1 million people (total: 31)
> Violent crime rate: 300.3 per 100,000 (18th lowest)

36. Oklahoma
> Reported hate crimes: 0.9 per 100K covered pop.
> Population covered by police reporting hate crimes: 98.6%
> Reported hate crimes motivated by race: 20 (61%)
> Active hate groups: 2.5 per 1 million people (total: 10)
> Violent crime rate: 449.8 per 100,000 (14th highest)
[in-text-ad]

37. Oregon
> Reported hate crimes: 2.9 per 100K covered pop.
> Population covered by police reporting hate crimes: 86.7%
> Reported hate crimes motivated by race: 61 (59%)
> Active hate groups: 4.4 per 1 million people (total: 18)
> Violent crime rate: 264.6 per 100,000 (14th lowest)

38. Pennsylvania
> Reported hate crimes: 0.5 per 100K covered pop.
> Population covered by police reporting hate crimes: 98.9%
> Reported hate crimes motivated by race: 40 (66%)
> Active hate groups: 2.8 per 1 million people (total: 36)
> Violent crime rate: 316.4 per 100,000 (22nd lowest)

39. Rhode Island
> Reported hate crimes: 1.1 per 100K covered pop.
> Population covered by police reporting hate crimes: 100.0%
> Reported hate crimes motivated by race: 2 (17%)
> Active hate groups: 2.8 per 1 million people (total: 3)
> Violent crime rate: 238.9 per 100,000 (8th lowest)
[in-text-ad-2]

40. South Carolina
> Reported hate crimes: 0.5 per 100K covered pop.
> Population covered by police reporting hate crimes: 99.5%
> Reported hate crimes motivated by race: 18 (78%)
> Active hate groups: 2.8 per 1 million people (total: 14)
> Violent crime rate: 501.8 per 100,000 (10th highest)

41. South Dakota
> Reported hate crimes: 2.3 per 100K covered pop.
> Population covered by police reporting hate crimes: 91.0%
> Reported hate crimes motivated by race: 6 (33%)
> Active hate groups: 8.1 per 1 million people (total: 7)
> Violent crime rate: 418.4 per 100,000 (19th highest)
[in-text-ad]

42. Tennessee
> Reported hate crimes: 2.1 per 100K covered pop.
> Population covered by police reporting hate crimes: 100.0%
> Reported hate crimes motivated by race: 93 (65%)
> Active hate groups: 5.6 per 1 million people (total: 37)
> Violent crime rate: 632.9 per 100,000 (4th highest)

43. Texas
> Reported hate crimes: 0.6 per 100K covered pop.
> Population covered by police reporting hate crimes: 100.0%
> Reported hate crimes motivated by race: 104 (58%)
> Active hate groups: 2.4 per 1 million people (total: 66)
> Violent crime rate: 434.4 per 100,000 (17th highest)

44. Utah
> Reported hate crimes: 2.2 per 100K covered pop.
> Population covered by police reporting hate crimes: 98.8%
> Reported hate crimes motivated by race: 47 (71%)
> Active hate groups: 1.0 per 1 million people (total: 3)
> Violent crime rate: 242.8 per 100,000 (10th lowest)
[in-text-ad-2]

45. Vermont
> Reported hate crimes: 4.0 per 100K covered pop.
> Population covered by police reporting hate crimes: 100.0%
> Reported hate crimes motivated by race: 16 (64%)
> Active hate groups: 3.2 per 1 million people (total: 2)
> Violent crime rate: 158.3 per 100,000 (2nd lowest)

46. Virginia
> Reported hate crimes: 1.5 per 100K covered pop.
> Population covered by police reporting hate crimes: 100.0%
> Reported hate crimes motivated by race: 76 (62%)
> Active hate groups: 4.4 per 1 million people (total: 37)
> Violent crime rate: 217.6 per 100,000 (4th lowest)
[in-text-ad]

47. Washington
> Reported hate crimes: 5.3 per 100K covered pop.
> Population covered by police reporting hate crimes: 99.9%
> Reported hate crimes motivated by race: 239 (62%)
> Active hate groups: 3.6 per 1 million people (total: 26)
> Violent crime rate: 302.2 per 100,000 (19th lowest)
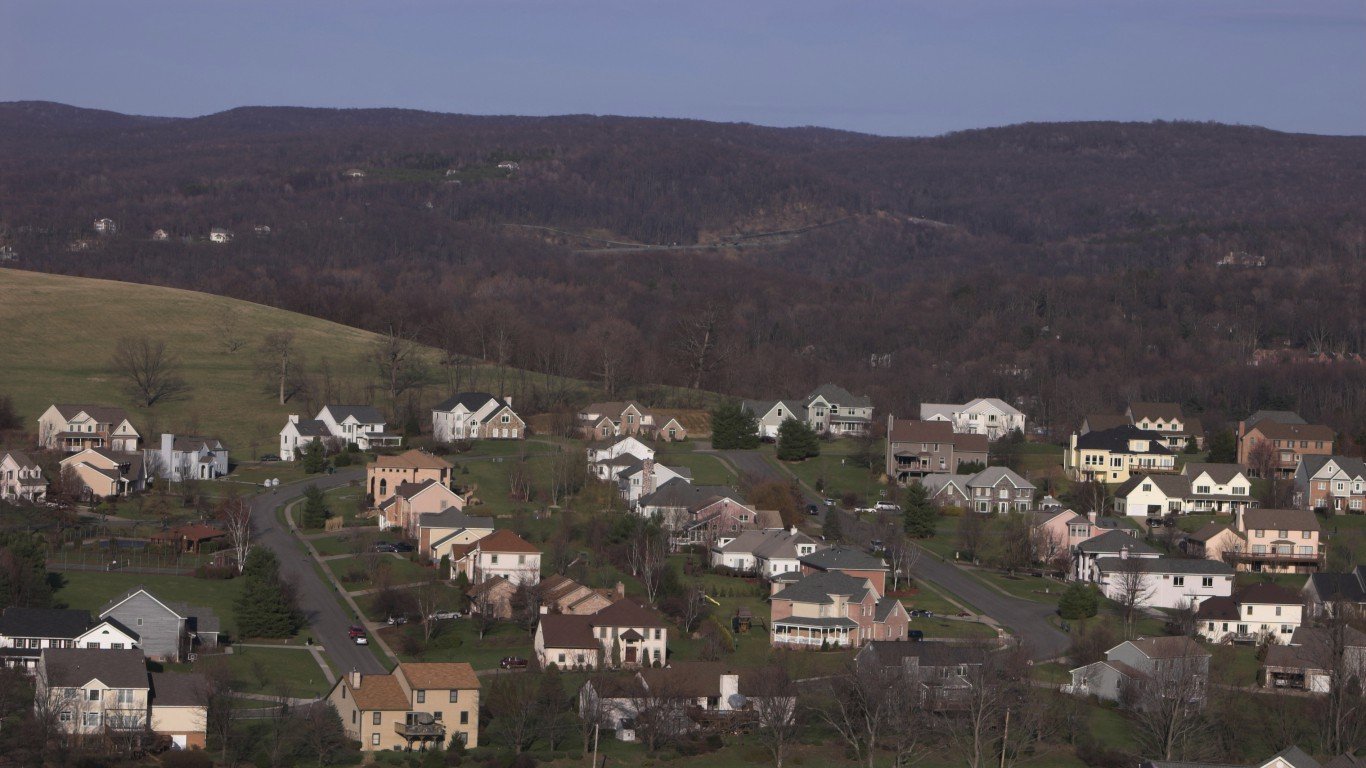
48. West Virginia
> Reported hate crimes: 2.5 per 100K covered pop.
> Population covered by police reporting hate crimes: 88.5%
> Reported hate crimes motivated by race: 30 (73%)
> Active hate groups: 2.2 per 1 million people (total: 4)
> Violent crime rate: 358.1 per 100,000 (24th lowest)

49. Wisconsin
> Reported hate crimes: 0.6 per 100K covered pop.
> Population covered by police reporting hate crimes: 97.8%
> Reported hate crimes motivated by race: 22 (65%)
> Active hate groups: 1.9 per 1 million people (total: 11)
> Violent crime rate: 305.9 per 100,000 (20th lowest)
[in-text-ad-2]

50. Wyoming
> Reported hate crimes: 0.5 per 100K covered pop.
> Population covered by police reporting hate crimes: 95.0%
> Reported hate crimes motivated by race: 3 (100%)
> Active hate groups: 1.7 per 1 million people (total: 1)
> Violent crime rate: 244.2 per 100,000 (11th lowest)
Detailed Findings & Methodology
Also included are the numbers of hate crimes motivated by race, ethnicity, or ancestry — by far the most common type of hate crime. Nationwide, 57% of all reported hate crimes are motivated by race. Victims of hate crimes tend to be older, and the most likely demographic group to report hate crimes are Hispanic Americans.
The likelihood of hate crimes, as well as the probability that a particular group of people will be targeted, can track with the prevailing political climate as perceived through the narrative delivered by the media.
When public figures “take a position that you already believe in, it gives you a greater freedom to act on those beliefs,” Roman said, explaining that this is broadly true of all sorts of behaviors. In the context of hate crimes, “[I]f you see the police engaging in aggressive stops of people they perceive to be here illegally, and you feel biased toward that group, you then have greater reign to act on that belief.”
To determine the reported incidence of hate crimes in every state, 24/7 Wall St. reviewed reported hate crimes from the FBI’s 2016 Hate Crime Statistics report. Motivation for hate crime — race, religion, sexual orientation, etc. — also came from the report. The violent crime rate — the number of incidents reported per 100,000 people — came from the FBI’s 2016 Uniform Crime Report. The number of active hate groups in each state was provided by non-profit civil rights advocacy group Southern Poverty Law Center. Because no data is available for Hawaii, the state was omitted from our list.
Take This Retirement Quiz To Get Matched With An Advisor Now (Sponsored)
Are you ready for retirement? Planning for retirement can be overwhelming, that’s why it could be a good idea to speak to a fiduciary financial advisor about your goals today.
Start by taking this retirement quiz right here from SmartAsset that will match you with up to 3 financial advisors that serve your area and beyond in 5 minutes. Smart Asset is now matching over 50,000 people a month.
Click here now to get started.
Thank you for reading! Have some feedback for us?
Contact the 24/7 Wall St. editorial team.
 24/7 Wall St.
 24/7 Wall St.
 24/7 Wall St.
