
[cnxvideo id=”508516″ placement=”ros”]Though a single geographic and political entity, the United States is also a patchwork of varying state and local laws, spread across the third largest landmass of any country in the world. Indeed, Americans have options when deciding where to live. Variables such as topography, climate, tax code, and cost of living — in addition to proximity to family and friends — can all play a role.
The factors that make one part of the country preferable to another as a place to live and raise a family vary from one person to the next. However, some U.S. cities are demonstrably more attractive to new residents than others.
The U.S. population grew from 309.3 million in 2010 to 325.7 million in 2017, a 5.3% increase. In some U.S. metro areas, the population grew at triple the nationwide rate over the same period. Meanwhile, in other metro areas, the population actually declined — by several percentage points in some cases.
Population change is the product of two factors — net migration and natural growth. Natural growth is simply the number of births over a given period less the number of deaths. Net migration is the difference between the number of new residents — either from other parts of the country or from abroad — and the number of residents who have left the area.
24/7 Wall St. reviewed the percentage change in population between 2010 and 2017 in 382 U.S. metro areas to identify the fastest growing, and shrinking, American cities. Over that period, some cities lost over 5% of their population, while others expanded by well over 20%.
Click here to see the fastest growing cities.
Click here to see the fastest shrinking cities.
Click here to see our detailed findings and methodology.
The Fastest Growing Cities

25. Odessa, TX
> 2010-2017 population change: +14.6% (from 137,079 to 157,087)
> 2010-2017 pop. change due to migration: +7,828
> Largest 12 month change: +5,269 (2014-2015)
> Median household income: $53,254
[in-text-ad]

24. Bismarck, ND
> 2010-2017 population change: +14.7% (from 115,253 to 132,142)
> 2010-2017 pop. change due to migration: +11,244
> Largest 12 month change: +3,652 (2012-2013)
> Median household income: $65,527
[recirclink id=444492]

23. Hilton Head Island-Bluffton-Beaufort, SC
> 2010-2017 population change: +14.7% (from 187,776 to 215,302)
> 2010-2017 pop. change due to migration: +22,932
> Largest 12 month change: +5,506 (2014-2015)
> Median household income: $63,756

22. Dallas-Fort Worth-Arlington, TX
> 2010-2017 population change: +14.7% (from 6,451,833 to 7,399,662)
> 2010-2017 pop. change due to migration: +555,586
> Largest 12 month change: +152,393 (2015-2016)
> Median household income: $63,812
[in-text-ad-2]

21. Auburn-Opelika, AL
> 2010-2017 population change: +14.8% (from 140,806 to 161,604)
> 2010-2017 pop. change due to migration: +15,188
> Largest 12 month change: +4,201 (2011-2012)
> Median household income: $48,056

20. Boise City, ID
> 2010-2017 population change: +14.9% (from 617,980 to 709,845)
> 2010-2017 pop. change due to migration: +62,059
> Largest 12 month change: +19,035 (2016-2017)
> Median household income: $55,162
[in-text-ad]

19. San Antonio-New Braunfels, TX
> 2010-2017 population change: +14.9% (from 2,152,961 to 2,473,974)
> 2010-2017 pop. change due to migration: +210,637
> Largest 12 month change: +50,635 (2014-2015)
> Median household income: $56,105
[recirclink id=444468]

18. Crestview-Fort Walton Beach-Destin, FL
> 2010-2017 population change: +15.0% (from 235,927 to 271,346)
> 2010-2017 pop. change due to migration: +26,348
> Largest 12 month change: +8,304 (2011-2012)
> Median household income: $58,624

17. Fargo, ND-MN
> 2010-2017 population change: +15.3% (from 209,350 to 241,356)
> 2010-2017 pop. change due to migration: +18,997
> Largest 12 month change: +6,505 (2012-2013)
> Median household income: $60,009
[in-text-ad-2]

16. Fayetteville-Springdale-Rogers, AR-MO
> 2010-2017 population change: +15.5% (from 465,290 to 537,463)
> 2010-2017 pop. change due to migration: +47,115
> Largest 12 month change: +12,287 (2016-2017)
> Median household income: $51,848

15. Naples-Immokalee-Marco Island, FL
> 2010-2017 population change: +15.6% (from 322,601 to 372,880)
> 2010-2017 pop. change due to migration: +50,154
> Largest 12 month change: +8,978 (2014-2015)
> Median household income: $61,228
[in-text-ad]

14. Houston-The Woodlands-Sugar Land, TX
> 2010-2017 population change: +15.9% (from 5,947,419 to 6,892,427)
> 2010-2017 pop. change due to migration: +533,390
> Largest 12 month change: +167,325 (2014-2015)
> Median household income: $61,708
[recirclink id=444391]

13. Daphne-Fairhope-Foley, AL
> 2010-2017 population change: +16.1% (from 183,110 to 212,628)
> 2010-2017 pop. change due to migration: +28,263
> Largest 12 month change: +5,119 (2016-2017)
> Median household income: $56,732

12. Charleston-North Charleston, SC
> 2010-2017 population change: +16.2% (from 667,466 to 775,831)
> 2010-2017 pop. change due to migration: +81,055
> Largest 12 month change: +18,291 (2014-2015)
> Median household income: $57,659
[in-text-ad-2]

11. Provo-Orem, UT
> 2010-2017 population change: +16.5% (from 530,238 to 617,675)
> 2010-2017 pop. change due to migration: +18,739
> Largest 12 month change: +17,895 (2015-2016)
> Median household income: $69,288

10. Orlando-Kissimmee-Sanford, FL
> 2010-2017 population change: +17.3% (from 2,139,317 to 2,509,831)
> 2010-2017 pop. change due to migration: +291,358
> Largest 12 month change: +63,099 (2014-2015)
> Median household income: $52,385
[in-text-ad]

9. Raleigh, NC
> 2010-2017 population change: +17.4% (from 1,137,393 to 1,335,079)
> 2010-2017 pop. change due to migration: +139,611
> Largest 12 month change: +32,021 (2015-2016)
> Median household income: $71,685
[recirclink id=444326]

8. Bend-Redmond, OR
> 2010-2017 population change: +18.5% (from 157,740 to 186,875)
> 2010-2017 pop. change due to migration: +26,052
> Largest 12 month change: +6,387 (2015-2016)
> Median household income: $61,870

7. Cape Coral-Fort Myers, FL
> 2010-2017 population change: +19.1% (from 620,467 to 739,224)
> 2010-2017 pop. change due to migration: +119,306
> Largest 12 month change: +22,180 (2014-2015)
> Median household income: $52,909
[in-text-ad-2]

6. St. George, UT
> 2010-2017 population change: +19.7% (from 138,393 to 165,662)
> 2010-2017 pop. change due to migration: +19,813
> Largest 12 month change: +6,425 (2016-2017)
> Median household income: $55,056

5. Greeley, CO
> 2010-2017 population change: +19.8% (from 254,182 to 304,633)
> 2010-2017 pop. change due to migration: +33,972
> Largest 12 month change: +10,390 (2016-2017)
> Median household income: $63,400
[in-text-ad]

4. Midland, TX
> 2010-2017 population change: +20.4% (from 141,788 to 170,675)
> 2010-2017 pop. change due to migration: +16,322
> Largest 12 month change: +7,190 (2011-2012)
> Median household income: $65,224
[recirclink id=444046]

3. Austin-Round Rock, TX
> 2010-2017 population change: +22.5% (from 1,727,495 to 2,115,827)
> 2010-2017 pop. change due to migration: +273,662
> Largest 12 month change: +59,774 (2015-2016)
> Median household income: $71,000

2. Myrtle Beach-Conway-North Myrtle Beach, SC-NC
> 2010-2017 population change: +22.6% (from 378,506 to 464,165)
> 2010-2017 pop. change due to migration: +87,194
> Largest 12 month change: +16,372 (2016-2017)
> Median household income: $46,787
[in-text-ad-2]
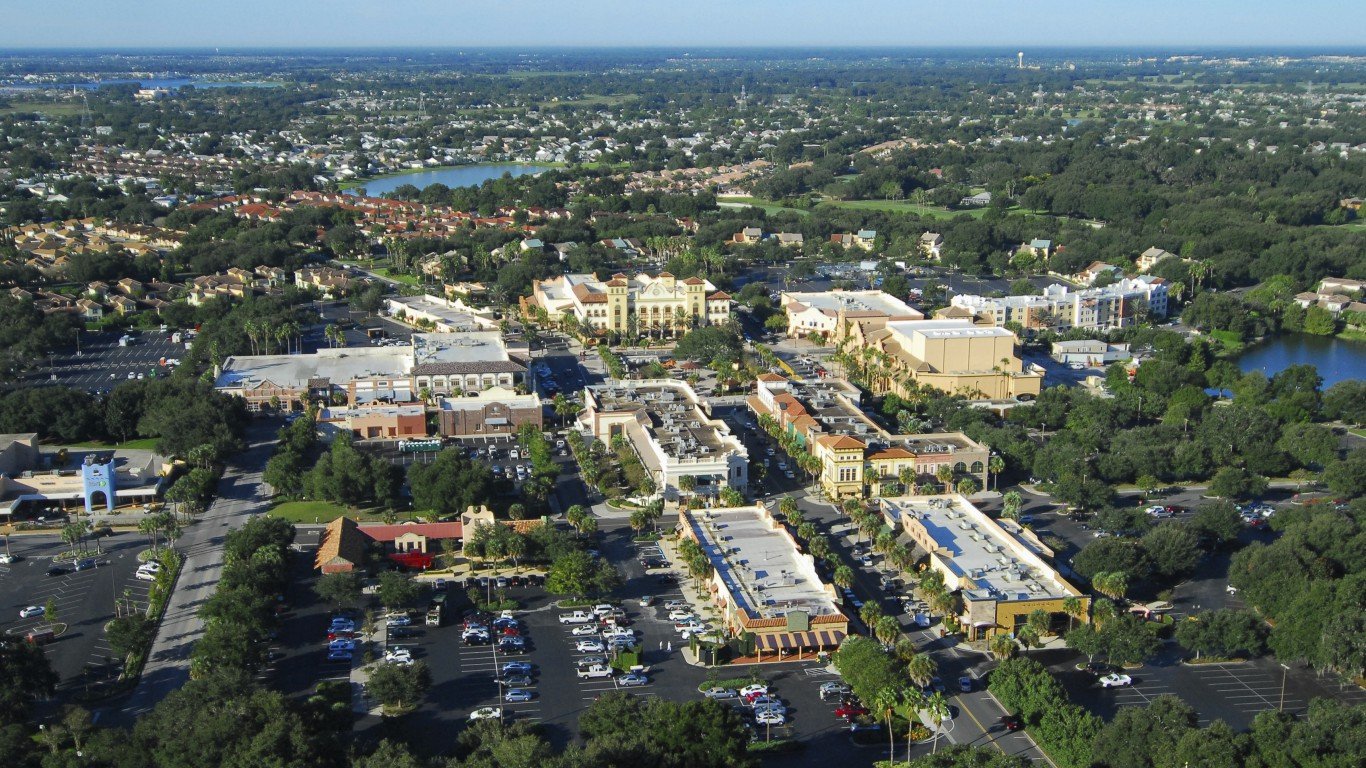
1. The Villages, FL
> 2010-2017 population change: +32.8% (from 94,279 to 125,165)
> 2010-2017 pop. change due to migration: +38,549
> Largest 12 month change: +5,392 (2013-2014)
> Median household income: $54,562
The Fastest Shrinking Cities

25. Lima, OH
> 2010-2017 population change: -3.0% (from 106,366 to 103,198)
> 2010-2017 pop. change due to migration: -4,504
> Largest 12 month change: -750 (2014-2015)
> Median household income: $47,592
[in-text-ad]

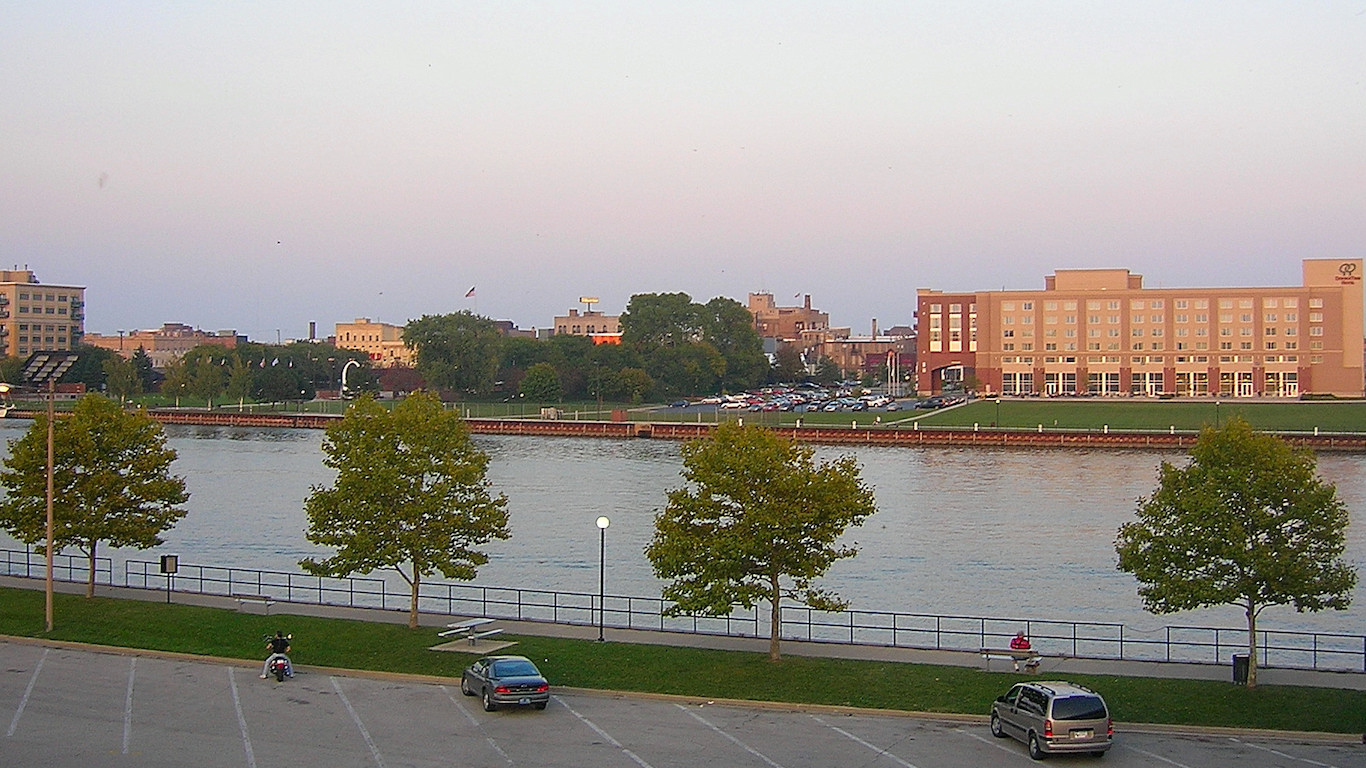
24. Rockford, IL
> 2010-2017 population change: -3.1% (from 349,194 to 338,291)
> 2010-2017 pop. change due to migration: -18,789
> Largest 12 month change: -2,259 (2013-2014)
> Median household income: $50,324
[recirclink id=443940]

23. Anniston-Oxford-Jacksonville, AL
> 2010-2017 population change: -3.2% (from 118,466 to 114,728)
> 2010-2017 pop. change due to migration: -3,450
> Largest 12 month change: -737 (2012-2013)
> Median household income: $41,687
22. Bay City, MI
> 2010-2017 population change: -3.2% (from 107,676 to 104,239)
> 2010-2017 pop. change due to migration: -2,644
> Largest 12 month change: -781 (2014-2015)
> Median household income: $44,756
[in-text-ad-2]

21. Lawton, OK
> 2010-2017 population change: -3.2% (from 131,579 to 127,349)
> 2010-2017 pop. change due to migration: -9,641
> Largest 12 month change: -2,169 (2015-2016)
> Median household income: $50,980

20. Kankakee, IL
> 2010-2017 population change: -3.4% (from 113,418 to 109,605)
> 2010-2017 pop. change due to migration: -5,721
> Largest 12 month change: -823 (2013-2014)
> Median household income: $54,911
[in-text-ad]

19. Binghamton, NY
> 2010-2017 population change: -3.7% (from 251,519 to 242,217)
> 2010-2017 pop. change due to migration: -9,470
> Largest 12 month change: -2,007 (2015-2016)
> Median household income: $51,360
[recirclink id=443564]

18. Rocky Mount, NC
> 2010-2017 population change: -3.7% (from 152,407 to 146,738)
> 2010-2017 pop. change due to migration: -6,338
> Largest 12 month change: -1,448 (2014-2015)
> Median household income: $38,972

17. Ocean City, NJ
> 2010-2017 population change: -3.8% (from 97,222 to 93,553)
> 2010-2017 pop. change due to migration: -781
> Largest 12 month change: -725 (2014-2015)
> Median household income: $62,548
[in-text-ad-2]

16. Pittsfield, MA
> 2010-2017 population change: -3.8% (from 131,294 to 126,313)
> 2010-2017 pop. change due to migration: -2,325
> Largest 12 month change: -1,017 (2014-2015)
> Median household income: $58,418

15. Elmira, NY
> 2010-2017 population change: -3.9% (from 88,985 to 85,557)
> 2010-2017 pop. change due to migration: -3,627
> Largest 12 month change: -990 (2015-2016)
> Median household income: $51,269
[in-text-ad]

14. Albany, GA
> 2010-2017 population change: -3.9% (from 157,596 to 151,434)
> 2010-2017 pop. change due to migration: -10,964
> Largest 12 month change: -1,607 (2014-2015)
> Median household income: $40,667
[recirclink id=443882]

13. Saginaw, MI
> 2010-2017 population change: -4.0% (from 199,851 to 191,934)
> 2010-2017 pop. change due to migration: -9,783
> Largest 12 month change: -1,958 (2014-2015)
> Median household income: $45,849

12. Youngstown-Warren-Boardman, OH-PA
> 2010-2017 population change: -4.1% (from 564,837 to 541,926)
> 2010-2017 pop. change due to migration: -14,057
> Largest 12 month change: -4,303 (2015-2016)
> Median household income: $44,981
[in-text-ad-2]

11. Flint, MI
> 2010-2017 population change: -4.1% (from 424,938 to 407,385)
> 2010-2017 pop. change due to migration: -22,658
> Largest 12 month change: -3,847 (2011-2012)
> Median household income: $43,955

10. Cumberland, MD-WV
> 2010-2017 population change: -4.2% (from 103,161 to 98,837)
> 2010-2017 pop. change due to migration: -2,556
> Largest 12 month change: -794 (2011-2012)
> Median household income: $45,808
[in-text-ad]

9. Decatur, IL
> 2010-2017 population change: -4.5% (from 110,777 to 105,801)
> 2010-2017 pop. change due to migration: -6,090
> Largest 12 month change: -1,110 (2014-2015)
> Median household income: $46,198
[recirclink id=443620]

8. Wheeling, WV-OH
> 2010-2017 population change: -4.5% (from 147,901 to 141,254)
> 2010-2017 pop. change due to migration: -3,761
> Largest 12 month change: -1,617 (2016-2017)
> Median household income: $44,131

7. Danville, IL
> 2010-2017 population change: -4.6% (from 81,639 to 77,909)
> 2010-2017 pop. change due to migration: -4,417
> Largest 12 month change: -778 (2013-2014)
> Median household income: $45,481
[in-text-ad-2]

6. Weirton-Steubenville, WV-OH
> 2010-2017 population change: -4.9% (from 124,326 to 118,250)
> 2010-2017 pop. change due to migration: -2,086
> Largest 12 month change: -1,379 (2015-2016)
> Median household income: $44,733

5. Beckley, WV
> 2010-2017 population change: -5.1% (from 124,959 to 118,543)
> 2010-2017 pop. change due to migration: -4,503
> Largest 12 month change: -1,818 (2016-2017)
> Median household income: $44,178
[in-text-ad]
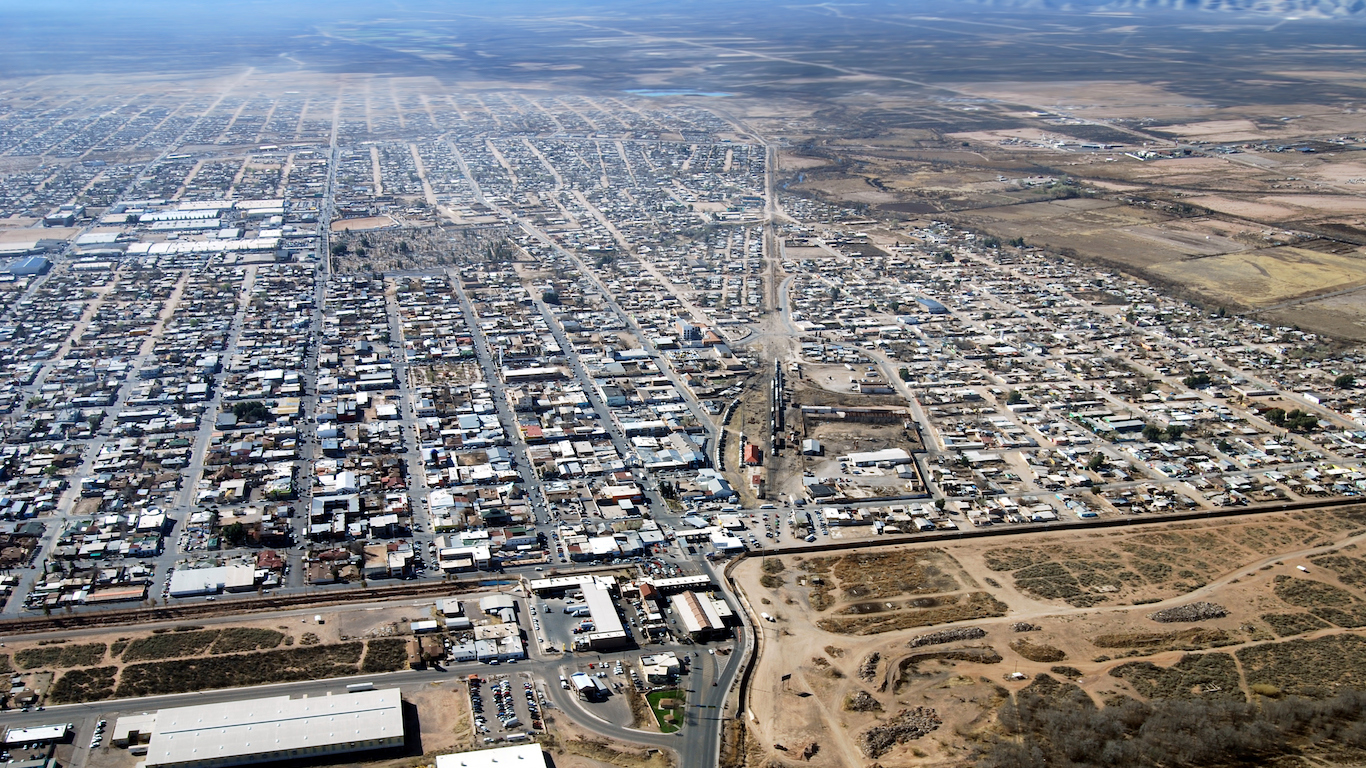
4. Sierra Vista-Douglas, AZ
> 2010-2017 population change: -5.3% (from 131,782 to 124,756)
> 2010-2017 pop. change due to migration: -9,495
> Largest 12 month change: -2,494 (2012-2013)
> Median household income: $45,508
[recirclink id=443575]

3. Charleston, WV
> 2010-2017 population change: -5.5% (from 226,901 to 214,406)
> 2010-2017 pop. change due to migration: -9,772
> Largest 12 month change: -3,329 (2016-2017)
> Median household income: $41,689
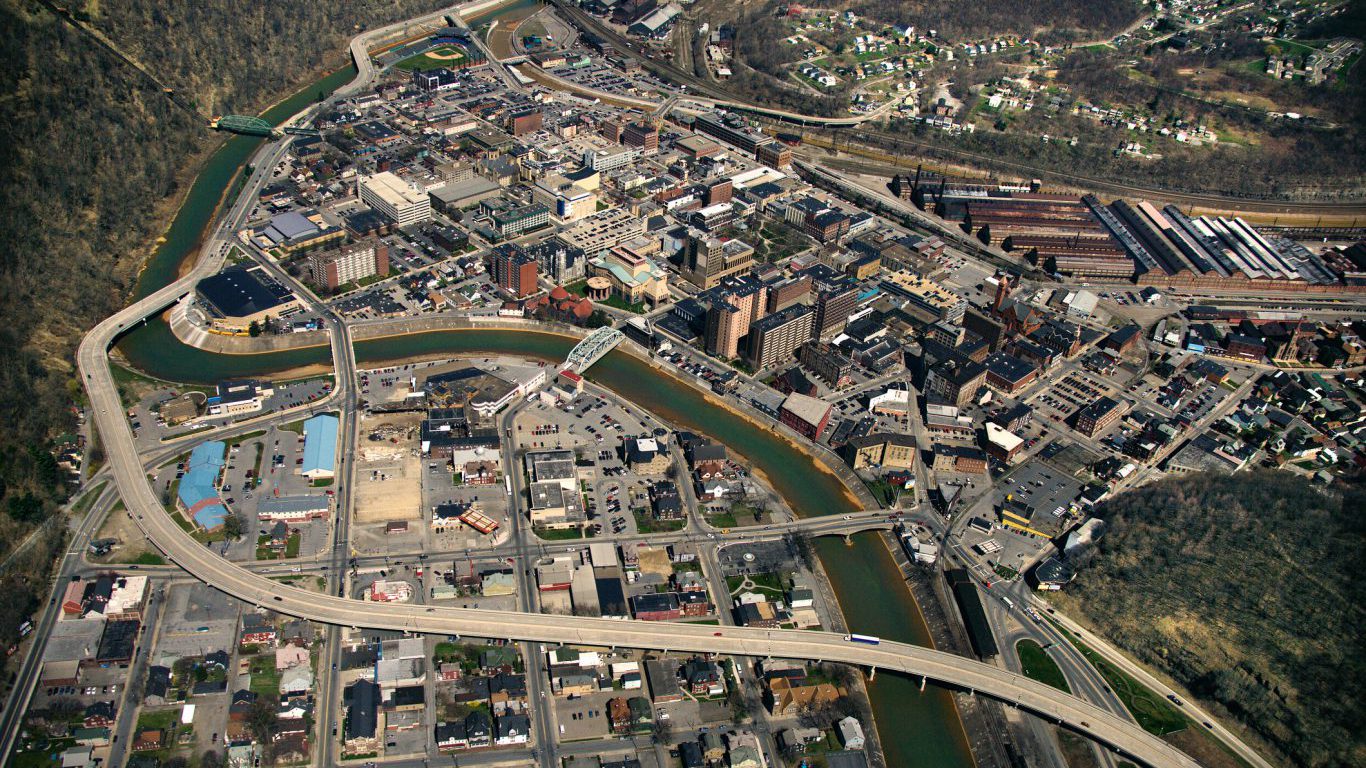
2. Johnstown, PA
> 2010-2017 population change: -7.2% (from 143,452 to 133,054)
> 2010-2017 pop. change due to migration: -7,070
> Largest 12 month change: -2,769 (2012-2013)
> Median household income: $44,100
[in-text-ad-2]

1. Pine Bluff, AR
> 2010-2017 population change: -9.1% (from 100,093 to 90,963)
> 2010-2017 pop. change due to migration: -10,001
> Largest 12 month change: -1,651 (2012-2013)
> Median household income: $37,076
When moving to a new area or city, many Americans will choose based on their financial needs, taking into consideration cost of living and employment opportunities. In 20 of the 25 fastest growing cities, the January 2018 unemployment rate was below the U.S. jobless rate that month of 4.1%. Meanwhile, in each of the fastest shrinking cities, the unemployment rate exceeds the national average.
Job markets in the fastest growing cities also differ from those in the fastest shrinking cities in compensation levels. The median household income in over half of the fastest growing cities exceeds the national median of $57,617 a year. Only two of the fastest shrinking cities have a higher median household income than the U.S. as a whole.
In the fastest growing cities, not only are incomes generally higher, but also the state government takes less of it. Nationwide, states levy an average of $967 in personal income tax per person per year. Just five of the 25 fastest growing cities are in states with higher than average per-capita personal income tax collections. Of the 25 fastest shrinking cities, 14 are in states with higher than average personal income tax collections.
For many Americans, moving to a new city involves buying a home — and property taxes can be a considerable expense for homeowners. Nationwide, homeowners pay the equivalent of about 1.1% of their property value in state and local taxes annually. In the fastest growing cities, lower than average property tax rates may act as magnet for new residents. All but six of the fastest growing cities are in states where homeowners pay a smaller share of their home value on average in state and local property taxes than is typical nationwide.
Meanwhile, high property taxes may partially explain dwindling populations in some American cities. The majority of the fastest shrinking cities are in states where homeowners pay as much or more in state and local property taxes as a share of their home value than is typical nationwide.
Climate may also partially explain why some cities are growing faster than others. Fourteen of the 25 fastest shrinking cities are in the Midwest or Northeast — regions that can experience long and harsh winters. Meanwhile, 18 of the fastest growing cities are in Southern states that tend to have warmer winters and milder climates overall.
To identify America’s 25 fastest growing and 25 fastest shrinking cities, 24/7 Wall St. reviewed population percentage changes from July 2010 to July 2017 in U.S. metropolitan statistical areas from the U.S. Census Bureau. Median household income figures for each city are for 2016 and come from the U.S. Census Bureau’s American Community Survey. We also looked at the seasonally adjusted January 2018 unemployment rate from the Bureau of Labor Statistics. Personal income tax collections per capita and property taxes paid as a percentage of home value by state are from the Tax Foundation and are for fiscal 2015.
Contact [email protected] for any questions or corrections.