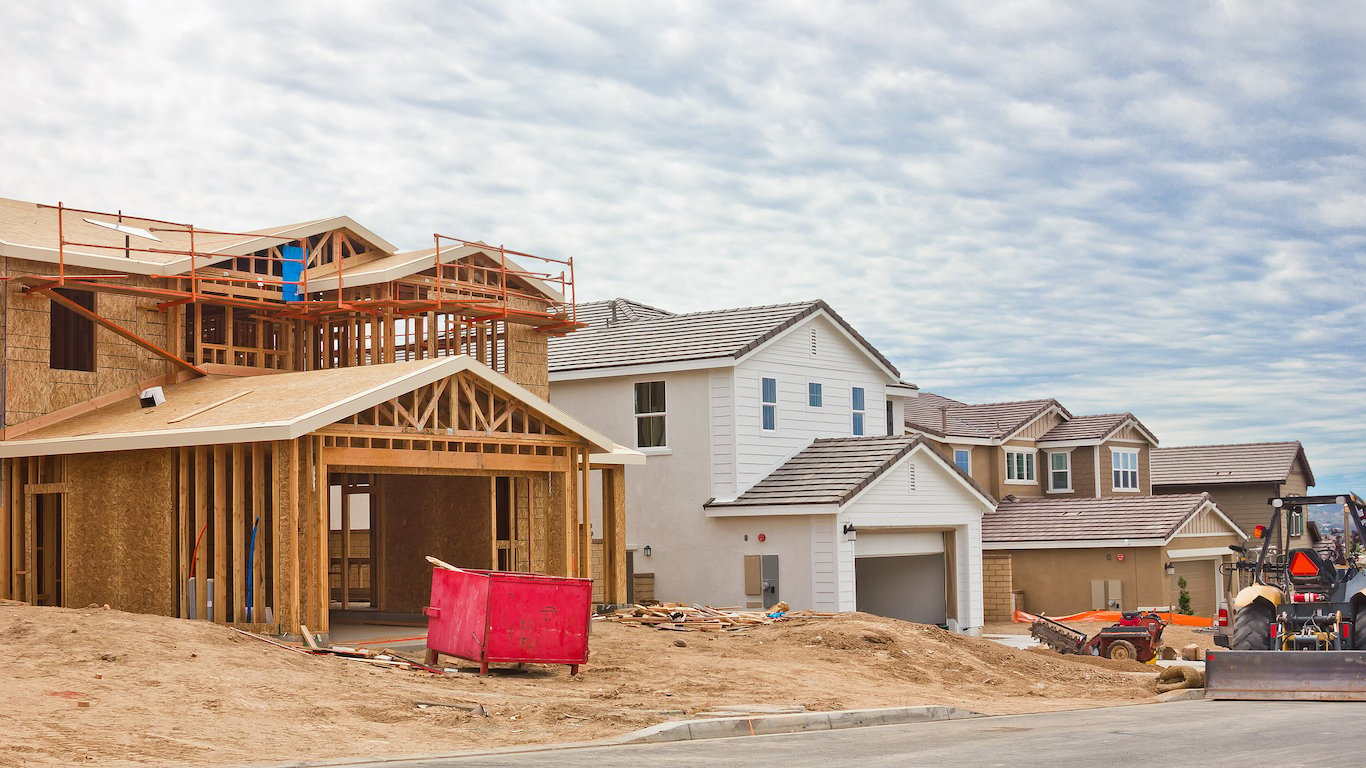
[cnxvideo id=”852875″ placement=”ros”]Slightly more than one in every 10 Americans packed up and moved to a new home in 2017.
While reasons for relocating vary from person to person and family to family, there are some common themes. Younger Americans may move to a city for their career. Families may decide they need to be in a better school district. Older Americans frequently move to be in warmer climates or more walkable cities — in addition to several other factors that the best places to retire all share.
The 35.5 million Americans who move each year may be attracted to places by different attributes — but it appears some places have more of these attributes than others.
24/7 Wall St. reviewed population changes between 2010 and 2017 in nearly 15,000 cities, towns, villages, and Census designated places to identify the fastest growing place in every state. We only considered areas with populations of at least 1,000. To ensure accuracy, we did not consider places where the margin of error for population was greater than 10%. All data are five-year estimates from the U.S. Census Bureau’s American Community Survey.
The cities and towns on this list tend to be relatively prosperous. In the vast majority of the fastest growing places, the unemployment rate is lower than it is across the respective state as a whole. Additionally, in 42 of the 50 communities on this list, the typical household earns more than they typical household across the state as a whole. The strong job market and higher incomes in these areas likely make them more attractive to new residents.
Focusing on population change in cities in towns within a specific state does not shed light on broader, national migration patterns. While the U.S. population grew by 5.6% in the last seven years, some states, like Michigan and West Virginia, are home to fewer people now than in 2010. Meanwhile, in the Southeast and the West, populations are booming. These are America’s fastest growing and shrinking states.
Click here to see the fastest growing places in every state
Click here to see the fastest shrinking places in every state
Click here to read our methodology
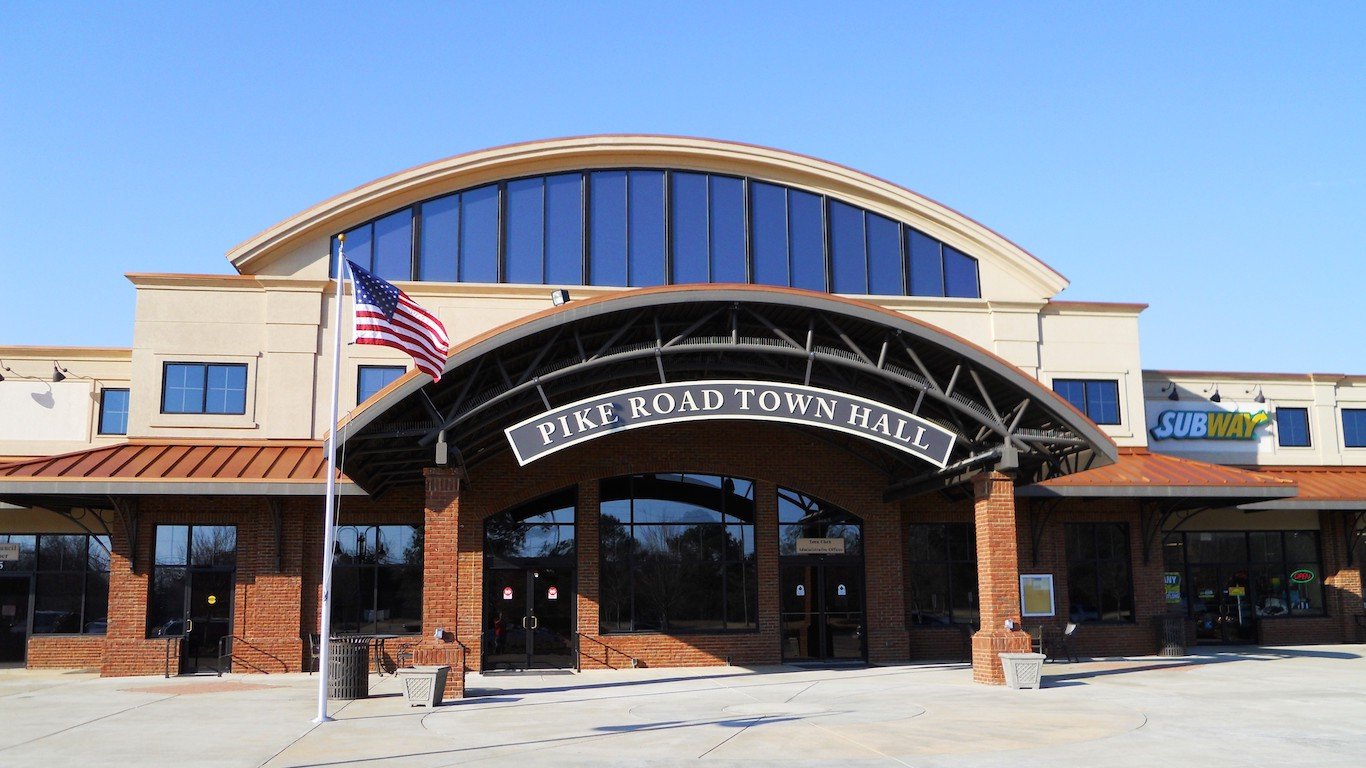
1. Alabama: Pike Road
> 2010-2017 population change: +66.0% (state: +2.9%)
> Median household income: $102,500 (state: $46,472)
> Annual unemployment: 2.9% (state: 4.3%)
> Total population: 8,417
[in-text-ad]
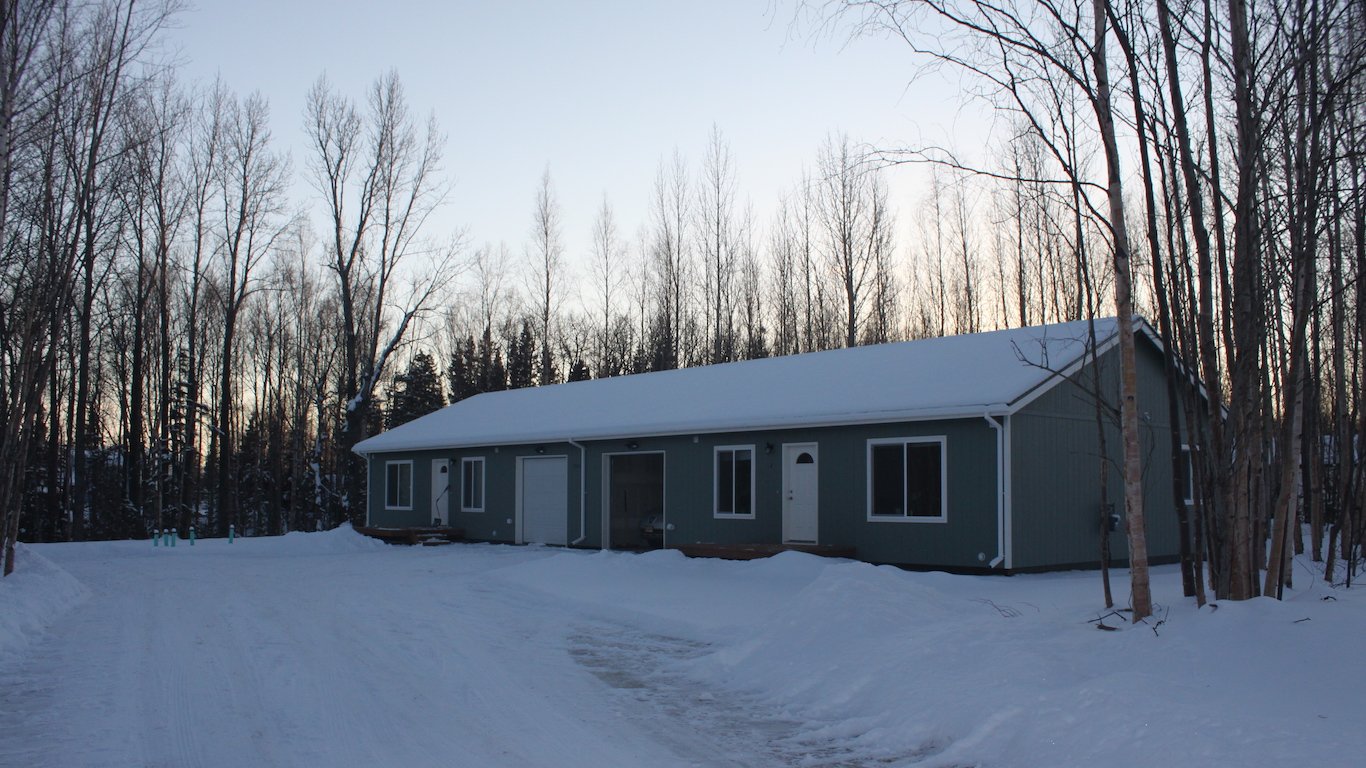
2. Alaska: Knik-Fairview
> 2010-2017 population change: +40.6% (state: +6.9%)
> Median household income: $87,093 (state: $76,114)
> Annual unemployment: 5.5% (state: 5.2%)
> Total population: 17,203
[recirclink id=554414]
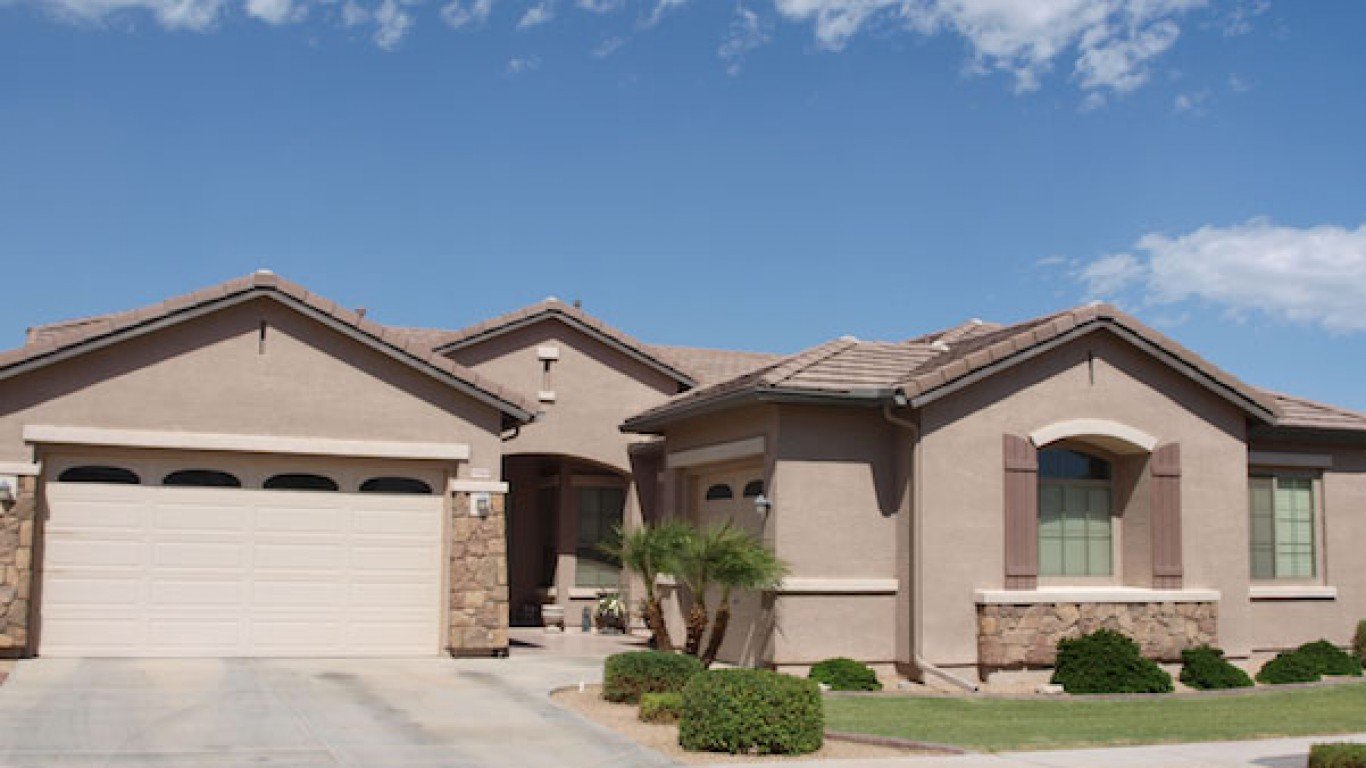
3. Arizona: Queen Creek
> 2010-2017 population change: +44.4% (state: +9.0%)
> Median household income: $92,917 (state: $53,510)
> Annual unemployment: 2.4% (state: 4.2%)
> Total population: 33,298
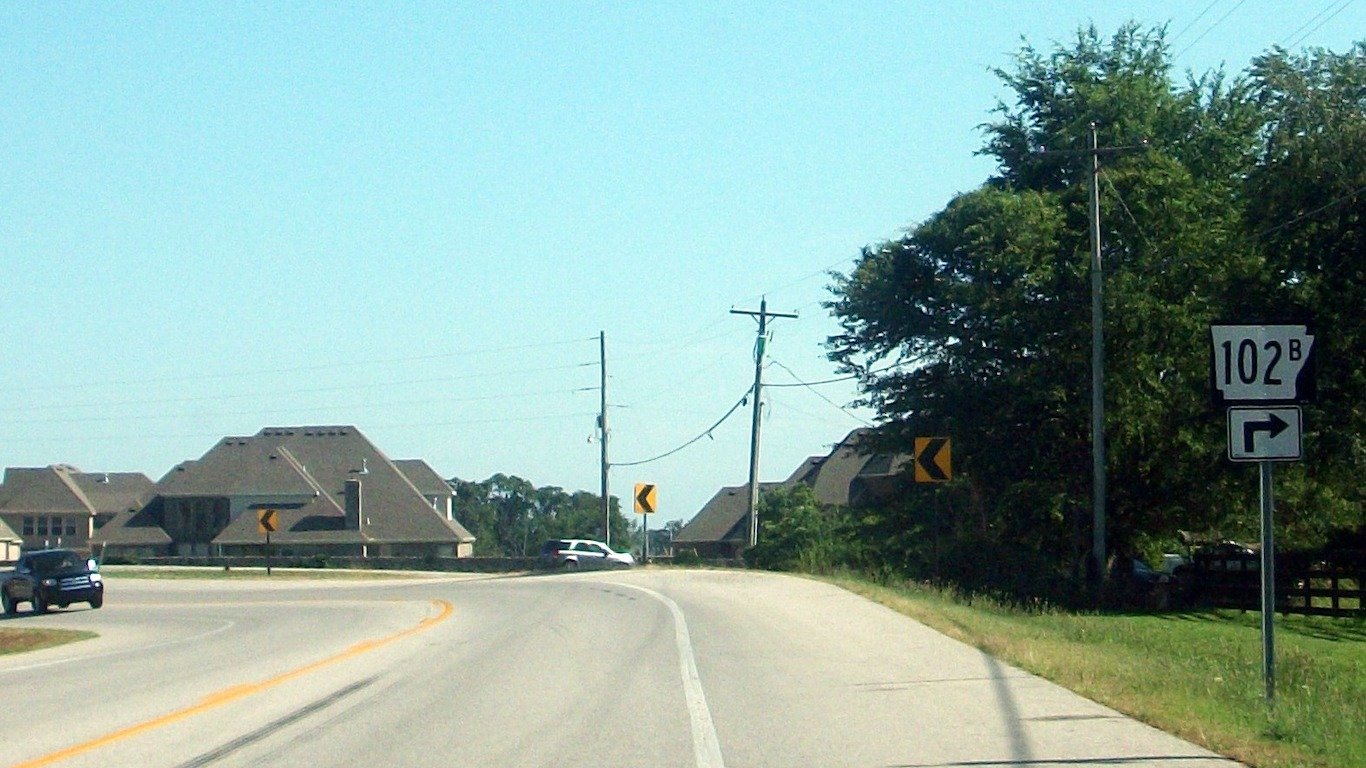
4. Arkansas: Centerton
> 2010-2017 population change: +46.5% (state: +3.7%)
> Median household income: $68,561 (state: $43,813)
> Annual unemployment: 1.3% (state: 3.6%)
> Total population: 12,178
[in-text-ad-2]

5. California: Ladera Ranch
> 2010-2017 population change: +58.3% (state: +6.4%)
> Median household income: $152,923 (state: $67,169)
> Annual unemployment: 3.5% (state: 4.8%)
> Total population: 28,769

6. Colorado: Johnstown
> 2010-2017 population change: +66.2% (state: +11.2%)
> Median household income: $85,339 (state: $65,458)
> Annual unemployment: 2.5% (state: 3.5%)
> Total population: 14,386
[in-text-ad]

7. Connecticut: Cheshire Village
> 2010-2017 population change: +17.3% (state: +1.4%)
> Median household income: $100,994 (state: $73,781)
> Annual unemployment: 3.4% (state: 4.8%)
> Total population: 6,251
[recirclink id=555564]

8. Delaware: Middletown
> 2010-2017 population change: +24.7% (state: +7.1%)
> Median household income: $87,375 (state: $63,036)
> Annual unemployment: 2.4% (state: 4.0%)
> Total population: 20,754

9. Florida: The Villages
> 2010-2017 population change: +85.0% (state: +9.5%)
> Median household income: $61,022 (state: $50,883)
> Annual unemployment: 0.6% (state: 4.2%)
> Total population: 74,618
[in-text-ad-2]

10. Georgia: Chamblee
> 2010-2017 population change: +191.6% (state: +7.7%)
> Median household income: $54,142 (state: $52,977)
> Annual unemployment: 3.8% (state: 4.7%)
> Total population: 28,433
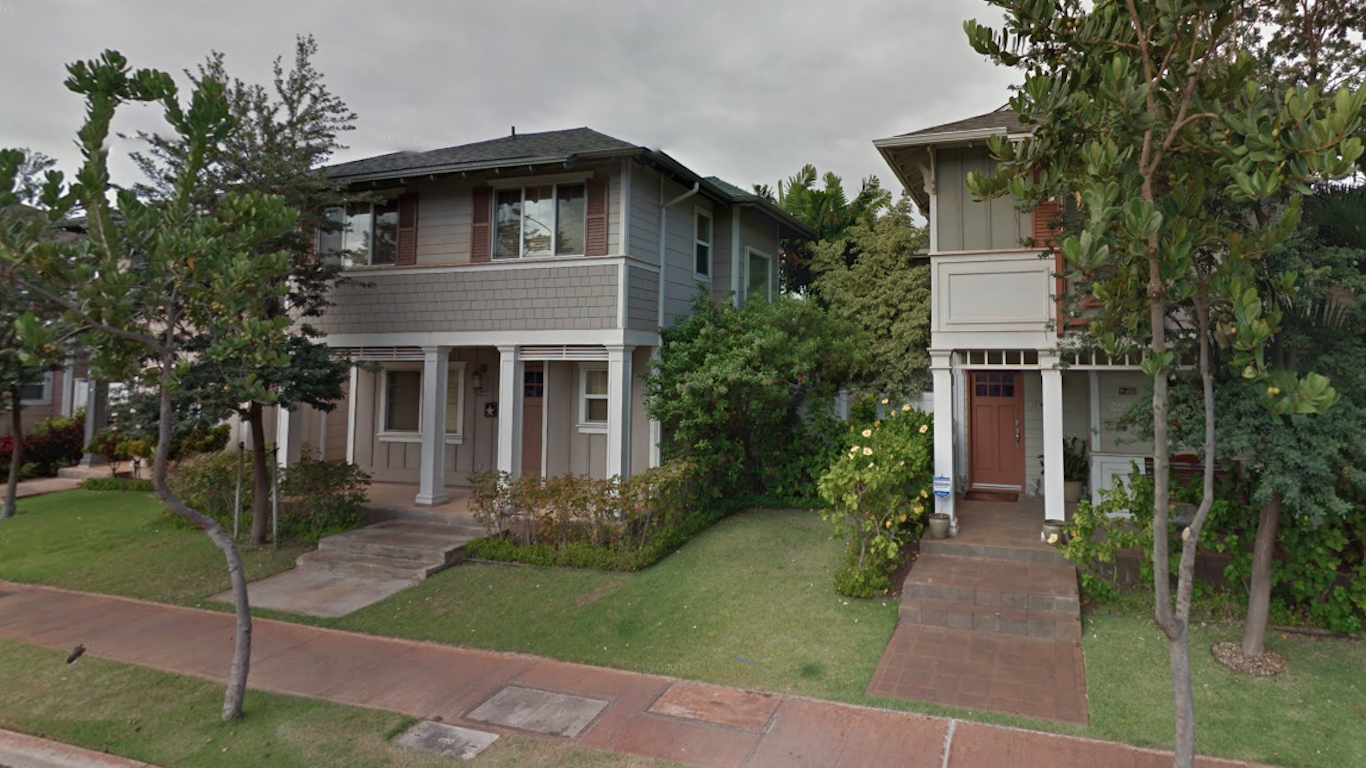
11. Hawaii: Ocean Pointe
> 2010-2017 population change: +123.4% (state: +6.6%)
> Median household income: $114,016 (state: $74,923)
> Annual unemployment: 2.7% (state: 3.0%)
> Total population: 13,579
[in-text-ad]

12. Idaho: Star
> 2010-2017 population change: +51.4% (state: +8.6%)
> Median household income: $55,674 (state: $50,985)
> Annual unemployment: 1.8% (state: 3.3%)
> Total population: 7,832
[recirclink id=556670]

13. Illinois: Pingree Grove
> 2010-2017 population change: +76.2% (state: +0.9%)
> Median household income: $78,433 (state: $61,229)
> Annual unemployment: 0% (state: 4.8%)
> Total population: 6,661
14. Indiana: Zionsville
> 2010-2017 population change: +92.0% (state: +3.1%)
> Median household income: $127,152 (state: $52,182)
> Annual unemployment: 2.2% (state: 3.9%)
> Total population: 25,810
[in-text-ad-2]

15. Iowa: Bondurant
> 2010-2017 population change: +56.5% (state: +3.4%)
> Median household income: $75,357 (state: $56,570)
> Annual unemployment: 0.4% (state: 2.8%)
> Total population: 5,457

16. Kansas: Basehor
> 2010-2017 population change: +28.8% (state: +3.4%)
> Median household income: $77,755 (state: $55,477)
> Annual unemployment: 3.3% (state: 3.1%)
> Total population: 5,401
[in-text-ad]
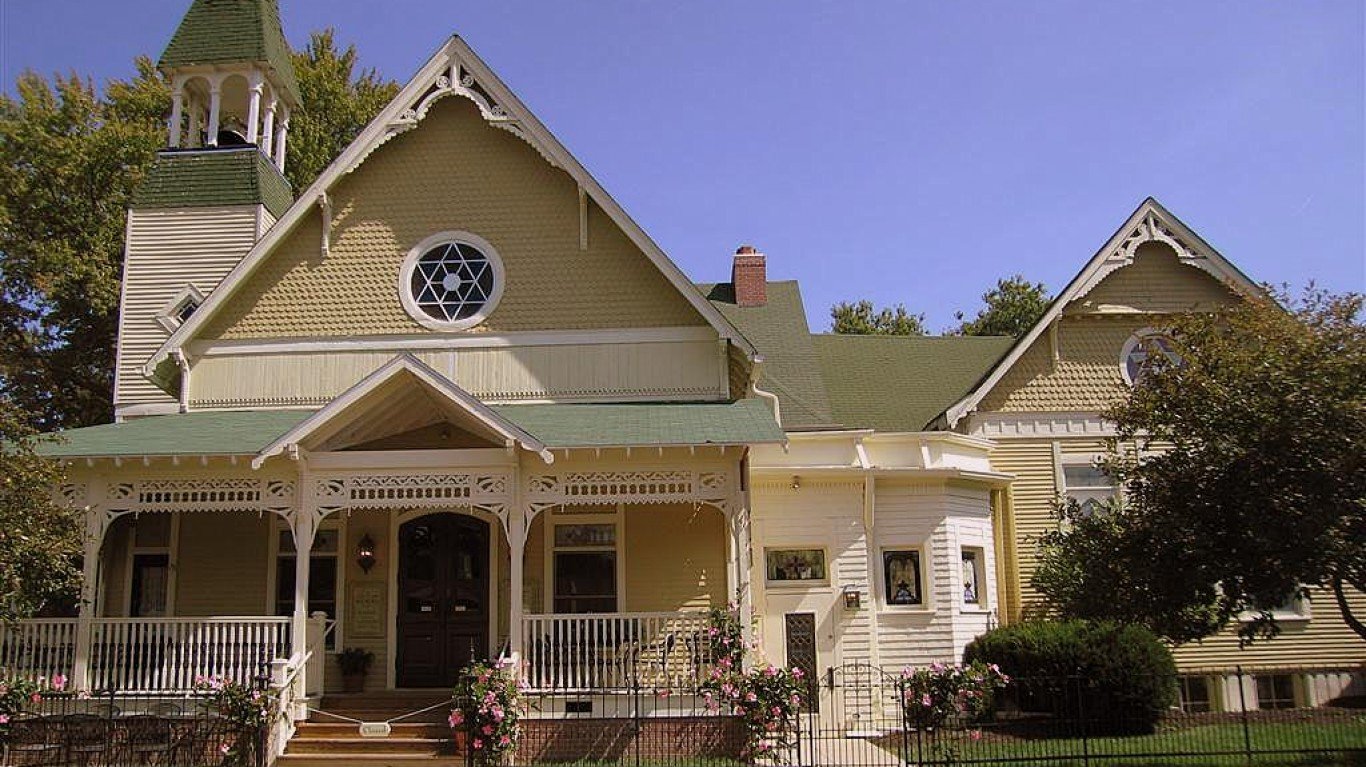
17. Kentucky: Wilmore
> 2010-2017 population change: +66.5% (state: +3.2%)
> Median household income: $46,833 (state: $46,535)
> Annual unemployment: 1.8% (state: 4.0%)
> Total population: 6,226
[recirclink id=558313]

18. Louisiana: Chalmette
> 2010-2017 population change: +83.9% (state: +5.3%)
> Median household income: $43,590 (state: $46,710)
> Annual unemployment: 6.2% (state: 4.3%)
> Total population: 22,907

19. Maine: Sanford
> 2010-2017 population change: +97.5% (state: +9.5%)
> Median household income: $42,025 (state: $50,883)
> Annual unemployment: 6.3% (state: 4.2%)
> Total population: 57,979
[in-text-ad-2]

20. Maryland: Clarksburg
> 2010-2017 population change: +109.6% (state: +5.3%)
> Median household income: $135,203 (state: $78,916)
> Annual unemployment: 3.6% (state: 4.1%)
> Total population: 22,100

21. Massachusetts: West Concord
> 2010-2017 population change: +23.2% (state: +4.8%)
> Median household income: $118,100 (state: $74,167)
> Annual unemployment: 2.3% (state: 4.0%)
> Total population: 7,646
[in-text-ad]

22. Michigan: Byron Center
> 2010-2017 population change: +33.8% (state: -0.3%)
> Median household income: $72,708 (state: $52,668)
> Annual unemployment: 3.3% (state: 4.5%)
> Total population: 6,751
[recirclink id=554414]

23. Minnesota: Rogers
> 2010-2017 population change: +64.0% (state: +3.7%)
> Median household income: $54,172 (state: $43,813)
> Annual unemployment: 2% (state: 3.6%)
> Total population: 63,411

24. Mississippi: Bay St. Louis
> 2010-2017 population change: +27.5% (state: +1.5%)
> Median household income: $42,002 (state: $42,009)
> Annual unemployment: 5.3% (state: 5.0%)
> Total population: 11,918
[in-text-ad-2]

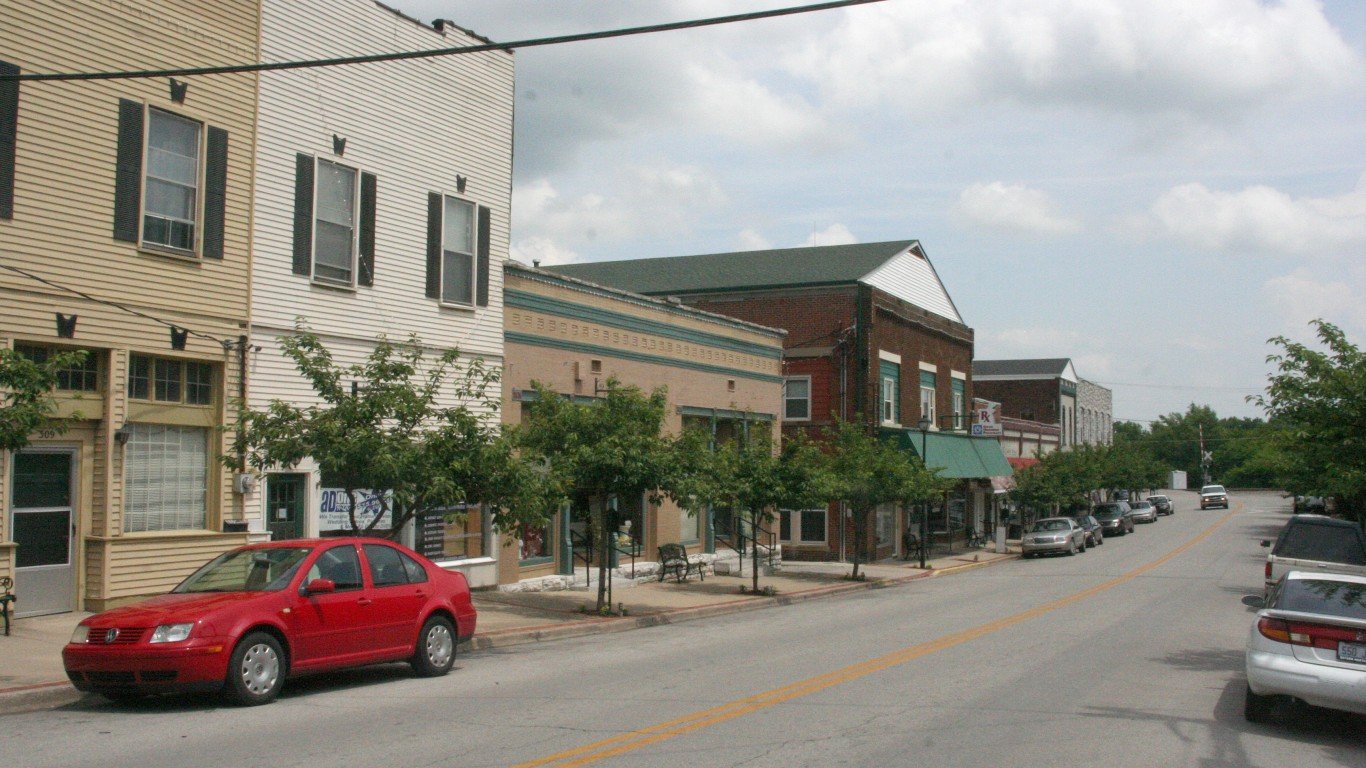
25. Missouri: Cottleville
> 2010-2017 population change: +56.2% (state: +2.6%)
> Median household income: $98,611 (state: $51,542)
> Annual unemployment: 2.9% (state: 3.6%)
> Total population: 4,551
26. Montana: Sidney
> 2010-2017 population change: +28.5% (state: +5.8%)
> Median household income: $59,958 (state: $50,801)
> Annual unemployment: 1.5% (state: 3.0%)
> Total population: 6,491
[in-text-ad]

27. Nebraska: Ralston
> 2010-2017 population change: +23.3% (state: +5.3%)
> Median household income: $55,837 (state: $56,675)
> Annual unemployment: 3.7% (state: 2.6%)
> Total population: 7,348
[recirclink id=555564]

28. Nevada: Enterprise
> 2010-2017 population change: +56.5% (state: +9.7%)
> Median household income: $74,139 (state: $55,434)
> Annual unemployment: 3.5% (state: 5.1%)
> Total population: 155,773

29. New Hampshire: Durham
> 2010-2017 population change: +20.3% (state: +6.4%)
> Median household income: $81,372 (state: $67,169)
> Annual unemployment: 3.1% (state: 4.8%)
> Total population: 5,819
[in-text-ad-2]

30. New Jersey: Princeton
> 2010-2017 population change: +145.1% (state: +2.7%)
> Median household income: $125,506 (state: $76,475)
> Annual unemployment: 2.6% (state: 4.6%)
> Total population: 30,722
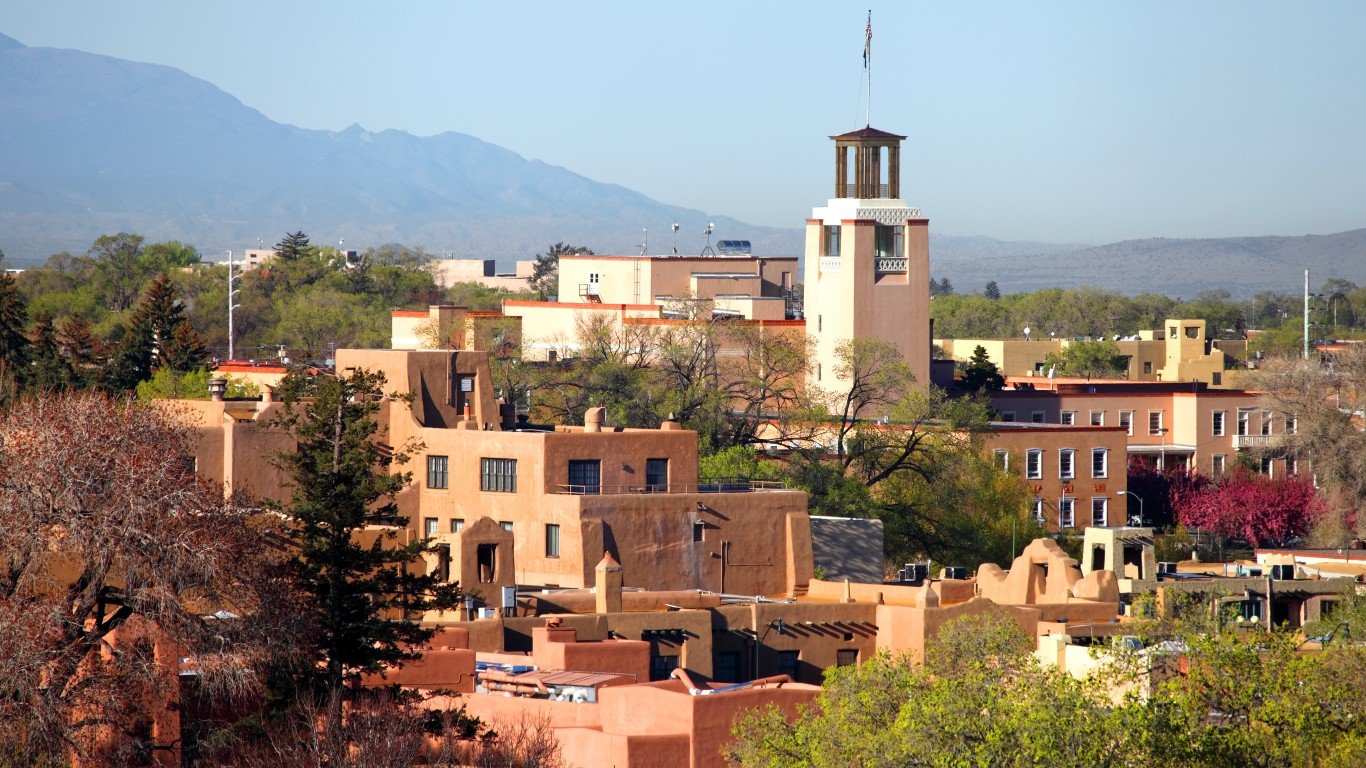
31. New Mexico: Santa Fe
> 2010-2017 population change: +22.8% (state: +3.6%)
> Median household income: $53,922 (state: $46,718)
> Annual unemployment: 3.5% (state: 4.5%)
> Total population: 82,980
[in-text-ad]

32. New York: Monsey
> 2010-2017 population change: +46.5% (state: +3.0%)
> Median household income: $37,925 (state: $62,765)
> Annual unemployment: 3.3% (state: 4.3%)
> Total population: 22,043
[recirclink id=556670]

33. North Carolina: Rolesville
> 2010-2017 population change: +91.8% (state: +8.4%)
> Median household income: $96,384 (state: $50,320)
> Annual unemployment: 8% (state: 4.4%)
> Total population: 6,308

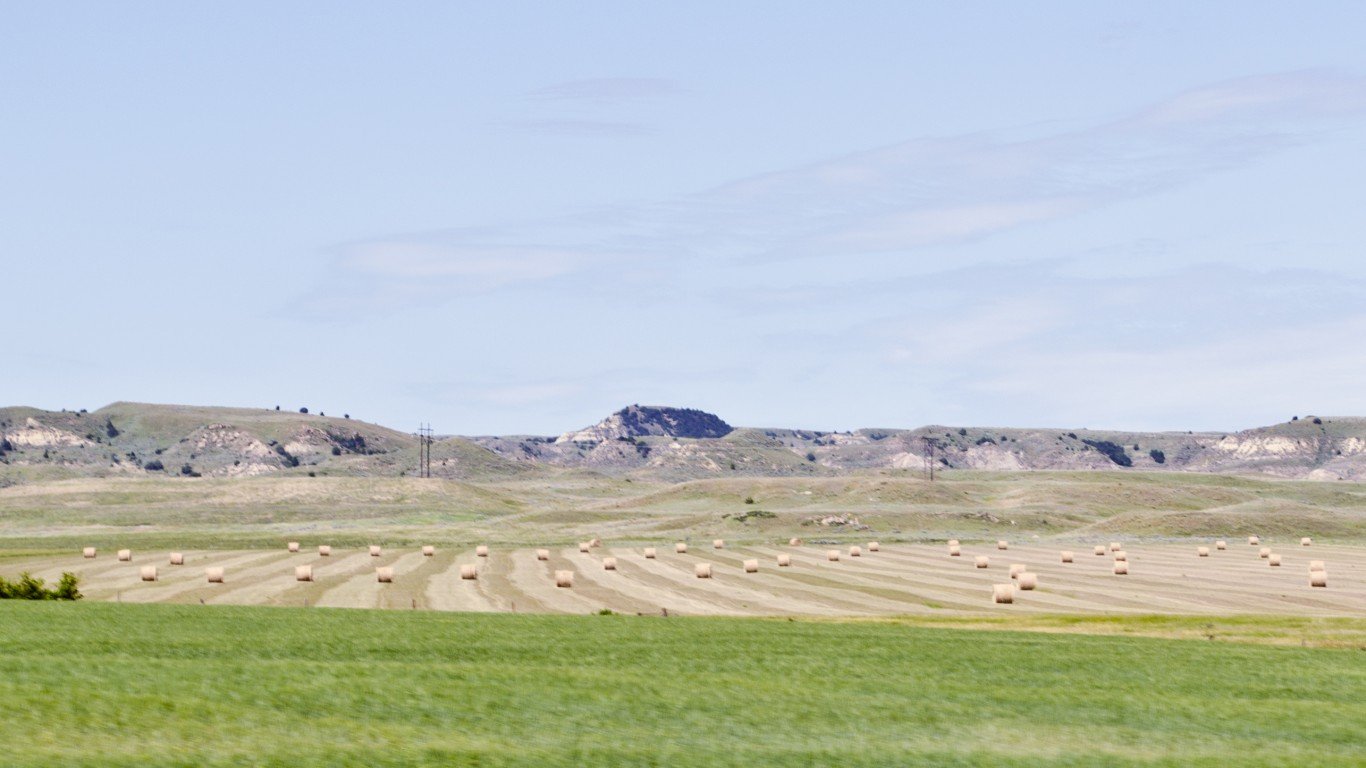
34. North Dakota: Williston
> 2010-2017 population change: +81.0% (state: +9.5%)
> Median household income: $35,000 (state: $50,883)
> Annual unemployment: 4.1% (state: 4.2%)
> Total population: 2,685
[in-text-ad-2]
35. Ohio: Fort Shawnee
> 2010-2017 population change: +56.3% (state: +0.8%)
> Median household income: $66,323 (state: $52,407)
> Annual unemployment: 4.4% (state: 4.1%)
> Total population: 5,875

36. Oklahoma: Jenks
> 2010-2017 population change: +34.9% (state: +6.0%)
> Median household income: $90,039 (state: $49,767)
> Annual unemployment: 2.5% (state: 3.5%)
> Total population: 20,836
[in-text-ad]
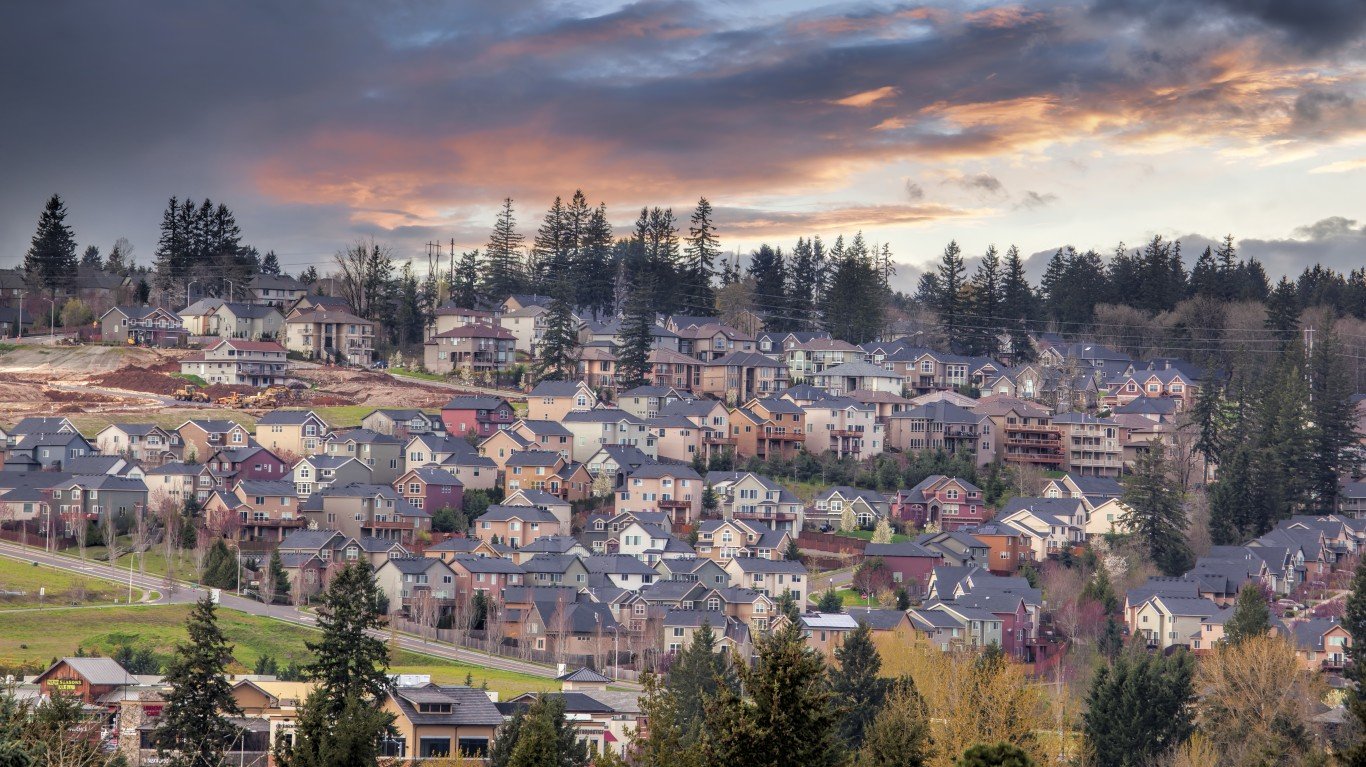
37. Oregon: Happy Valley
> 2010-2017 population change: +46.8% (state: +7.0%)
> Median household income: $115,718 (state: $56,119)
> Annual unemployment: 2.8% (state: 4.2%)
> Total population: 18,477
[recirclink id=558313]
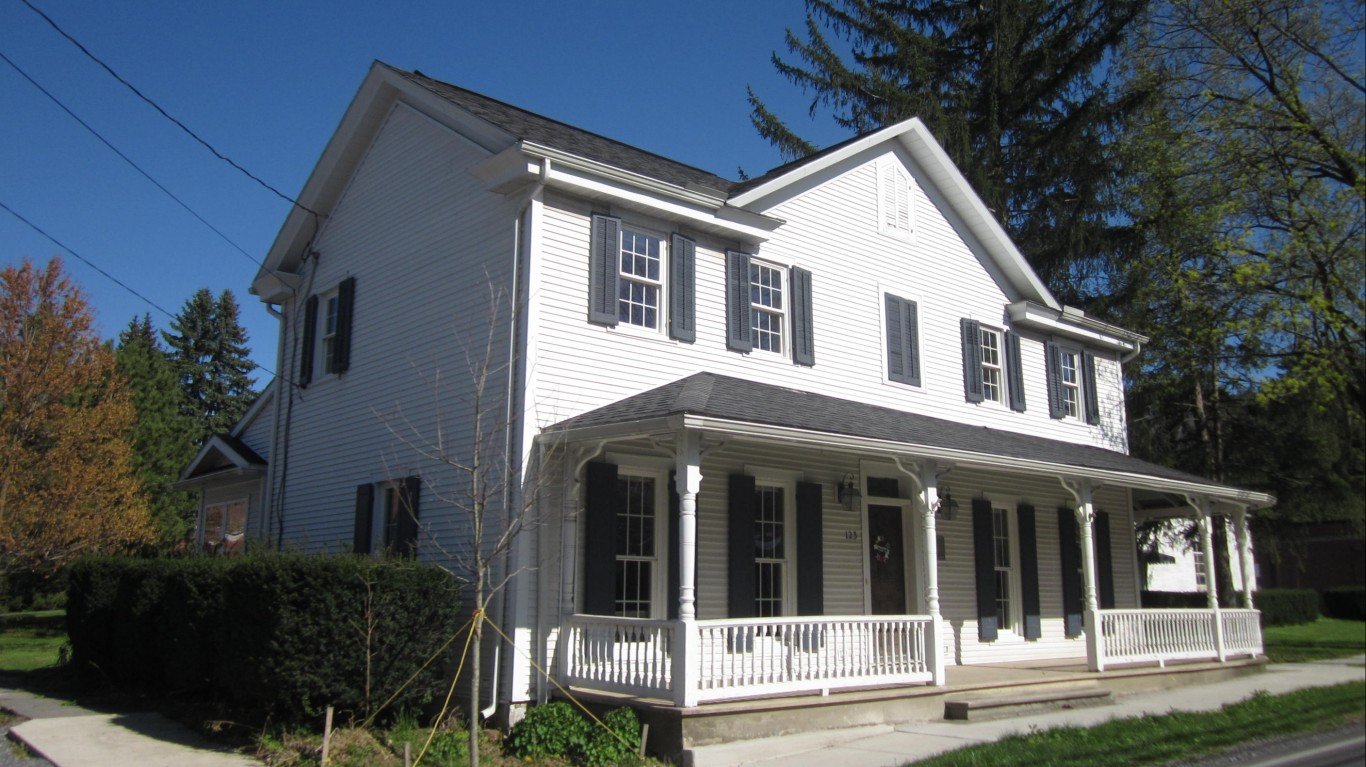
38. Pennsylvania: Boalsburg
> 2010-2017 population change: +23.1% (state: +1.4%)
> Median household income: $100,198 (state: $56,951)
> Annual unemployment: 0.9% (state: 4.1%)
> Total population: 4,533

39. Rhode Island: Tiverton
> 2010-2017 population change: +5.9% (state: +0.0%)
> Median household income: $71,615 (state: $61,043)
> Annual unemployment: 4.2% (state: 4.4%)
> Total population: 7,727
[in-text-ad-2]
40. South Carolina: Hardeeville
> 2010-2017 population change: +70.3% (state: +8.5%)
> Median household income: $52,705 (state: $48,781)
> Annual unemployment: 3.8% (state: 4.3%)
> Total population: 5,084

41. South Dakota: Harrisburg
> 2010-2017 population change: +52.5% (state: +0.9%)
> Median household income: $35,609 (state: $61,229)
> Annual unemployment: 7.1% (state: 4.8%)
> Total population: 9,344
[in-text-ad]
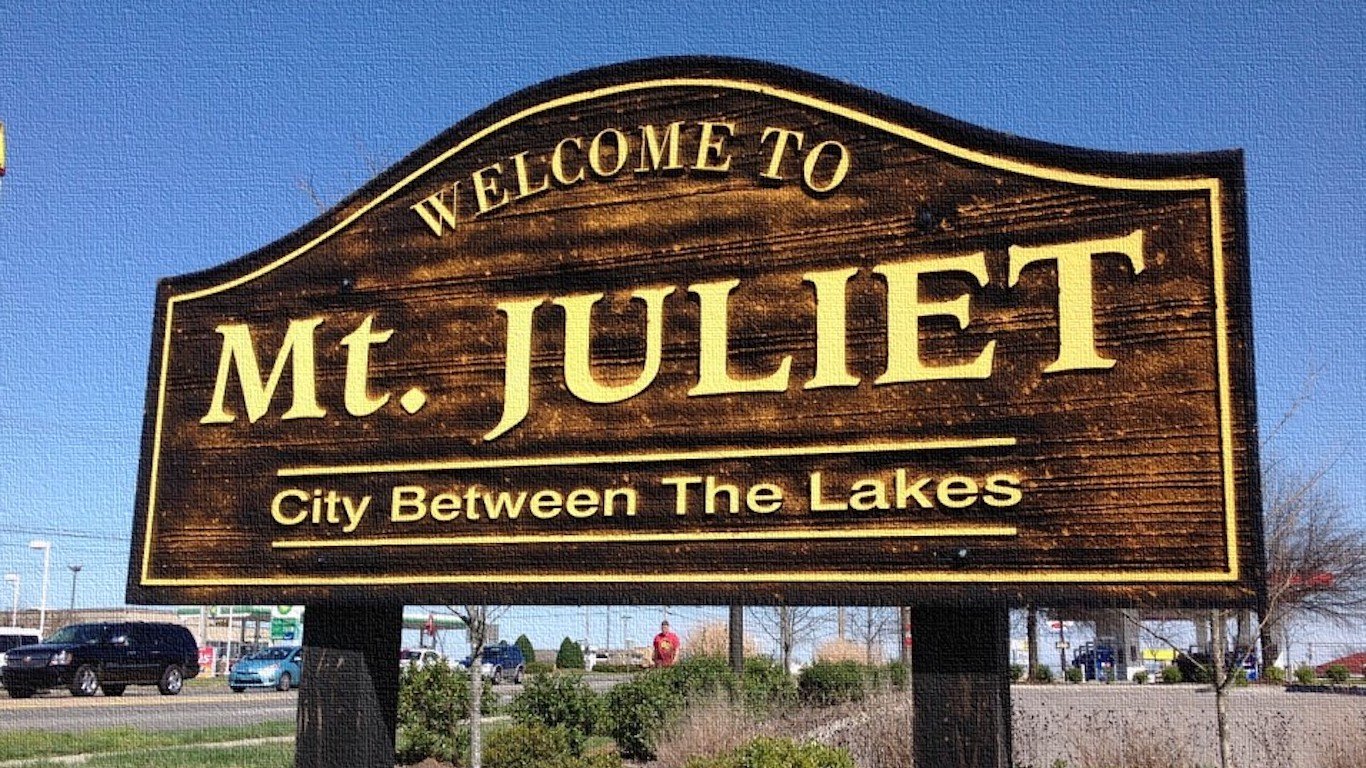
42. Tennessee: Mount Juliet
> 2010-2017 population change: +43.2% (state: +5.8%)
> Median household income: $80,130 (state: $48,708)
> Annual unemployment: 2.5% (state: 4.0%)
> Total population: 31,397
[recirclink id=554414]
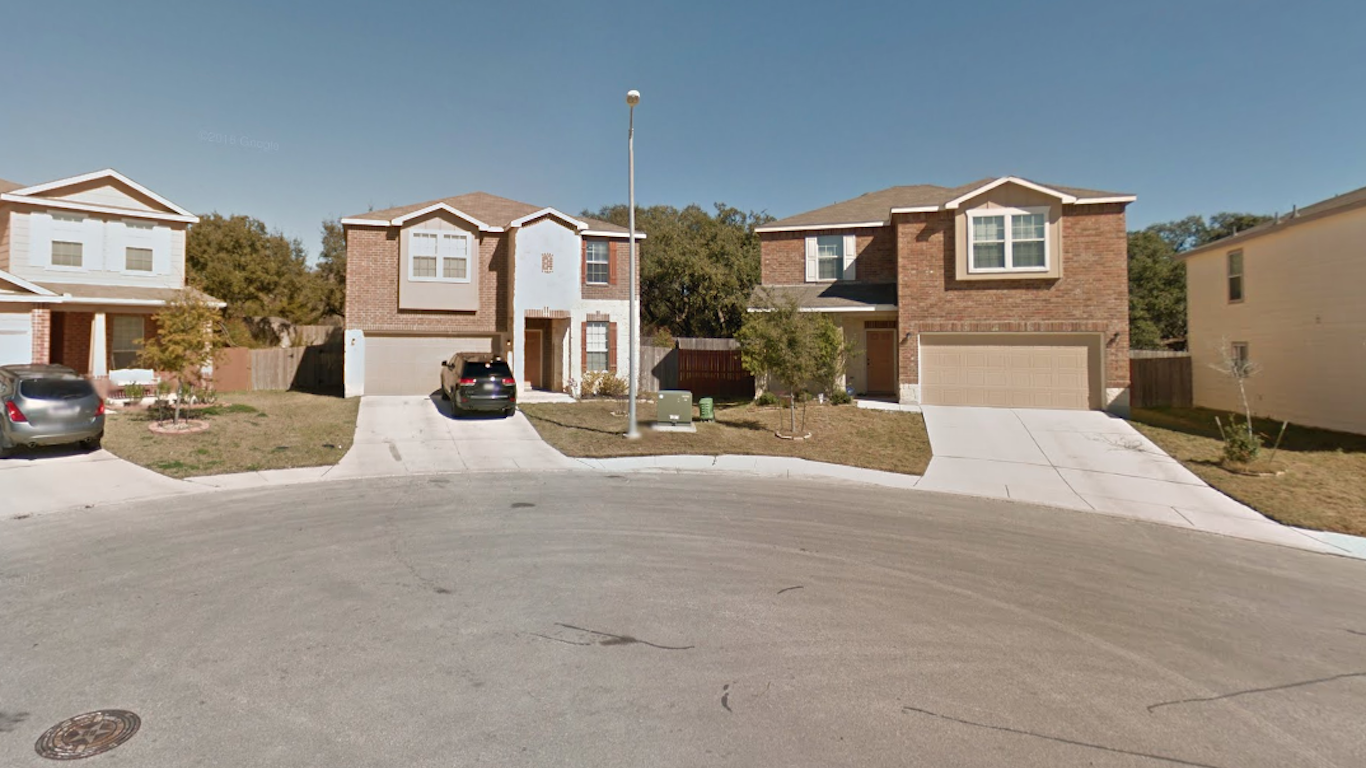
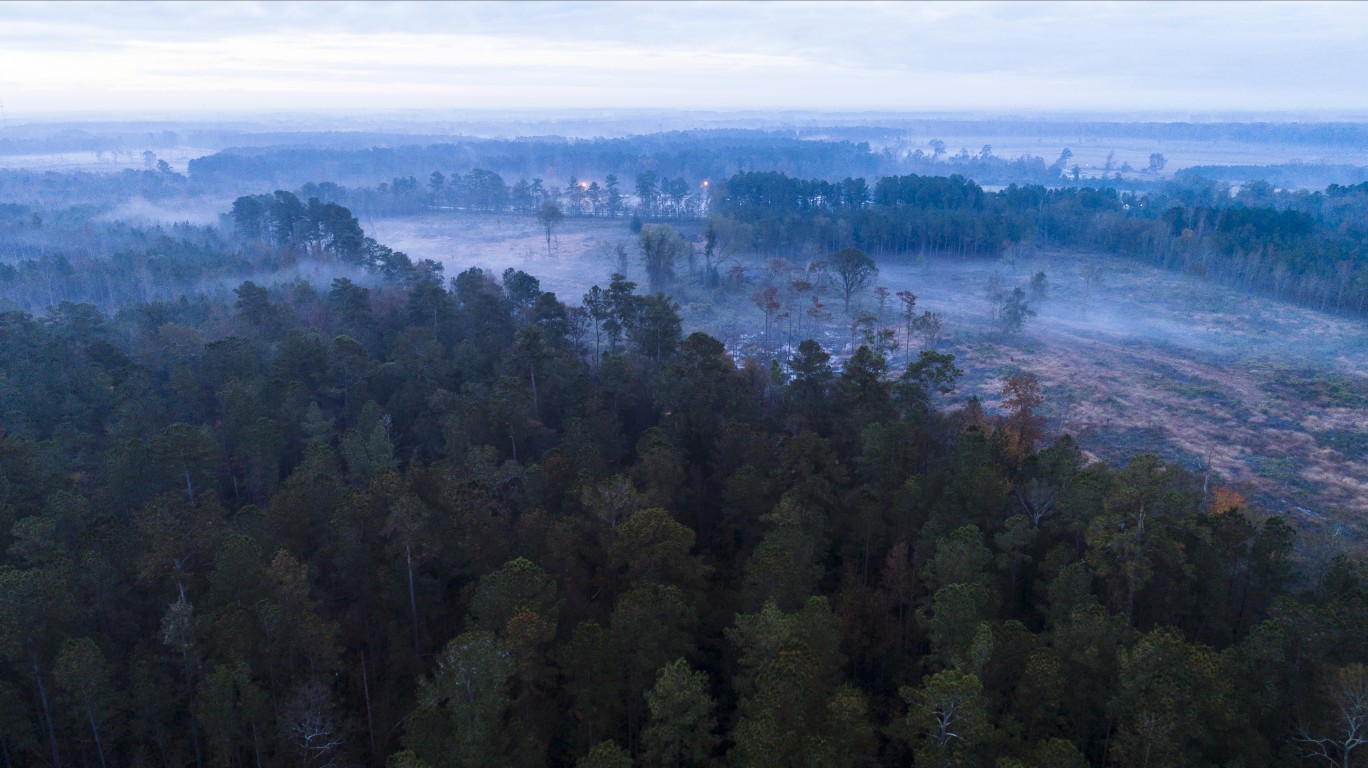
43. Texas: Timberwood Park
> 2010-2017 population change: +123.0% (state: +12.8%)
> Median household income: $113,331 (state: $57,051)
> Annual unemployment: 2.9% (state: 3.7%)
> Total population: 26,236

44. Utah: Saratoga Springs
> 2010-2017 population change: +74.7% (state: +3.0%)
> Median household income: $76,775 (state: $62,765)
> Annual unemployment: 3.9% (state: 4.3%)
> Total population: 27,682
[in-text-ad-2]
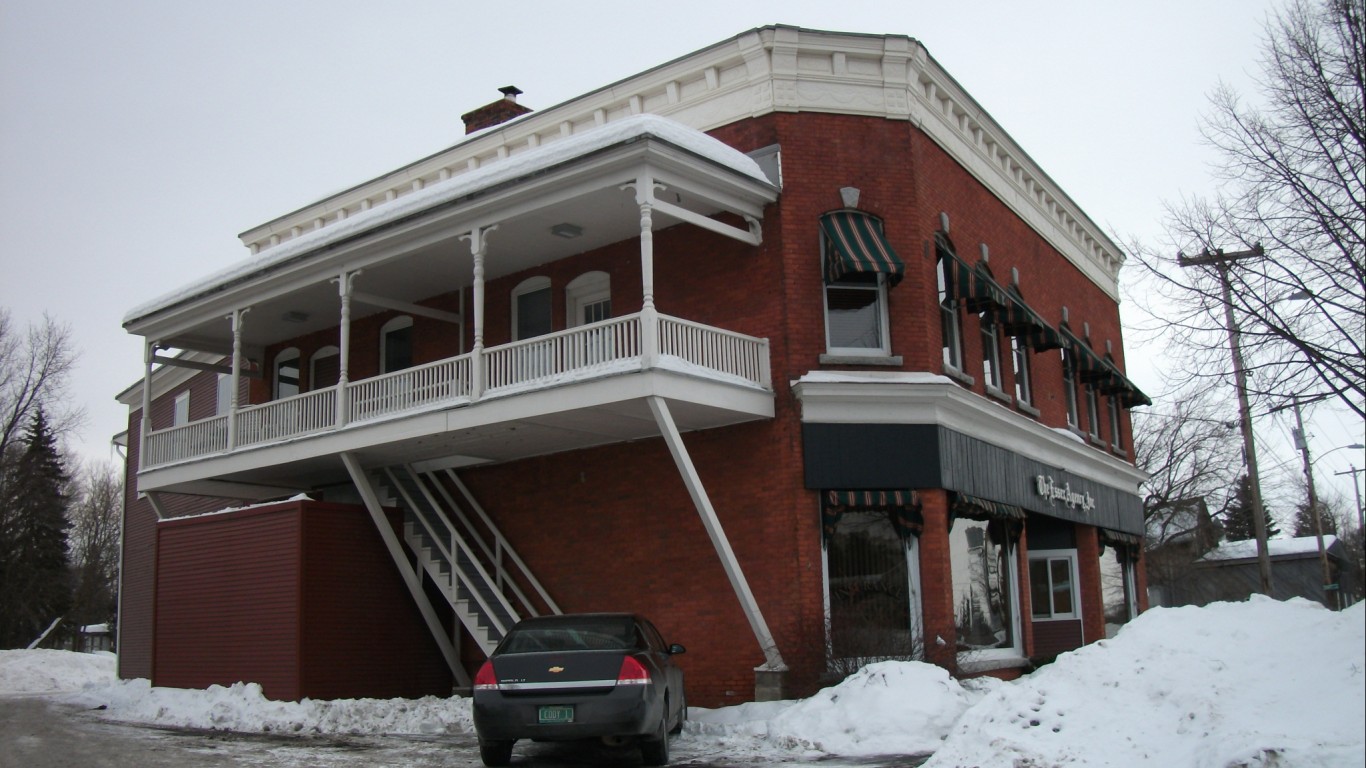
45. Vermont: Essex Junction
> 2010-2017 population change: +10.7% (state: +0.1%)
> Median household income: $63,948 (state: $57,808)
> Annual unemployment: 3.5% (state: 2.9%)
> Total population: 10,132

46. Virginia: Brambleton
> 2010-2017 population change: +131.3% (state: +6.7%)
> Median household income: $173,690 (state: $68,766)
> Annual unemployment: 2.7% (state: 3.5%)
> Total population: 19,876
[in-text-ad]

47. Washington: Kirkland
> 2010-2017 population change: +82.0% (state: +9.3%)
> Median household income: $104,319 (state: $66,174)
> Annual unemployment: 3.3% (state: 3.8%)
> Total population: 86,772
[recirclink id=555564]

48. West Virginia: Cheat Lake
> 2010-2017 population change: +24.9% (state: -0.2%)
> Median household income: $87,125 (state: $44,061)
> Annual unemployment: 1.7% (state: 3.8%)
> Total population: 9,540
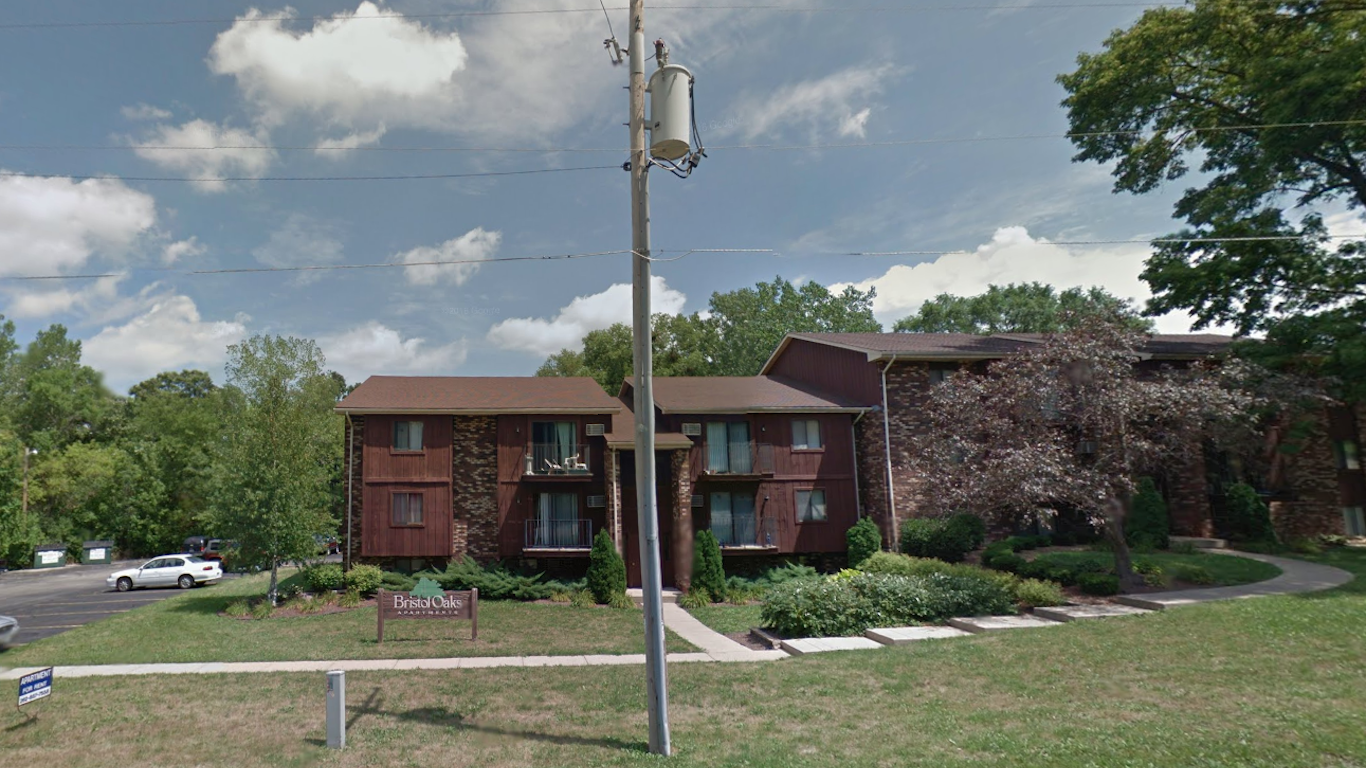
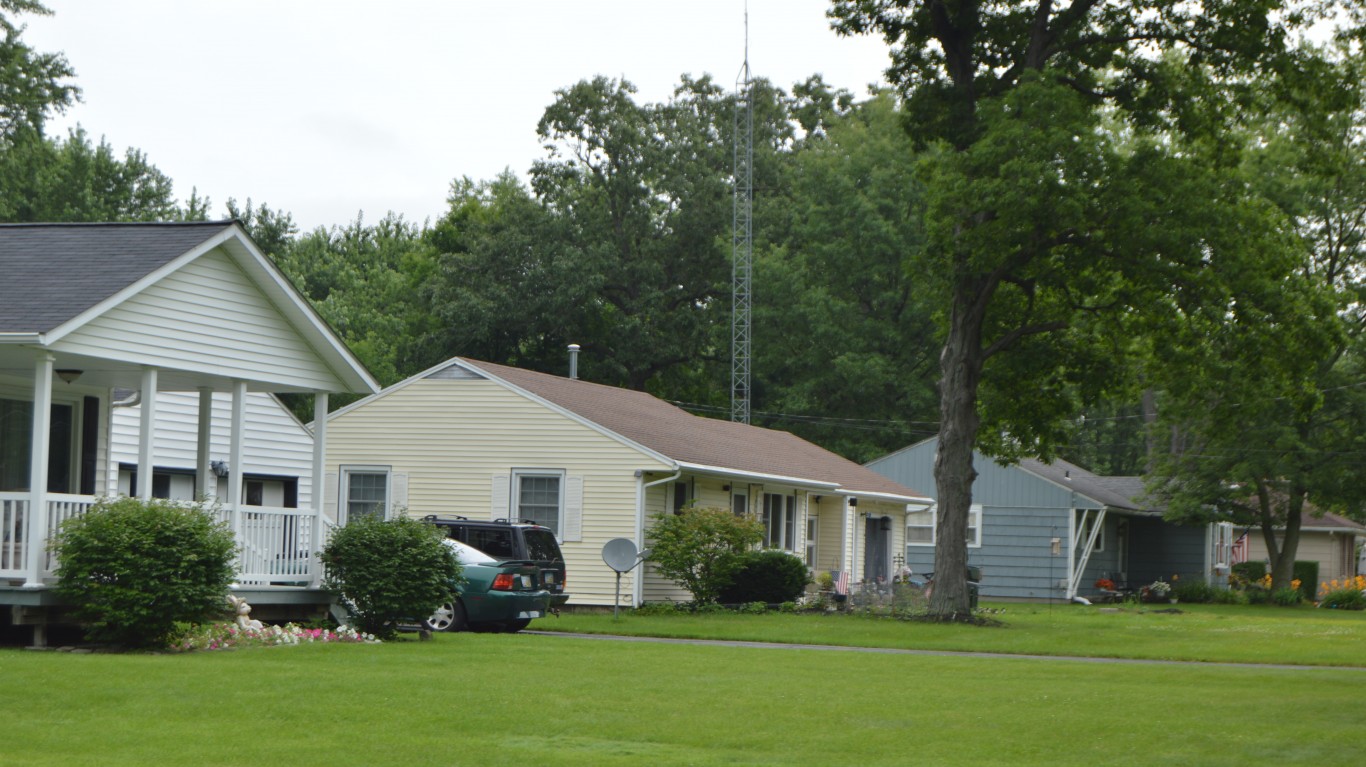
49. Wisconsin: Bristol
> 2010-2017 population change: +93.9% (state: +2.2%)
> Median household income: $66,788 (state: $56,759)
> Annual unemployment: 3% (state: 3.1%)
> Total population: 4,970
[in-text-ad-2]

50. Wyoming: Evansville
> 2010-2017 population change: +18.3% (state: +6.9%)
> Median household income: $42,140 (state: $60,938)
> Annual unemployment: 4% (state: 3.1%)
> Total population: 2,929
Methodology
To identify the fastest growing place in every state, 24/7 Wall St. reviewed population change from 2010 to 2017 in nearly 15,000 cities, towns, villages, and Census designated places with populations of at least 1,000. We only considered places where the margin of error for population was less than 10%. All data are five-year estimates from the U.S. Census Bureau’s American Community Survey. We also reviewed data on median household income and annual unemployment for 2017 from the ACS.
Contact [email protected] for any questions or corrections.