The average life expectancy for the U.S. population declined for two years in a row, falling from an all-time high of 78.8 years in 2014 to 78.6 years in 2016. The most significant declines in life expectancy were seen among poor minority communities, further widening the already large disparity in health outcomes between America’s rich and poor.
Health disparities are often starker and more concentrated in urban areas, where de facto segregation separates communities along racial and financial lines. The segregation of incomes and minority populations is often strengthened by discriminatory housing policies or even physical barriers such as highways and railroads and contributes to major health disparities between rich and poor communities. The life expectancy of two adjacent neighborhoods in some cities can vary by more than 10 years.
To determine the cities with the most unequal health outcomes, 24/7 Wall St. ranked 500 U.S. cities based on geographic health disparities at the census tract level with data from the Centers for Disease Control and Prevention’s 500 Cities project.
Click here to see the full list of places with the most unequal health outcomes.
Click here to see our detailed findings and methodology.

20. Cincinnati, OH
> Total population: 298,011
> Poor physical health: 14.1%
> Adult obesity rate: 34.3%
> Median income: $34,629
Cincinnati has the some of the most unequal health outcomes compared with most U.S. cities. For example, one of the largest disparities in health outcomes is in the share of adults reporting poor mental health, defined as at least 14 days of poor mental health every month. Of the 115 census tracts in Cincinnati, the neighborhood that spans The Village of Indian Hill has the smallest share of adults reporting frequent poor mental health at just 7.2%. This is a considerably smaller share than in the neighborhood comprising the Fay Apartments housing project, where just over one in four adults report frequent poor mental health.
The large disparity in health outcomes between the two neighborhoods is likely the result of the income inequality between the two. While the typical household in The Village of Indian Hill census tract earns $165,250 a year — the highest of all Cincinnati neighborhoods — the median household income in the Fay Apartments tract is just $7,056, the second lowest in the city. More affluent regions tend to report better health outcomes because residents have better access to medical care, can afford healthy foods, and have lower stress levels than residents of poorer regions.
[in-text-ad]

19. Baltimore, MD
> Total population: 621,000
> Poor physical health: 13.4%
> Adult obesity rate: 34.0%
> Median income: $44,262
Health disparities in Baltimore parallel the area’s income disparities. In the city’s wealthiest neighborhood — the census tract outside Notre Dame of Maryland University and Loyola University Maryland — just 11.8% of adults have high blood pressure, 2.7% have diabetes, and 0.8% have had a stroke, each the smallest such share in the city. Meanwhile, in Baltimore’s poorest neighborhood — the area covering the Latrobe Homes and Somerset Courts housing projects in Old Town — 46.9% of adults have high blood pressure, 20.4% have diabetes, and 7.4% have had a stroke. Overall, the largest health outcome disparities in Baltimore are in the shares of adults with diabetes, chronic kidney disease, history of stroke, and asthma.
[recirclink id=488456]

18. Tampa, FL
> Total population: 361,477
> Poor physical health: 14.0%
> Adult obesity rate: 27.1%
> Median income: $45,874
Tampa, located on the western side of Florida, has some of the largest health and income disparities of any U.S. city. In the neighborhood of South Nebraska, where the typical household earns just $6,989 a year — the second lowest median household income in Tampa — 37.1% of people over the age of 18 have been diagnosed with diabetes and 23.8% have coronary heart disease. Meanwhile, in Golfview, the city’s wealthiest neighborhood, just 6.4% of adults have diabetes and 4.2% have coronary heart disease.
According to the Gini index, Tampa has some of the worst income inequality in the country. The wealthiest fifth of households earn 57.7% of all income in Tampa, the 11th largest share of any U.S. city. Meanwhile the poorest fifth of households earns just 2.4% of all income, one of the smallest shares.

17. Pittsburgh, PA
> Total population: 305,305
> Poor physical health: 11.7%
> Adult obesity rate: 32.2%
> Median income: $42,450
Pittsburgh reports some of the widest geographic disparities in health outcomes of any U.S. city. The largest disparities are in the shares of adults who have kidney disease, diabetes, and report poor physical health at least 14 days each month. In the healthiest census tract — the neighborhood of North Oakland, near the University of Pittsburgh — only 1.4% of adults have diabetes. This is far lower in the northern section of Larimer, the neighborhood with the highest prevalence of diabetes, where 26.5% of adults have the disease.
The disparity in the prevalence of diabetes parallels income inequality throughout the city. In the four wealthiest neighborhoods in Pittsburgh, fewer than 8% of adults have diabetes. Meanwhile, more than 18% of adults in the four poorest neighborhoods have been diagnosed with the disease.
[in-text-ad-2]

16. New Haven, CT
> Total population: 130,405
> Poor physical health: 13.0%
> Adult obesity rate: 33.1%
> Median income: $38,126
While the presence of Yale University in New Haven provides educational and employment opportunities for some of the town residents, many of those unaffiliated with the university struggle with poverty and unemployment. The income inequality has likely contributed to large health disparities in the city. In Long Wharf, the city’s poorest neighborhood, the typical household earns just $14,315 a year. Some 13.8% of adults in the neighborhood have coronary heart disease, 13.3% have COPD, and 20.8% have diabetes — each the largest share of any census tract in New Haven. Meanwhile, in Westville, the city’s wealthiest neighborhood, the typical household earns $89,353 a year, and just 5.2% of adults have coronary heart disease, 4.5% have COPD, and 9.7% have diabetes.

15. Irving, TX
> Total population: 232,013
> Poor physical health: 11.7%
> Adult obesity rate: 31.8%
> Median income: $54,868
Irving, Texas has some of the worst health disparities of any U.S. city. While there are four neighborhoods in which more than 32% of adults have high blood pressure, fewer than 17% of adults have high blood pressure in the the four healthiest neighborhoods in the city. The median household income in the four neighborhoods with the lowest prevalence of high blood pressure is at least $11,000 higher than in the four worst neighborhoods. In five city neighborhoods, arthritis afflicts more than 22% of adults, more than twice the rate of the five districts with lowest incidence of the disease.
[in-text-ad]

14. Dallas, TX
> Total population: 1.3 million
> Poor physical health: 13.7%
> Adult obesity rate: 36.4%
> Median income: $45,215
In Dallas, disparities in health outcomes largely mirror disparities in income. While in the five wealthiest neighborhoods fewer than 8% of adults are in poor physical health, more than 20% of adults in the five poorest neighborhoods report poor physical health. In the city’s wealthiest neighborhood, 29.4% of adults have high blood pressure, 3.8% have COPD, and 6.5% have poor mental health — some of the smallest shares of any Dallas census tract. Meanwhile in the city’s poorest neighborhood, 42.2% of adults have high blood pressure, 9.4% have COPD, and 16.9% have poor mental health.
Dallas has some of the worst income inequality of any major city. The wealthiest fifth households earn 58.2% of all income in the area, the eighth largest share in the country. Nationwide, the wealthiest quintile earns 51.4% of total income.
[recirclink id=488594]

13. Boston, MA
> Total population: 658,279
> Poor physical health: 10.8%
> Adult obesity rate: 21.9%
> Median income: $58,516
Some of the largest health disparities in Boston are in the prevalence among adults of high blood pressure, stroke history, poor physical, and diabetes While less than 2% of adults in two neighborhoods in the West End have diabetes, there are three census tracts in South Boston and Dorchester in which at least 22% of adults have been diagnosed with the disease.
Residents of low-income neighborhoods tend to have worse health outcomes, and income inequality can exacerbate health disparities in urban areas. According to the Gini index, Boston has the 18th worst income inequality of any city. The wealthiest fifth of households in the city earn 55.8% of all income in the area — the 27th largest share of any U.S. city — while the poorest fifth earns just 1.8% — the ninth smallest share.

12. Columbia, SC
> Total population: 132,537
> Poor physical health: 11.9%
> Adult obesity rate: 32.2%
> Median income: $42,875
The single largest health disparity among adults in Columbia, South Carolina is in the incidence of coronary heart disease. In the neighborhood encompassing the northern section of Fort Jackson, only 0.7% of adults have the disease, much less than the 11.3% of adults who have the disease in the neighborhood bound by Wilson Blvd. and Farrow Road.
Health outcome disparities in Columbia parallel the area’s income disparities. In Columbia’s wealthiest neighborhood, only 6.8% of adults have asthma and 8.3% report frequent poor mental health every month, the lowest shares of any census tract in the city.
[in-text-ad-2]

11. Richmond, VA
> Total population: 216,773
> Poor physical health: 12.1%
> Adult obesity rate: 32.0%
> Median income: $41,187
Health disparities in Richmond largely mirror the city’s disparities in income. While in the four wealthiest neighborhoods fewer than 8% of adults have diabetes, at least 20% of adults have the disease in the four poorest census tracts. In Windsor Farms, the wealthiest neighborhood in the city, just 7.1% of adults are in poor physical health. Meanwhile, in the area surrounding the Gilpin Court housing project, the poorest neighborhood in Richmond, some 23.4% of adults are in poor physical health — the largest share in the city.
According to the Gini index, Richmond has the 15th worst income inequality of any U.S. city. The wealthiest 5% of households in Richmond earn 28.5% of all income in the area — the seventh largest share of any city in the nation. The poorest 20% of households earn just 2.2% of area income, one of the smallest shares nationwide.
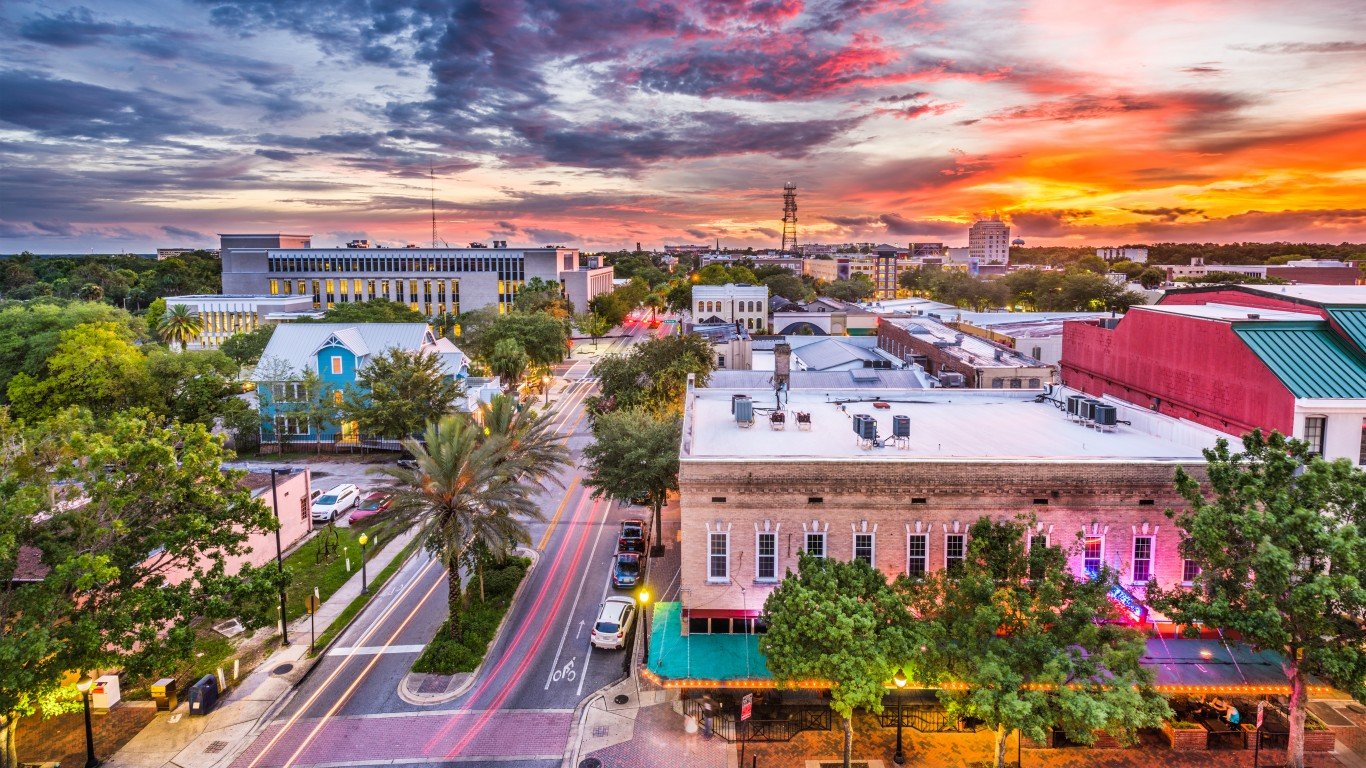
10. Gainesville, FL
> Total population: 128,610
> Poor physical health: 10.9%
> Adult obesity rate: 24.4%
> Median income: $32,716
Home to the University of Florida, Gainesville is one of many college towns with some of the worst health outcome inequality in the nation. While health disparities tend to mirror income disparities in most large cities, in Gainesville many of the neighborhoods with the lowest income report the best health outcomes. In the city’s two poorest neighborhoods — those surrounding the University of Florida, where approximately half of all residents are enrolled in college — fewer than 14% of residents over the age of 18 have high blood pressure, and less than 2% have cancer or coronary heart disease. In the city’s three wealthiest neighborhoods, however, more than 26% of adults have high blood pressure, more than 7% have cancer, and more than 5% have coronary heart disease.
[in-text-ad]
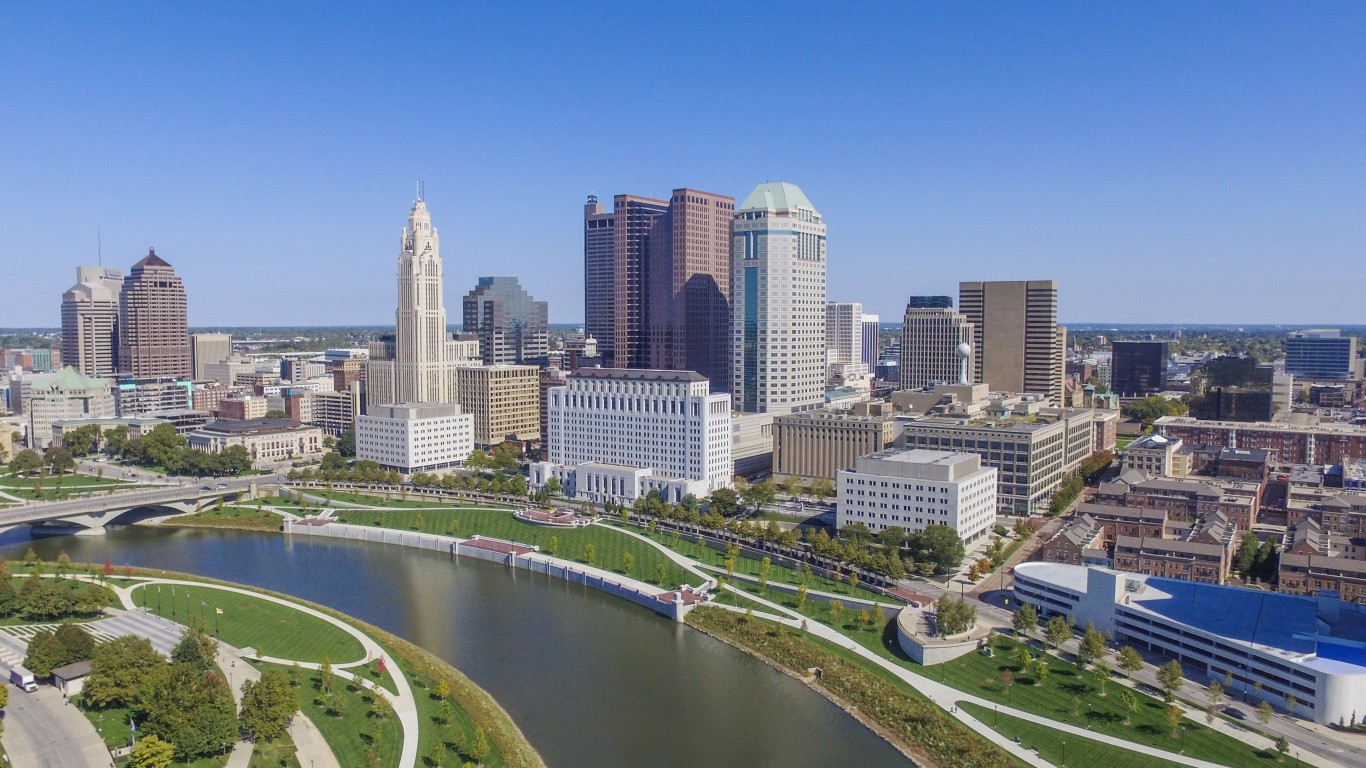
9. Columbus, OH
> Total population: 837,038
> Poor physical health: 12.1%
> Adult obesity rate: 31.5%
> Median income: $47,156
Columbus, Ohio reports some of the widest geographic disparities in health outcomes of any U.S. city. The largest disparities in the city are in the share of adults who have COPD, chronic kidney disease, history of stroke, frequent poor physical health, and coronary heart disease.
The census tract that reports the smallest share of adults with coronary heart disease, with not even a full percent of adults having the disease, is the area that spans the central part of The Ohio State University’s campus. On the other end of the spectrum, a staggering 11% of adults have coronary heart disease in the neighborhood of south Franklinton.
[recirclink id=488561]
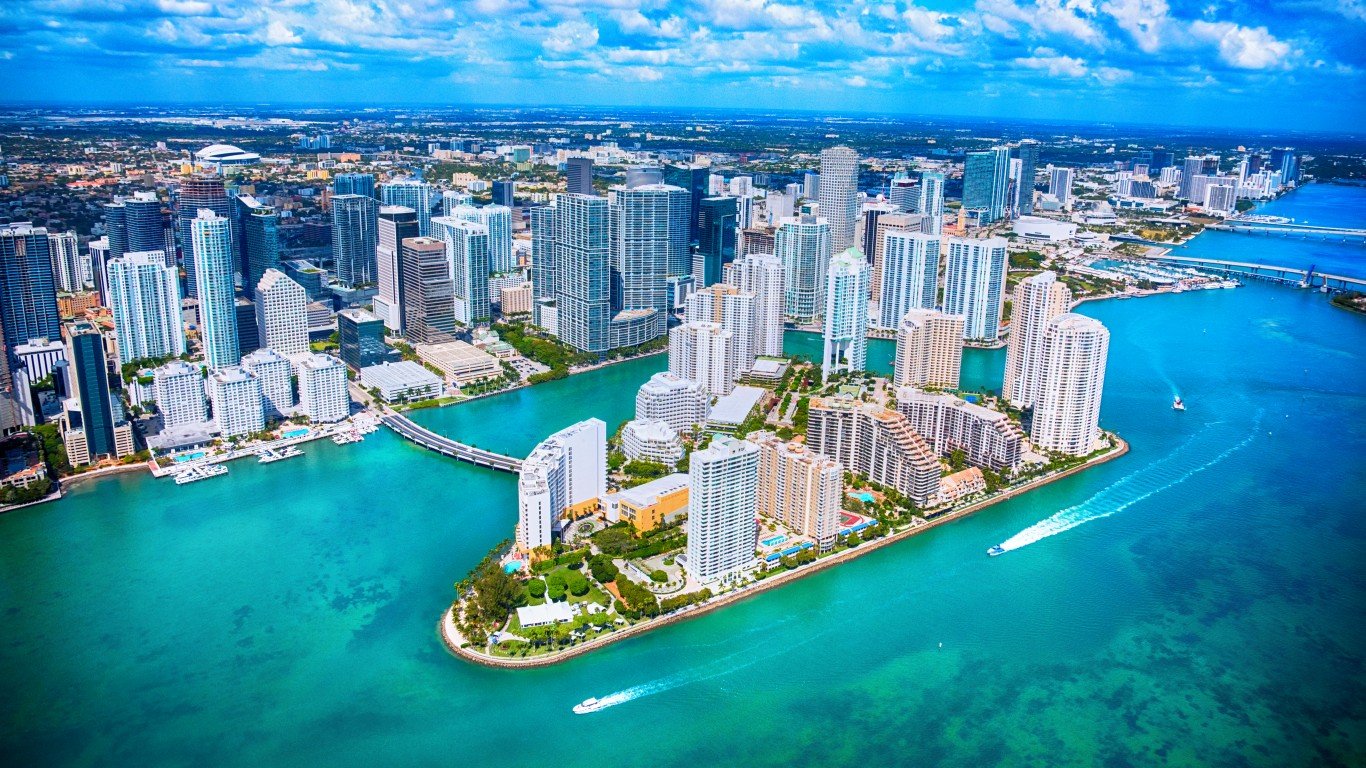
8. Miami, FL
> Total population: 432,622
> Poor physical health: 17.0%
> Adult obesity rate: 29.7%
> Median income: $31,642
According to the Gini index, Miami has the fourth worst income inequality of any city. The wealthiest fifth of households earn some 60.0% of all income, the third largest share of all U.S. cities. Income inequality can contribute to health disparities in urban areas, as residents of low-income neighborhoods tend to have worse health behaviors, less access to medical care, and worse health outcomes overall.
The health disparities in Miami are some of the largest in the country and parallel the city’s income inequities. While the share of adults in poor physical health is 10% or lower in the city’s five wealthiest neighborhoods, it is at least 20% in the five poorest neighborhoods. In Coconut Grove, the wealthiest neighborhood, the share of adults with heart disease, diabetes, and chronic kidney disease is less than half of that in Miami’s poorest neighborhood, a stretch of land between Dolphin Expressway and Miami River.

7. Jacksonville, NC
> Total population: 68,404
> Poor physical health: 9.5%
> Adult obesity rate: 25.9%
> Median income: $41,095
Jacksonville is one of several military towns among the cities with the largest health disparities. In the neighborhood surrounding Camp Lejeune, the U.S Marine Corps base and training facility, the incidence of coronary heart disease, chronic kidney disease, cancer, and stroke is all less than 1% — some of the smallest shares in the city. Meanwhile, the census tract encompassing the neighborhoods of New River and Bell Fork ranks among the worst in the prevalence of adults who have asthma, coronary heart disease, COPD, diabetes, chronic kidney disease, history of stroke, report frequent poor mental health days. The median household income in this district is $24,760 a year, the lowest of the 16 census tracts in Jacksonville.
[in-text-ad-2]

6. Washington, D.C.
> Total population: 659,009
> Poor physical health: 10.0%
> Adult obesity rate: 24.9%
> Median income: $72,935
Washington, D.C. has some of the starkest health disparities between rich and poor. While the four wealthiest neighborhoods in the city — in the northwestern section of the city near the Maryland border, where the typical household earns more than $200,000 a year — the share of adults reporting COPD is 4% or less, and the share adults reporting poor mental health is 10% or less. In the four poorest neighborhoods — mostly located around the Anacostia neighborhood in the southeastern section of the city — at least 7% of adults have COPD, and at least 18% have poor mental health. D.C. also has the widest disparity in the share of adults who smoke, engage in physical activity, are obese, and receive less than seven hours of sleep a night of any U.S. city.
According to the Gini index, the nation’s capital has the 24th worst income inequality of any city. The poorest fifth of households earn just 1.8% of all income, the smallest share of all but nine U.S. cities.

5. Chicago, IL
> Total population: 2.7 million
> Poor physical health: 12.2%
> Adult obesity rate: 33.5%
> Median income: $50,434
While fewer than 5% of adults in Chicago’s three wealthiest neighborhoods report being in poor physical health, more than 20% of adults in the city’s three poorest neighborhoods report poor physical health. The share of adults with high blood pressure, coronary heart disease, COPD, diabetes, chronic kidney disease and stroke is more than four times greater in Chicago’s poorest neighborhood — in the city’s South Side — than it is in Chicago’s wealthiest neighborhood, the area encompassing Grant Park and the Art Institute of Chicago.
In Chicago, the richest fifth households control 55.3% of the wealth, one of the largest shares of any city. The poorest fifth control just 2.3% of the area’s wealth, one of the smallest shares.
[in-text-ad]
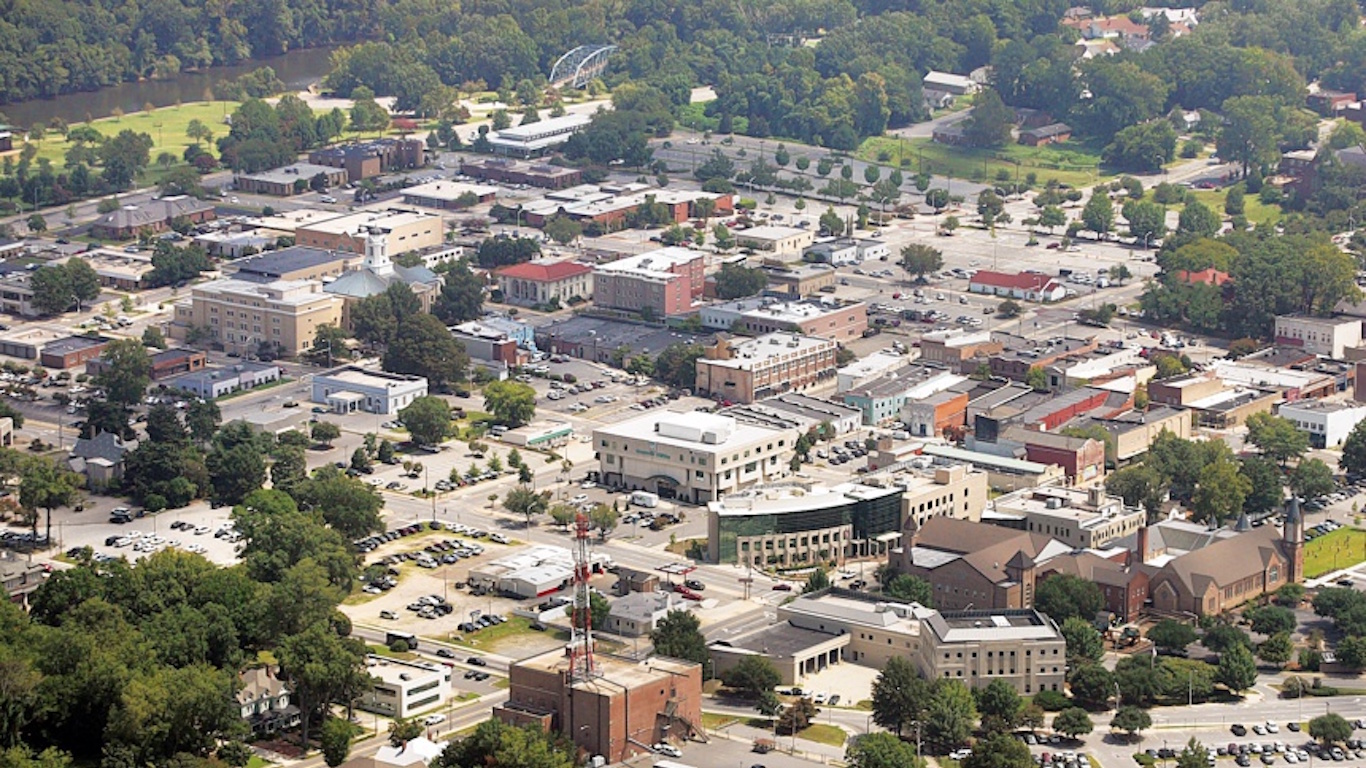
4. Greenville, NC
> Total population: 89,745
> Poor physical health: 11.5%
> Adult obesity rate: 27.3%
> Median income: $35,069
Greenville has some of the widest neighborhood-level health disparities of any city. Some of the largest disparities in the city are in the shares of adults with high blood pressure, chronic kidney disease, history of stroke, and diabetes. While just 2.0% of adults have been diagnosed with diabetes in the healthiest neighborhood in Greenville, 22.8% of adults in the city’s least healthy neighborhood have the disease.
The high income inequality in Greenville likely contributes to the area’s health inequities. According to the Gini index, which measures income of inequality, Greenville has the 20th most uneven distribution of income in the country. The wealthiest fifth of households earn 56.6% of all income, while the poorest fifth earn just 2.3%. Nationwide, the wealthiest fifth of U.S. households earn 51.4% of income, and the poorest fifth earns 3.2%.
[recirclink id=488514]

3. Atlanta, GA
> Total population: 456,378
> Poor physical health: 11.4%
> Adult obesity rate: 30.7%
> Median income: $49,398
Atlanta has the third most unequal health outcomes of any city. Some of the most significant health disparities in the capital of Georgia are in the shares of adults who have diabetes, chronic kidney disease, history of stroke, asthma, high blood pressure, COPD, and poor mental health. The wealthiest neighborhood in Atlanta reports some of the best health outcomes, while the poorest reports some of the worst. For example, less than 2.5% of adults in the Paces neighborhood in the Buckhead district — the wealthiest census tract in Atlanta — have chronic kidney disease and history of stroke. Whereas, 6.7% of adults have a history of stroke and 4.3% have chronic kidney disease in Marietta Street Artery, the poorest neighborhood in the city.
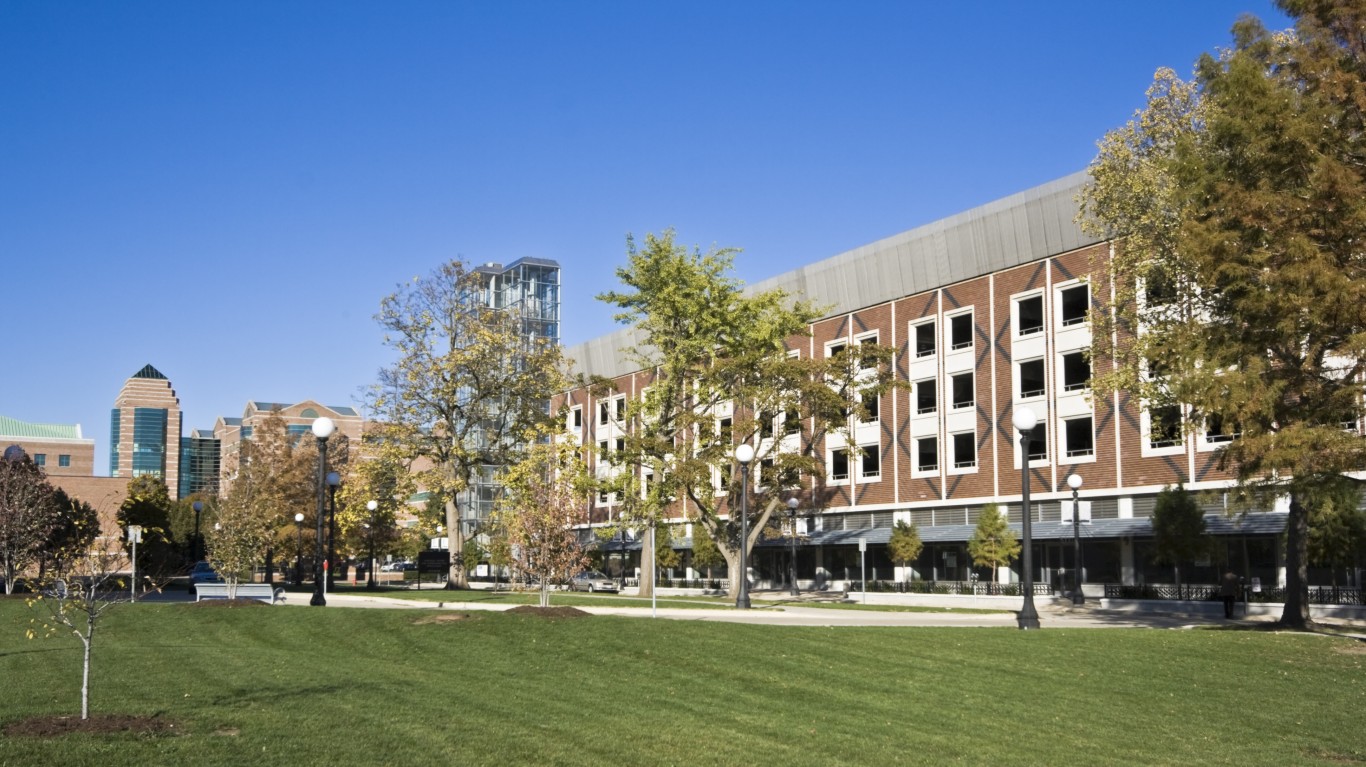
2. Champaign, IL
> Total population: 84,672
> Poor physical health: 9.4%
> Adult obesity rate: 27.8%
> Median income: $45,198
Champaign has the widest disparities in health outcomes of all but one U.S. city. The largest disparities in the city are in the shares of adults who have arthritis, high blood pressure, cancer, coronary heart disease, diabetes, history of stroke, and poor mental health. Among the five wealthiest neighborhoods in Champaign only 7.6% to 8.9% of adults report frequent poor mental health. In the city’s five poorest neighborhoods, a much higher 14.0% to 19.4% of adults report such frequent poor mental health.
In Champaign, there is a high degree of income disparity as well. According to the Gini index, which measures income inequality, Champaign has the 27th most uneven distribution of income in the country. The wealthiest fifth of households earn 55.2% of all income, while the poorest fifth earn just 1.6%. Nationwide, the wealthiest quintile earns 51.4% of income, and the poorest quintile earns 3.2%.
[in-text-ad-2]
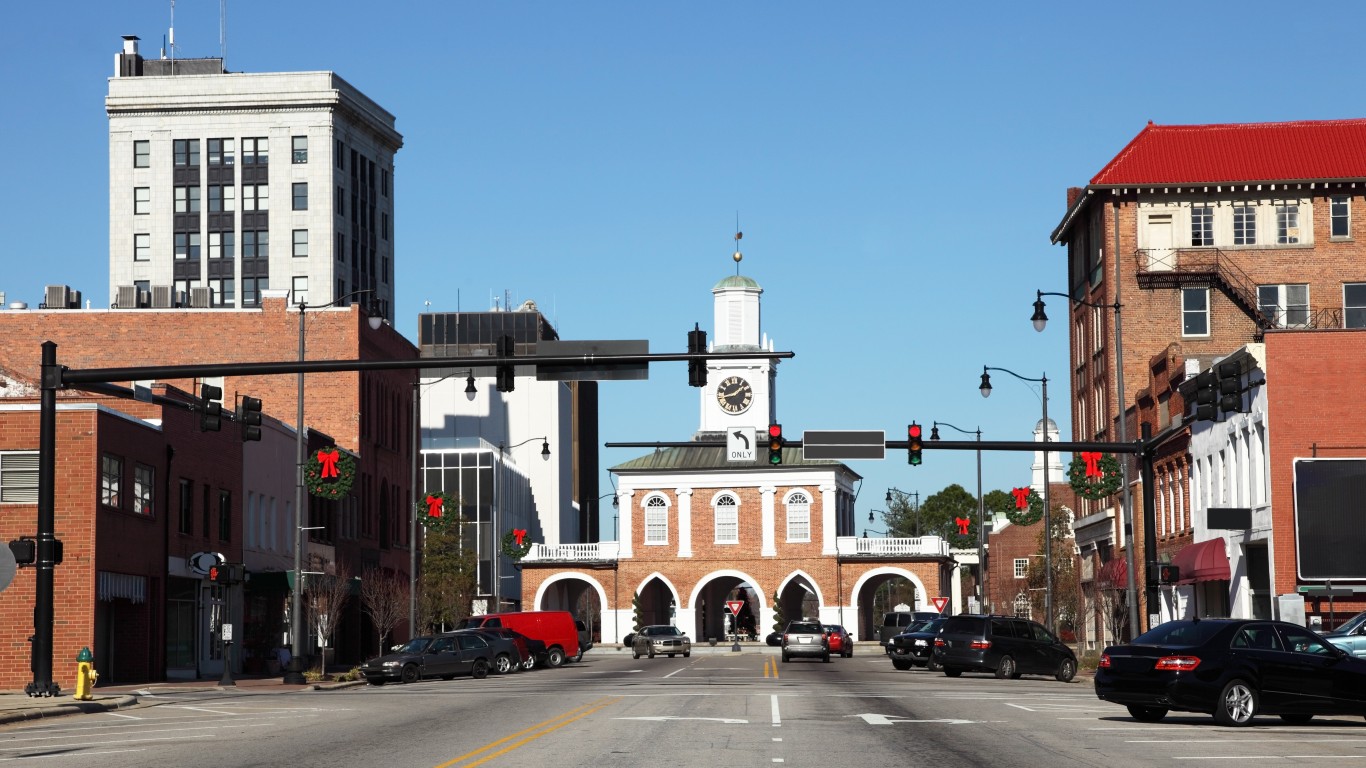
1. Fayetteville, NC
> Total population: 203,670
> Poor physical health: 12.4%
> Adult obesity rate: 32.8%
> Median income: $43,882
Fayetteville is one of several military towns among the cities with the largest health disparities. In the neighborhood surrounding Fort Bragg, the largest military installation in the world by population, the incidence of coronary heart disease, chronic kidney disease, cancer, and stroke is all less than 1% — some of the smallest shares in the city.
Meanwhile, in the census tract encompassing the area between Legion Road and I-95 near Fayetteville Regional Airport, a whopping 19.1% of adults have heart disease, 23.9% have diabetes, 13.4% have diabetes, 7.2% have chronic kidney disease, and 10.9% have had a stroke — each the largest share of any census tract in the city.
Detailed Findings
Disparities in health tend to mirror disparities in income. Individuals with lower incomes have less access to health care, less money to spend on healthy food, are less likely to have leisure time for exercise, and tend to have worse health outcomes overall. Breaking the poverty cycle tends to be more difficult in dense, urban areas, where the concentration of low-income residents in poor communities is greater and poor residents face additional barriers to upward mobility.
In nearly every city on this list, the five wealthiest census tracts are in the 90th percentile for a majority of health outcomes. In Chicago, for example, fewer than 5% of adults in the three wealthiest neighborhoods — along the Gold Coast and Near North Side — report being in poor physical health, while more than 20% of adults in the three poorest neighborhoods — in Chicago’s South Side — report poor physical health. The health outcomes that correlate the most with income at the census tract level are the shares of adults with poor mental health, with poor physical health, with asthma, and with chronic obstructive pulmonary disease.
Cities with the most unequal health outcomes tend to have the most income inequality overall. In 16 of the 20 cities with the greatest disparities in health outcomes, income inequality — as measured by the Gini index — is worse than it is nationwide. In those 16 cities, the share of income earned by the wealthiest fifth of households is greater than the 51.4% national share, and the share of income earned by the poorest quintile is smaller than the 3.2% national figure.
Many of the cities with most unequal health outcomes are college towns. While the presence of a university provides educational and employment opportunities for many residents, the economic benefits rarely extend to the city’s poorer residents. The income gap between wealthy college students and faculty and the city’s low-income residents can create large health disparities. In three cities on this list — Champaign, Illinois; Greenville, North Carolina; and Gainesville, Florida, more than one in four residents is enrolled in college.
Disparities in health outcomes also tend to parallel disparities in health behaviors. On the census tract level, the health outcomes that are the most correlated with smoking are the prevalence of poor mental health, asthma, and COPD. Health outcomes that correlate the most with the lack of physical activity are poor physical health and diabetes.
Methodology
To determine the places with the most unequal health outcomes, 24/7 Wall St. ranked 500 cities based on geographic health disparities at the census tract level with data from the Centers for Disease Control and Prevention’s 500 Cities project. The rank was based on the ratio of census tracts at the 90th percentile to census tracts at the 10th percentile in each city for 11 adult health outcomes: the prevalence of arthritis, high blood pressure, cancer, asthma, coronary heart disease, chronic obstructive pulmonary disease, diagnosed diabetes, chronic kidney disease, poor mental health for at least 14 days a month, poor physical health for at least 14 days a month, and stroke. The 90/10 ratio for each health outcome was normalized using min-max normalization and combined into a final index at full weight. Data on population, median household income, college enrollment, Gini index, and the share of income earned by the wealthiest and poorest quintile of households came from the U.S. Census Bureau’s American Community Survey and are five-year averages for the period 2011 to 2016.
Contact [email protected] for any questions or corrections.