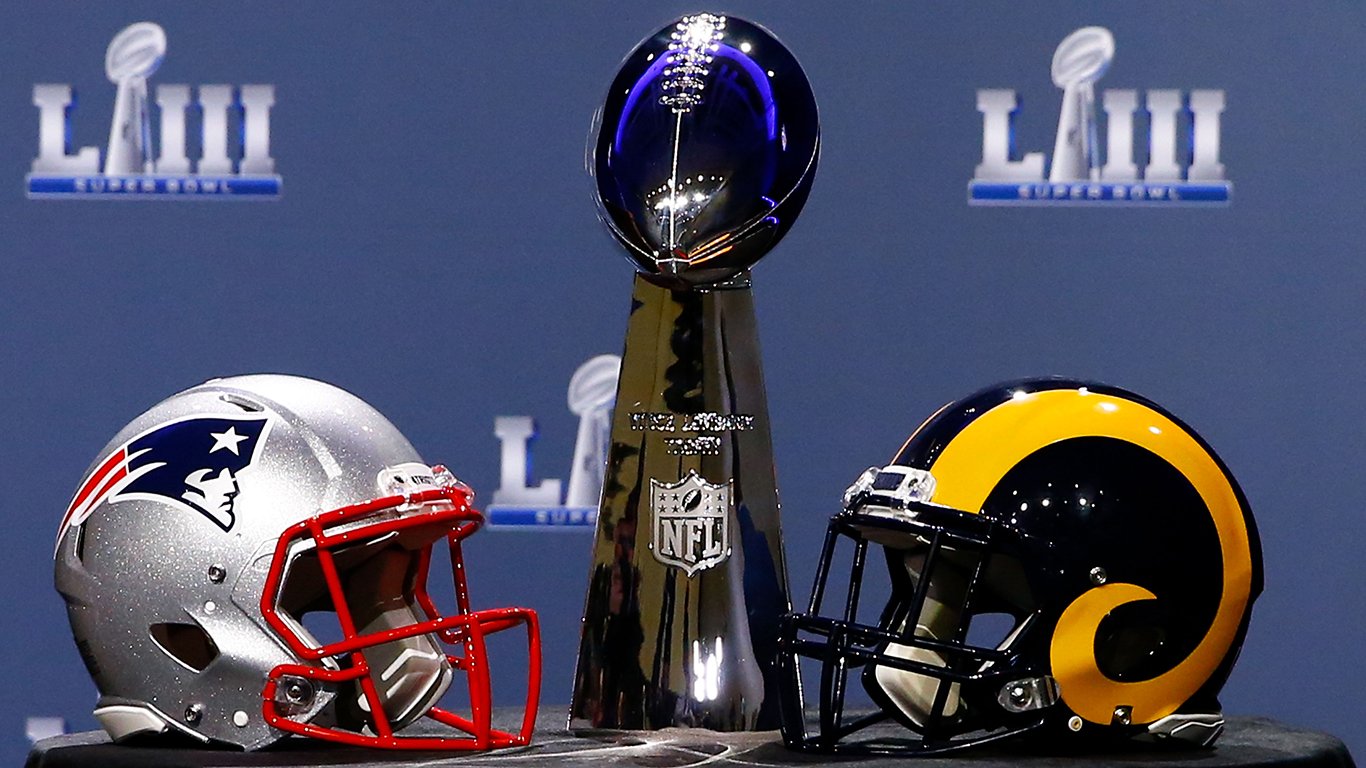
Five months of football and emotional highs and lows all come down to the night of the big game on Feb. 3. Some elements may be surprising, such as the Los Angeles Rams playing in the Super Bowl, while others not so much — the Patriots made it again.
So unless you’re from Boston or L.A., or support or strongly oppose either team (read: the Pats), that last night of the season is not about who is going to bring home the Vince Lombardi Trophy, but how much fun you’re going to have while watching them do it.
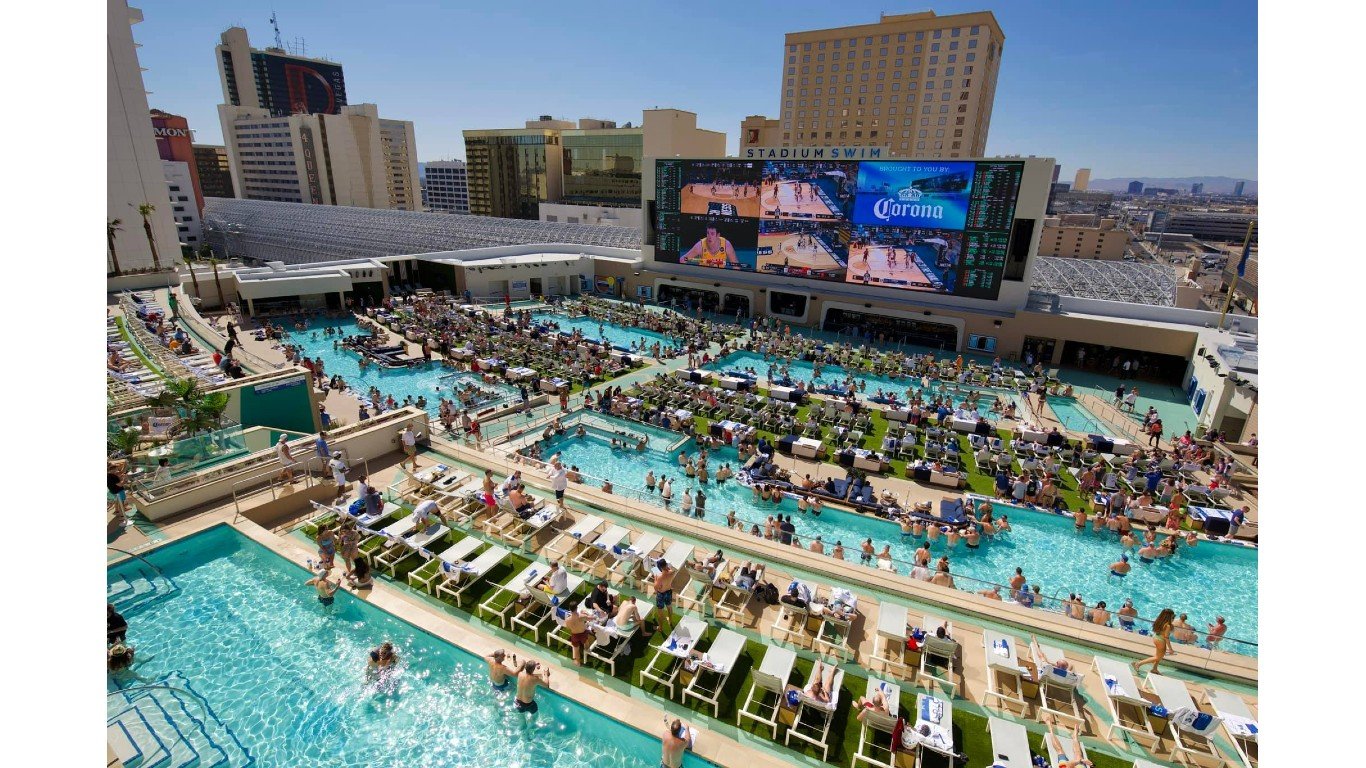
Even though sinking into your couch at home alone while eating chicken wings and laughing at the commercials sounds alluring, don’t fall for it. It’s Super Bowl Sunday! Have fun like a champion: go out and meet some people. To help you out, we identified the best cities for watching the Super Bowl based on how likely you are to be surrounded by enthusiastic fans.
It’s difficult to measure fun because it varies from person to person. But being around people who love the sport and care about their team can play a significant role into how entertaining the experience is.
Quantifying fans’ enthusiasm is tricky because it can drastically change with a single game. Take New Orleans, for example. It made it to the top three best cities to watch the Super Bowl this year because of its historically strong fanbase; a team that performs among the best year after year, and hosting the big game several times. This year, however, following the Saints’ controversial NFC championship loss, it may not be as much fun.
Locals and the team feel a bad call benefitting the Rams stripped the Saints of a chance to play in Super Bowl LII. So, as a boycott, many bars and restaurants will not be broadcasting the Rams-Pats game and will be replaying the 2010 Super Bowl — when the Saints won.
To identify the best cities to watch the Super Bowl this year, 24/7 Wall St. created an index of three factors in the 30 cities that have at least one professional football team. The index consists of: The home team stadium attendance — data for the 2018/2019 season came from ESPN; the share of each city’s local population watching their team’s game on TV during the first six weeks of the season — data for this season came from marketing research company TVB; and the average review out of 5 of all sports bars in each city — data was obtained from Yelp.
Each index range is on a scale of 0 to 1 based on minimum and maximum values. A geometric mean was then calculated based on the index value for each respective city. The higher the geometric mean value, the higher the overall ranking.
Each city’s population was obtained from the U.S. Census Bureau’s 2017 American Community Survey.
Click here to read about the best cities to watch the Super Bowl.
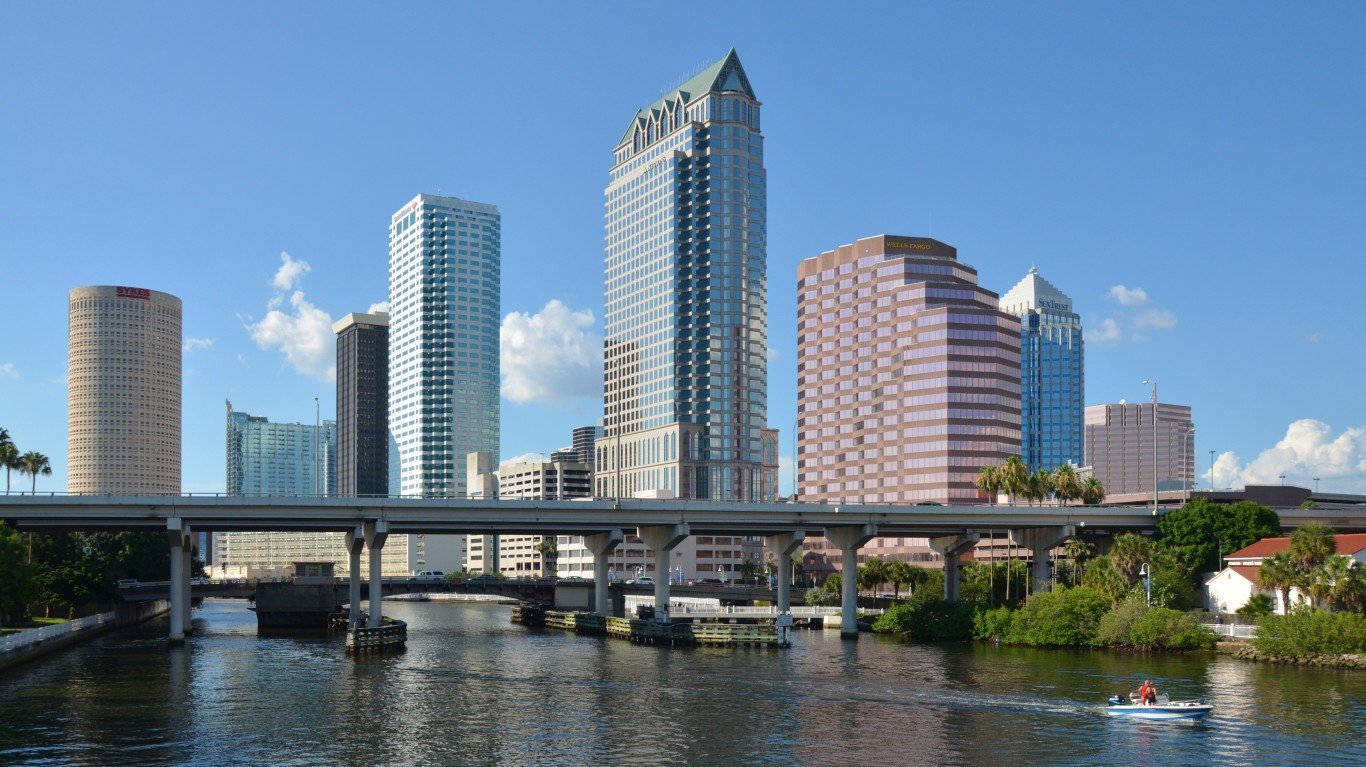
24. Tampa, Florida
> Home team stadium attendance: 82.8%
> Avg. review of sports bars on Yelp: 3.39
> Team’s avg. local TV viewership ratings: 18.6%
> 2017 Population: 385,430
[in-text-ad]

23. Houston, Texas
> Home team stadium attendance: 99.7%
> Avg. review of sports bars on Yelp: 3.16
> Team’s avg. local TV viewership ratings: 23.5%
> 2017 Population: 2,312,717
[recirclink id=488456]
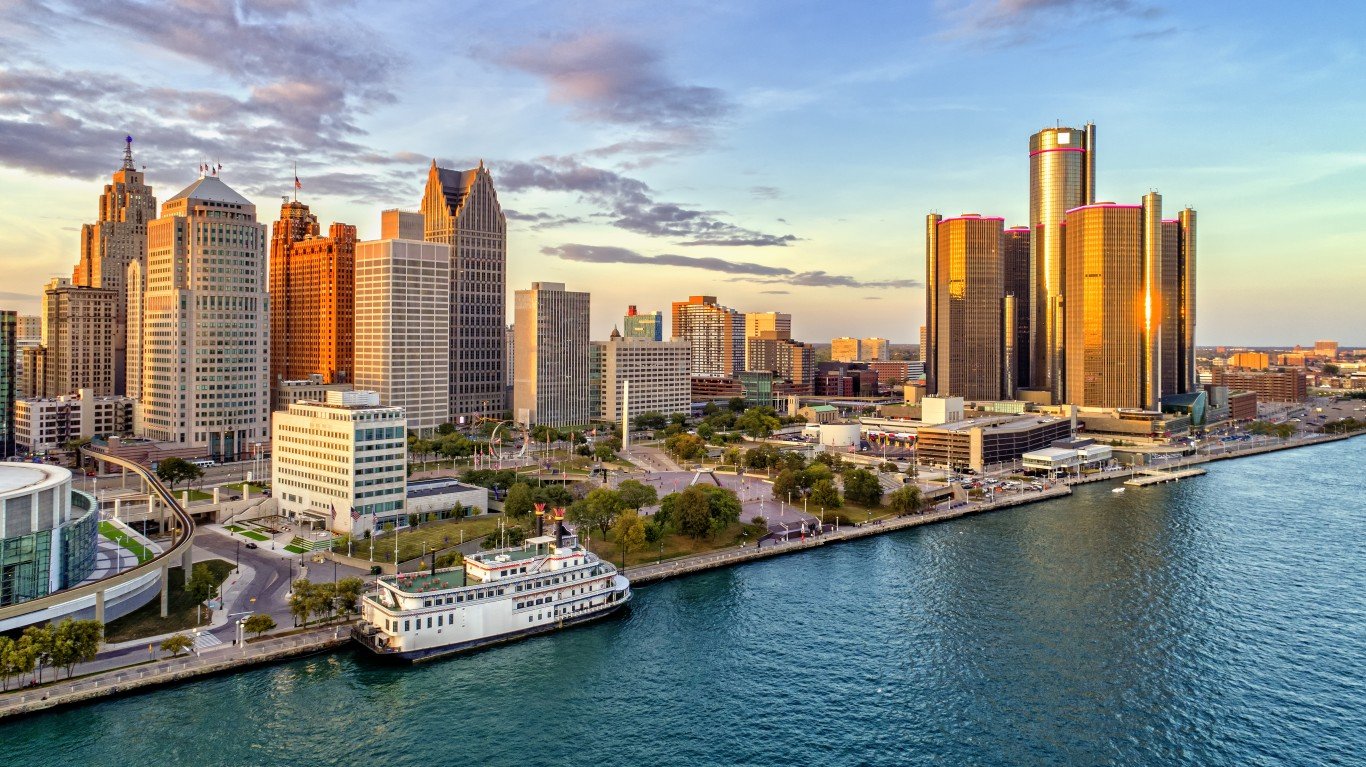
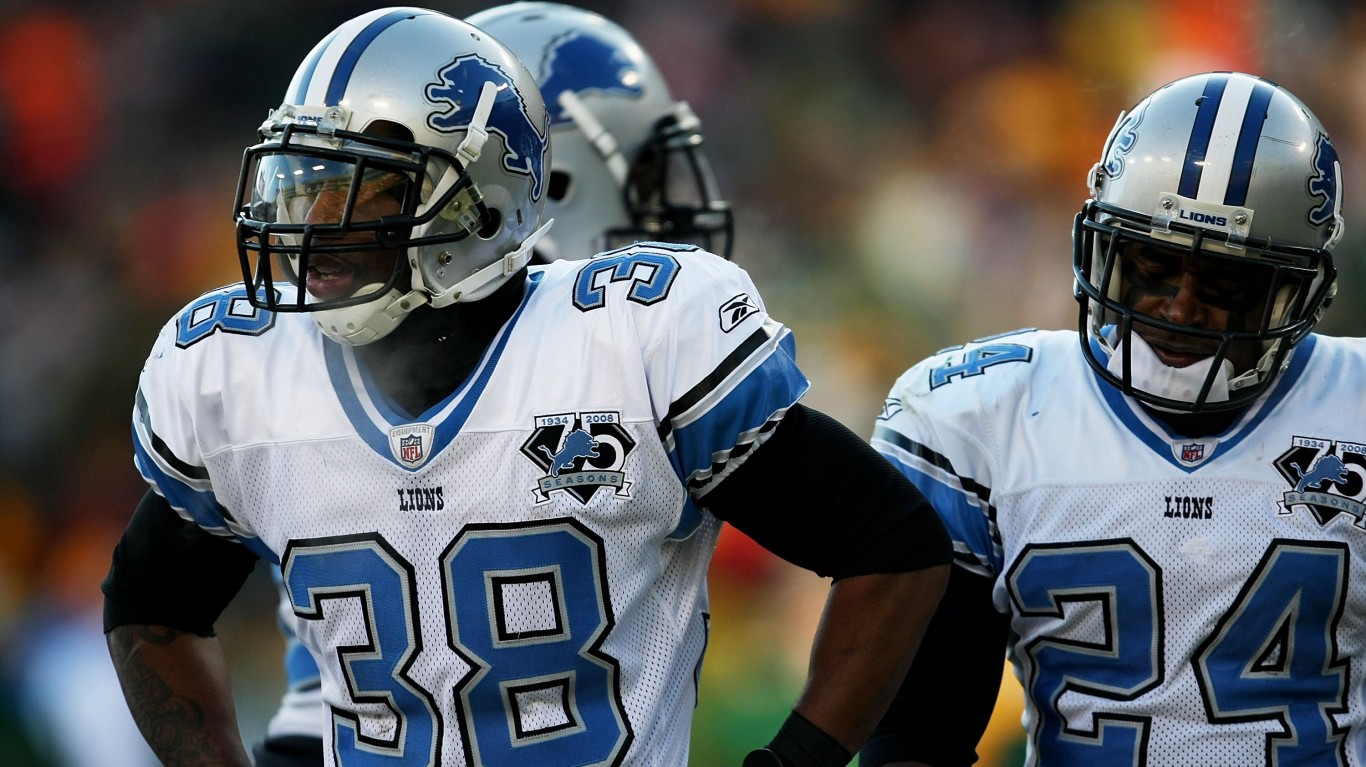
22. Detroit, Michigan
> Home team stadium attendance: 97.4%
> Avg. review of sports bars on Yelp: 3.20
> Team’s avg. local TV viewership ratings: 22.0%
> 2017 Population: 673,104

21. Phoenix, Arizona
> Home team stadium attendance: 95.4%
> Avg. review of sports bars on Yelp: 3.33
> Team’s avg. local TV viewership ratings: 17.3%
> 2017 Population: 1,626,078
[in-text-ad-2]

20. Atlanta, Georgia
> Home team stadium attendance: 97.2%
> Avg. review of sports bars on Yelp: 3.30
> Team’s avg. local TV viewership ratings: 18.0%
> 2017 Population: 486,290

19. Indianapolis, Indiana
> Home team stadium attendance: 94.0%
> Avg. review of sports bars on Yelp: 3.33
> Team’s avg. local TV viewership ratings: 24.1%
> 2017 Population: 863,002
[in-text-ad]
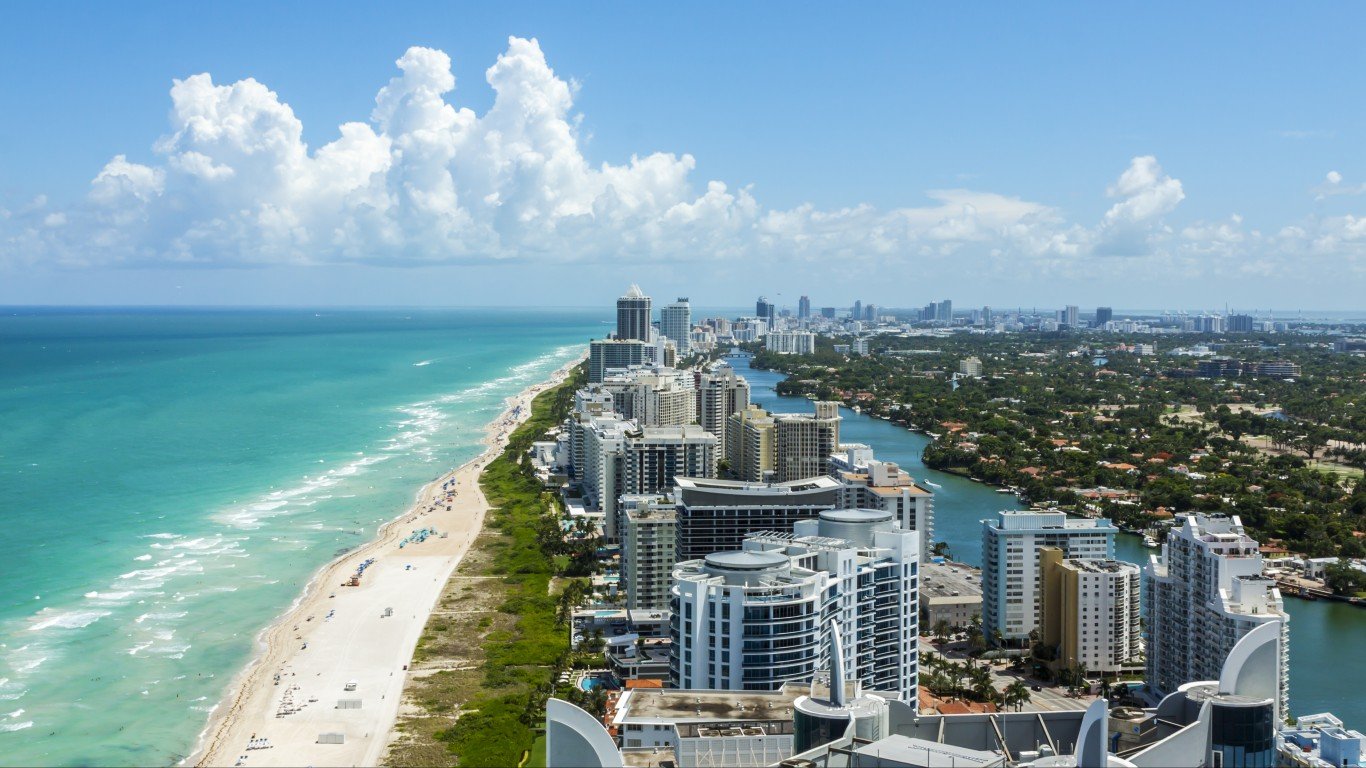
18. Miami, Florida
> Home team stadium attendance: 101.2%
> Avg. review of sports bars on Yelp: 3.59
> Team’s avg. local TV viewership ratings: 14.0%
> 2017 Population: 463,347
[recirclink id=488594]

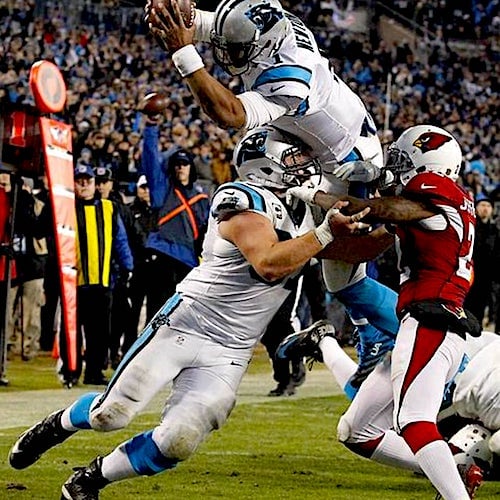
17. Charlotte, North Carolina
> Home team stadium attendance: 100.0%
> Avg. review of sports bars on Yelp: 3.28
> Team’s avg. local TV viewership ratings: 23.2%
> 2017 Population: 859,035

16. San Francisco, California
> Home team stadium attendance: 100.9%
> Avg. review of sports bars on Yelp: 3.73
> Team’s avg. local TV viewership ratings: 13.0%
> 2017 Population: 884,363
[in-text-ad-2]

15. Boston, Massachusetts
> Home team stadium attendance: 100.0%
> Avg. review of sports bars on Yelp: 3.21
> Team’s avg. local TV viewership ratings: 32.7%
> 2017 Population: 685,094

14. Buffalo, New York
> Home team stadium attendance: 90.4%
> Avg. review of sports bars on Yelp: 3.30
> Team’s avg. local TV viewership ratings: 34.9%
> 2017 Population: 258,612
[in-text-ad]

13. Nashville, Tennessee
> Home team stadium attendance: 93.3%
> Avg. review of sports bars on Yelp: 3.49
> Team’s avg. local TV viewership ratings: 22.0%
> 2017 Population: 667,560
[recirclink id=488561]

12. Dallas, Texas
> Home team stadium attendance: 91.6%
> Avg. review of sports bars on Yelp: 3.49
> Team’s avg. local TV viewership ratings: 29.7%
> 2017 Population: 1,341,075

11. Philadelphia, Pennsylvania
> Home team stadium attendance: 100.1%
> Avg. review of sports bars on Yelp: 3.37
> Team’s avg. local TV viewership ratings: 28.1%
> 2017 Population: 1,580,863
[in-text-ad-2]

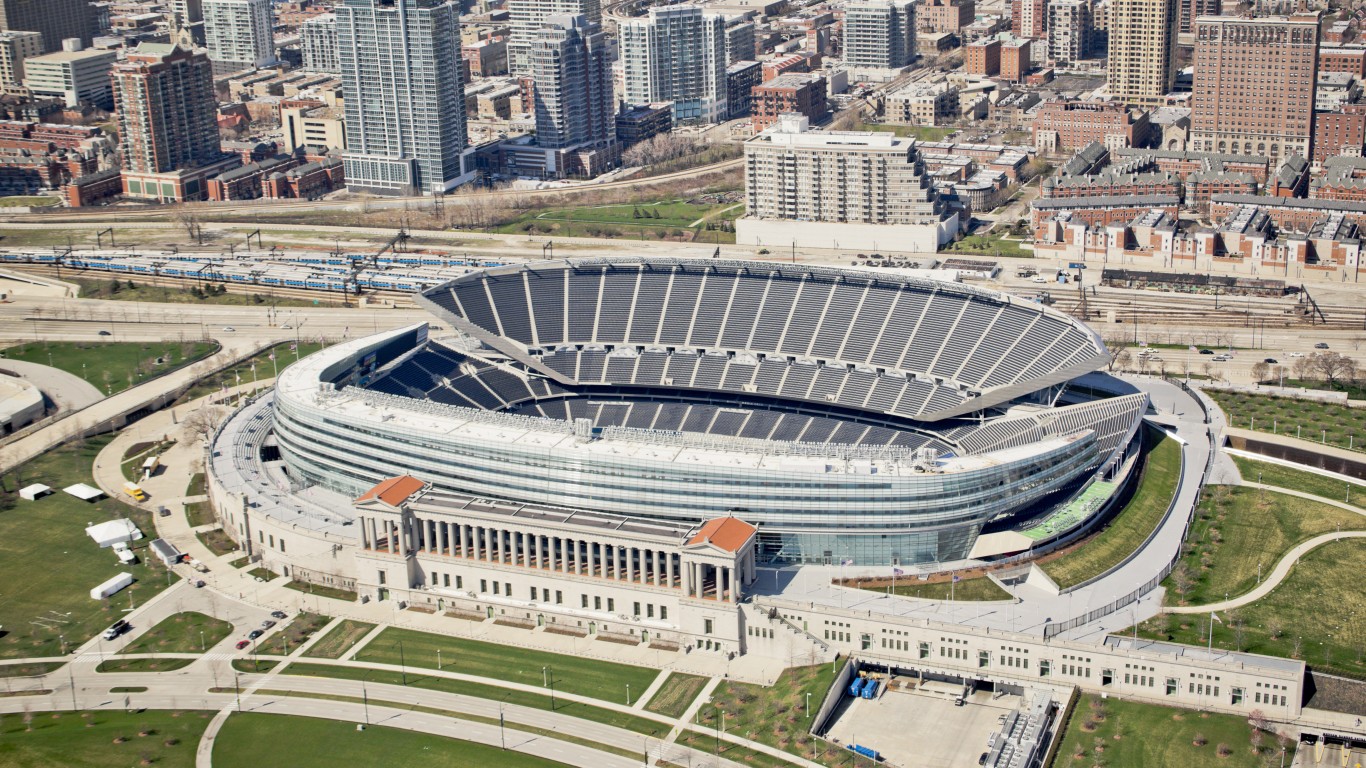
10. Chicago, Illinois
> Home team stadium attendance: 100.5%
> Avg. review of sports bars on Yelp: 3.39
> Team’s avg. local TV viewership ratings: 26.8%
> 2017 Population: 2,716,450

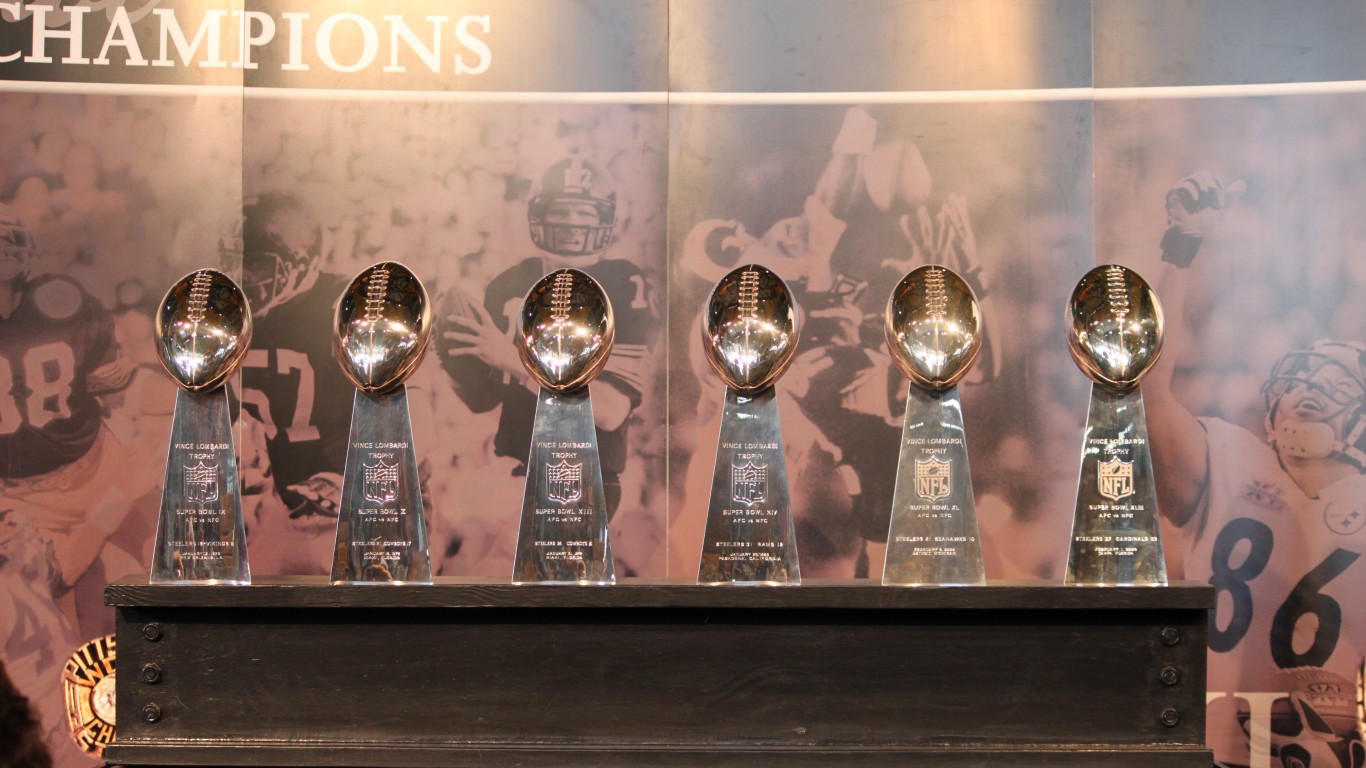
9. Pittsburgh, Pennsylvania
> Home team stadium attendance: 92.8%
> Avg. review of sports bars on Yelp: 3.41
> Team’s avg. local TV viewership ratings: 39.3%
> 2017 Population: 302,407
[in-text-ad]

8. Minneapolis, Minnesota
> Home team stadium attendance: 99.9%
> Avg. review of sports bars on Yelp: 3.34
> Team’s avg. local TV viewership ratings: 36.5%
> 2017 Population: 422,331
[recirclink id=488514]

7. Kansas City, Missouri
> Home team stadium attendance: 99.4%
> Avg. review of sports bars on Yelp: 3.32
> Team’s avg. local TV viewership ratings: 38.7%
> 2017 Population: 488,943

6. Cleveland, Ohio
> Home team stadium attendance: 97.5%
> Avg. review of sports bars on Yelp: 3.45
> Team’s avg. local TV viewership ratings: 33.0%
> 2017 Population: 385,525
[in-text-ad-2]

5. Baltimore, Maryland
> Home team stadium attendance: 99.2%
> Avg. review of sports bars on Yelp: 3.56
> Team’s avg. local TV viewership ratings: 27.4%
> 2017 Population: 611,648

4. Milwaukee, Wisconsin
> Home team stadium attendance: 95.6%
> Avg. review of sports bars on Yelp: 3.43
> Team’s avg. local TV viewership ratings: 38.8%
> 2017 Population: 595,351
[in-text-ad]
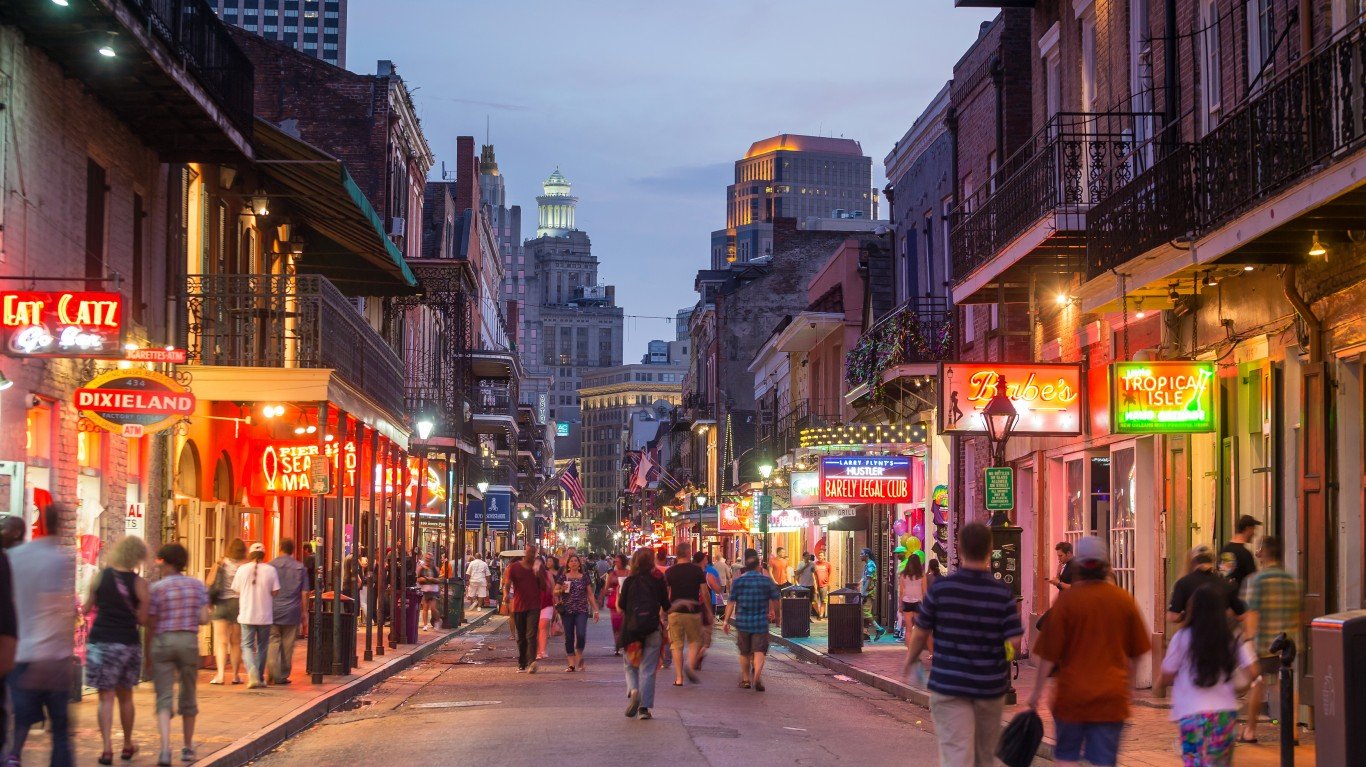
3. New Orleans, Louisiana
> Home team stadium attendance: 100.1%
> Avg. review of sports bars on Yelp: 3.35
> Team’s avg. local TV viewership ratings: 40.9%
> 2017 Population: 393,292
[recirclink id=488498]

2. Seattle, Washington
> Home team stadium attendance: 100.4%
> Avg. review of sports bars on Yelp: 3.49
> Team’s avg. local TV viewership ratings: 30.5%
> 2017 Population: 724,745

1. Denver, Colorado
> Home team stadium attendance: 100.4%
> Avg. review of sports bars on Yelp: 3.56
> Team’s avg. local TV viewership ratings: 27.8%
> 2017 Population: 704,621
Contact [email protected] for any questions or corrections.