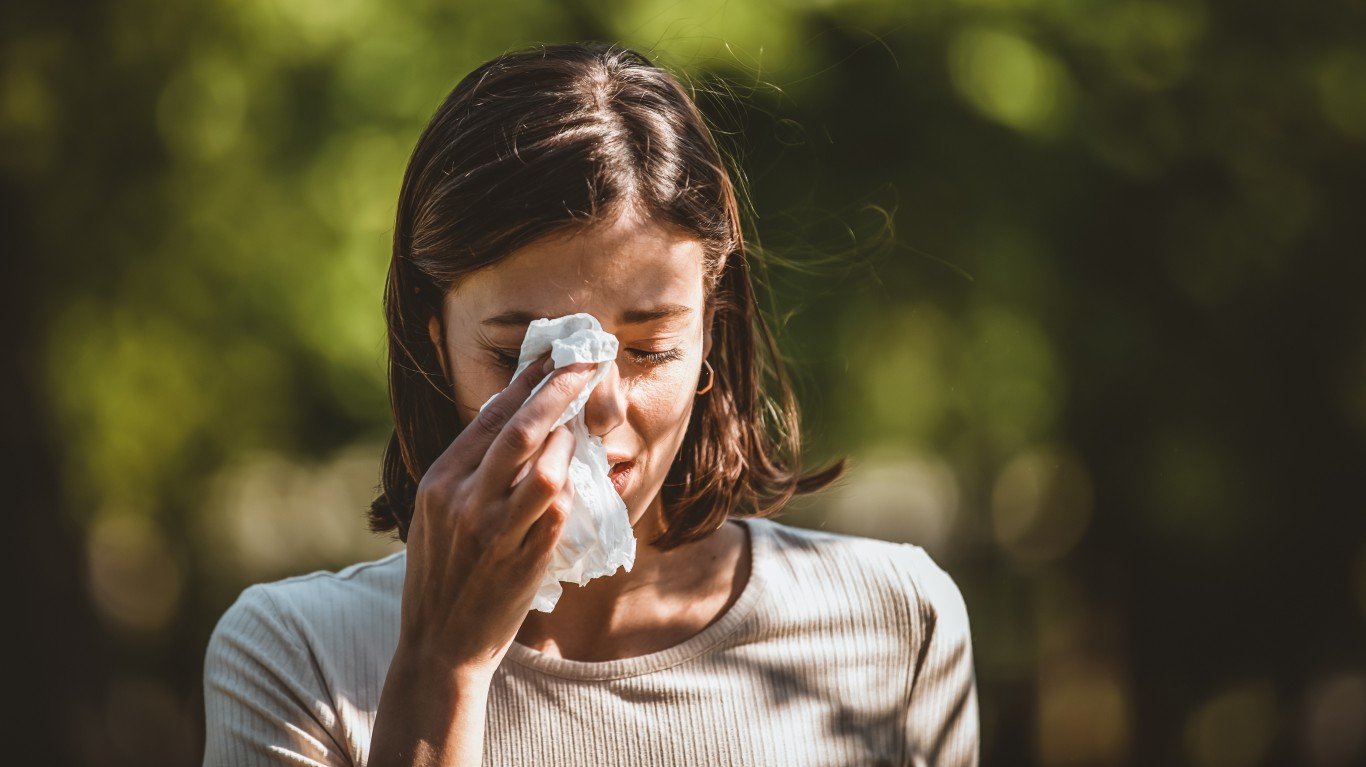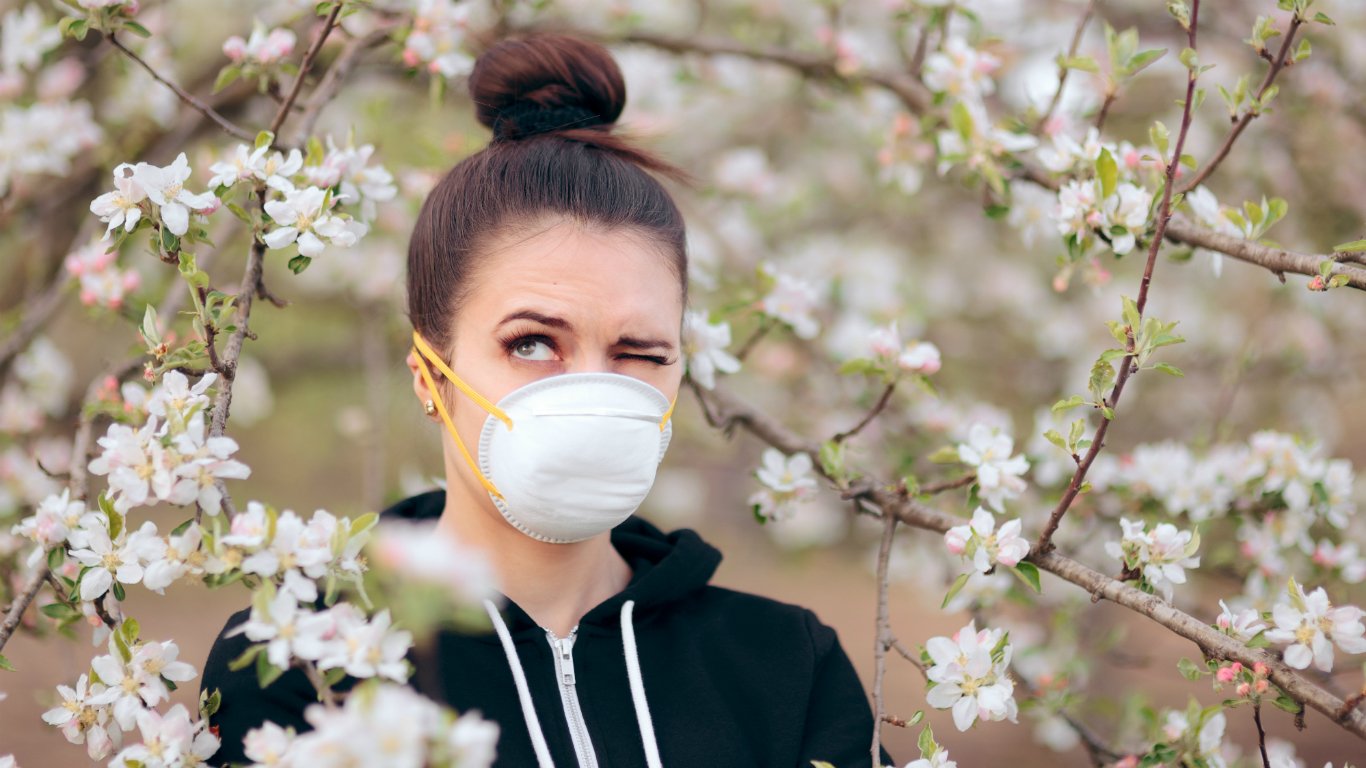
The trees will soon be blossoming, spring flowers will decorate parks, and green grass will make everything look more pleasant. Most people cannot wait to see signs of spring. For the 25 million Americans who suffer from seasonal allergies, however, this excitement about spring is joined by some unpleasant side effects.
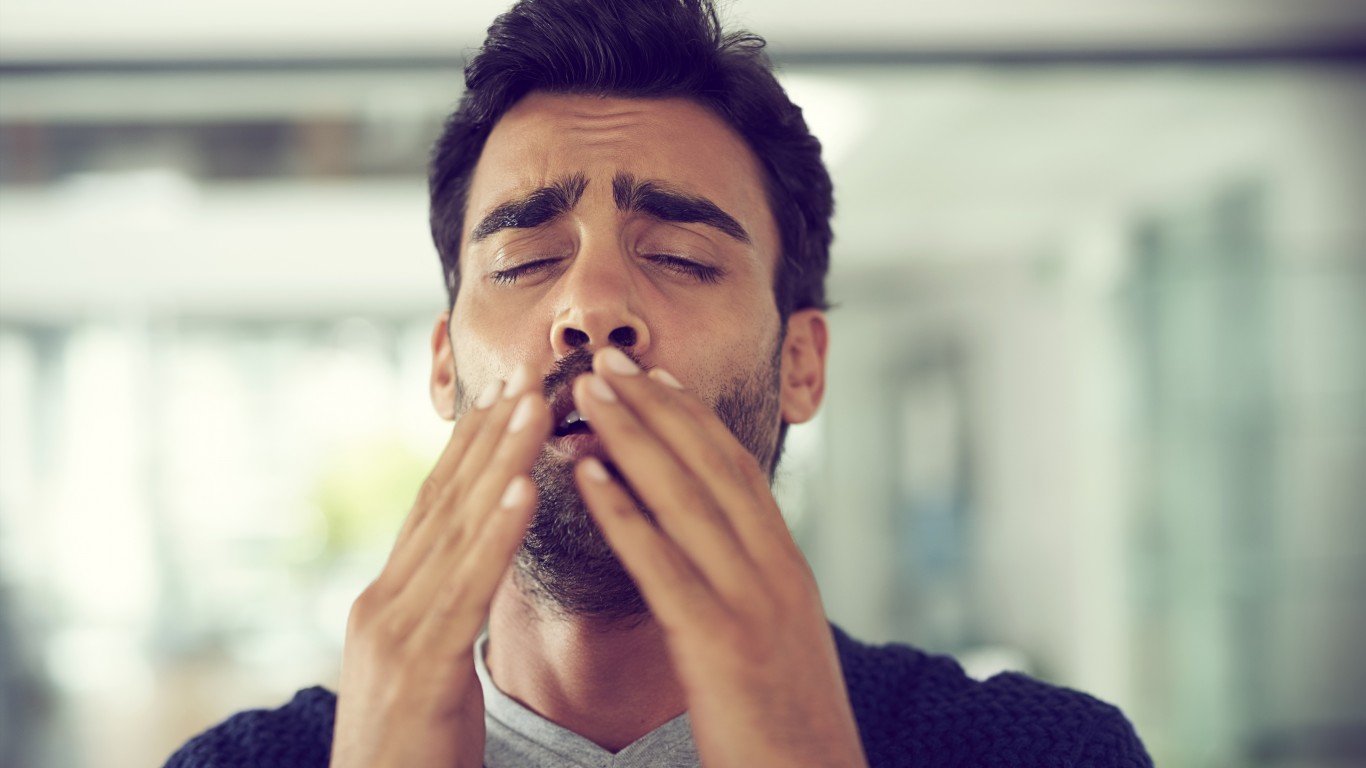
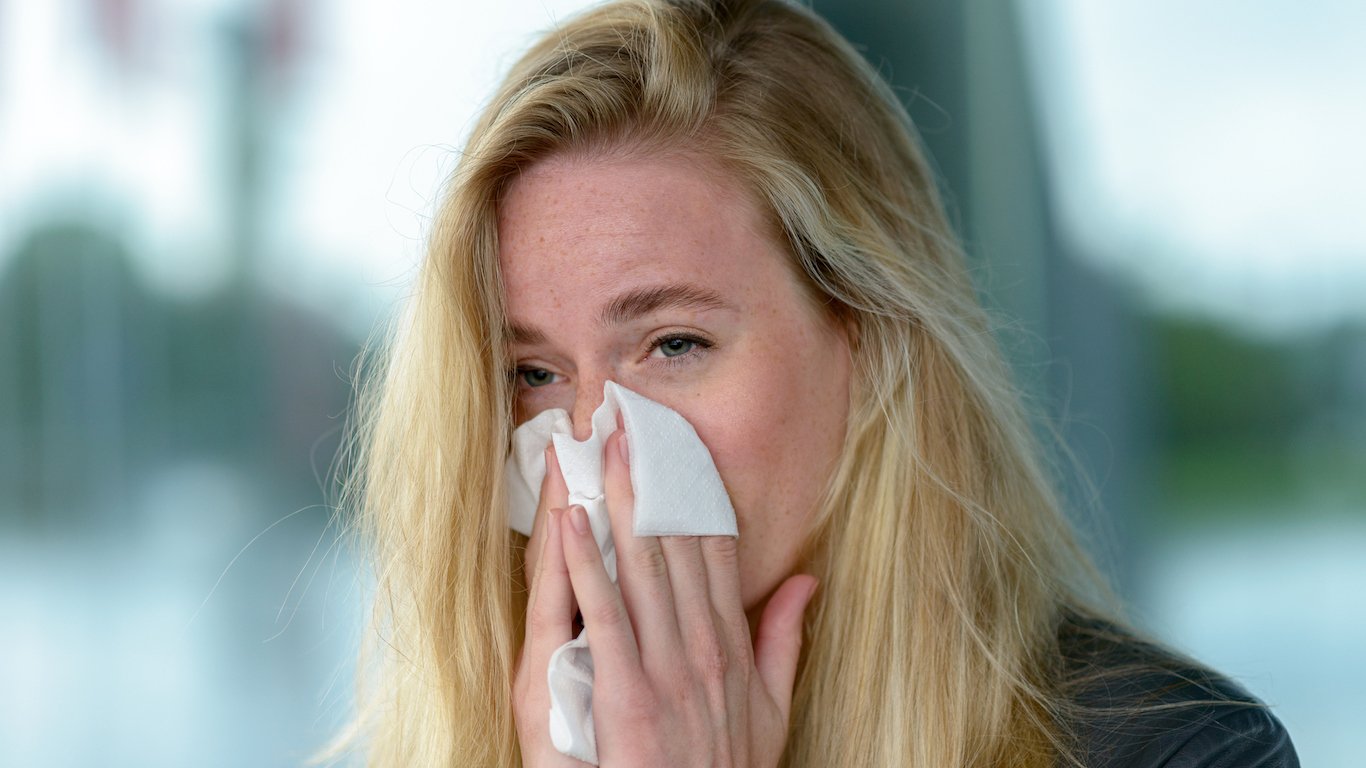
Spring allergies, which go by other names such as hay fever, or the more medical name, allergic rhinitis, can cause sneezing, stuffy and runny nose, watery eyes, as well as itchy nose, eyes, and mouth, according to the American College of Allergy, Asthma and Immunology. These symptoms are due to an allergic sensitivity to pollen from trees, grass, weeds, or airborne mold spores.
The duration of the allergy season in the spring varies depending on geographic location. Cities in warmer climates tend to have longer pollen seasons, sometimes starting as early as January. Some of the most common pollen culprits are aspen, cedar, cottonwood, breech, elm, and oak trees.
People with allergies can reduce their exposure to pollen by staying inside during dry and windy days, change clothes they have worn outside as soon as they get home, take a shower to wash off pollen from the skin and hair, and wear a mask when outside. It is important to keep the air inside clean, too. Using an air-conditioner with filters may help.
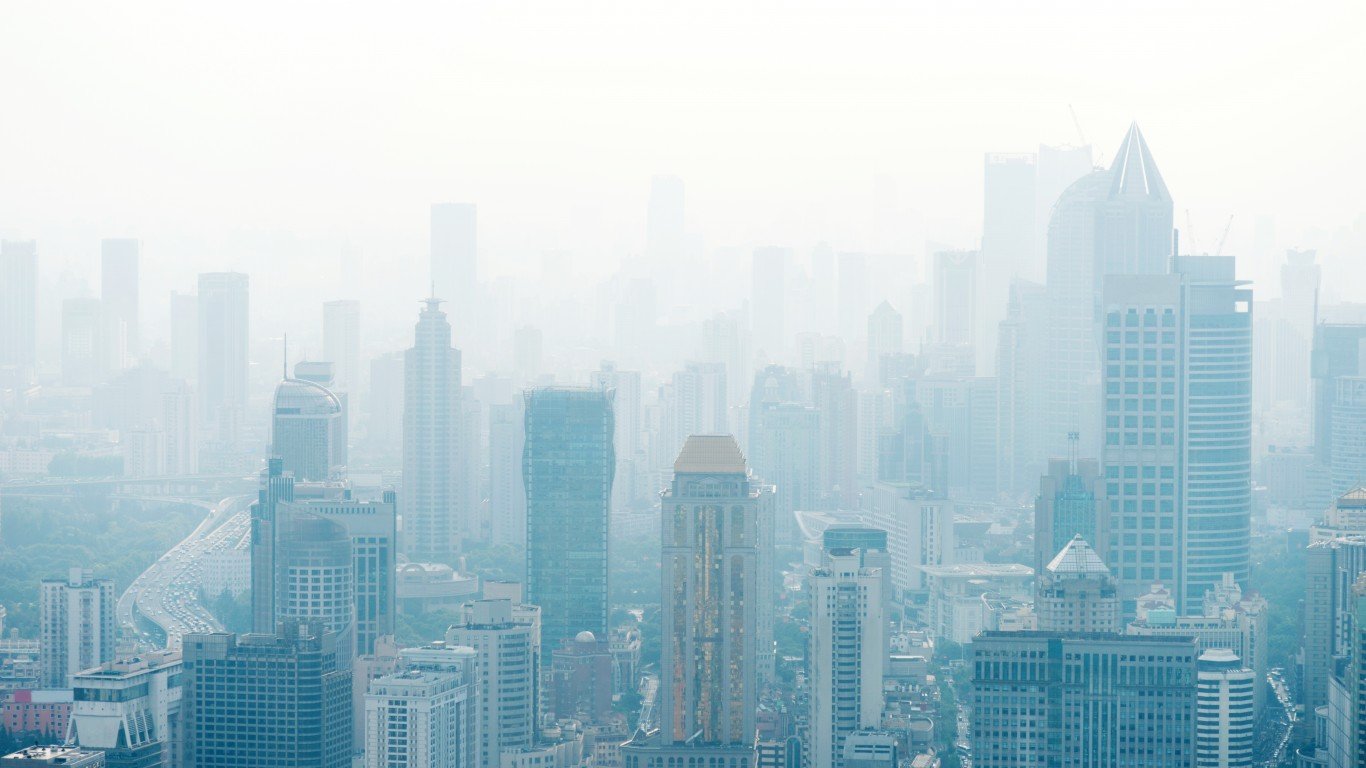
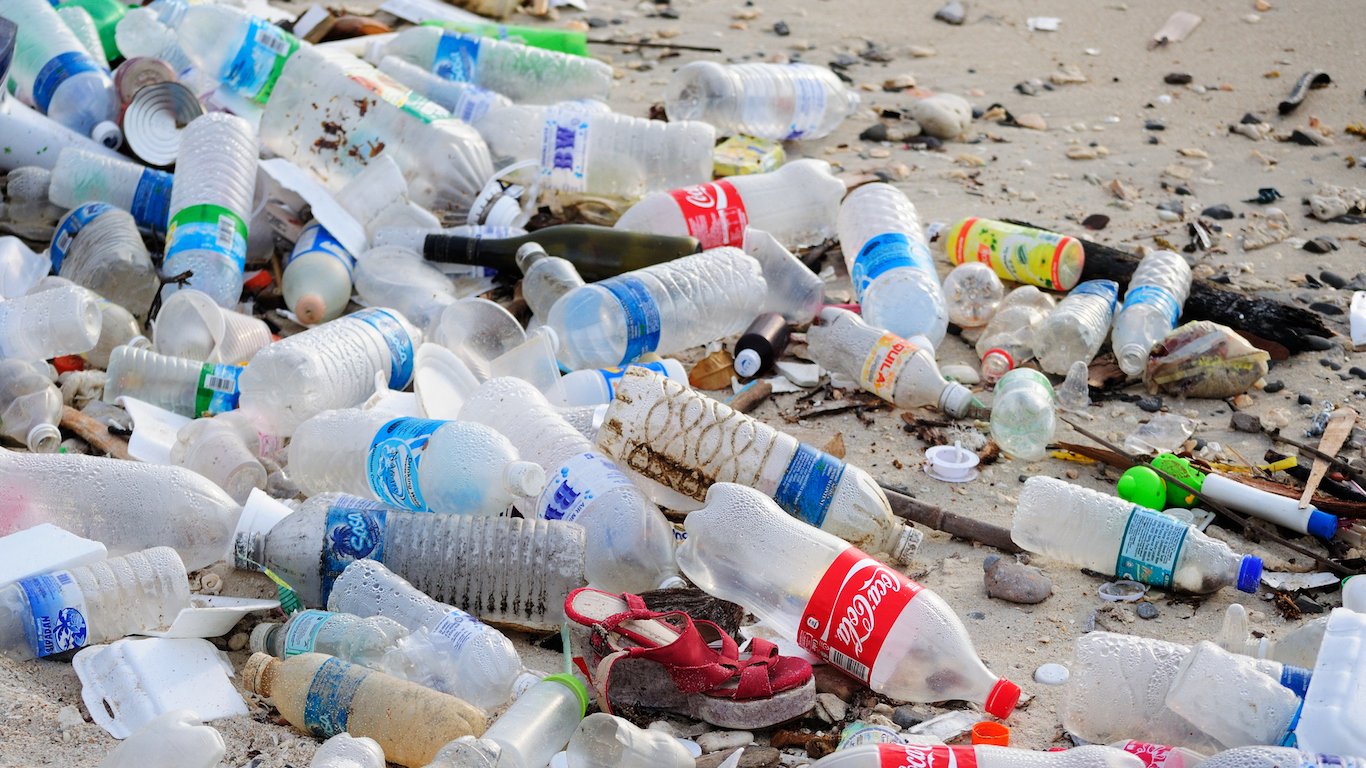
In addition to pollen, air pollution, particularly fine particles (PM2.5) that have a diameter of less than 2.5 micrometers, which is about 3% of the diameter of a human hair, are unhealthy for all people but can make life particularly miserable for people with allergies.
Click here to see the 25 worst cities for people with spring allergies.
To identify the 25 worst cities for people with spring allergies, 24/7 Wall St. reviewed the Asthma and Allergy Foundation of America’s 2019 report on the 100 metropolitan cities where people are most affected by spring allergies. The ranking is based on pollen and mold counts, allergy medicine usage, and availability of board-certified allergists per person. The measure of fine particle pollution (PM2.5) comes from the Environmental Protection Agency’s 2017 report, the latest year for which data is available, on air quality and air pollutants in the United States. Population figures are from the U.S. Census Bureau’s 2017 1-year American Community Survey.
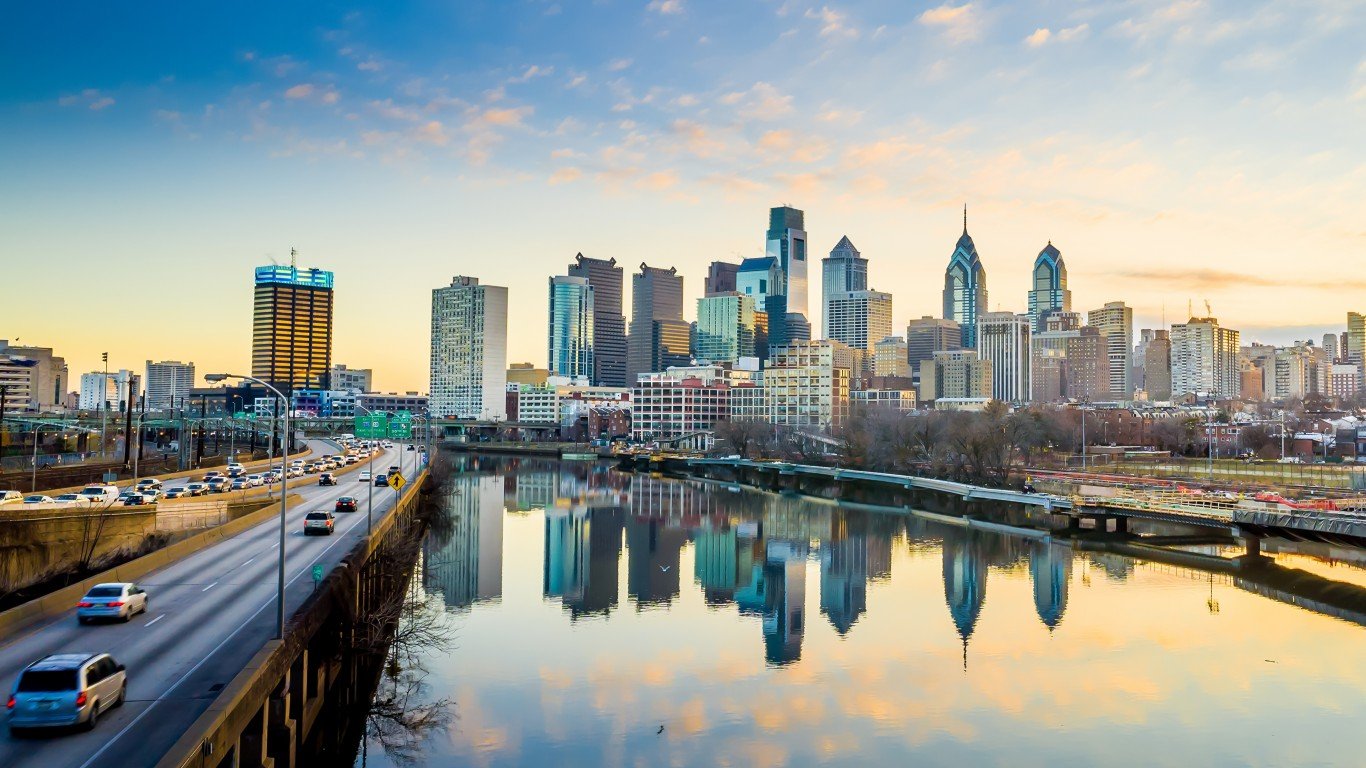
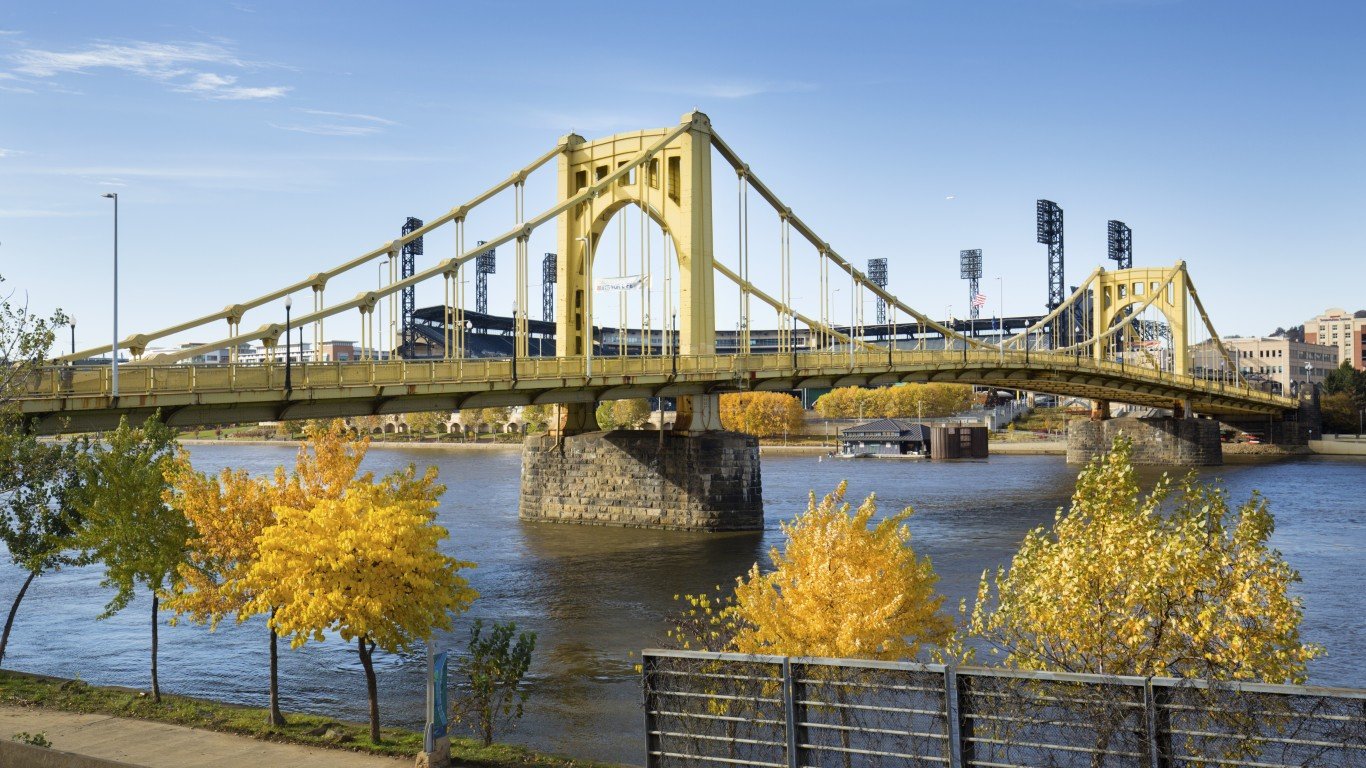
25. Philadelphia, Pennsylvania
> Rank in spring of 2018: 30th worst city
> People taking allergy medication: Worse than average
> Ratio of allergists per patient: Average
> PM2.5 pollution 24-hr average: 27 µg/m3 (EPA’s standard is 35 µg/m3)
> City population: 1,569,657
[in-text-ad]
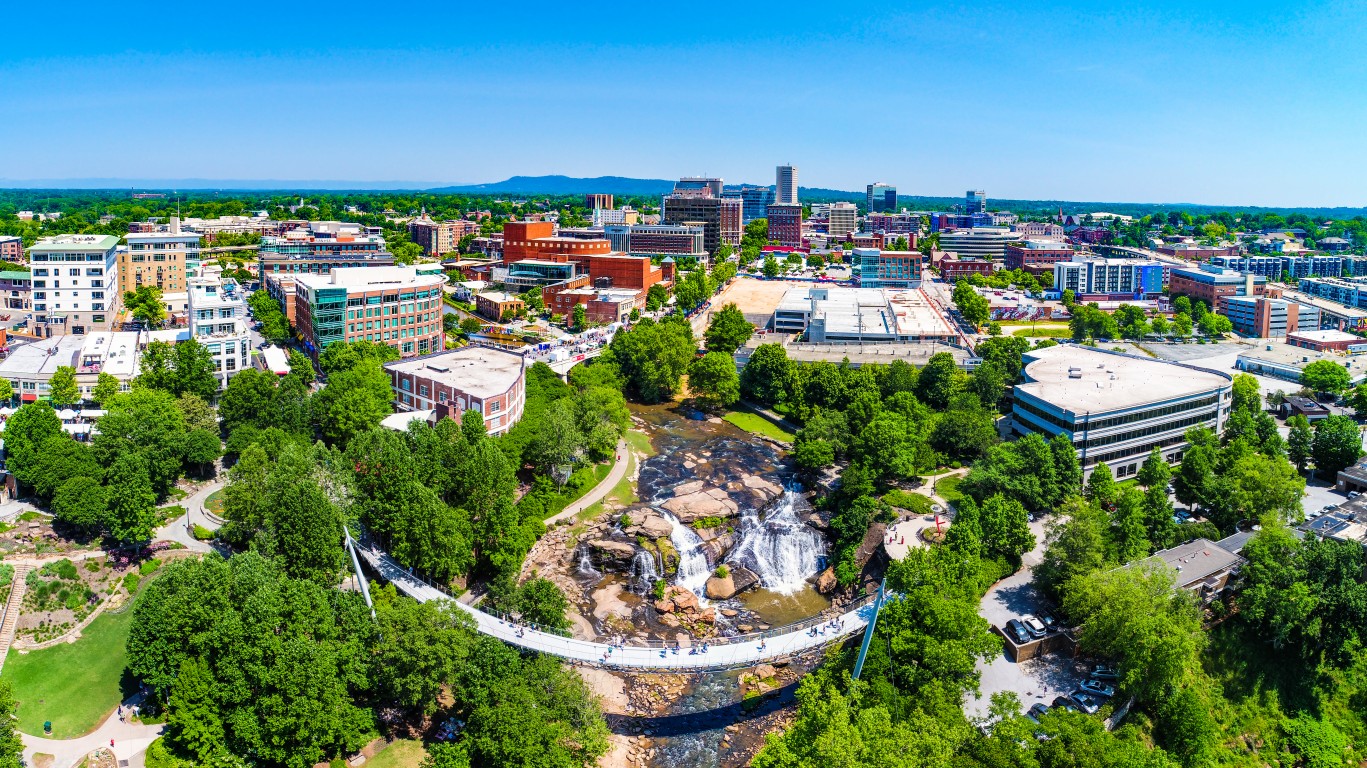
24. Greenville, South Carolina
> Rank in spring of 2018: 35th worst city
> People taking allergy medication: Worse than average
> Ratio of allergists per patient: Average
> PM2.5 pollution 24-hr average: 20 µg/m3 (EPA’s standard is 35 µg/m3)
> City population: 64,061
[recirclink id=488456]
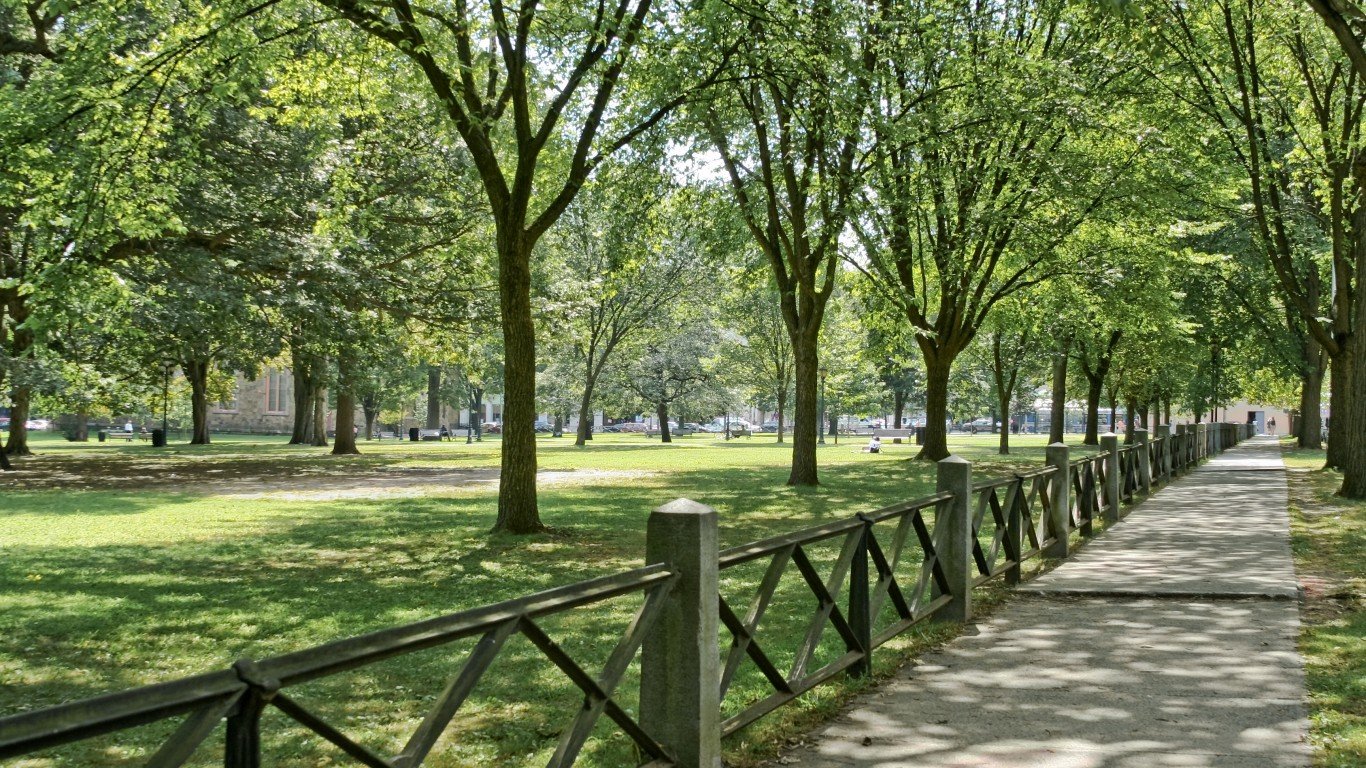
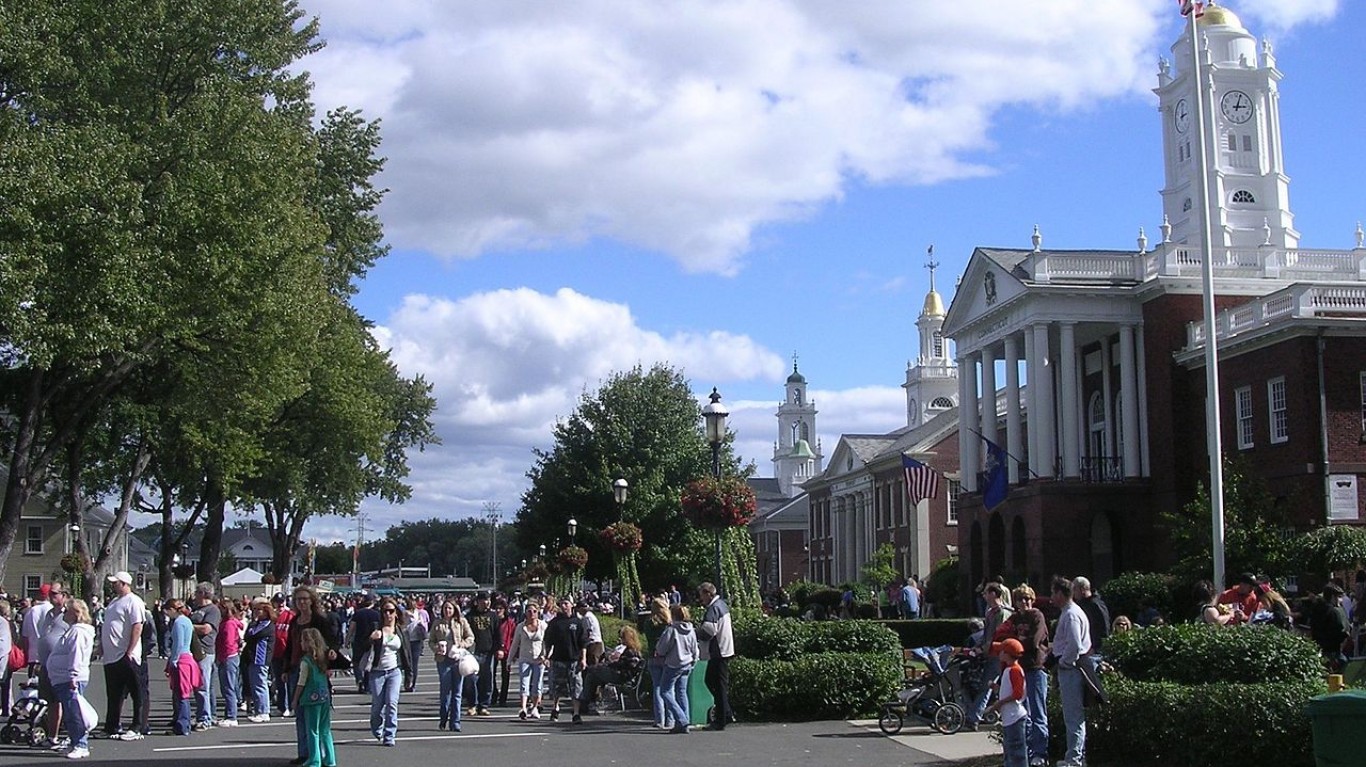
23. New Haven, Connecticut
> Rank in spring of 2018: 24th worst city
> People taking allergy medication: Average
> Ratio of allergists per patient: Better than average
> PM2.5 pollution 24-hr average: 17 µg/m3 (EPA’s standard is 35 µg/m3)
> City population: 130,884
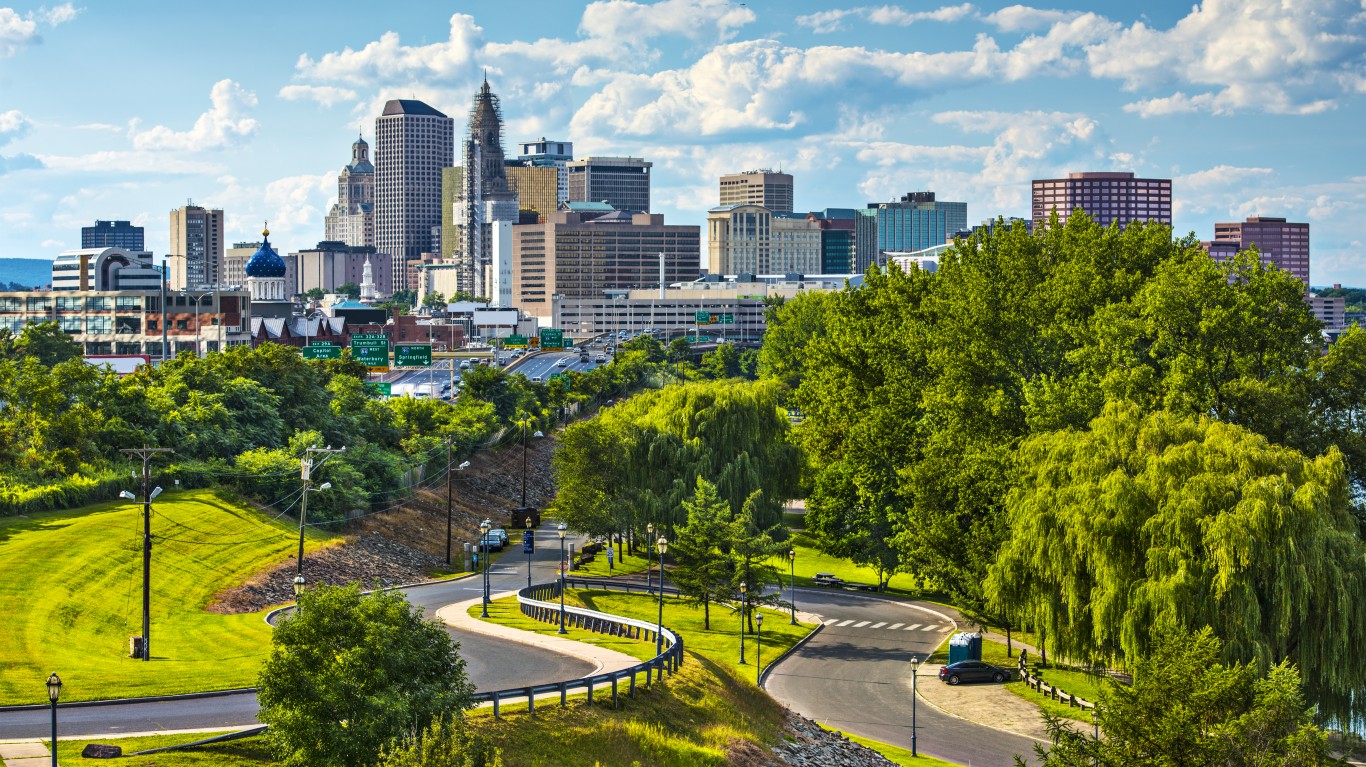
22. Hartford, Connecticut
> Rank in spring of 2018: 26th worst city
> People taking allergy medication: Average
> Ratio of allergists per patient: Average
> PM2.5 pollution 24-hr average: 17 µg/m3 (EPA’s standard is 35 µg/m3)
> City population: 124,390
[in-text-ad-2]
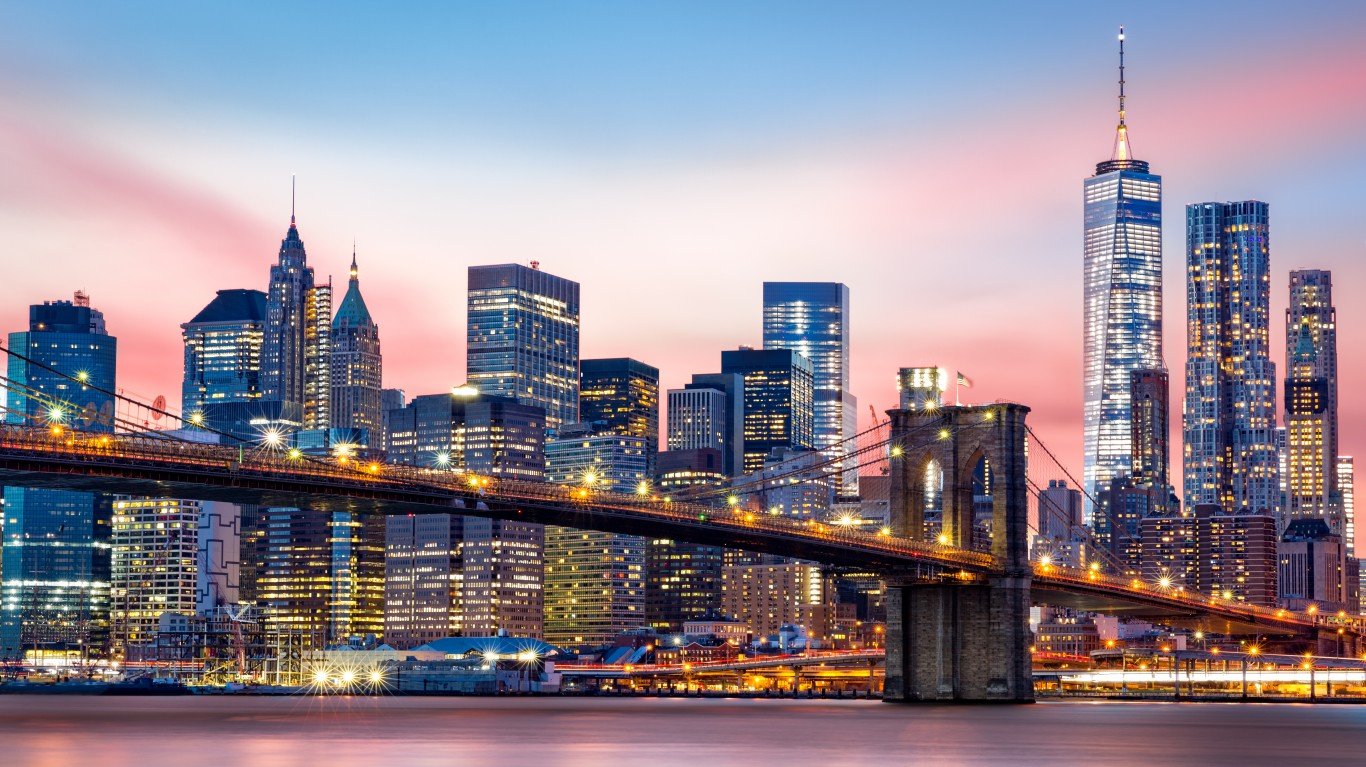
21. New York, New York
> Rank in spring of 2018: 25th worst city
> People taking allergy medication: Worse than average
> Ratio of allergists per patient: Worse than average
> PM2.5 pollution 24-hr average: 23 µg/m3 (EPA’s standard is 35 µg/m3)
> City population: 8,560,072
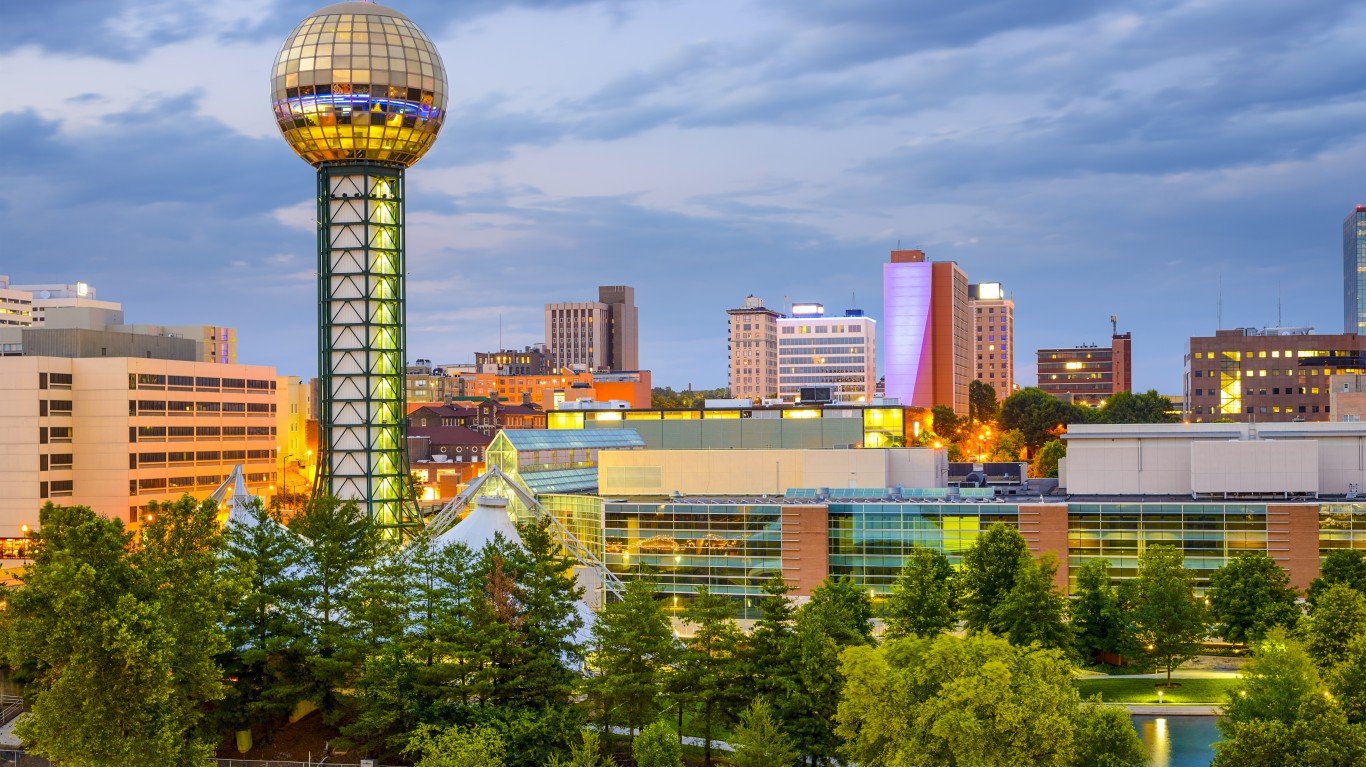
20. Knoxville, Tennessee
> Rank in spring of 2018: 10th worst city
> People taking allergy medication: Worse than average
> Ratio of allergists per patient: Average
> PM2.5 pollution 24-hr average: 21 µg/m3 (EPA’s standard is 35 µg/m3)
> City population: 184,465
[in-text-ad]

19. Columbia, South Carolina
> Rank in spring of 2018: 19th worst city
> People taking allergy medication: Worse than average
> Ratio of allergists per patient: Average
> PM2.5 pollution 24-hr average: 18 µg/m3 (EPA’s standard is 35 µg/m3)
> City population: 132,236
[recirclink id=488594]
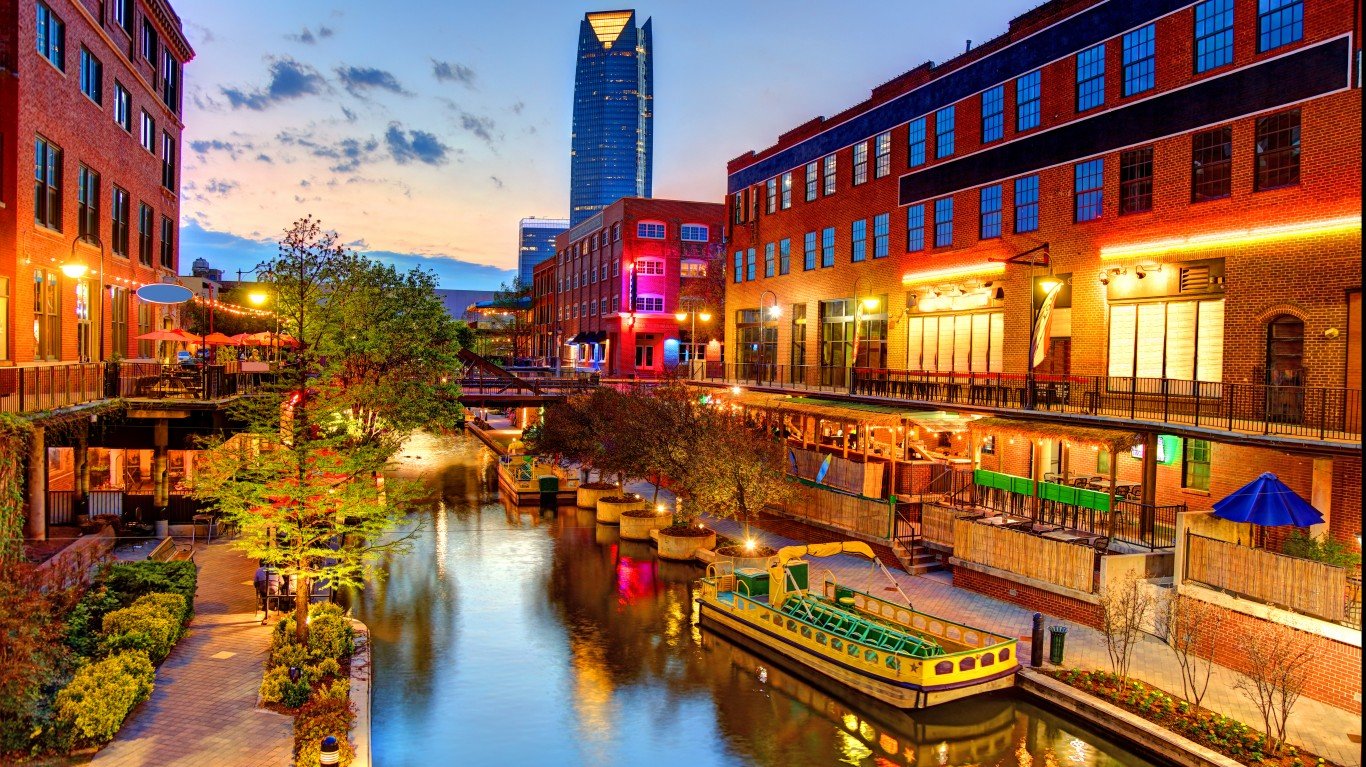
18. Oklahoma City, Oklahoma
> Rank in spring of 2018: 9th worst city
> People taking allergy medication: Average
> Ratio of allergists per patient: Average
> PM2.5 pollution 24-hr average: 16 µg/m3 (EPA’s standard is 35 µg/m3)
> City population: 629,191
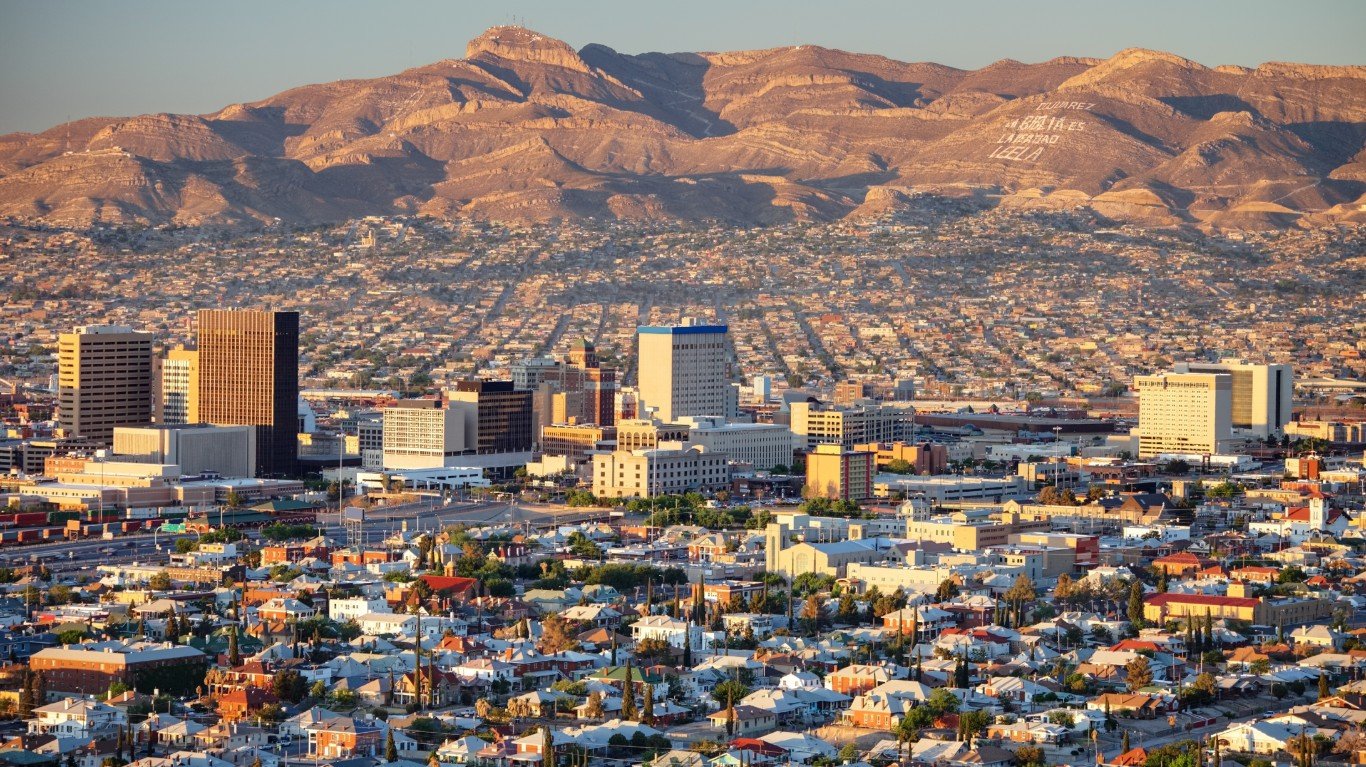
17. El Paso, Texas
> Rank in spring of 2018: 13th worst city
> People taking allergy medication: Worse than average
> Ratio of allergists per patient: Average
> PM2.5 pollution 24-hr average: 24 µg/m3 (EPA’s standard is 35 µg/m3)
> City population: 678,266
[in-text-ad-2]
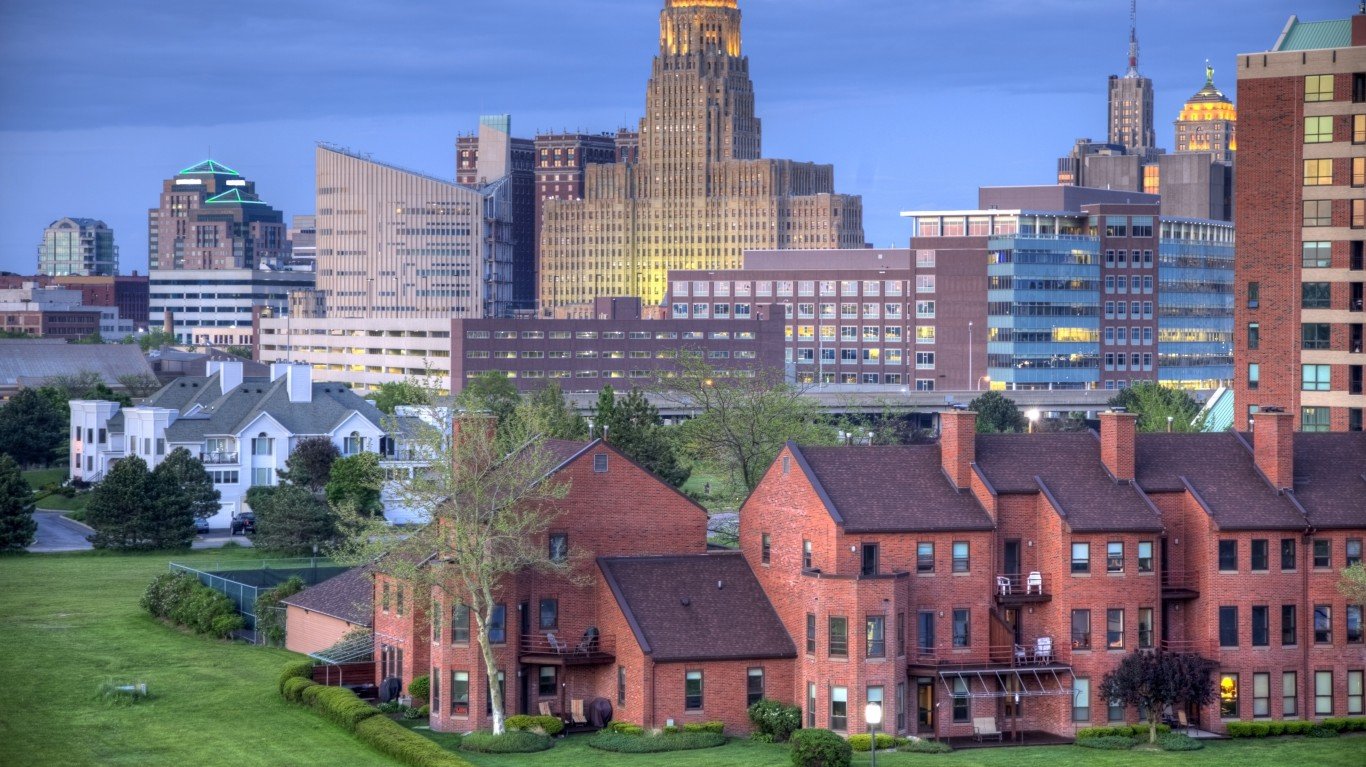
16. Buffalo, New York
> Rank in spring of 2018: 23rd worst city
> People taking allergy medication: Worse than average
> Ratio of allergists per patient: Average
> PM2.5 pollution 24-hr average: 17 µg/m3 (EPA’s standard is 35 µg/m3)
> City population: 259,574
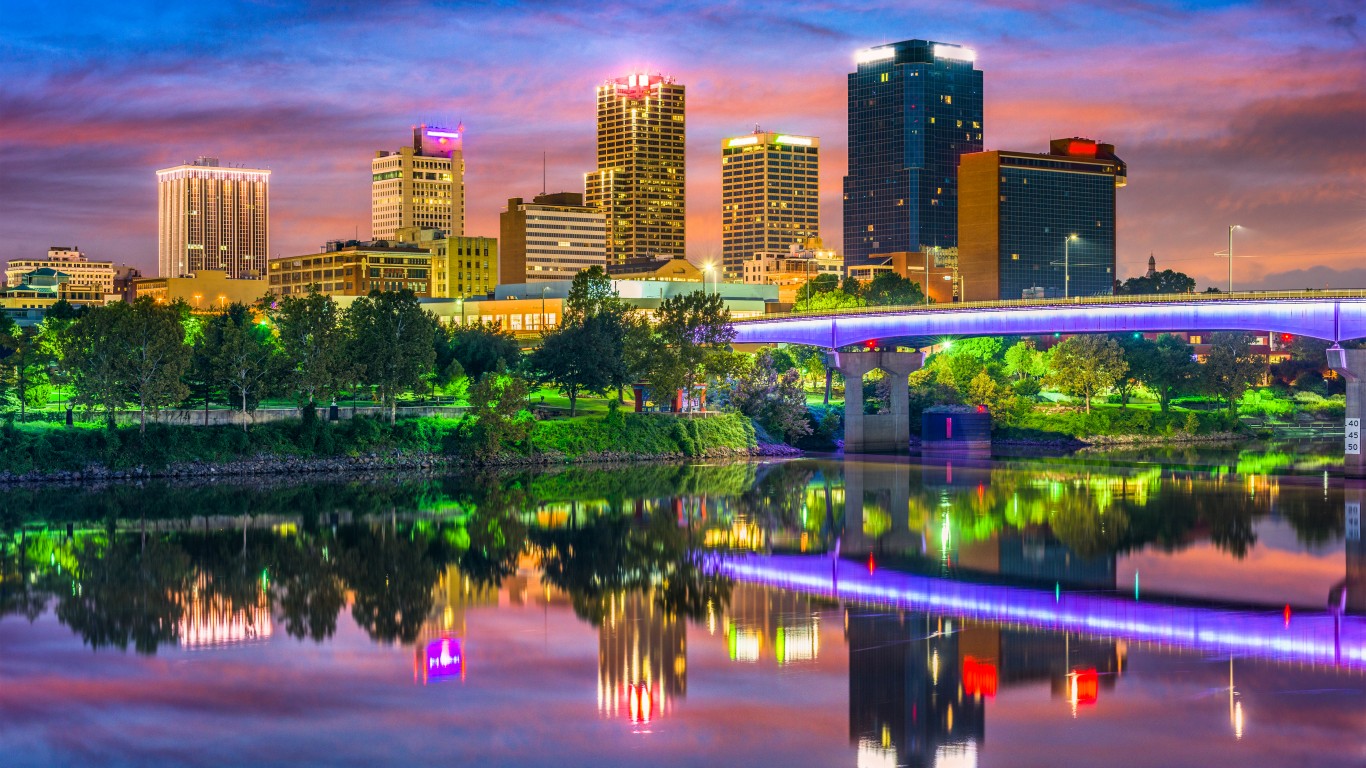
15. Little Rock, Arkansas
> Rank in spring of 2018: 17th worst city
> People taking allergy medication: Worse than average
> Ratio of allergists per patient: Better than average
> PM2.5 pollution 24-hr average: 21 µg/m3 (EPA’s standard is 35 µg/m3)
> City population: 197,780
[in-text-ad]

14. San Antonio, Texas
> Rank in spring of 2018: 5th worst city
> People taking allergy medication: Average
> Ratio of allergists per patient: Average
> PM2.5 pollution 24-hr average: 25 µg/m3 (EPA’s standard is 35 µg/m3)
> City population: 1,461,623
[recirclink id=488561]
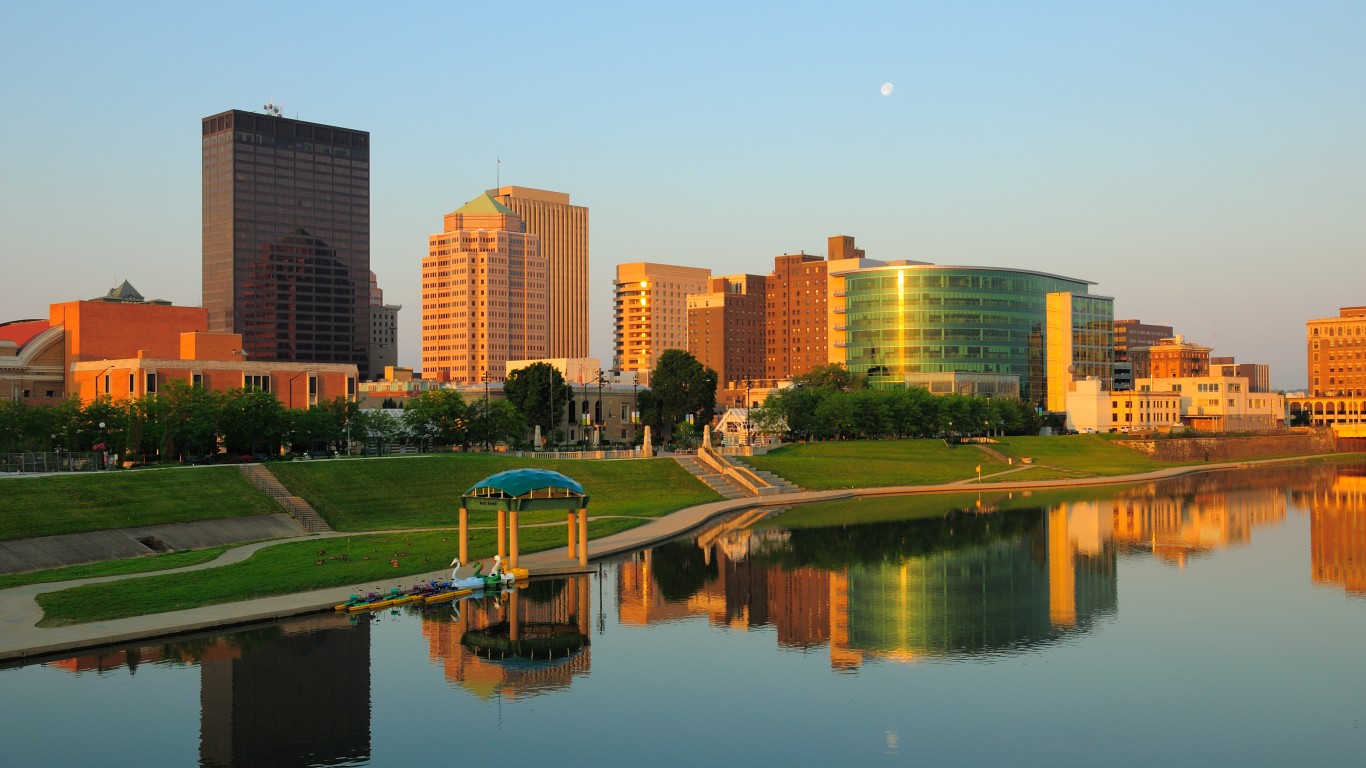
13. Dayton, Ohio
> Rank in spring of 2018: 7th worst city
> People taking allergy medication: Worse than average
> Ratio of allergists per patient: Average
> PM2.5 pollution 24-hr average: 18 µg/m3 (EPA’s standard is 35 µg/m3)
> City population: 140,939
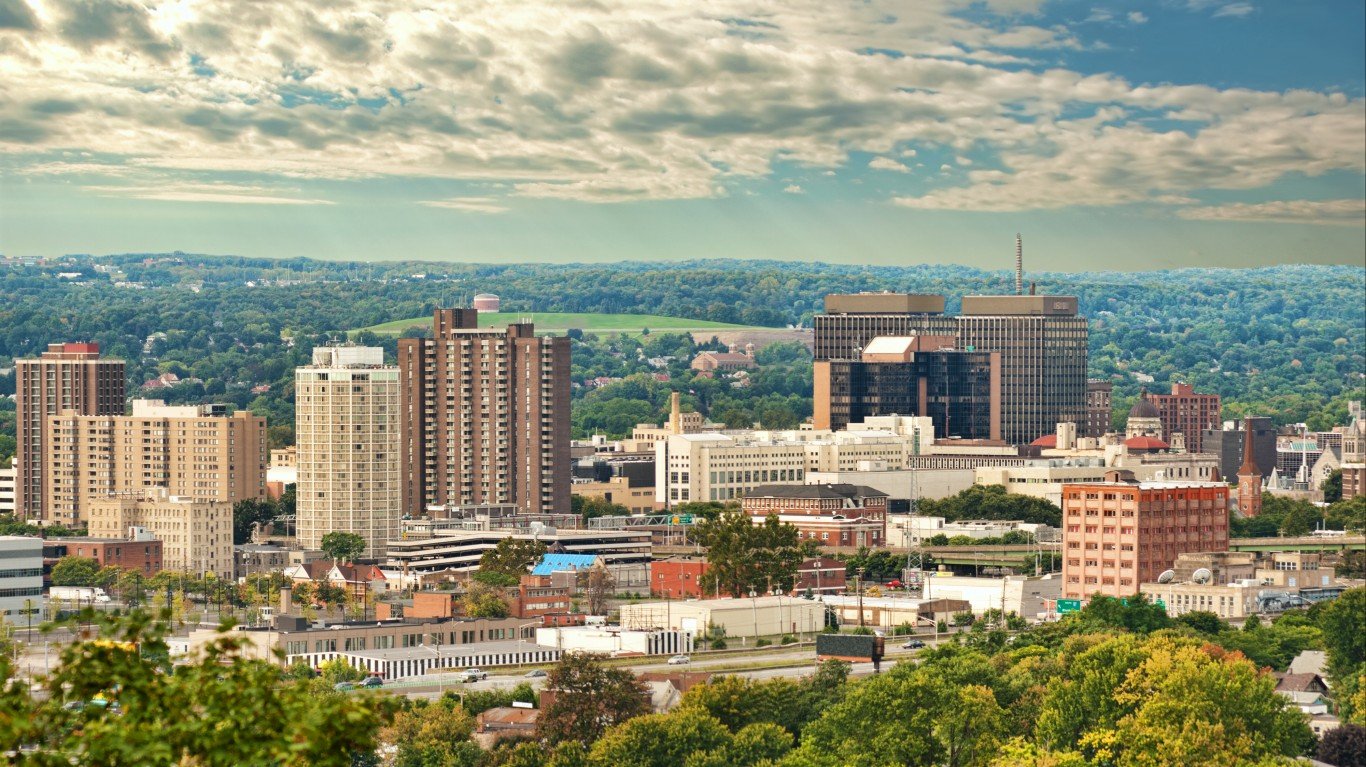
12. Syracuse, New York
> Rank in spring of 2018: 8th worst city
> People taking allergy medication: Worse than average
> Ratio of allergists per patient: Average
> PM2.5 pollution 24-hr average: 13 µg/m3 (EPA’s standard is 35 µg/m3)
> City population: 144,405
[in-text-ad-2]
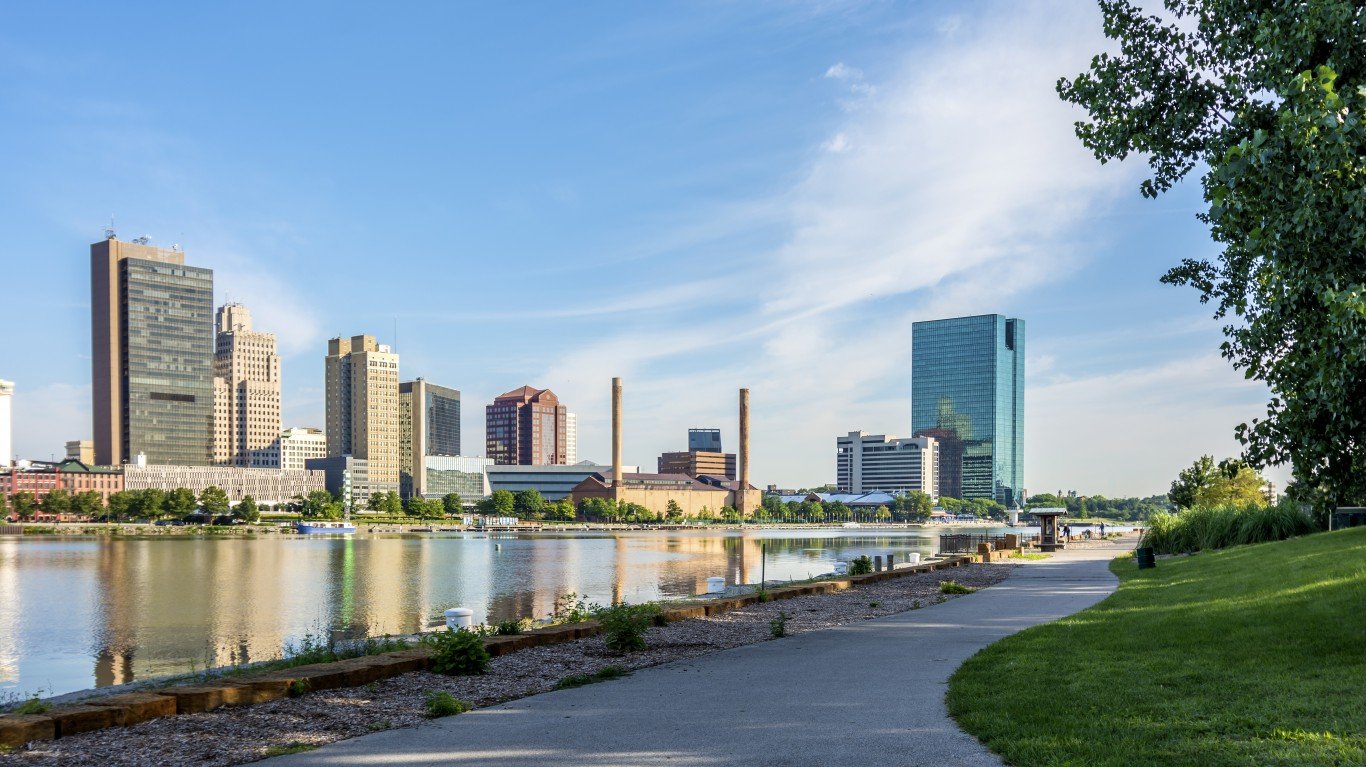
11. Toledo, Ohio
> Rank in spring of 2018: 14th worst city
> People taking allergy medication: Worse than average
> Ratio of allergists per patient: Average
> PM2.5 pollution 24-hr average: 20 µg/m3 (EPA’s standard is 35 µg/m3)
> City population: 279,455
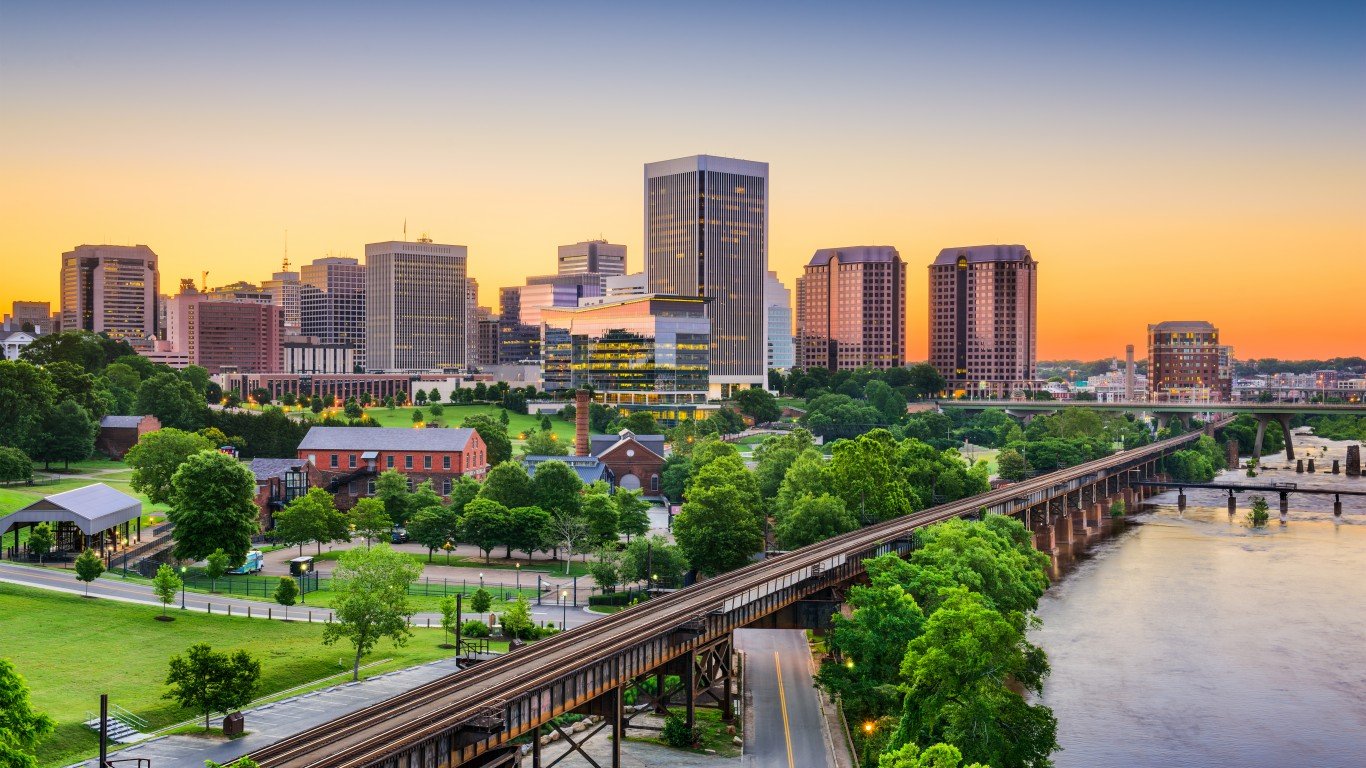
10. Richmond, Virginia
> Rank in spring of 2018: 16th worst city
> People taking allergy medication: Average
> Ratio of allergists per patient: Average
> PM2.5 pollution 24-hr average: 15 µg/m3 (EPA’s standard is 35 µg/m3)
> City population: 220,892
[in-text-ad]
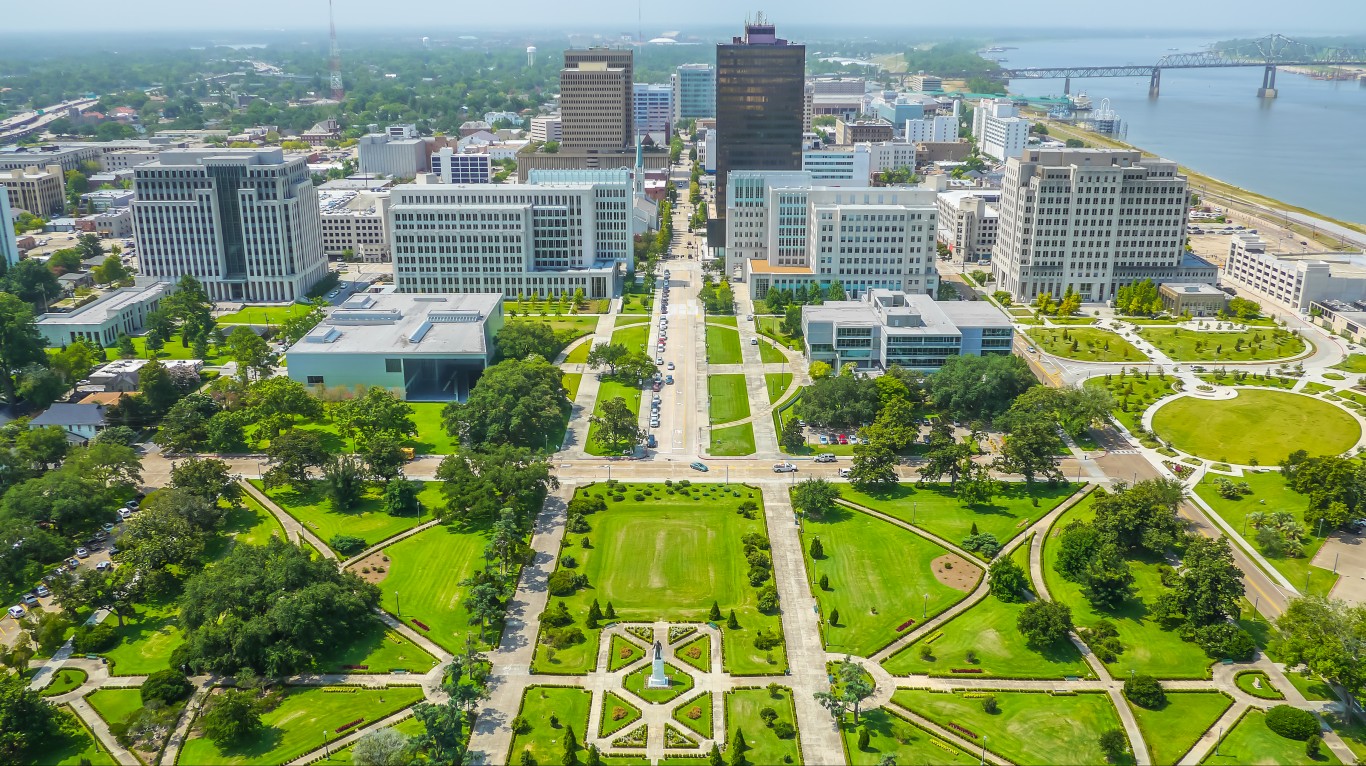
9. Baton Rouge, Louisiana
> Rank in spring of 2018: 12th worst city
> People taking allergy medication: Worse than average
> Ratio of allergists per patient: Average
> PM2.5 pollution 24-hr average: 19 µg/m3 (EPA’s standard is 35 µg/m3)
> City population: 227,549
[recirclink id=488514]
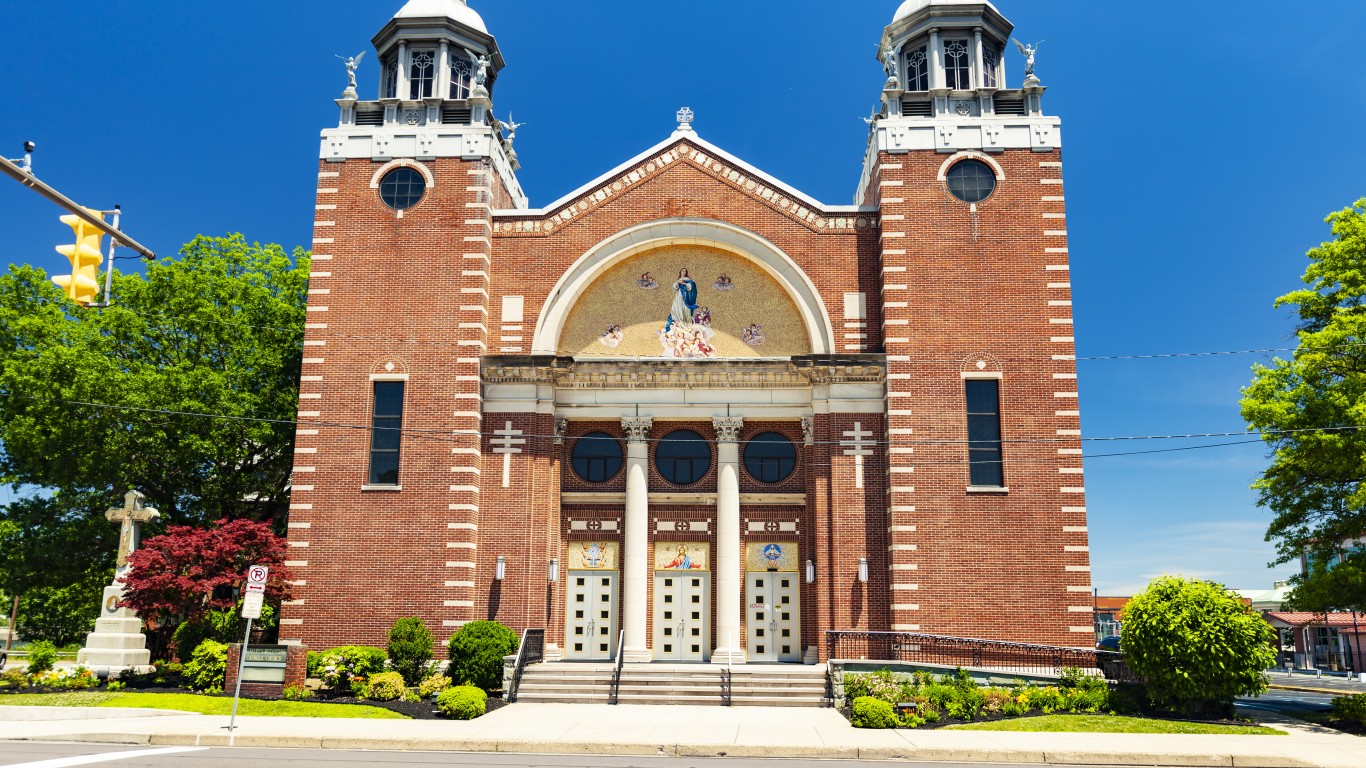
8. Scranton, Pennsylvania
> Rank in spring of 2018: 47th worst city
> People taking allergy medication: Average
> Ratio of allergists per patient: Worse than average
> PM2.5 pollution 24-hr average: 17 µg/m3 (EPA’s standard is 35 µg/m3)
> City population: 76,624
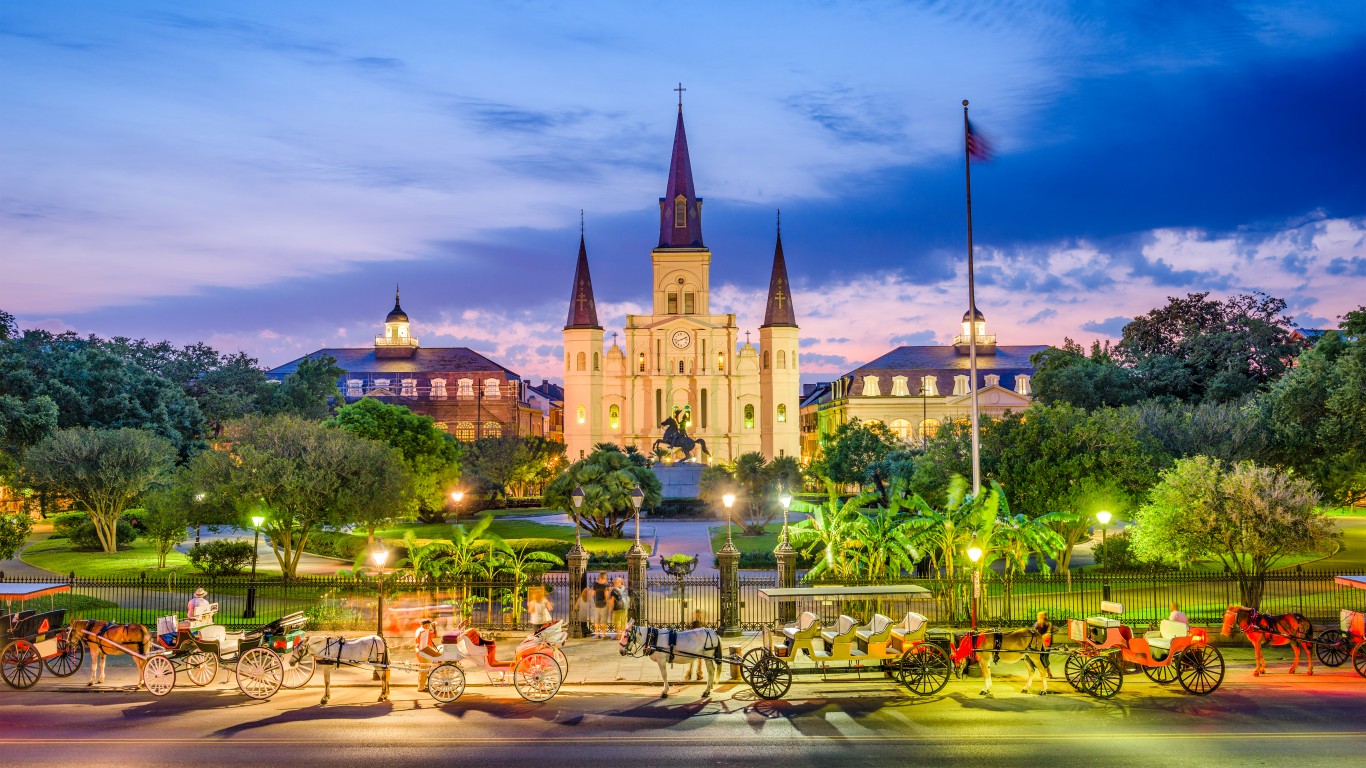
7. New Orleans, Louisiana
> Rank in spring of 2018: 15th worst city
> People taking allergy medication: Worse than average
> Ratio of allergists per patient: Average
> PM2.5 pollution 24-hr average: 23 µg/m3 (EPA’s standard is 35 µg/m3)
> City population: 388,182
[in-text-ad-2]
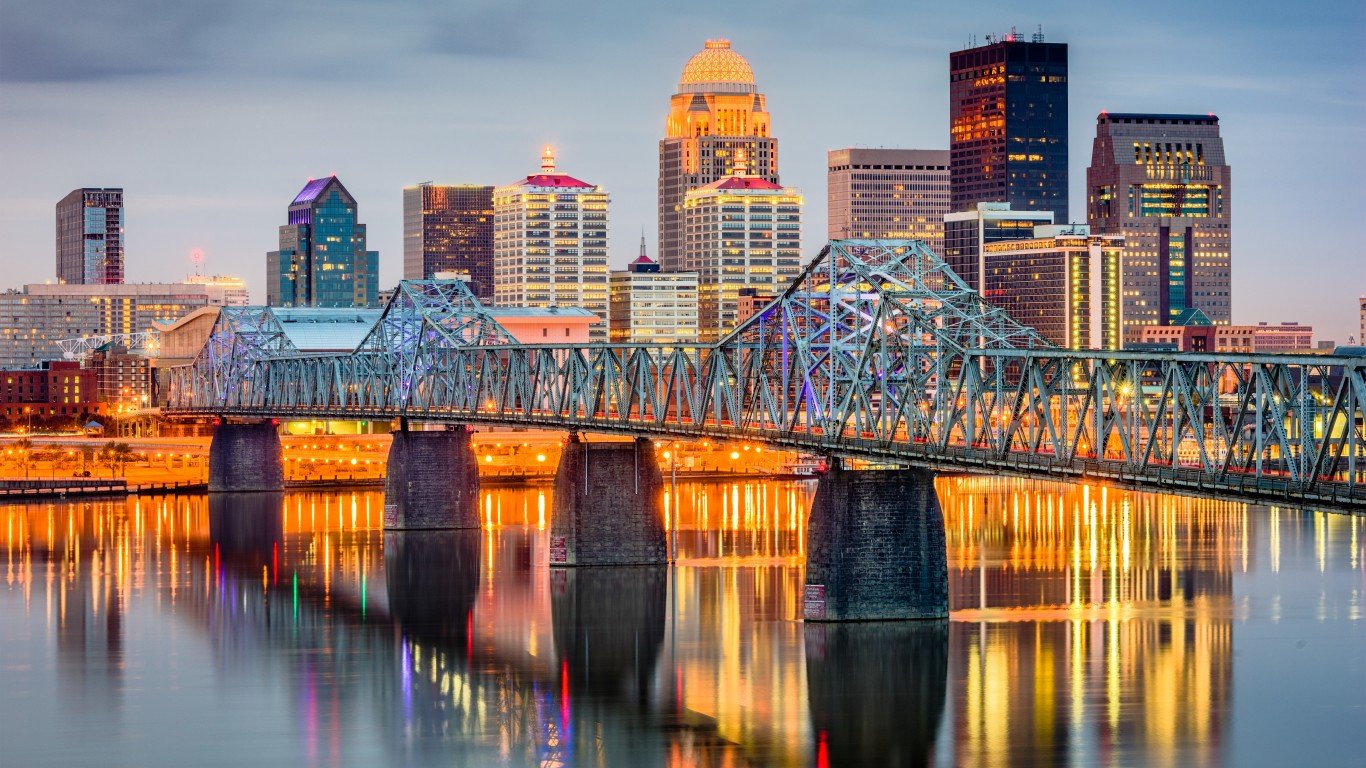
6. Louisville, Kentucky
> Rank in spring of 2018: 2nd worst city
> People taking allergy medication: Worse than average
> Ratio of allergists per patient: Average
> PM2.5 pollution 24-hr average: 21 µg/m3 (EPA’s standard is 35 µg/m3)
> City population: 615,478
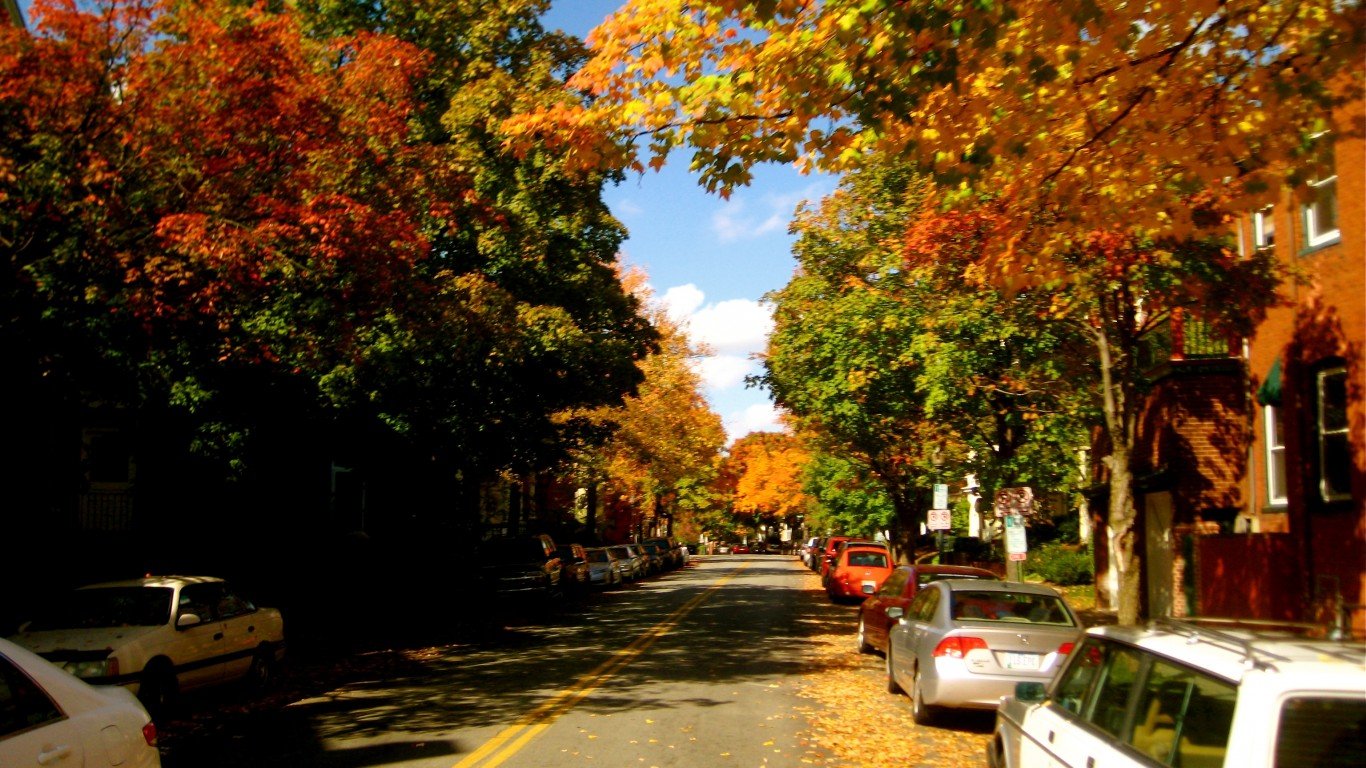
5. Springfield, Massachusetts
> Rank in spring of 2018: 11th worst city
> People taking allergy medication: Worse than average
> Ratio of allergists per patient: Average
> PM2.5 pollution 24-hr average: 17 µg/m3 (EPA’s standard is 35 µg/m3)
> City population: 154,613
[in-text-ad]
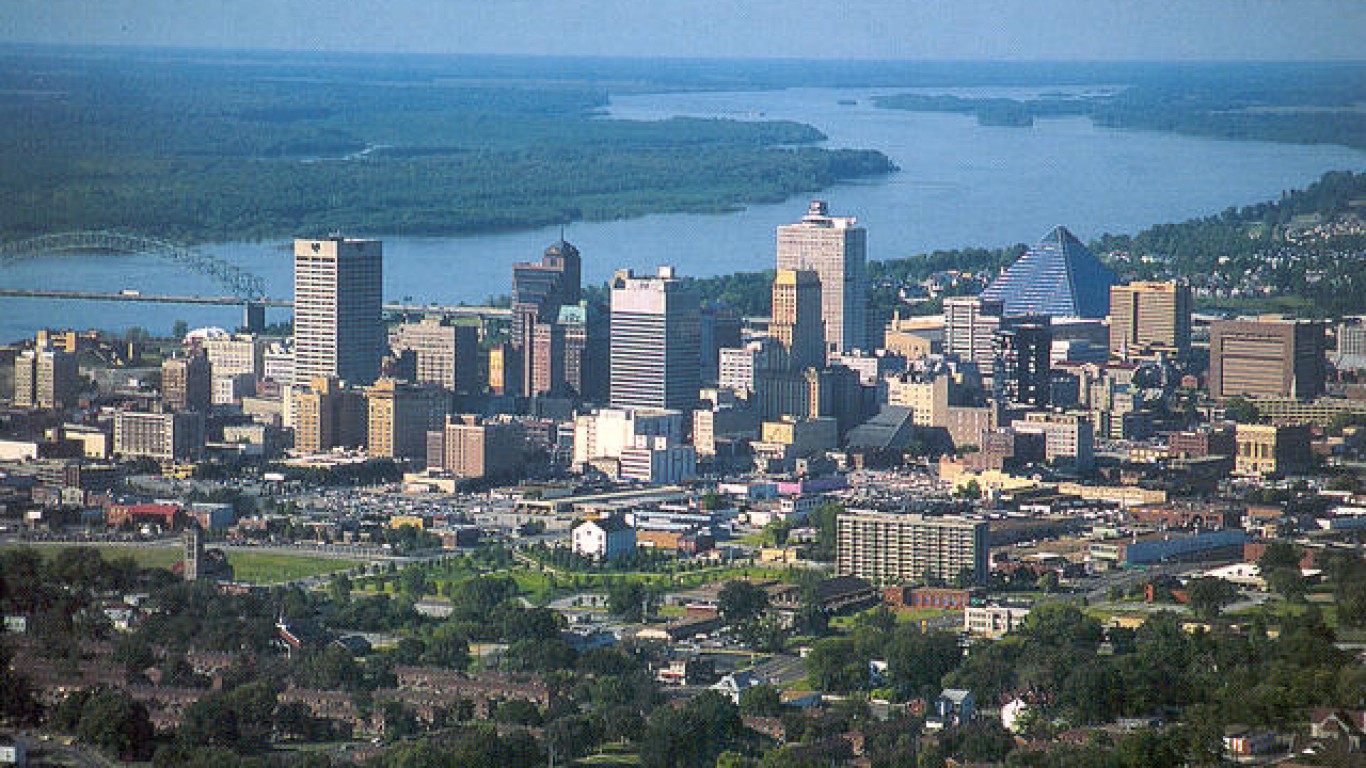
4. Memphis, Tennessee
> Rank in spring of 2018: 4th worst city
> People taking allergy medication: Worse than average
> Ratio of allergists per patient: Average
> PM2.5 pollution 24-hr average: 16 µg/m3 (EPA’s standard is 35 µg/m3)
> City population: 654,723
[recirclink id=488498]
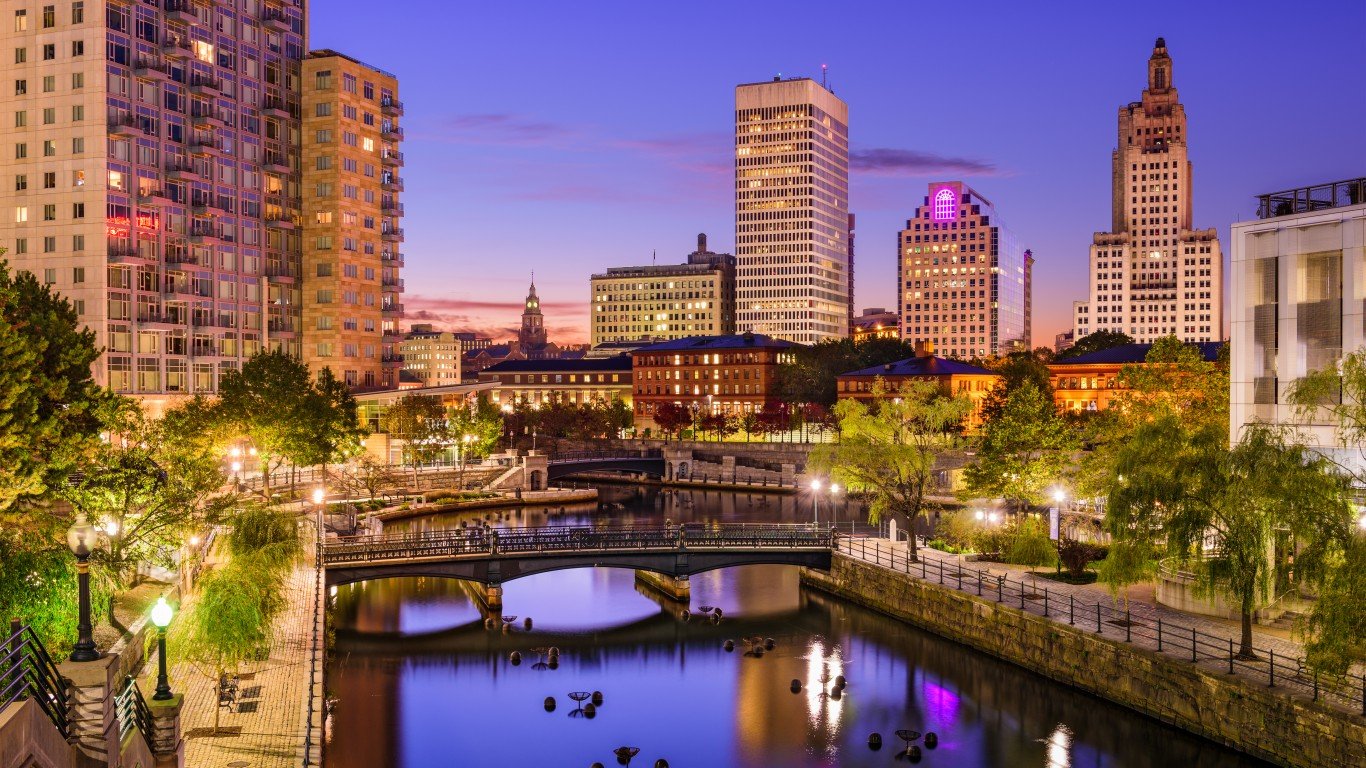
3. Providence, Rhode Island
> Rank in spring of 2018: 6th worst city
> People taking allergy medication: Worse than average
> Ratio of allergists per patient: Worse than average
> PM2.5 pollution 24-hr average: 18 µg/m3 (EPA’s standard is 35 µg/m3)
> City population: 179,509
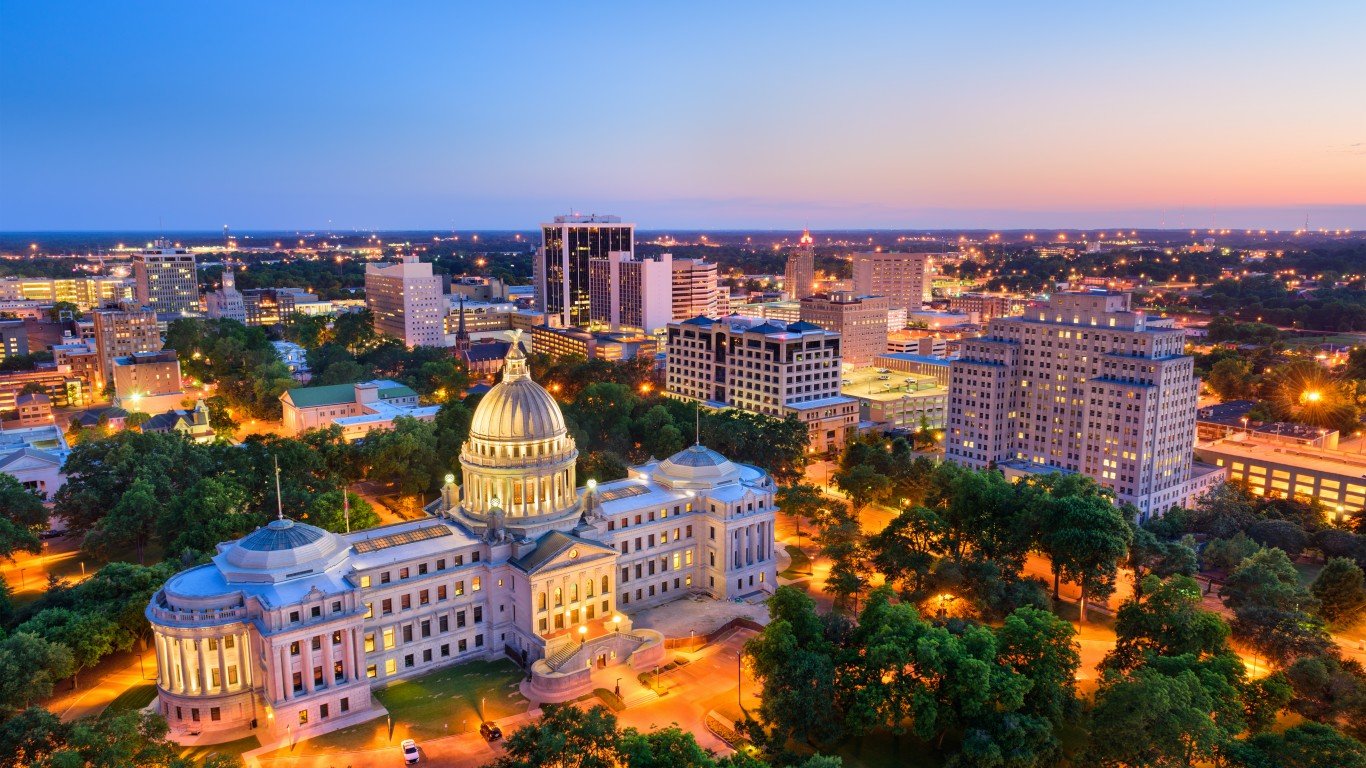
2. Jackson, Mississippi
> Rank in spring of 2018: 3rd worst city
> People taking allergy medication: Worse than average
> Ratio of allergists per patient: Better than average
> PM2.5 pollution 24-hr average: N/A
> City population: 170,393
[in-text-ad-2]
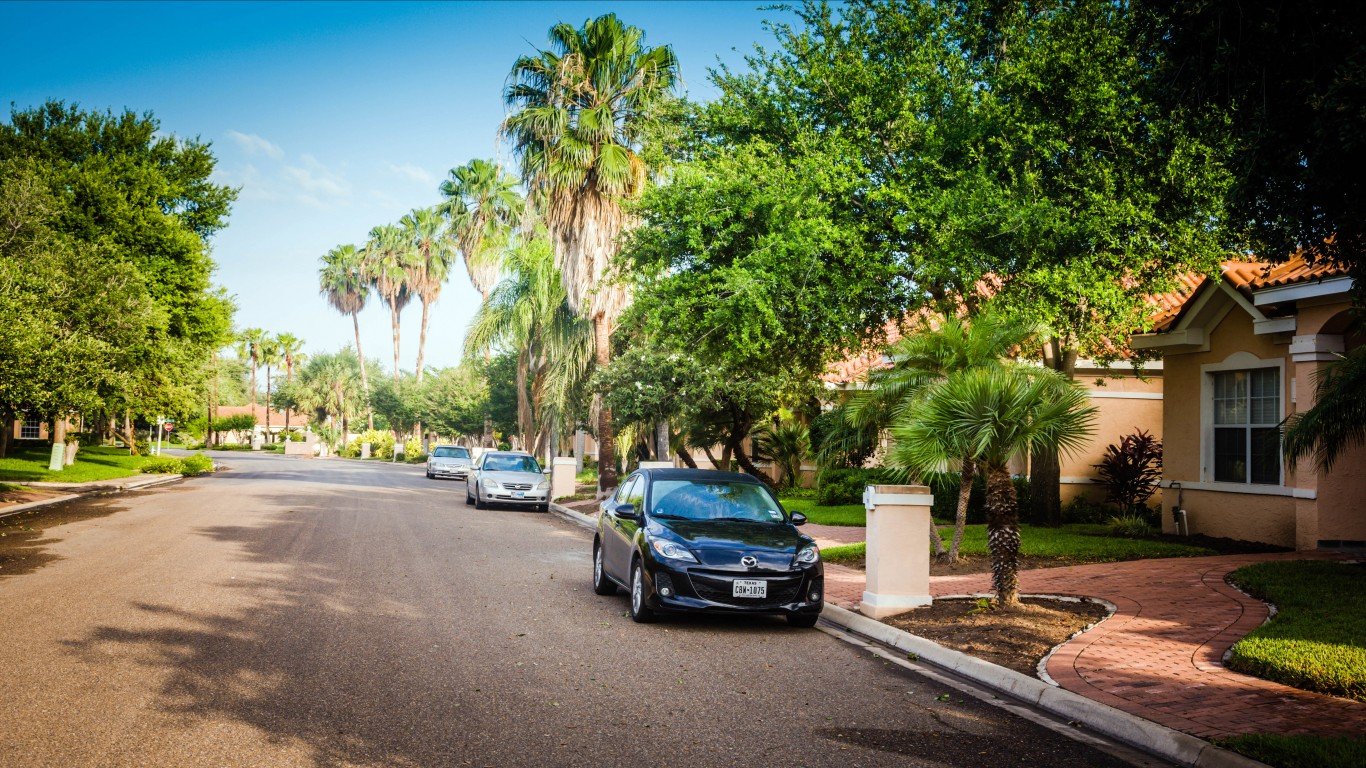
1. McAllen, Texas
> Rank in spring of 2018: Worst city
> People taking allergy medication: Worse than average
> Ratio of allergists per patient: Worse than average
> PM2.5 pollution 24-hr average: 26 µg/m3 (EPA’s standard is 35 µg/m3)
> City population: 139,838
Contact [email protected] for any questions or corrections.