[cnxvideo id=”923998″ placement=”ros”]
For many parents, one of the most important considerations when choosing where to live is the quality of the local school district. It is, however, very difficult to measure the quality and effectiveness of one school system over another, and state school systems vary in many ways.
A good state school system should excel in several aspects. A successful system should produce students who score well on aptitude tests, who are likely to graduate, and who tend to go on to college.
A state’s spending on its public school system is only one factor related to student success. While some state school systems with lower spending per pupil still compare favorably to systems in other states, most systems that rank high in student achievements also spend more per pupil. Across all states, public schools spend an average of $12,526 per pupil per year. In all but five of the 25 best ranking states, annual per pupil spending is higher than the national average.
While these are not absolutely critical, research shows that students with a strong foundation — in particularly gained by living with educated parents — are more likely to be enrolled in better-funded schools and are far more likely to be successful.
24/7 Wall St. reviewed data available from the U.S. Census Bureau, The National Assessment of Educational Progress, and the National Center for Education Statistics to create an index of all 50 state public school systems, from best to worst.
To identify the states with the best and worst schools, 24/7 Wall St. created an index inspired by the Quality Counts ranking of state education created by Education Week. We ranked the states based on a variety of measures that cover financial standing, academic achievement, and student chances for success. Graduation rate is derived from the Adjusted Cohort Graduation Rate (ACGR) for the 2015-2016 school year and comes from the National Center for Education Statistics (NCES). Per-pupil spending for the states for 2016 comes from the Census Bureau’s Secondary Education Finance data. Proficiency test results for math and reading comes from the National Assessment for Educational Progress (NAEP) and are as recent as 2017. Educational attainment and the percentage of non-low-income families came from the Census Bureau’s American Community Survey (ACS) and is for 2017 1-Year Estimates.
Click here to see the states with the best and worst schools.

1. Massachusetts
> High school graduation rate: 87.5% (13th highest)
> Public school spending: $15,592.74 per pupil (7th highest)
> 8th grade proficiency: 50.0% (math) 49.0% (reading)
> Adults with a bachelor’s degree: 43.4% (the highest)
> Children who live in low income families: 26.7%
[in-text-ad]

2. New Jersey
> High school graduation rate: 90.1% (2nd highest)
> Public school spending: $18,402.35 per pupil (3rd highest)
> 8th grade proficiency: 44.0% (math) 47.0% (reading)
> Adults with a bachelor’s degree: 39.7% (3rd highest)
> Children who live in low income families: 29.4%
[recirclink id=488456]
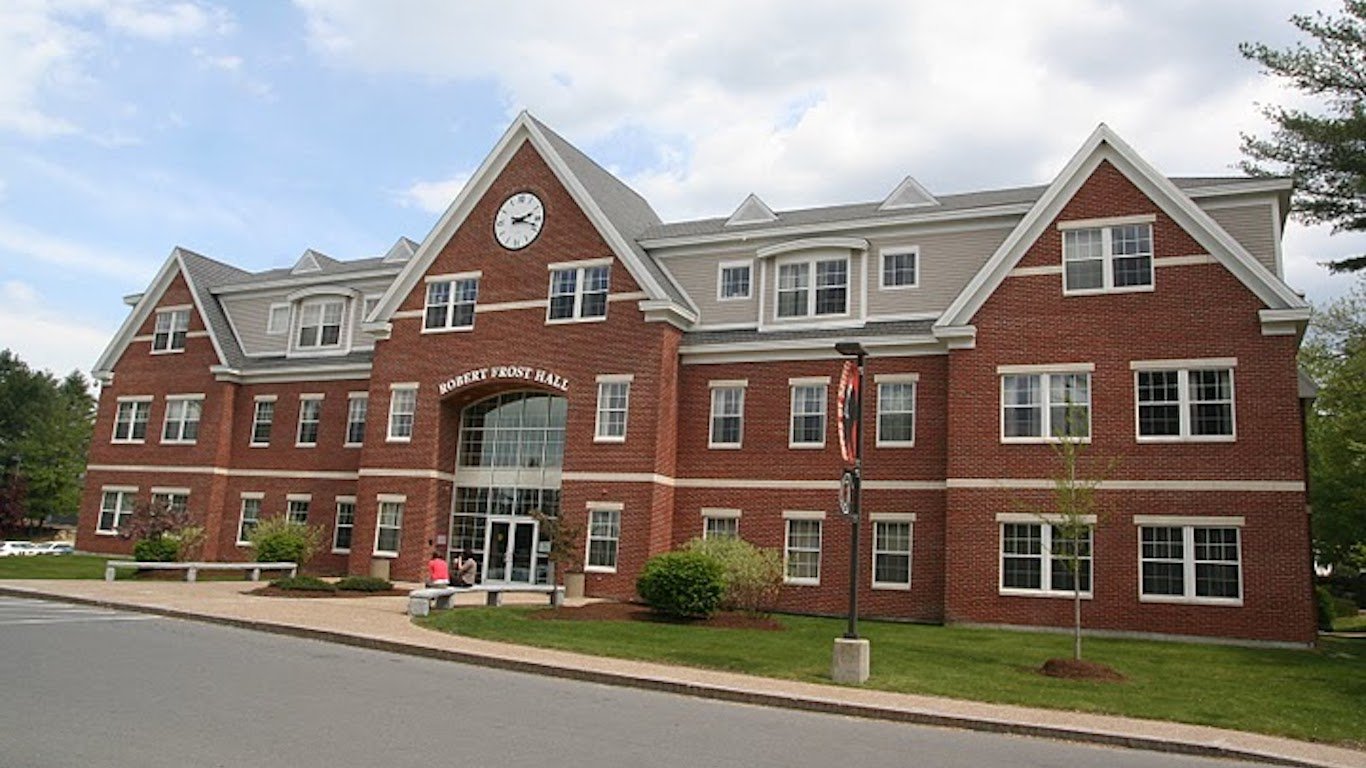
3. New Hampshire
> High school graduation rate: 88.2% (9th highest)
> Public school spending: $15,340.22 per pupil (10th highest)
> 8th grade proficiency: 45.0% (math) 45.0% (reading)
> Adults with a bachelor’s degree: 36.9% (8th highest)
> Children who live in low income families: 22.8%

4. Connecticut
> High school graduation rate: 87.4% (15th highest)
> Public school spending: $18,957.84 per pupil (2nd highest)
> 8th grade proficiency: 36.0% (math) 44.0% (reading)
> Adults with a bachelor’s degree: 38.7% (5th highest)
> Children who live in low income families: 29.3%
[in-text-ad-2]
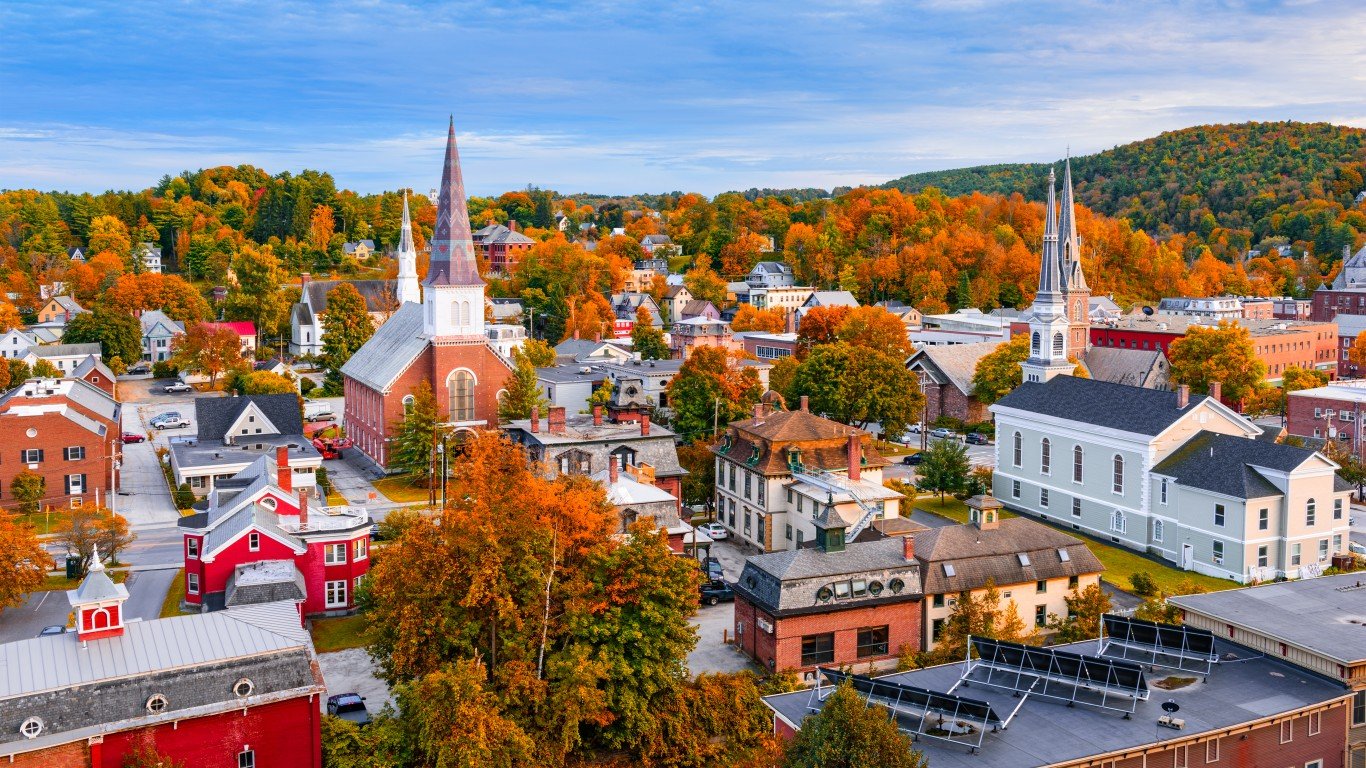
5. Vermont
> High school graduation rate: 87.7% (11th highest)
> Public school spending: $17,872.88 per pupil (4th highest)
> 8th grade proficiency: 39.0% (math) 45.0% (reading)
> Adults with a bachelor’s degree: 38.3% (7th highest)
> Children who live in low income families: 33.6%
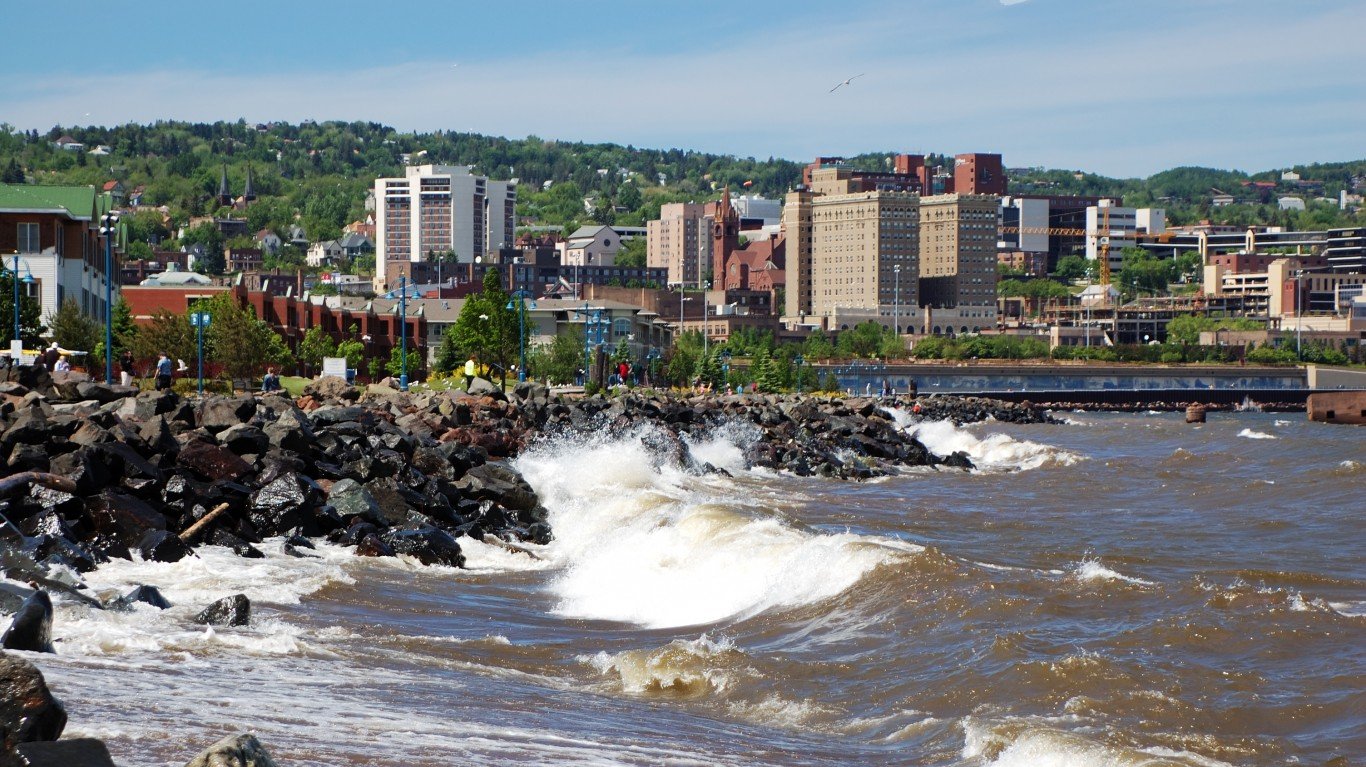
6. Minnesota
> High school graduation rate: 82.2% (16th lowest)
> Public school spending: $12,381.96 per pupil (17th highest)
> 8th grade proficiency: 46.0% (math) 39.0% (reading)
> Adults with a bachelor’s degree: 36.1% (9th highest)
> Children who live in low income families: 28.3%
[in-text-ad]

7. Virginia
> High school graduation rate: 86.7% (20th highest)
> Public school spending: $11,432.34 per pupil (24th highest)
> 8th grade proficiency: 40.0% (math) 37.0% (reading)
> Adults with a bachelor’s degree: 38.7% (5th highest)
> Children who live in low income families: 30.6%
[recirclink id=488594]

8. Wyoming
> High school graduation rate: 80.0% (12th lowest)
> Public school spending: $16,441.98 per pupil (6th highest)
> 8th grade proficiency: 38.0% (math) 38.0% (reading)
> Adults with a bachelor’s degree: 27.6% (13th lowest)
> Children who live in low income families: 34.4%
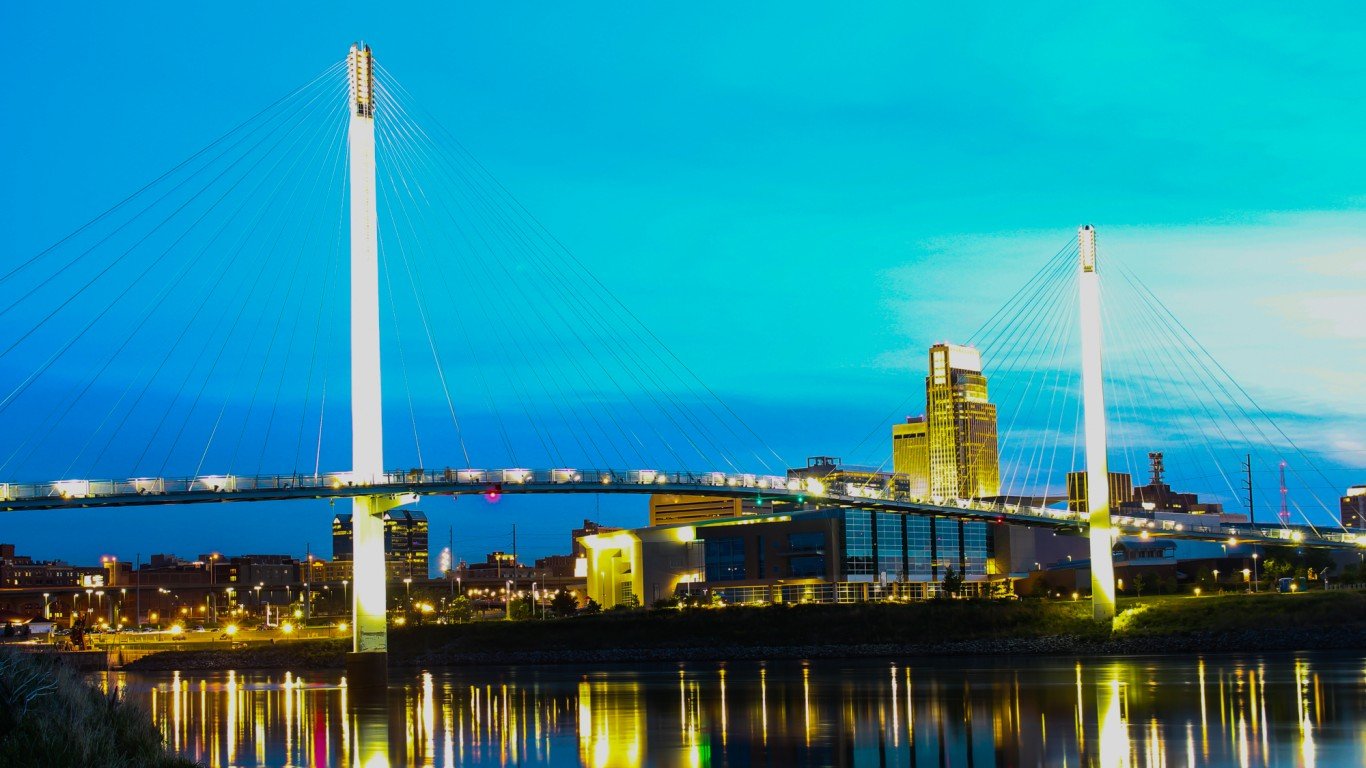
9. Nebraska
> High school graduation rate: 89.3% (4th highest)
> Public school spending: $12,298.90 per pupil (18th highest)
> 8th grade proficiency: 41.0% (math) 38.0% (reading)
> Adults with a bachelor’s degree: 31.7% (21st highest)
> Children who live in low income families: 36.4%
[in-text-ad-2]
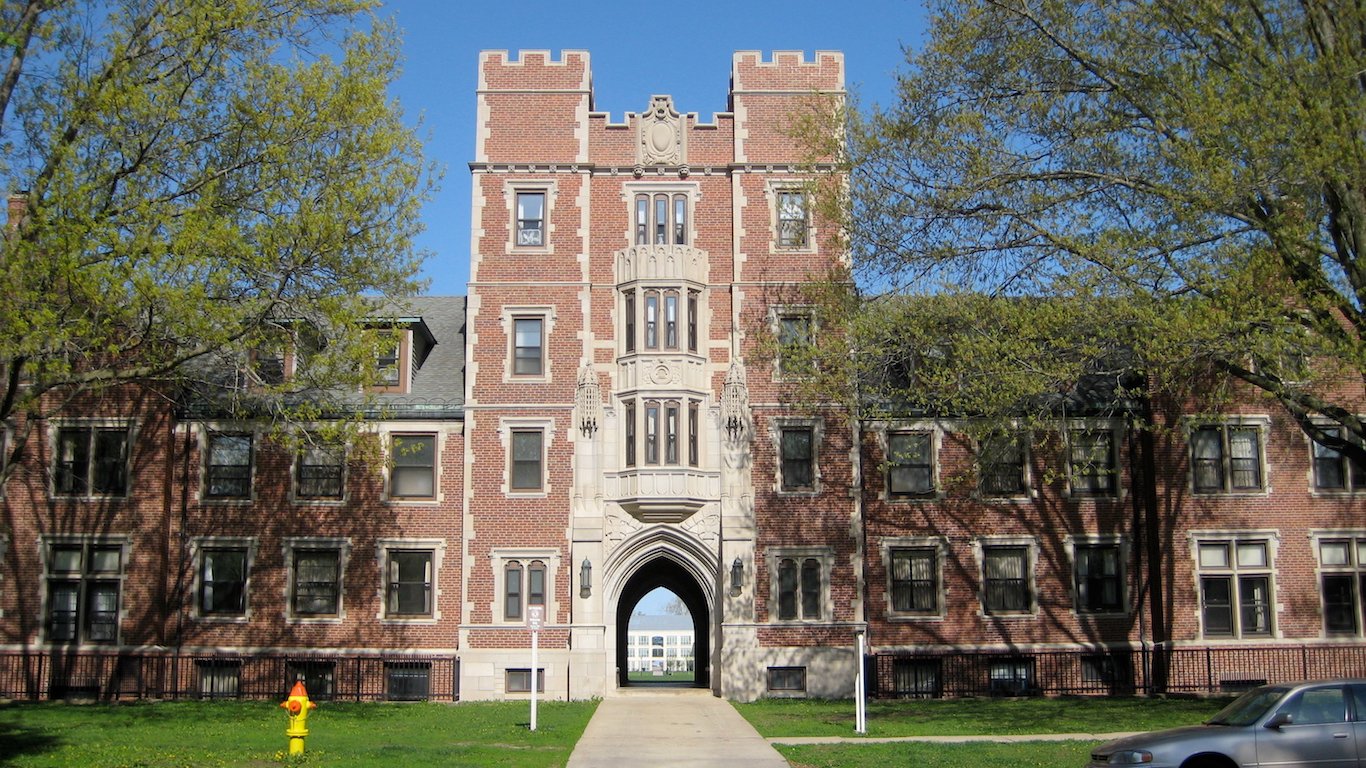
10. Iowa
> High school graduation rate: 91.3% (the highest)
> Public school spending: $11,150.21 per pupil (24th lowest)
> 8th grade proficiency: 37.0% (math) 37.0% (reading)
> Adults with a bachelor’s degree: 28.9% (18th lowest)
> Children who live in low income families: 32.8%

11. Utah
> High school graduation rate: 85.2% (24th lowest)
> Public school spending: $6,953.12 per pupil (the lowest)
> 8th grade proficiency: 39.0% (math) 38.0% (reading)
> Adults with a bachelor’s degree: 34.6% (12th highest)
> Children who live in low income families: 31.5%
[in-text-ad]

12. Maryland
> High school graduation rate: 87.6% (12th highest)
> Public school spending: $14,205.77 per pupil (12th highest)
> 8th grade proficiency: 33.0% (math) 38.0% (reading)
> Adults with a bachelor’s degree: 39.7% (3rd highest)
> Children who live in low income families: 28.8%
[recirclink id=488561]
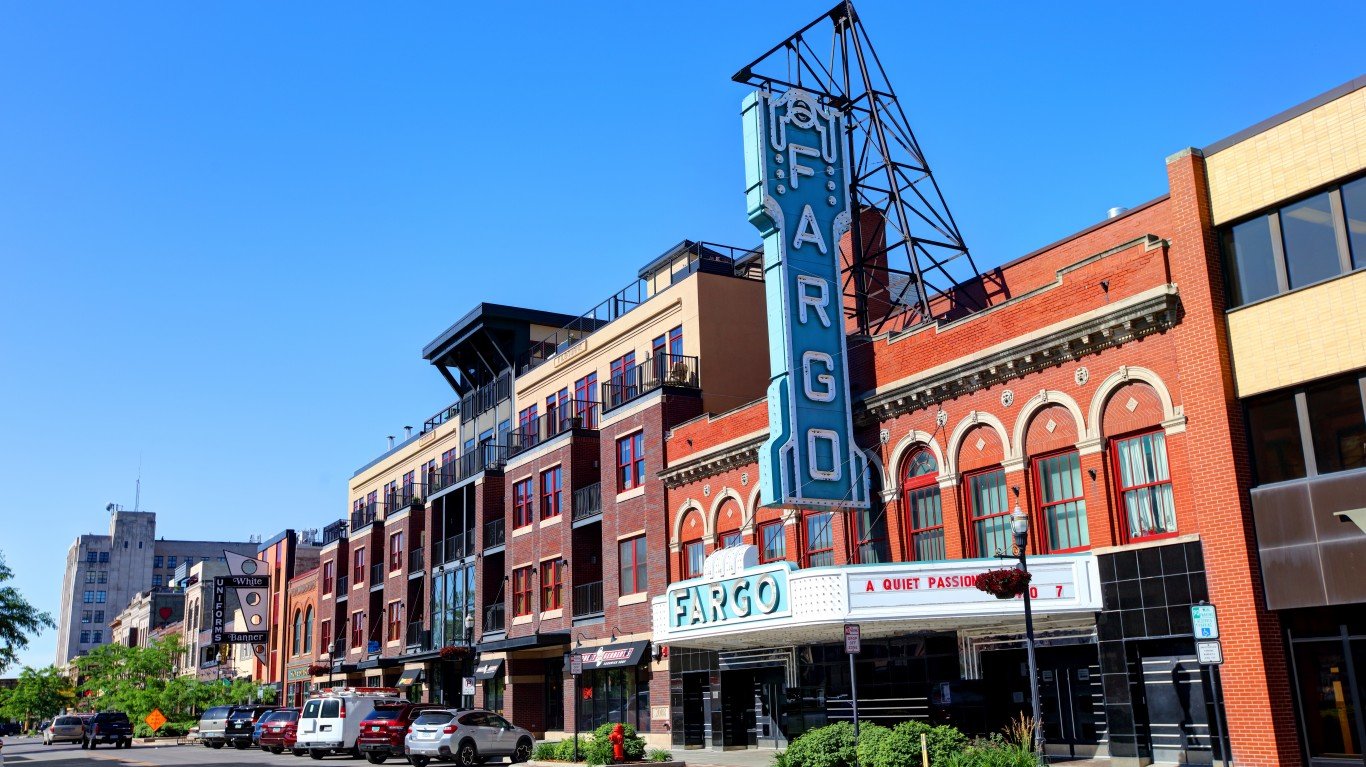
13. North Dakota
> High school graduation rate: 87.5% (13th highest)
> Public school spending: $13,372.86 per pupil (15th highest)
> 8th grade proficiency: 40.0% (math) 33.0% (reading)
> Adults with a bachelor’s degree: 30.7% (25th lowest)
> Children who live in low income families: 27.7%
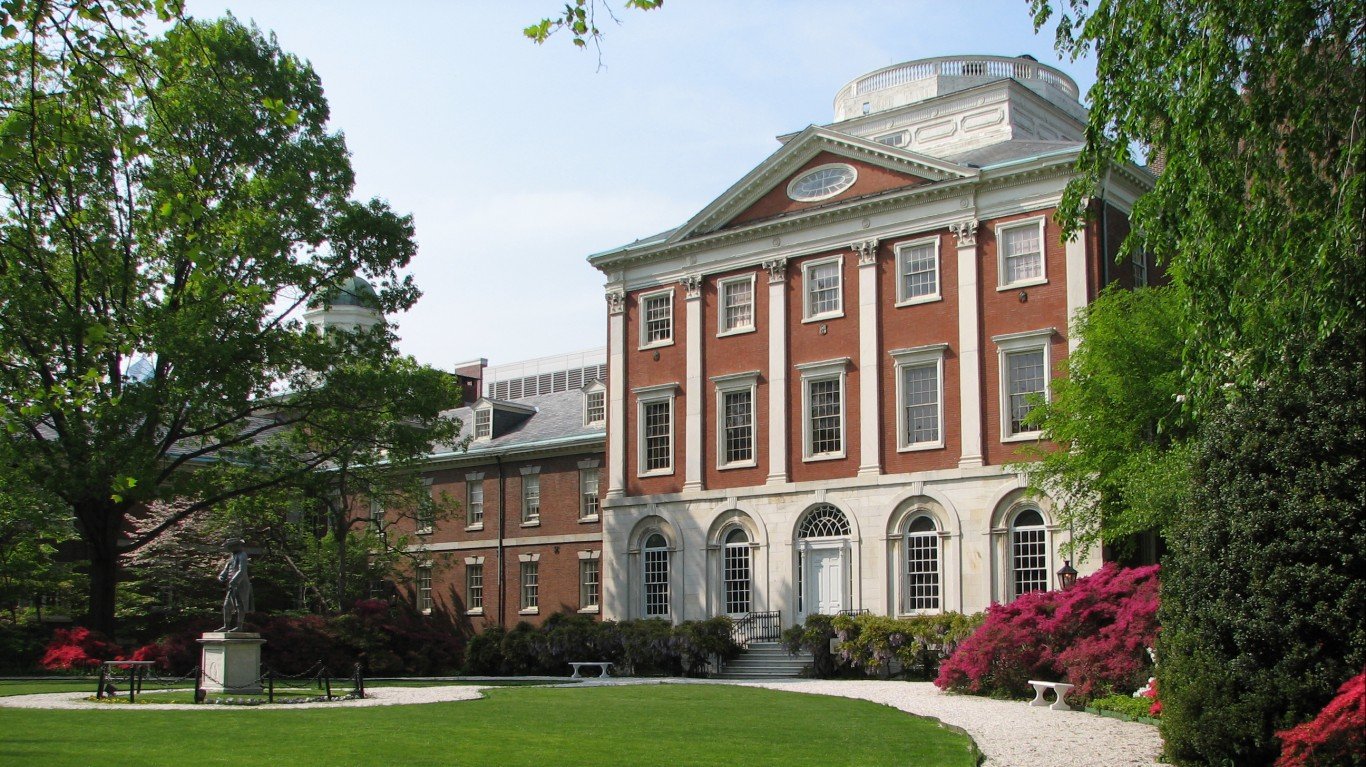
14. Pennsylvania
> High school graduation rate: 86.1% (21st highest)
> Public school spending: $15,417.53 per pupil (9th highest)
> 8th grade proficiency: 38.0% (math) 40.0% (reading)
> Adults with a bachelor’s degree: 31.4% (23rd highest)
> Children who live in low income families: 35.4%
[in-text-ad-2]

15. Colorado
> High school graduation rate: 78.9% (6th lowest)
> Public school spending: $9,574.74 per pupil (13th lowest)
> 8th grade proficiency: 38.0% (math) 41.0% (reading)
> Adults with a bachelor’s degree: 41.2% (2nd highest)
> Children who live in low income families: 30.9%
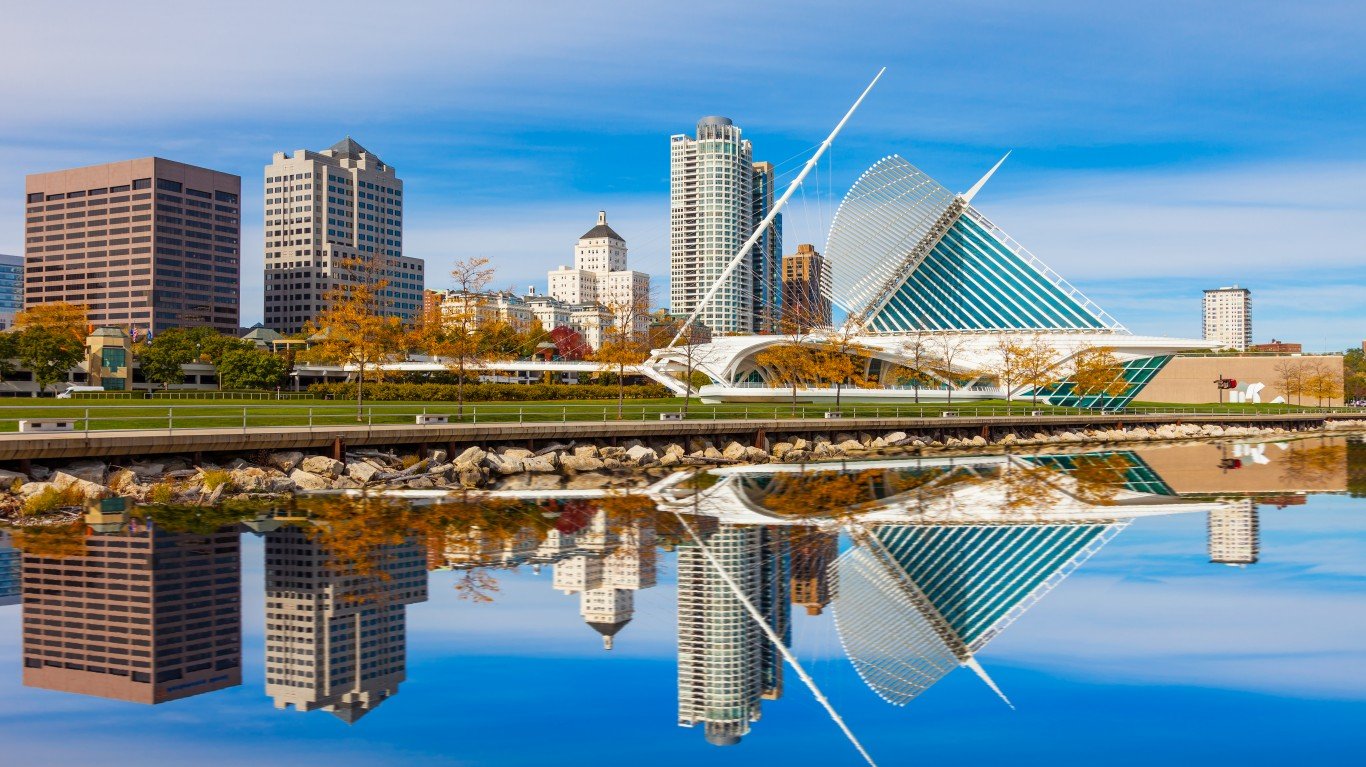
16. Wisconsin
> High school graduation rate: 88.2% (9th highest)
> Public school spending: $11,456.00 per pupil (23rd highest)
> 8th grade proficiency: 39.0% (math) 39.0% (reading)
> Adults with a bachelor’s degree: 30.4% (24th lowest)
> Children who live in low income families: 33.9%
[in-text-ad]

17. Washington
> High school graduation rate: 79.7% (11th lowest)
> Public school spending: $11,534.19 per pupil (21st highest)
> 8th grade proficiency: 41.0% (math) 42.0% (reading)
> Adults with a bachelor’s degree: 35.5% (11th highest)
> Children who live in low income families: 32.4%
[recirclink id=488514]
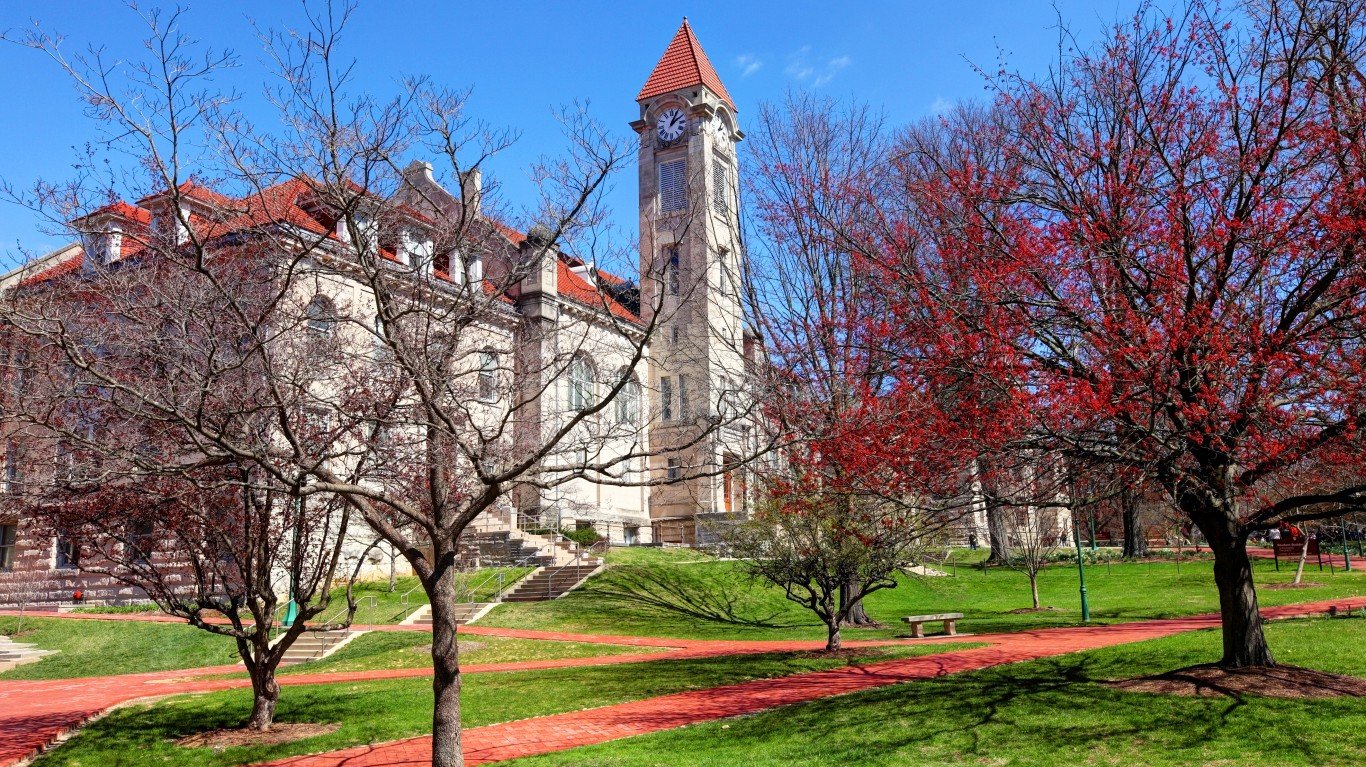
18. Indiana
> High school graduation rate: 86.8% (19th highest)
> Public school spending: $9,856.31 per pupil (17th lowest)
> 8th grade proficiency: 38.0% (math) 41.0% (reading)
> Adults with a bachelor’s degree: 26.8% (10th lowest)
> Children who live in low income families: 39.8%
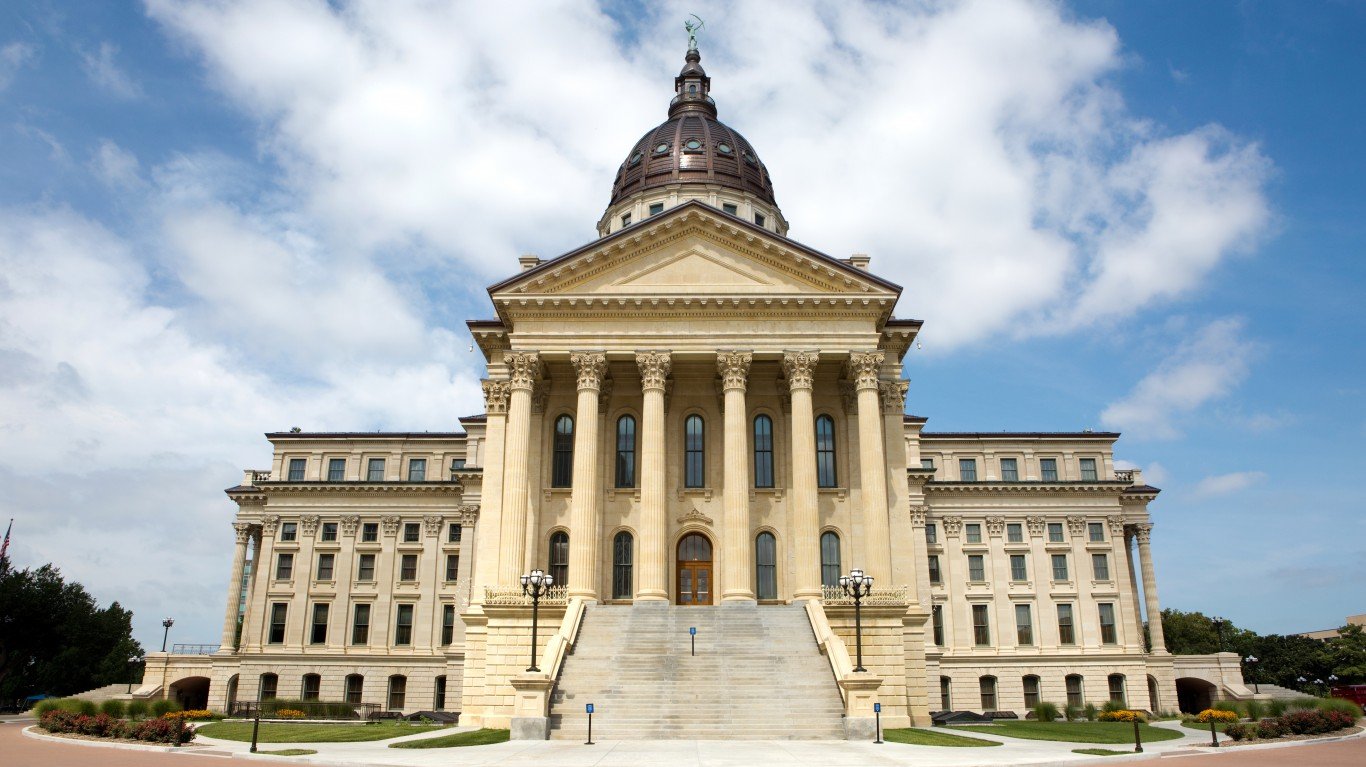
19. Kansas
> High school graduation rate: 85.7% (23rd highest)
> Public school spending: $9,959.64 per pupil (19th lowest)
> 8th grade proficiency: 35.0% (math) 37.0% (reading)
> Adults with a bachelor’s degree: 33.7% (14th highest)
> Children who live in low income families: 38.0%
[in-text-ad-2]
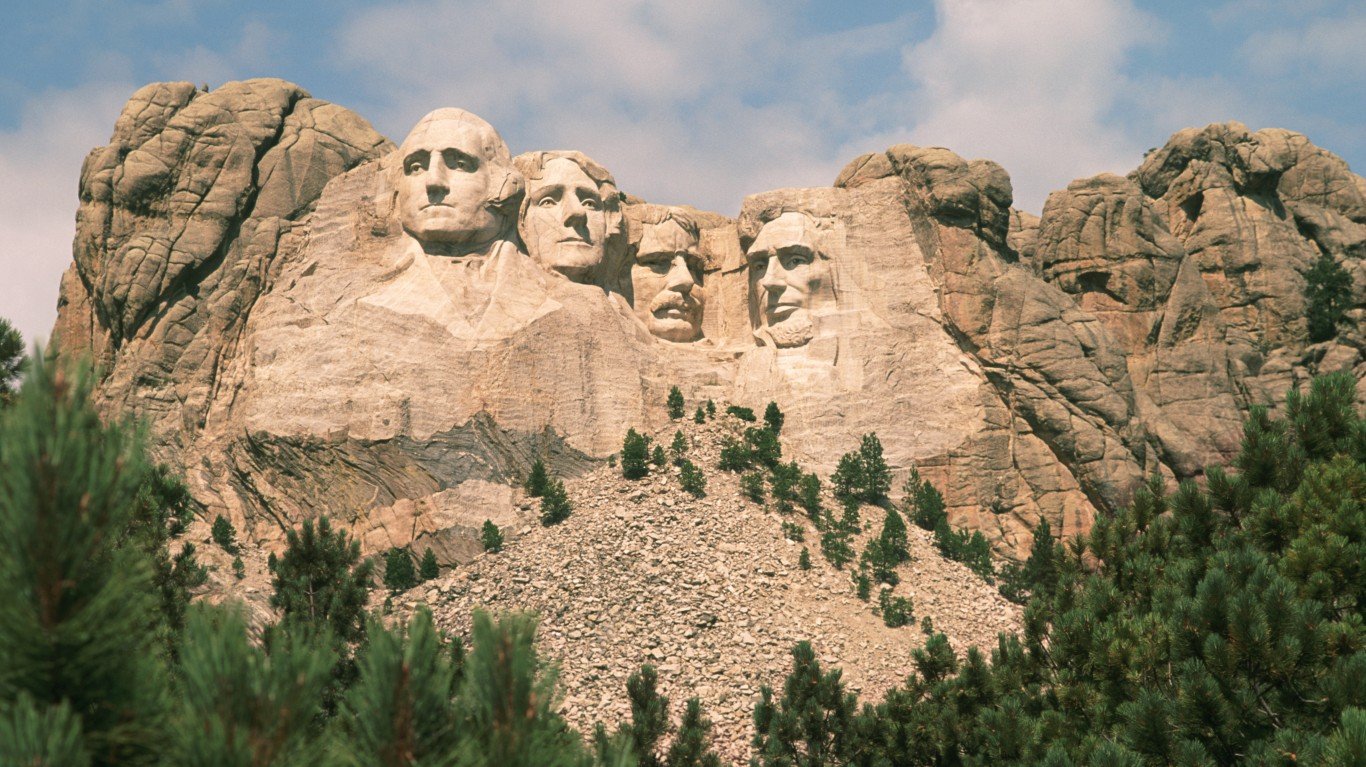
20. South Dakota
> High school graduation rate: 83.9% (23rd lowest)
> Public school spending: $9,175.74 per pupil (11th lowest)
> 8th grade proficiency: 38.0% (math) 36.0% (reading)
> Adults with a bachelor’s degree: 28.1% (16th lowest)
> Children who live in low income families: 34.6%

21. Maine
> High school graduation rate: 87.0% (17th highest)
> Public school spending: $13,278.16 per pupil (16th highest)
> 8th grade proficiency: 36.0% (math) 39.0% (reading)
> Adults with a bachelor’s degree: 32.1% (20th highest)
> Children who live in low income families: 31.7%
[in-text-ad]
22. Montana
> High school graduation rate: 85.6% (24th highest)
> Public school spending: $11,348.31 per pupil (25th highest)
> 8th grade proficiency: 37.0% (math) 35.0% (reading)
> Adults with a bachelor’s degree: 32.3% (19th highest)
> Children who live in low income families: 37.8%
[recirclink id=488498]
23. Ohio
> High school graduation rate: 83.5% (22nd lowest)
> Public school spending: $12,102.15 per pupil (19th highest)
> 8th grade proficiency: 40.0% (math) 39.0% (reading)
> Adults with a bachelor’s degree: 28.0% (15th lowest)
> Children who live in low income families: 40.0%

24. Illinois
> High school graduation rate: 85.5% (25th highest)
> Public school spending: $14,180.03 per pupil (13th highest)
> 8th grade proficiency: 32.0% (math) 36.0% (reading)
> Adults with a bachelor’s degree: 34.4% (13th highest)
> Children who live in low income families: 36.6%
[in-text-ad-2]

25. Delaware
> High school graduation rate: 85.5% (25th highest)
> Public school spending: $14,713.37 per pupil (11th highest)
> 8th grade proficiency: 28.0% (math) 33.0% (reading)
> Adults with a bachelor’s degree: 31.5% (22nd highest)
> Children who live in low income families: 37.4%

26. New York
> High school graduation rate: 80.4% (13th lowest)
> Public school spending: $22,366.37 per pupil (the highest)
> 8th grade proficiency: 34.0% (math) 34.0% (reading)
> Adults with a bachelor’s degree: 36.0% (10th highest)
> Children who live in low income families: 38.9%
[in-text-ad]
27. Florida
> High school graduation rate: 80.7% (14th lowest)
> Public school spending: $8,919.96 per pupil (8th lowest)
> 8th grade proficiency: 29.0% (math) 35.0% (reading)
> Adults with a bachelor’s degree: 29.7% (23rd lowest)
> Children who live in low income families: 45.2%
[recirclink id=488094]
28. North Carolina
> High school graduation rate: 85.9% (22nd highest)
> Public school spending: $8,792.05 per pupil (6th lowest)
> 8th grade proficiency: 35.0% (math) 33.0% (reading)
> Adults with a bachelor’s degree: 31.3% (24th highest)
> Children who live in low income families: 42.5%

29. Rhode Island
> High school graduation rate: 82.8% (20th lowest)
> Public school spending: $15,531.56 per pupil (8th highest)
> 8th grade proficiency: 30.0% (math) 37.0% (reading)
> Adults with a bachelor’s degree: 33.5% (17th highest)
> Children who live in low income families: 32.4%
[in-text-ad-2]

30. Missouri
> High school graduation rate: 89.0% (6th highest)
> Public school spending: $10,312.78 per pupil (21st lowest)
> 8th grade proficiency: 30.0% (math) 35.0% (reading)
> Adults with a bachelor’s degree: 29.1% (20th lowest)
> Children who live in low income families: 40.5%
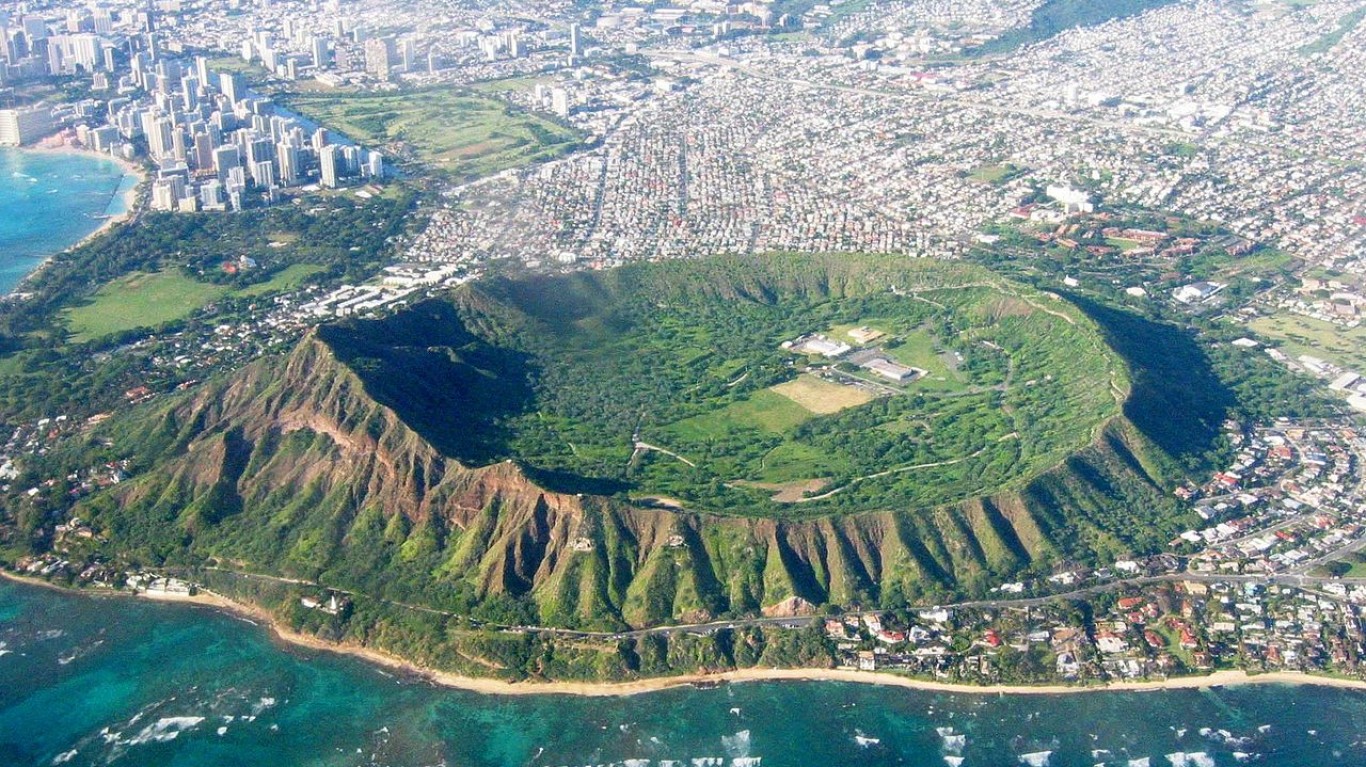
31. Hawaii
> High school graduation rate: 82.7% (19th lowest)
> Public school spending: $13,748.28 per pupil (14th highest)
> 8th grade proficiency: 27.0% (math) 30.0% (reading)
> Adults with a bachelor’s degree: 32.9% (18th highest)
> Children who live in low income families: 27.1%
[in-text-ad]

32. Kentucky
> High school graduation rate: 88.6% (7th highest)
> Public school spending: $9,862.91 per pupil (18th lowest)
> 8th grade proficiency: 29.0% (math) 34.0% (reading)
> Adults with a bachelor’s degree: 24.0% (5th lowest)
> Children who live in low income families: 42.5%
[recirclink id=488247]
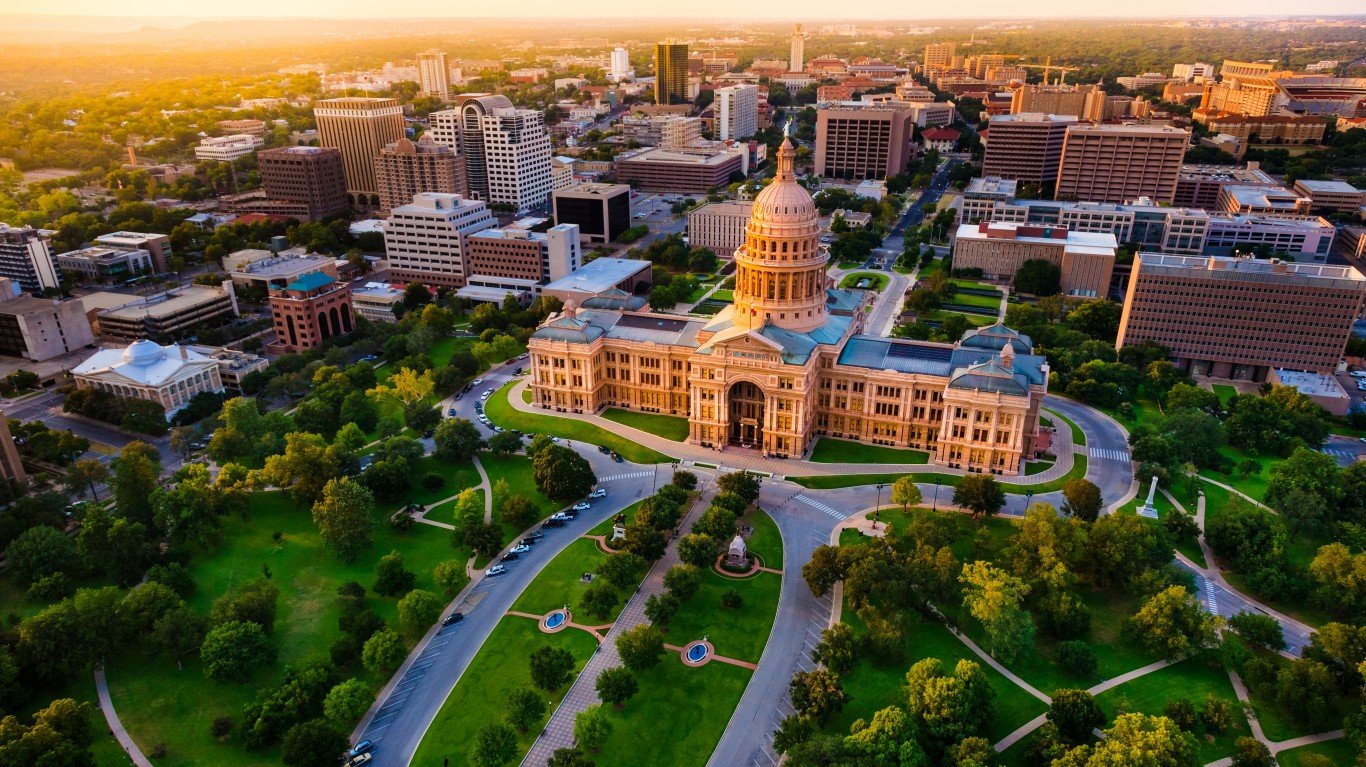
33. Texas
> High school graduation rate: 89.1% (5th highest)
> Public school spending: $9,015.87 per pupil (10th lowest)
> 8th grade proficiency: 33.0% (math) 28.0% (reading)
> Adults with a bachelor’s degree: 29.6% (22nd lowest)
> Children who live in low income families: 44.4%

34. Idaho
> High school graduation rate: 79.7% (11th lowest)
> Public school spending: $7,157.40 per pupil (2nd lowest)
> 8th grade proficiency: 35.0% (math) 39.0% (reading)
> Adults with a bachelor’s degree: 26.8% (10th lowest)
> Children who live in low income families: 41.5%
[in-text-ad-2]

35. Georgia
> High school graduation rate: 79.4% (7th lowest)
> Public school spending: $9,768.71 per pupil (15th lowest)
> 8th grade proficiency: 31.0% (math) 35.0% (reading)
> Adults with a bachelor’s degree: 30.9% (25th highest)
> Children who live in low income families: 43.9%

36. Tennessee
> High school graduation rate: 88.5% (8th highest)
> Public school spending: $8,809.82 per pupil (7th lowest)
> 8th grade proficiency: 30.0% (math) 31.0% (reading)
> Adults with a bachelor’s degree: 27.3% (12th lowest)
> Children who live in low income families: 43.9%
[in-text-ad]

37. Oregon
> High school graduation rate: 74.8% (3rd lowest)
> Public school spending: $10,841.59 per pupil (22nd lowest)
> 8th grade proficiency: 34.0% (math) 36.0% (reading)
> Adults with a bachelor’s degree: 33.7% (14th highest)
> Children who live in low income families: 38.1%
[recirclink id=488174]
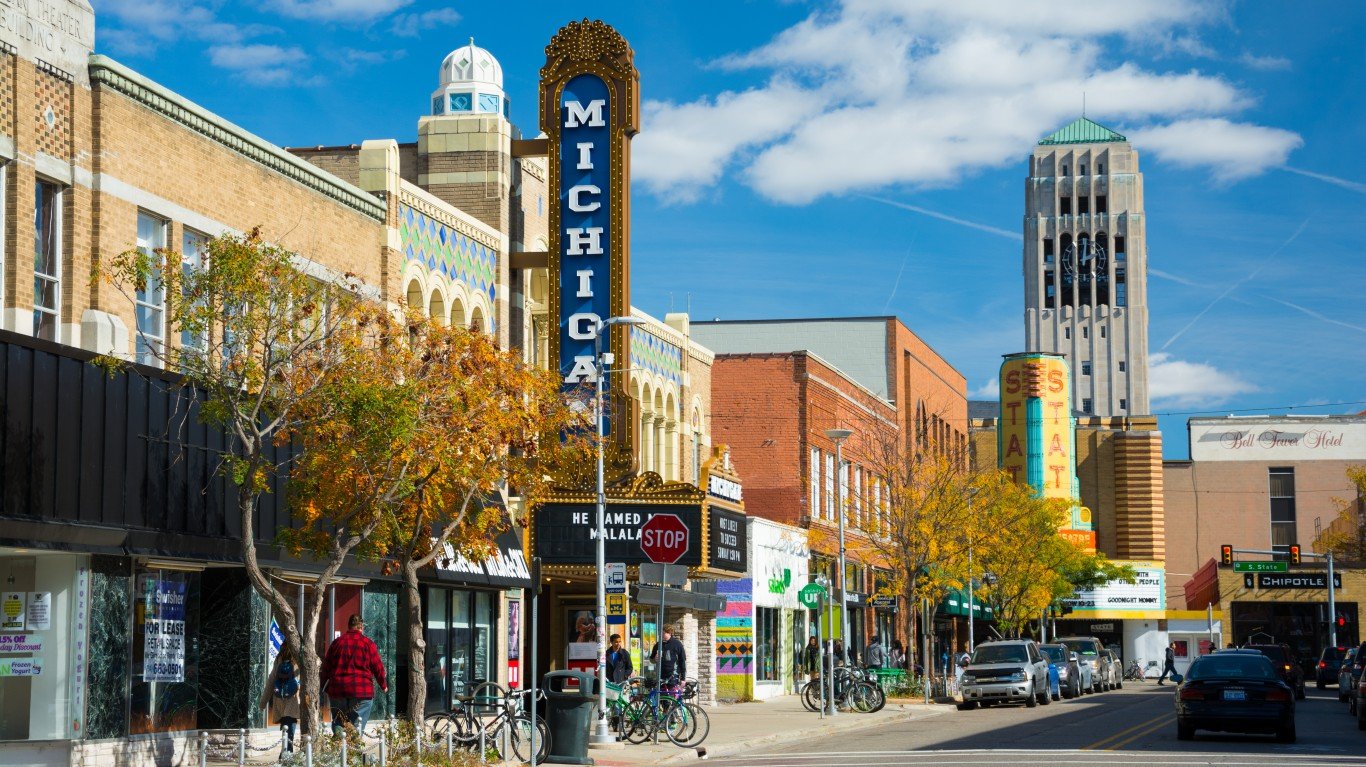
38. Michigan
> High school graduation rate: 79.7% (11th lowest)
> Public school spending: $11,667.99 per pupil (20th highest)
> 8th grade proficiency: 31.0% (math) 34.0% (reading)
> Adults with a bachelor’s degree: 29.1% (20th lowest)
> Children who live in low income families: 40.5%

39. Arkansas
> High school graduation rate: 87.0% (17th highest)
> Public school spending: $9,845.57 per pupil (16th lowest)
> 8th grade proficiency: 25.0% (math) 29.0% (reading)
> Adults with a bachelor’s degree: 23.4% (3rd lowest)
> Children who live in low income families: 48.8%
[in-text-ad-2]
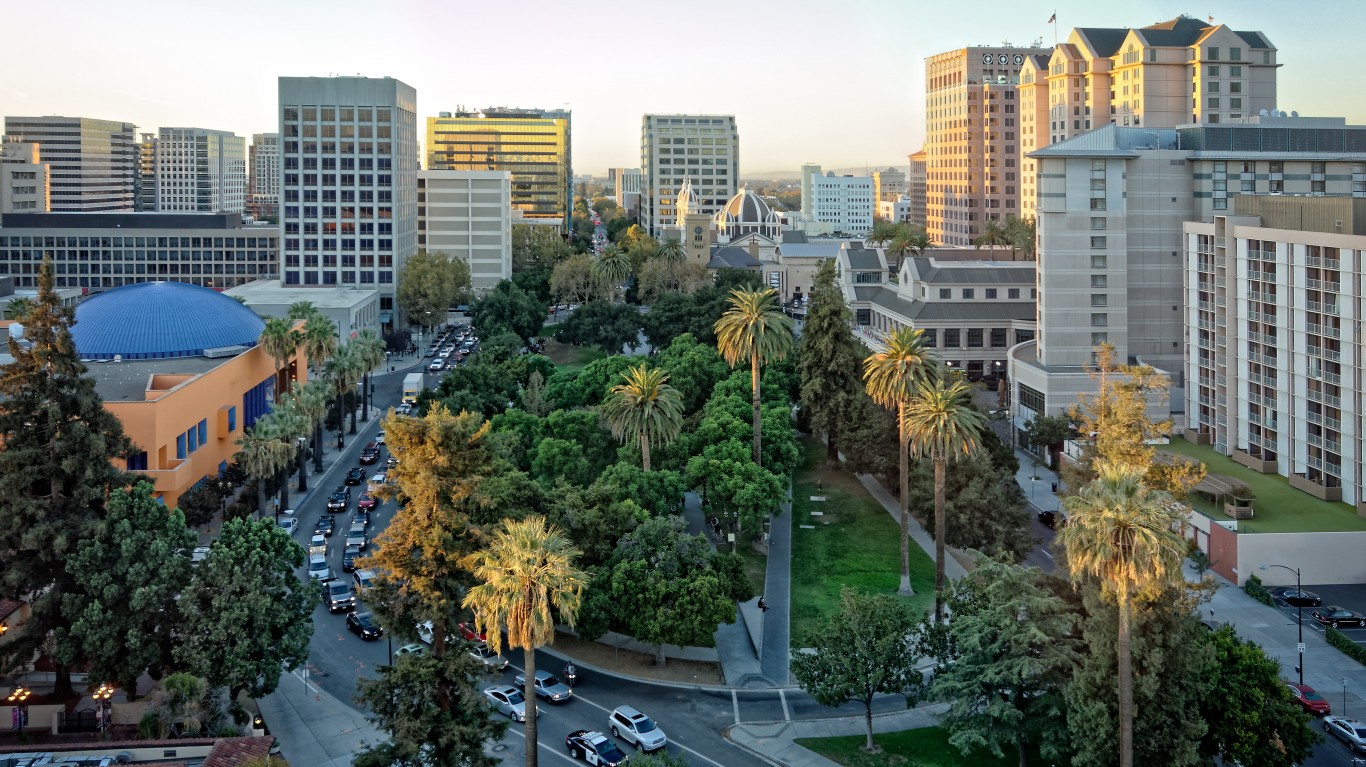
40. California
> High school graduation rate: 83.0% (21st lowest)
> Public school spending: $11,495.33 per pupil (22nd highest)
> 8th grade proficiency: 29.0% (math) 32.0% (reading)
> Adults with a bachelor’s degree: 33.6% (16th highest)
> Children who live in low income families: 39.5%

41. South Carolina
> High school graduation rate: 82.6% (18th lowest)
> Public school spending: $10,249.07 per pupil (20th lowest)
> 8th grade proficiency: 26.0% (math) 30.0% (reading)
> Adults with a bachelor’s degree: 28.0% (15th lowest)
> Children who live in low income families: 46.5%
[in-text-ad]

42. Oklahoma
> High school graduation rate: 81.6% (15th lowest)
> Public school spending: $8,097.02 per pupil (4th lowest)
> 8th grade proficiency: 24.0% (math) 28.0% (reading)
> Adults with a bachelor’s degree: 25.5% (8th lowest)
> Children who live in low income families: 47.0%
[recirclink id=487977]
43. West Virginia
> High school graduation rate: 89.8% (3rd highest)
> Public school spending: $11,290.52 per pupil (25th lowest)
> 8th grade proficiency: 24.0% (math) 28.0% (reading)
> Adults with a bachelor’s degree: 20.2% (the lowest)
> Children who live in low income families: 46.3%
44. Alaska
> High school graduation rate: 76.1% (4th lowest)
> Public school spending: $17,509.98 per pupil (5th highest)
> 8th grade proficiency: 29.0% (math) 26.0% (reading)
> Adults with a bachelor’s degree: 28.8% (17th lowest)
> Children who live in low income families: 33.3%
[in-text-ad-2]

45. Arizona
> High school graduation rate: 79.5% (8th lowest)
> Public school spending: $7,613.01 per pupil (3rd lowest)
> 8th grade proficiency: 34.0% (math) 30.0% (reading)
> Adults with a bachelor’s degree: 29.4% (21st lowest)
> Children who live in low income families: 44.8%
46. Alabama
> High school graduation rate: 87.1% (16th highest)
> Public school spending: $9,236.42 per pupil (12th lowest)
> 8th grade proficiency: 21.0% (math) 28.0% (reading)
> Adults with a bachelor’s degree: 25.5% (8th lowest)
> Children who live in low income families: 46.2%
[in-text-ad]

47. Nevada
> High school graduation rate: 73.6% (2nd lowest)
> Public school spending: $8,960.11 per pupil (9th lowest)
> 8th grade proficiency: 27.0% (math) 28.0% (reading)
> Adults with a bachelor’s degree: 24.9% (6th lowest)
> Children who live in low income families: 41.6%
[recirclink id=487572]

48. Mississippi
> High school graduation rate: 82.3% (17th lowest)
> Public school spending: $8,701.85 per pupil (5th lowest)
> 8th grade proficiency: 22.0% (math) 25.0% (reading)
> Adults with a bachelor’s degree: 21.9% (2nd lowest)
> Children who live in low income families: 51.2%
49. Louisiana
> High school graduation rate: 78.6% (5th lowest)
> Public school spending: $11,038.30 per pupil (23rd lowest)
> 8th grade proficiency: 19.0% (math) 25.0% (reading)
> Adults with a bachelor’s degree: 23.8% (4th lowest)
> Children who live in low income families: 49.3%
[in-text-ad-2]

50. New Mexico
> High school graduation rate: 71.0% (the lowest)
> Public school spending: $9,692.70 per pupil (14th lowest)
> 8th grade proficiency: 20.0% (math) 24.0% (reading)
> Adults with a bachelor’s degree: 27.1% (11th lowest)
> Children who live in low income families: 52.9%
Contact [email protected] for any questions or corrections.