
[cnxvideo id=”769879″ placement=”prodege”]The U.S. population growth rate recently hit a low point not seen since 1937, when the country was in the thick of the Great Depression. The U.S. population grew by just 0.62% between July 2017 and July 2018, according to Census Bureau data.
The slowing national population growth appears to be part of a long-term trend. Still, population growth rates vary in different parts of the country, and some areas buck the national trend. In nearly every state, there is at least one city that has reported rapid population growth in recent years.
24/7 Wall St. reviewed U.S. Census Bureau data on 382 metro areas from 2010 to 2018 to identify the fastest growing city in each state. With only one metro area in each New Hampshire, Vermont, and Delaware, the city listed is only the fastest growing by default. Still, each of those three metro areas is growing faster than the corresponding state as a whole. It stands to reason that rapidly growing cities are desirable places to live, and not surprisingly, parts of the metro areas on this list also rank as the best city to live in the state.
Population change is the product of two factors – net migration and natural growth. Natural growth is simply the number of births over a given period less the number of deaths. Net migration is the difference between the number of new residents – either from other parts of the country or from abroad – and the number of residents who have left the area.
The slowing national population growth rate in the last year is attributable to a slowing birth rate and a climbing death rate. In the majority of the cities on this list, the strong long-term population growth is primarily attributable to natural growth. In 11 cities on this list, the population growth has been driven by domestic migration.
People often move to a new city for economic reasons such as a strong job market and high incomes that provide a level of stability attractive to young families. These cities, more often than not, have faster than average job growth and relatively low unemployment. Some even rank among the 25 cities that added the most jobs last year. Most also have a higher than typical median income.
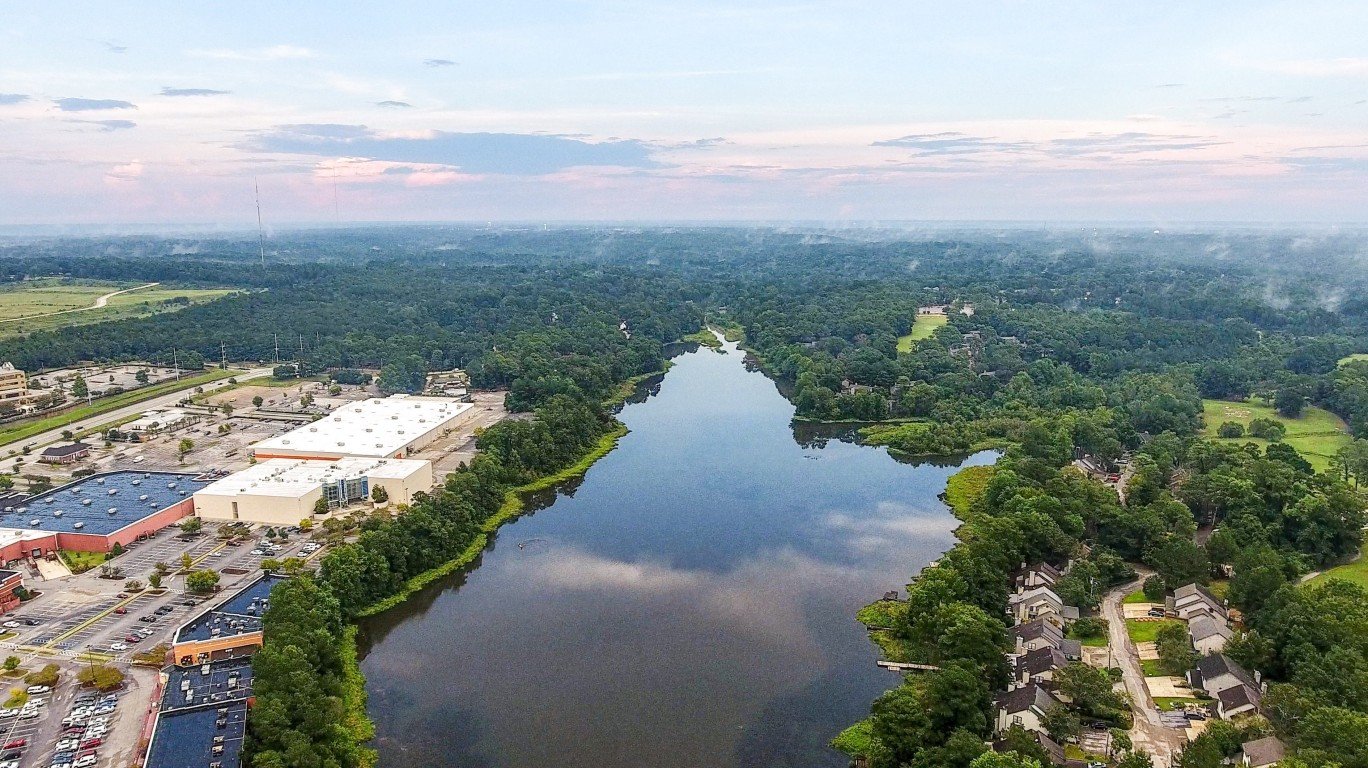
Alabama: Daphne-Fairhope-Foley
> 2010-2018 pop. growth: 19.1% (state: 2.1%)
> Feb. 2019 unemployment: 3.1% (state: 3.7%)
> 2010-2017 job growth: 23.8% (state: 6.8%)
> Median household income: $55,342 (state: $48,123)
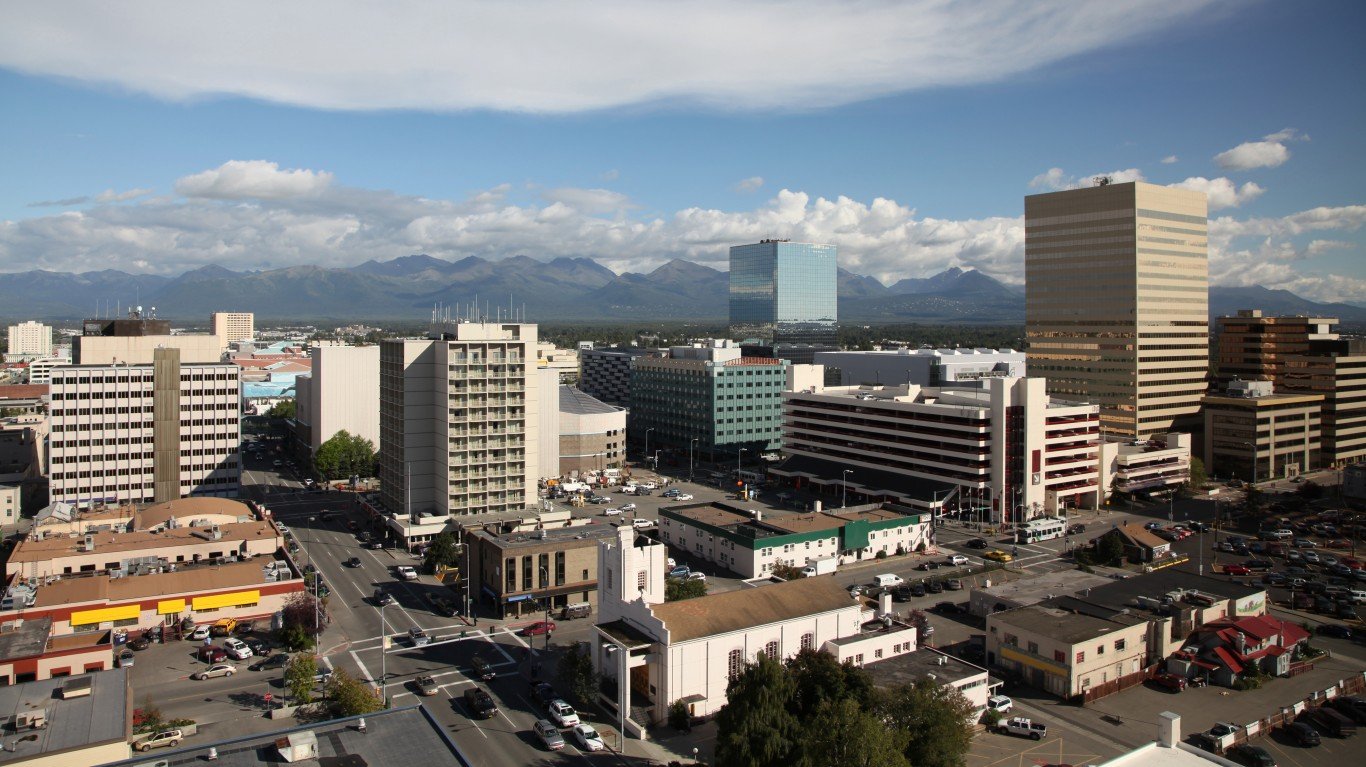
Alaska: Anchorage
> 2010-2018 pop. growth: 4.2% (state: 3.3%)
> Feb. 2019 unemployment: 5.8% (state: 6.5%)
> 2010-2017 job growth: 2.4% (state: 1.7%)
> Median household income: $76,871 (state: $73,181)
[recirclink id=515229]

Arizona: Phoenix-Mesa-Scottsdale
> 2010-2018 pop. growth: 15.6% (state: 11.9%)
> Feb. 2019 unemployment: 4.3% (state: 5.1%)
> 2010-2017 job growth: 20.1% (state: 16.6%)
> Median household income: $61,506 (state: $56,581)
Arkansas: Fayetteville-Springdale-Rogers
> 2010-2018 pop. growth: 18.0% (state: 3.1%)
> Feb. 2019 unemployment: 2.8% (state: 3.8%)
> 2010-2017 job growth: 22.3% (state: 5.9%)
> Median household income: $56,038 (state: $45,869)

California: Stockton-Lodi
> 2010-2018 pop. growth: 9.5% (state: 6.0%)
> Feb. 2019 unemployment: 6.2% (state: 4.2%)
> 2010-2017 job growth: 22.9% (state: 18.1%)
> Median household income: $61,164 (state: $71,805)

Colorado: Greeley
> 2010-2018 pop. growth: 23.7% (state: 12.8%)
> Feb. 2019 unemployment: 2.9% (state: 3.7%)
> 2010-2017 job growth: 34.1% (state: 19.9%)
> Median household income: $68,884 (state: $69,117)
[in-text-ad]

Connecticut: Bridgeport-Stamford-Norwalk
> 2010-2018 pop. growth: 2.6% (state: -0.2%)
> Feb. 2019 unemployment: 3.9% (state: 3.8%)
> 2010-2017 job growth: 5.6% (state: 4.6%)
> Median household income: $91,198 (state: $74,168)
[recirclink id=484519]

Delaware: Dover
> 2010-2018 pop. growth: 9.6% (state: 7.5%)
> Feb. 2019 unemployment: 3.3% (state: 3.4%)
> 2010-2017 job growth: 10.5% (state: 10.7%)
> Median household income: $57,608 (state: $62,852)

Florida: The Villages
> 2010-2018 pop. growth: 36.6% (state: 13.0%)
> Feb. 2019 unemployment: 5.1% (state: 3.5%)
> 2010-2017 job growth: 42.9% (state: 19.5%)
> Median household income: $54,057 (state: $52,594)
[in-text-ad-2]
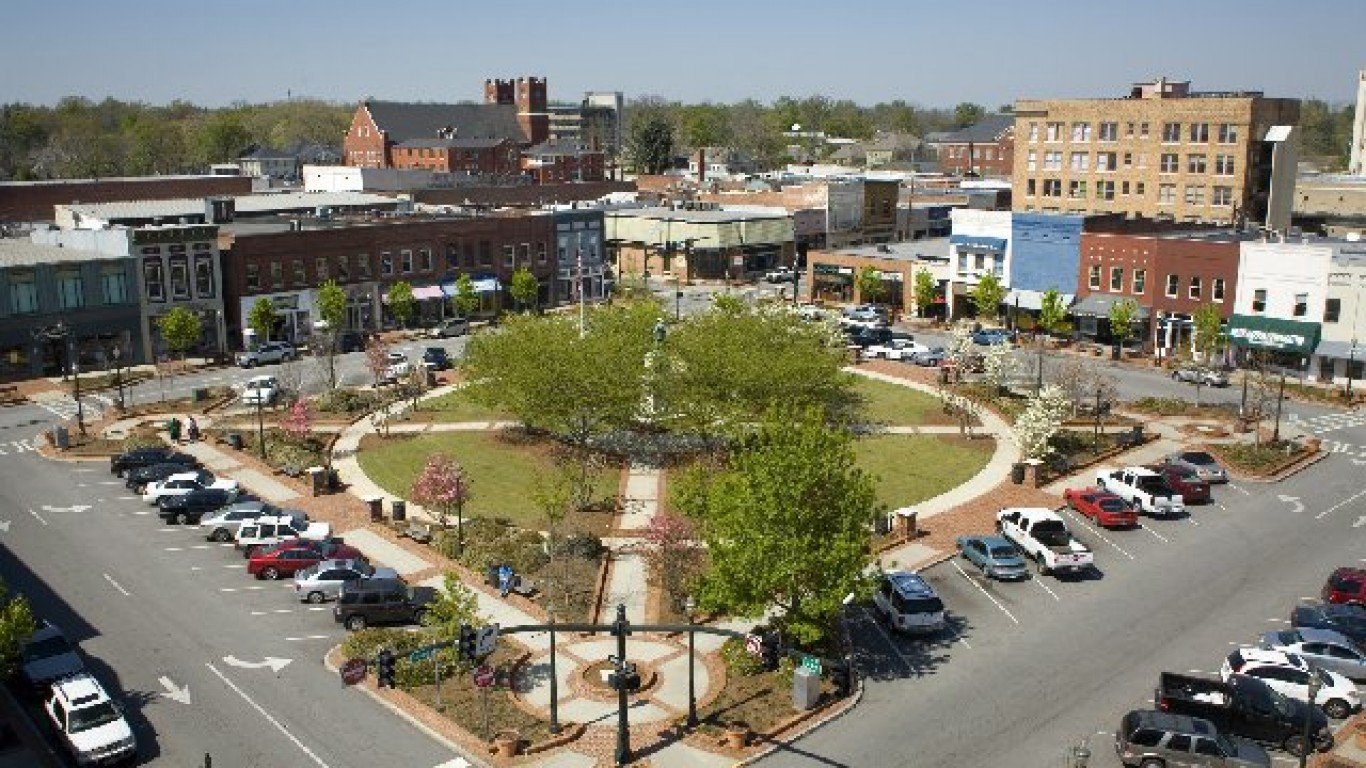
Georgia: Gainesville
> 2010-2018 pop. growth: 12.3% (state: 8.3%)
> Feb. 2019 unemployment: 3.2% (state: 3.9%)
> 2010-2017 job growth: 24.7% (state: 15.8%)
> Median household income: $61,977 (state: $56,183)

Hawaii: Kahului-Wailuku-Lahaina
> 2010-2018 pop. growth: 7.9% (state: 4.1%)
> Feb. 2019 unemployment: 2.9% (state: 2.7%)
> 2010-2017 job growth: 17.2% (state: 11.5%)
> Median household income: $80,183 (state: $77,765)
[in-text-ad]

Idaho: Boise City
> 2010-2018 pop. growth: 18.2% (state: 11.7%)
> Feb. 2019 unemployment: 2.9% (state: 2.9%)
> 2010-2017 job growth: 22.1% (state: 16.7%)
> Median household income: $55,324 (state: $52,225)
[recirclink id=520329]

Illinois: Champaign-Urbana
> 2010-2018 pop. growth: 3.1% (state: -0.8%)
> Feb. 2019 unemployment: 4.6% (state: 4.3%)
> 2010-2017 job growth: 2.5% (state: 7.9%)
> Median household income: $50,999 (state: $62,992)

Indiana: Lafayette-West Lafayette
> 2010-2018 pop. growth: 9.8% (state: 3.1%)
> Feb. 2019 unemployment: 3.4% (state: 3.5%)
> 2010-2017 job growth: 13.9% (state: 11.4%)
> Median household income: $52,224 (state: $54,181)
[in-text-ad-2]

Iowa: Des Moines-West Des Moines
> 2010-2018 pop. growth: 14.6% (state: 3.5%)
> Feb. 2019 unemployment: 2.2% (state: 2.4%)
> 2010-2017 job growth: 15.4% (state: 7.2%)
> Median household income: $68,649 (state: $58,570)
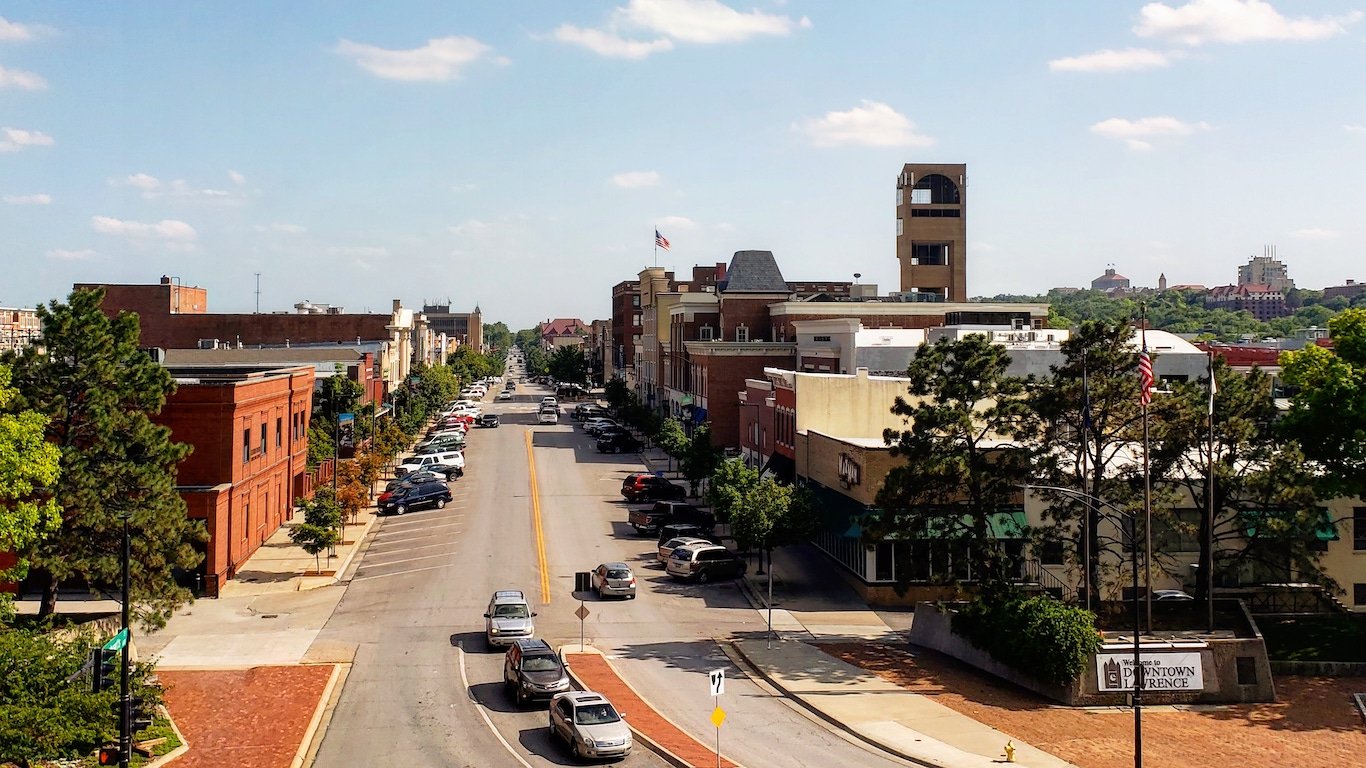
Kansas: Lawrence
> 2010-2018 pop. growth: 9.2% (state: 1.9%)
> Feb. 2019 unemployment: 3.3% (state: 3.4%)
> 2010-2017 job growth: 6.5% (state: 5.7%)
> Median household income: $55,646 (state: $56,422)
[in-text-ad]

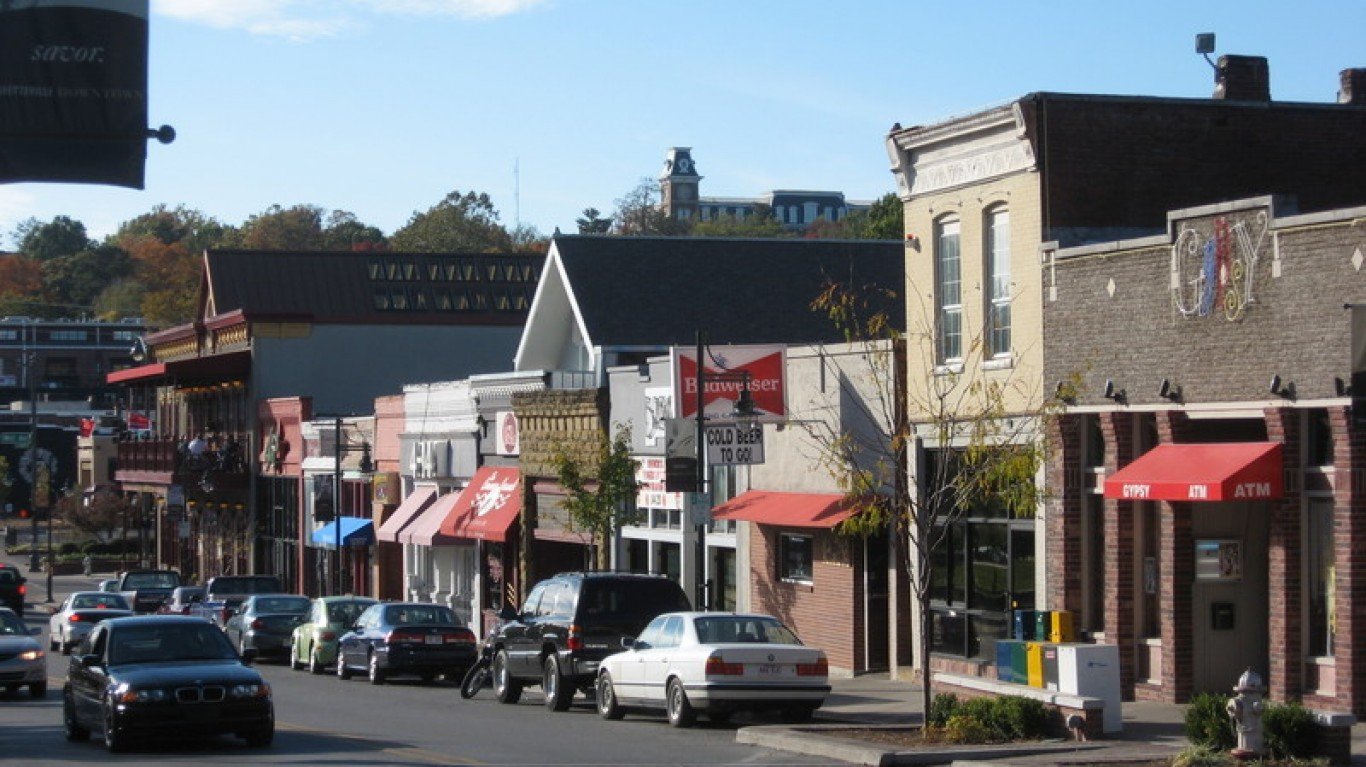
Kentucky: Bowling Green
> 2010-2018 pop. growth: 11.4% (state: 2.8%)
> Feb. 2019 unemployment: 3.6% (state: 4.1%)
> 2010-2017 job growth: 30.0% (state: 9.5%)
> Median household income: $46,478 (state: $48,375)
[recirclink id=529284]

Louisiana: Hammond
> 2010-2018 pop. growth: 10.1% (state: 2.5%)
> Feb. 2019 unemployment: 5.5% (state: 4.9%)
> 2010-2017 job growth: 5.9% (state: 4.1%)
> Median household income: $44,861 (state: $46,145)
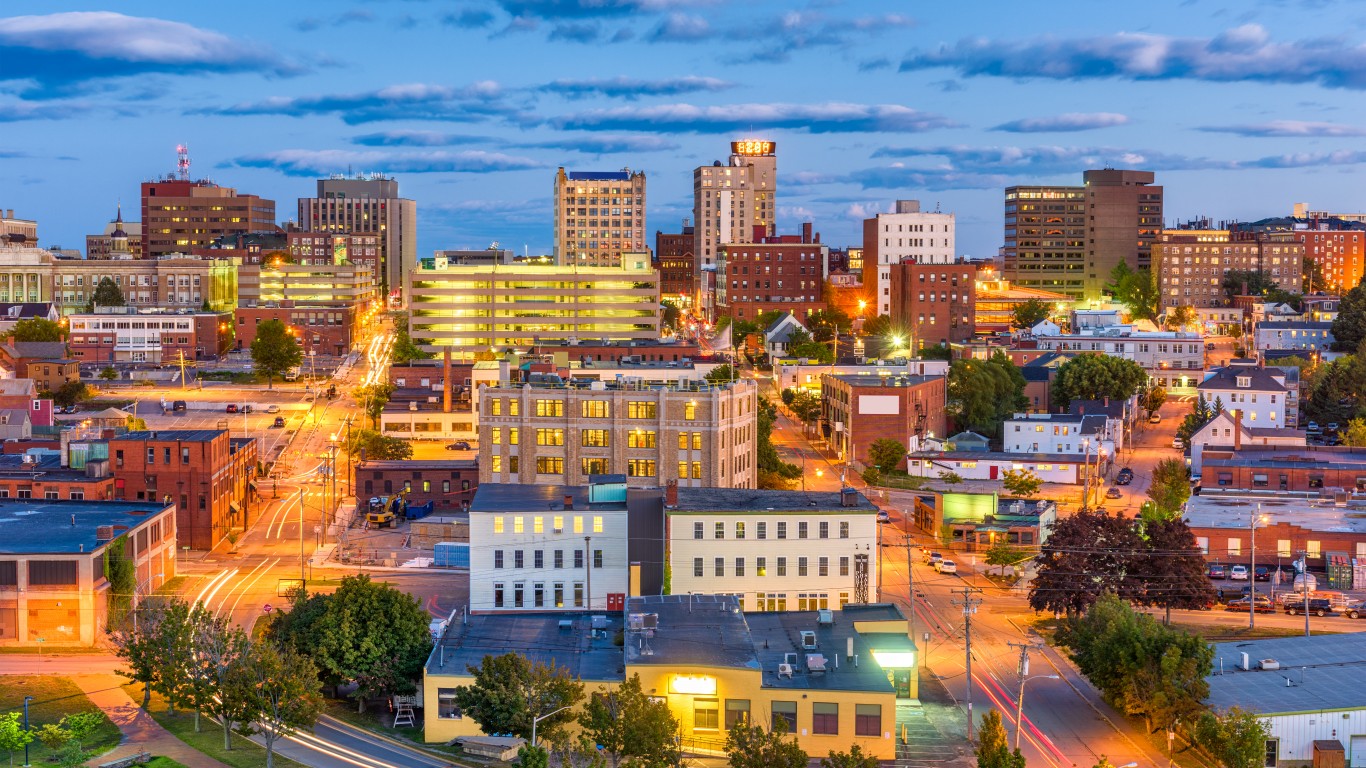
Maine: Portland-South Portland
> 2010-2018 pop. growth: 4.2% (state: 0.8%)
> Feb. 2019 unemployment: 2.8% (state: 3.4%)
> 2010-2017 job growth: 8.9% (state: 5.4%)
> Median household income: $68,570 (state: $56,277)
[in-text-ad-2]

Maryland: Salisbury
> 2010-2018 pop. growth: 9.4% (state: 4.4%)
> Feb. 2019 unemployment: 4.5% (state: 3.7%)
> 2010-2017 job growth: 209.8% (state: 8.2%)
> Median household income: $59,273 (state: $80,776)

Massachusetts: Boston-Cambridge-Newton
> 2010-2018 pop. growth: 6.8% (state: 5.1%)
> Feb. 2019 unemployment: 2.6% (state: 3%)
> 2010-2017 job growth: 13.4% (state: 12.5%)
> Median household income: $85,691 (state: $77,385)
[in-text-ad]

Michigan: Grand Rapids-Wyoming
> 2010-2018 pop. growth: 8.1% (state: 1.2%)
> Feb. 2019 unemployment: 2.6% (state: 4%)
> 2010-2017 job growth: 58.2% (state: 13.9%)
> Median household income: $61,298 (state: $54,909)
[recirclink id=515229]

Minnesota: Minneapolis-St. Paul-Bloomington
> 2010-2018 pop. growth: 8.2% (state: 5.7%)
> Feb. 2019 unemployment: 2.9% (state: 3.1%)
> 2010-2017 job growth: 14.9% (state: 11.6%)
> Median household income: $76,856 (state: $68,388)

Mississippi: Gulfport-Biloxi-Pascagoula
> 2010-2018 pop. growth: 7.0% (state: 0.5%)
> Feb. 2019 unemployment: 5% (state: 4.8%)
> 2010-2017 job growth: 47.7% (state: 5.0%)
> Median household income: $47,099 (state: $43,529)
[in-text-ad-2]

Missouri: Columbia
> 2010-2018 pop. growth: 10.3% (state: 2.2%)
> Feb. 2019 unemployment: 2.4% (state: 3.2%)
> 2010-2017 job growth: 11.1% (state: 8.1%)
> Median household income: $51,340 (state: $53,578)
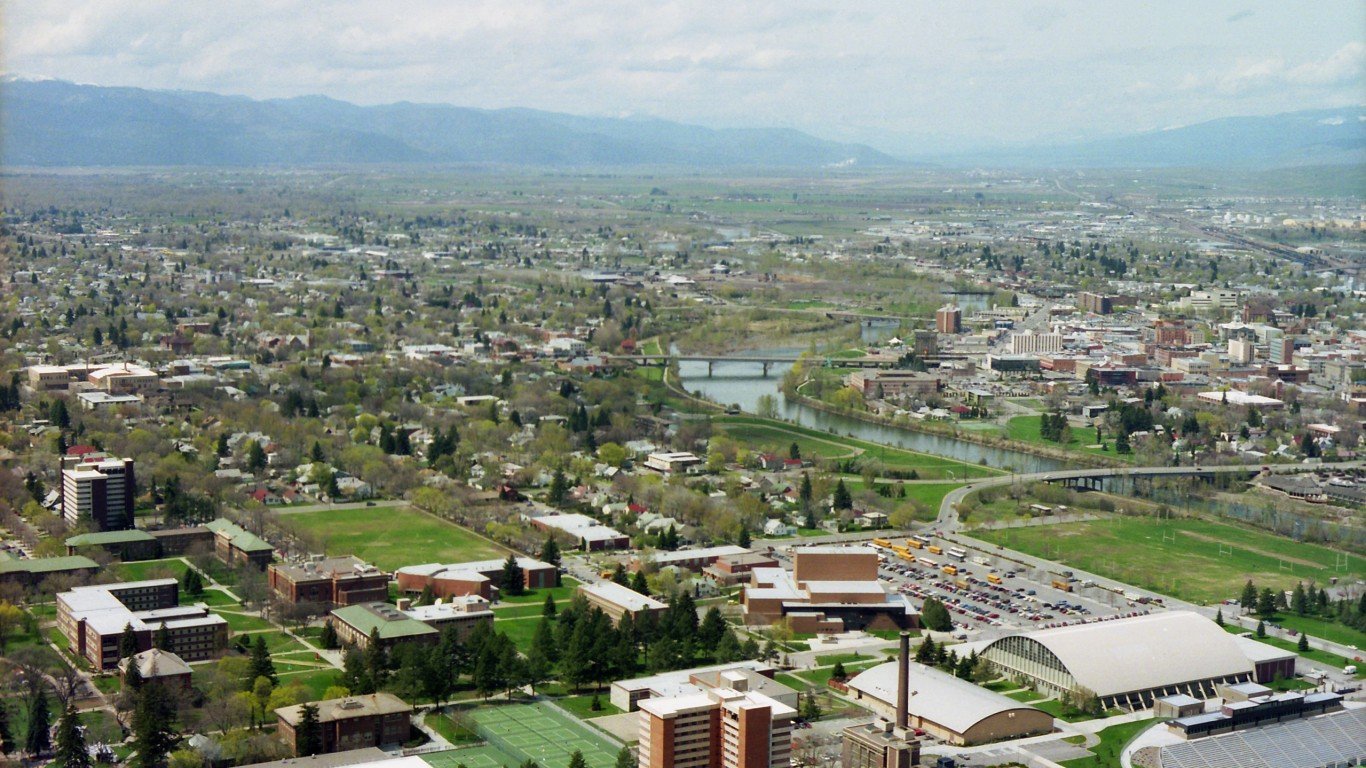
Montana: Missoula
> 2010-2018 pop. growth: 8.6% (state: 7.2%)
> Feb. 2019 unemployment: 3.4% (state: 3.8%)
> 2010-2017 job growth: 10.2% (state: 9.6%)
> Median household income: $54,311 (state: $53,386)
[in-text-ad]

Nebraska: Lincoln
> 2010-2018 pop. growth: 10.4% (state: 5.5%)
> Feb. 2019 unemployment: 2.6% (state: 2.8%)
> 2010-2017 job growth: 10.2% (state: 8.5%)
> Median household income: $60,057 (state: $59,970)
[recirclink id=484519]

Nevada: Las Vegas-Henderson-Paradise
> 2010-2018 pop. growth: 14.3% (state: 12.3%)
> Feb. 2019 unemployment: 4.2% (state: 4.3%)
> 2010-2017 job growth: 21.0% (state: 19.7%)
> Median household income: $57,189 (state: $58,003)

New Hampshire: Manchester-Nashua
> 2010-2018 pop. growth: 3.5% (state: 3.0%)
> Feb. 2019 unemployment: 2.3% (state: 2.4%)
> 2010-2017 job growth: 9.8% (state: 8.8%)
> Median household income: $78,769 (state: $73,381)
[in-text-ad-2]

New Jersey: Trenton
> 2010-2018 pop. growth: 0.5% (state: 1.2%)
> Feb. 2019 unemployment: 3.8% (state: 4%)
> 2010-2017 job growth: 10.0% (state: 7.3%)
> Median household income: $79,173 (state: $80,088)

New Mexico: Santa Fe
> 2010-2018 pop. growth: 3.8% (state: 1.5%)
> Feb. 2019 unemployment: 4.1% (state: 5.1%)
> 2010-2017 job growth: 0.2% (state: 3.7%)
> Median household income: $58,821 (state: $46,744)
[in-text-ad]

New York: New York-Newark-Jersey City
> 2010-2018 pop. growth: 1.9% (state: 0.7%)
> Feb. 2019 unemployment: 3.9% (state: 3.9%)
> 2010-2017 job growth: 15.7% (state: 11.2%)
> Median household income: $75,368 (state: $64,894)
[recirclink id=520329]

North Carolina: Raleigh
> 2010-2018 pop. growth: 19.8% (state: 8.5%)
> Feb. 2019 unemployment: 3.5% (state: 3.9%)
> 2010-2017 job growth: 24.7% (state: 14.3%)
> Median household income: $72,576 (state: $52,752)

North Dakota: Fargo
> 2010-2018 pop. growth: 17.3% (state: 12.7%)
> Feb. 2019 unemployment: 2.3% (state: 2.4%)
> 2010-2017 job growth: 16.1% (state: 15.4%)
> Median household income: $63,353 (state: $61,843)
[in-text-ad-2]

Ohio: Columbus
> 2010-2018 pop. growth: 10.5% (state: 1.3%)
> Feb. 2019 unemployment: 3.6% (state: 4.6%)
> 2010-2017 job growth: 17.6% (state: 9.3%)
> Median household income: $63,764 (state: $54,021)

Oklahoma: Oklahoma City
> 2010-2018 pop. growth: 11.0% (state: 4.9%)
> Feb. 2019 unemployment: 3.1% (state: 3.3%)
> 2010-2017 job growth: 10.6% (state: 6.4%)
> Median household income: $56,260 (state: $50,051)
[in-text-ad]

Oregon: Bend-Redmond
> 2010-2018 pop. growth: 21.7% (state: 9.2%)
> Feb. 2019 unemployment: 4.5% (state: 4.4%)
> 2010-2017 job growth: 36.0% (state: 17.8%)
> Median household income: $66,273 (state: $60,212)
[recirclink id=529284]

Pennsylvania: Lebanon
> 2010-2018 pop. growth: 5.8% (state: 0.8%)
> Feb. 2019 unemployment: 3.2% (state: 4%)
> 2010-2017 job growth: 5.7% (state: 6.0%)
> Median household income: $57,372 (state: $59,195)

Rhode Island: Providence-Warwick
> 2010-2018 pop. growth: 1.2% (state: 0.3%)
> Feb. 2019 unemployment: 3.5% (state: 3.9%)
> 2010-2017 job growth: 7.5% (state: 6.7%)
> Median household income: $65,226 (state: $63,870)
[in-text-ad-2]
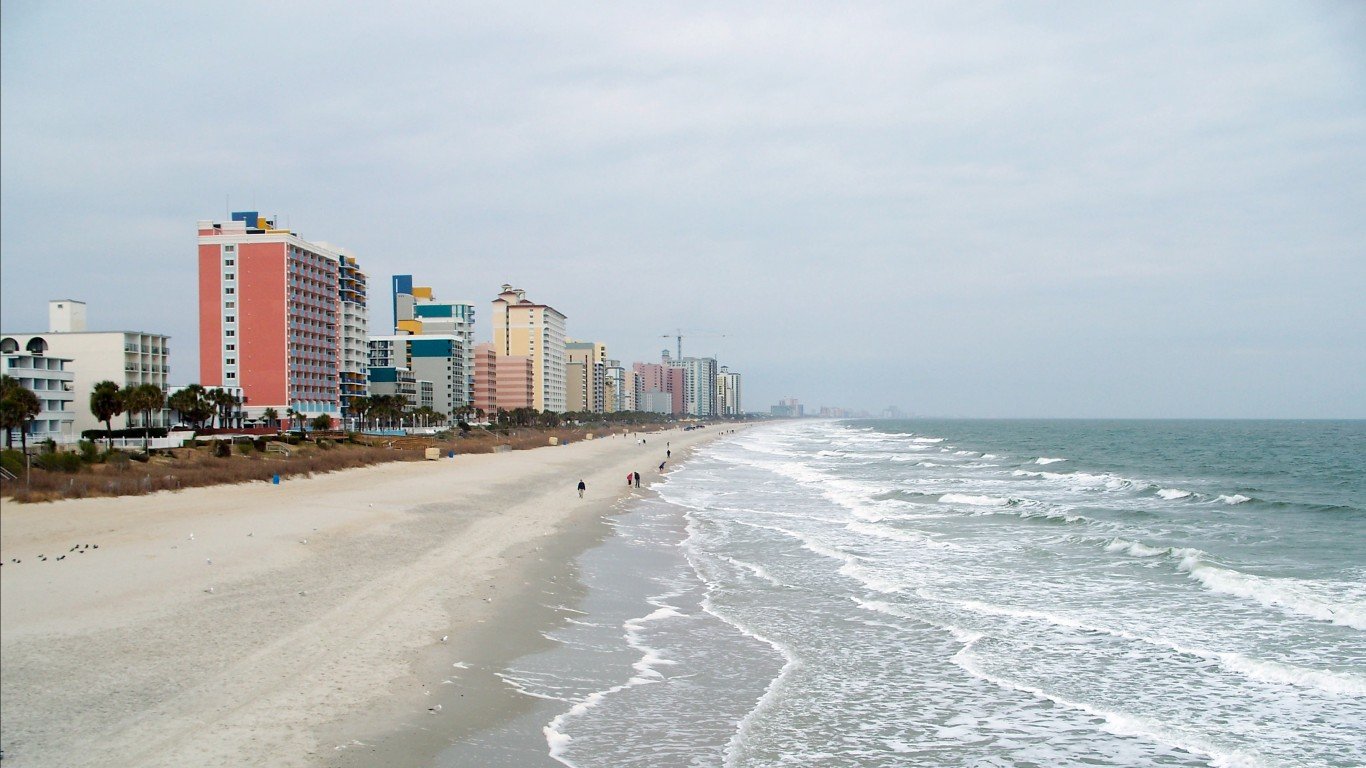
South Carolina: Myrtle Beach-Conway-North Myrtle Beach
> 2010-2018 pop. growth: 27.0% (state: 9.7%)
> Feb. 2019 unemployment: 3.9% (state: 3.2%)
> 2010-2017 job growth: 50.5% (state: 15.8%)
> Median household income: $48,727 (state: $50,570)

South Dakota: Sioux Falls
> 2010-2018 pop. growth: 15.9% (state: 8.1%)
> Feb. 2019 unemployment: 2.4% (state: 2.9%)
> 2010-2017 job growth: 16.0% (state: 8.6%)
> Median household income: $64,882 (state: $56,521)
[in-text-ad]

Tennessee: Nashville-Davidson–Murfreesboro–Franklin
> 2010-2018 pop. growth: 15.2% (state: 6.5%)
> Feb. 2019 unemployment: 2.4% (state: 3.2%)
> 2010-2017 job growth: 29.0% (state: 14.6%)
> Median household income: $63,939 (state: $51,340)
[recirclink id=515229]

Texas: Midland
> 2010-2018 pop. growth: 25.8% (state: 13.7%)
> Feb. 2019 unemployment: 2.2% (state: 3.8%)
> 2010-2017 job growth: 36.4% (state: 18.0%)
> Median household income: $75,266 (state: $59,206)
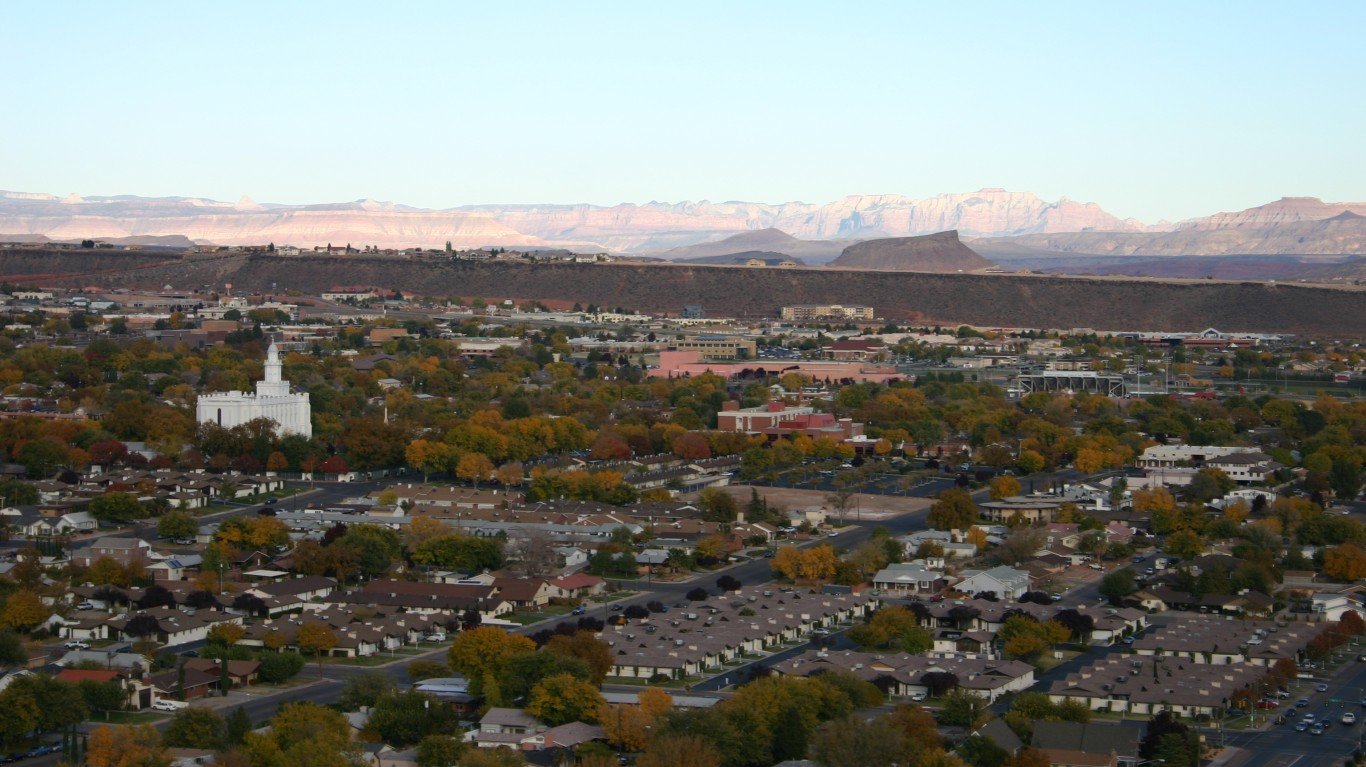
Utah: St. George
> 2010-2018 pop. growth: 24.1% (state: 13.9%)
> Feb. 2019 unemployment: 3% (state: 3%)
> 2010-2017 job growth: 39.2% (state: 24.3%)
> Median household income: $54,842 (state: $68,358)
[in-text-ad-2]

Vermont: Burlington-South Burlington
> 2010-2018 pop. growth: 4.5% (state: 0.1%)
> Feb. 2019 unemployment: 1.8% (state: 2.4%)
> 2010-2017 job growth: 9.2% (state: 5.6%)
> Median household income: $63,160 (state: $57,513)

Virginia: Winchester
> 2010-2018 pop. growth: 8.6% (state: 6.2%)
> Feb. 2019 unemployment: 2.8% (state: 2.9%)
> 2010-2017 job growth: 14.9% (state: 8.5%)
> Median household income: $65,334 (state: $71,535)
[in-text-ad]

Washington: Kennewick-Richland
> 2010-2018 pop. growth: 15.9% (state: 11.8%)
> Feb. 2019 unemployment: 5.8% (state: 4.5%)
> 2010-2017 job growth: 11.5% (state: 17.1%)
> Median household income: $63,617 (state: $70,979)
[recirclink id=484519]

West Virginia: Morgantown
> 2010-2018 pop. growth: 7.6% (state: -2.6%)
> Feb. 2019 unemployment: 4.2% (state: 5.2%)
> 2010-2017 job growth: 9.0% (state: -1.2%)
> Median household income: $49,475 (state: $43,469)

Wisconsin: Madison
> 2010-2018 pop. growth: 8.9% (state: 2.2%)
> Feb. 2019 unemployment: 2.2% (state: 2.9%)
> 2010-2017 job growth: 17.0% (state: 8.2%)
> Median household income: $71,301 (state: $59,305)
[in-text-ad-2]

Wyoming: Cheyenne
> 2010-2018 pop. growth: 7.3% (state: 2.3%)
> Feb. 2019 unemployment: 3.3% (state: 3.9%)
> 2010-2017 job growth: 7.5% (state: -0.6%)
> Median household income: $61,961 (state: $60,434)
Methodology
To determine the fastest growing city in each state, 24/7 Wall St. reviewed population change between July 2010 and July 2018 (the latest available data) in every U.S. metro area with data from the U.S. Census Bureau’s Population Estimates Program. The components of population growth — births, deaths, and international and domestic migration — were also from this report. Jobs added between 2010 and 2017 came from the Bureau of Labor Statistics’ Quarterly Census of Employment and Wages. February 2019 unemployment rates came from the Bureau of Labor Statistics’ Local Area Unemployment Statistics and are seasonally adjusted.
Contact [email protected] for any questions or corrections.