
[cnxvideo id=”788335″ placement=”ros”]U.S. population growth hit an 80-year low of 0.6% year-over-year in 2018. The slowdown in growth — an already familiar phenomenon in some of the world’s most economically advanced countries — is largely attributable to a declining birthrate. Slowing growth nationwide does not begin to tell the story of some American cities that are being gutted year after year.
There are dozens of U.S. metro areas where the population has declined by over 3% in recent years. While an aging population and slowing birth rates are often a factor, in most of these cities, the population decline is mostly attributable to people moving away.
24/7 Wall St. reviewed population change from July 1, 2010 to July 1, 2018 in all U.S. metropolitan areas to identify the fastest shrinking metro areas in the United States.
While the reasons for the mass exodus boil down to the independent decisions of tens of thousands of individuals, conditions in many cities on this list offer some potential answers.
A lack of economic opportunity and crime can make any city unappealing to potential new residents and those looking to start families. All but one of these metro areas have an unemployment rate above the 3.9% national rate, and some are shedding jobs at a faster rate than any other city in their respective states. Additionally, many of these cities have higher than average violent crime rates, and some even rank as the most dangerous city in their state.
Click here to read about America’s fastest shrinking cities.
Click here to read about our methodology.
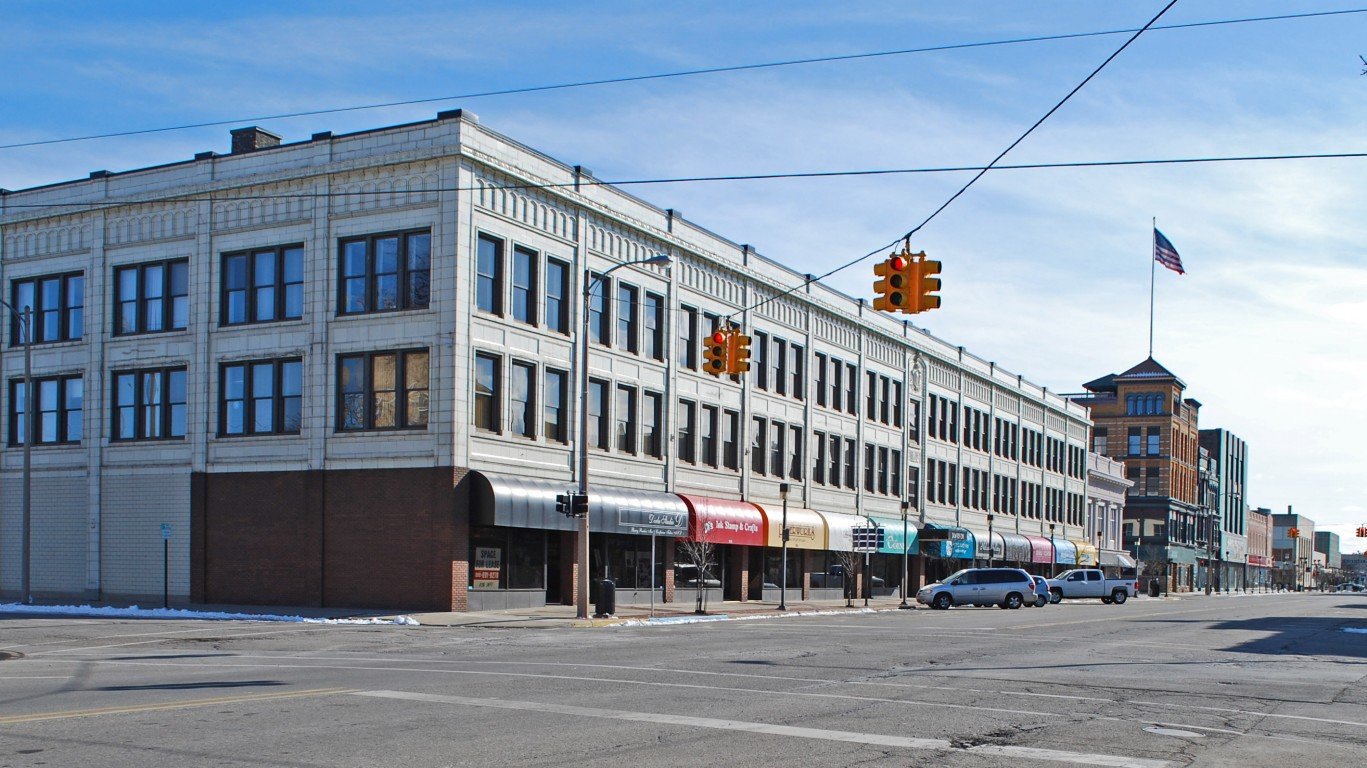
25. Bay City, MI
> 2010-2018 pop. change: -3.5% (-3,758)
> 2018 unemployment: 5.2%
> 2010-2018 employment change: -2.8% (-974)
> Median household income: $45,983
Bay City is one of three Michigan metro areas to rank on this list. Over the last eight years, the number of people living in the city fell by 3.5% — or about 3,758 people. Between 2010 and 2018, there were about 1,000 more deaths than births in the metro area, but most of the population decline is attributable to more people moving out of the area than moving in.
As is the case in most cities on this list, employment opportunities have become increasingly scarce in Bay City in recent years. There were nearly 1,000 fewer people employed in the metro area in 2018 than there were in 2010.
[in-text-ad]

24. Anniston-Oxford-Jacksonville, AL
> 2010-2018 pop. change: -3.5% (-4,200)
> 2018 unemployment: 4.7%
> 2010-2018 employment change: -4.8% (-2,248)
> Median household income: $43,686
Over the last eight years, the Anniston-Oxford-Jacksonville metro area’s population shrank by 3.5% — even as Alabama’s population as a whole grew by 2.1%. The vast majority of the metro area’s population loss was the result of people moving out, likely in favor of areas with greater employment opportunities. Over the last eight years, the number of jobs in the metro area fell by 4.8%.
The job market in the Anniston metro area remains worse than it is across the state as a whole. In 2018, 4.7% of workers in the metro area were out of a job compared to Alabama’s 4.1% unemployment rate.
[recirclink id=484519]
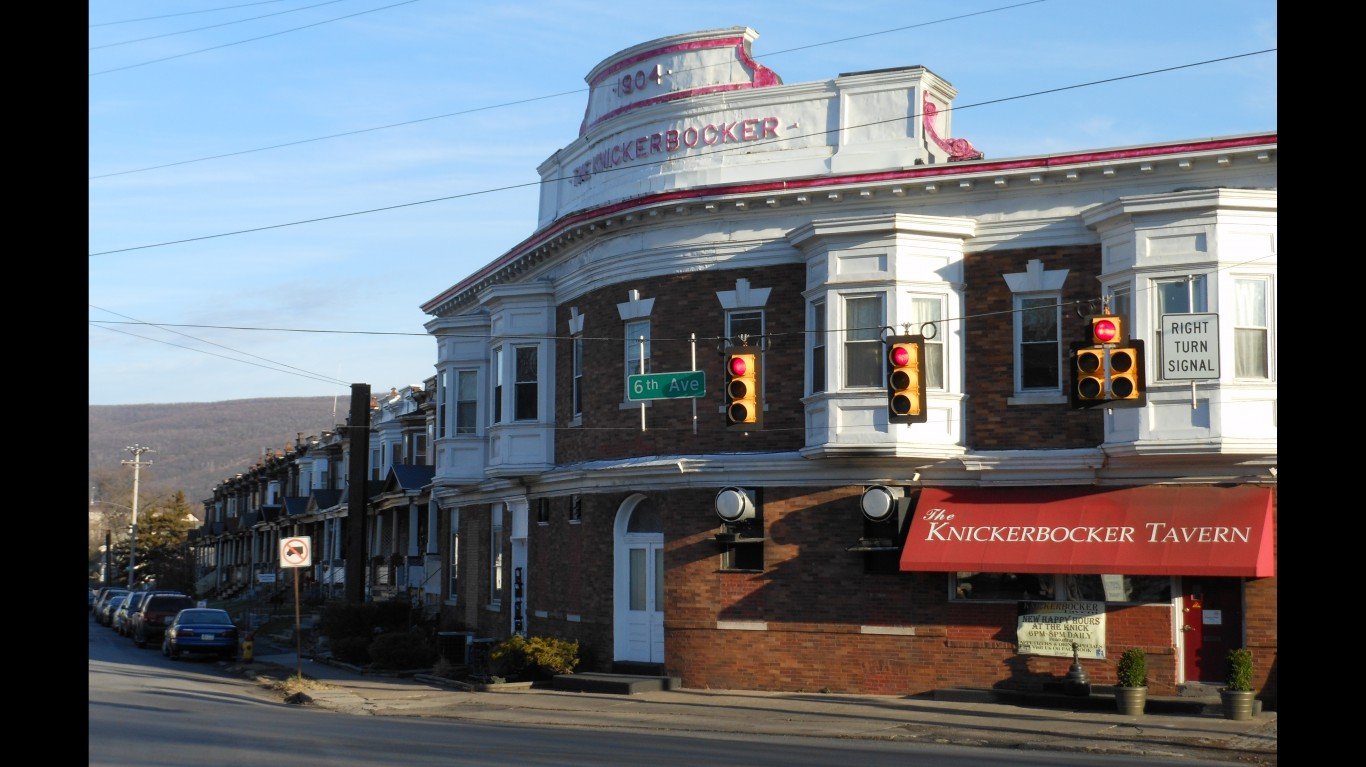
23. Altoona, PA
> 2010-2018 pop. change: -3.6% (-4,551)
> 2018 unemployment: 4.2%
> 2010-2018 employment change: +1.1% (+610)
> Median household income: $45,664
Due in almost equal parts to natural population decline — fewer births than deaths — and net outbound migration, the Altoona, Pennsylvania, metro area is home to nearly 5,000 fewer people now than in 2010. Over the same period, Pennsylvania’s population grew by 0.8%.
Many of the fastest shrinking metro areas in the country tend to be low income. In Altoona, the typical household earns $45,664 a year, well below the median annual household incomes of $56,951 across Pennsylvania and the $57,652 nationwide.

22. Vineland-Bridgeton, NJ
> 2010-2018 pop. change: -3.7% (-5,732)
> 2018 unemployment: 7.5%
> 2010-2018 employment change: +0.3% (+159)
> Median household income: $50,000
The Vineland-Bridgeton metro area lost a net of 5,732 people between 2010 and 2018, or about 3.7% of its population. Overall, New Jersey is one of the slowest growing states in the country. In the last eight years, the Garden State’s population expanded at a pace of just 1.2%, a fraction of the 5.8% national population growth over the same period. Population growth across the state has been hindered lately by people are increasingly leaving for career opportunities. In 2018, the unemployment rate was 7.5% in Vineland-Bridgerton and 4.1% in New Jersey as a whole compared to the 3.9% U.S. unemployment rate.
[in-text-ad-2]
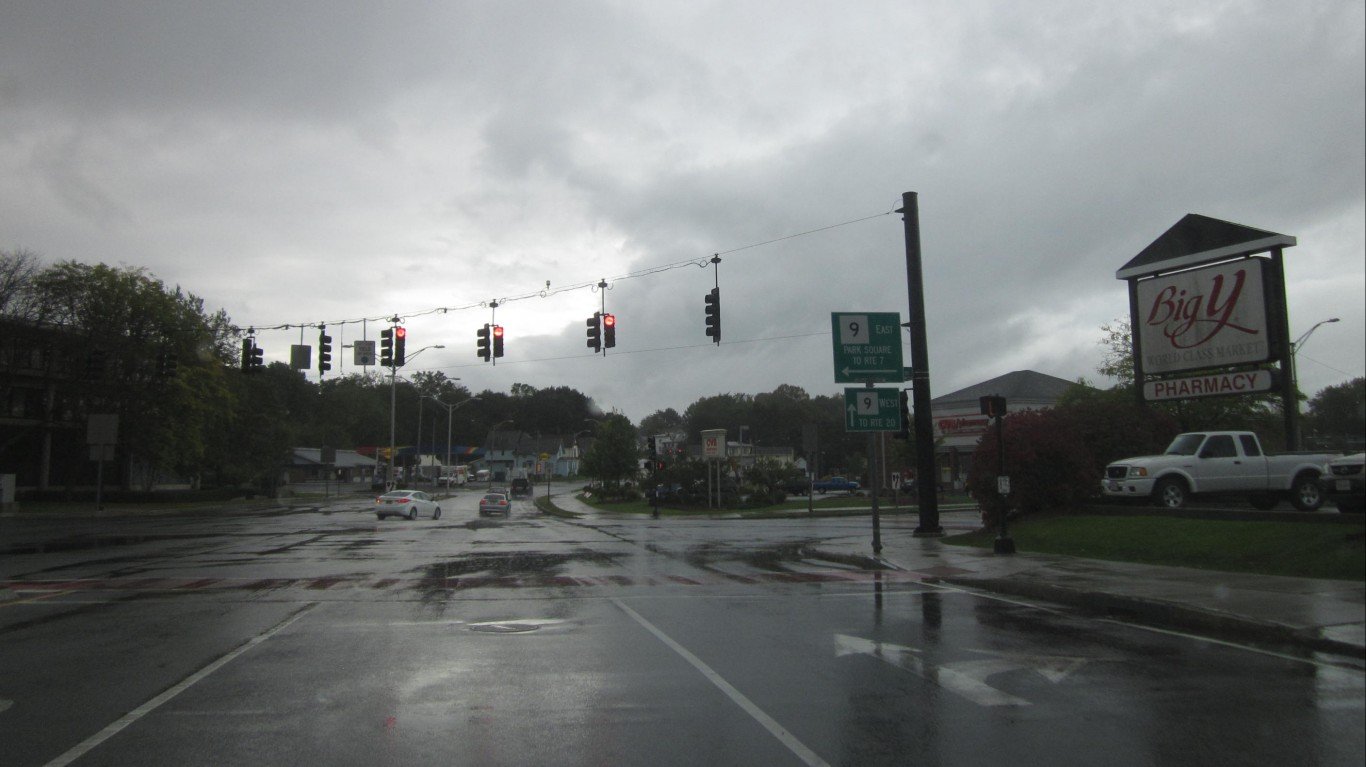
21. Pittsfield, MA
> 2010-2018 pop. change: -3.8% (-4,971)
> 2018 unemployment: 4.4%
> 2010-2018 employment change: +2.4% (+1,471)
> Median household income: $55,190
Pittsfield is the only metro area in Massachusetts and the broader New England area to rank on this list. There are now nearly 5,000 fewer people living in Pittsfield than there were in 2010, a 3.8% eight-year decline. Over the same period, Massachusetts’ population grew by 5.1%.
Long-term population decline in the western Massachusetts metro area is attributable to both natural population change — number of births less the number of deaths — and net migration. High crime areas are less attractive to new families and potential new residents, and Pittsfield’s violent crime rate of 558 incidents per 100,000 people is well above the national violent crime rate of 383 incidents per 100,000.

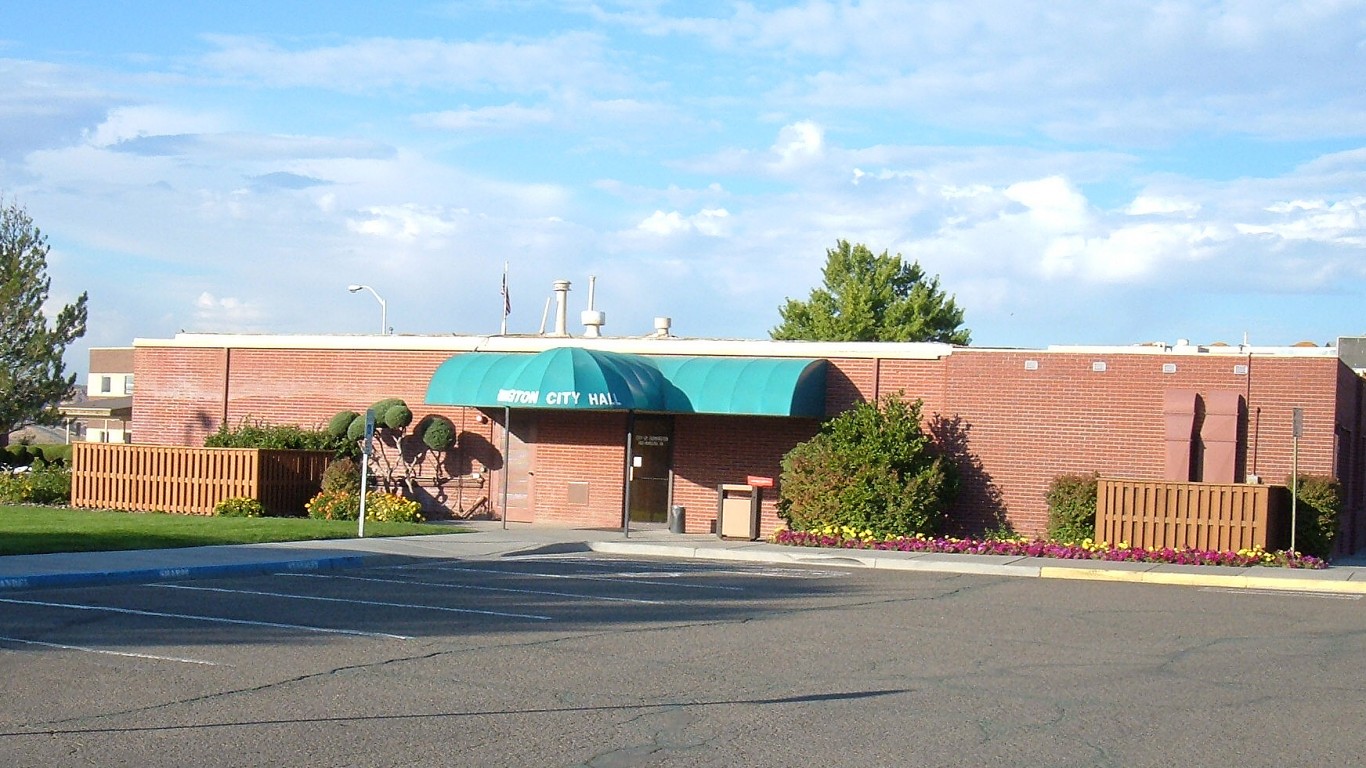
20. Sierra Vista-Douglas, AZ
> 2010-2018 pop. change: -3.8% (-5,052)
> 2018 unemployment: 5.8%
> 2010-2018 employment change: -9.7% (-3,641)
> Median household income: $47,847
There were about 2,700 more births than deaths in the Sierra Vista-Douglas, Arizona, metro area in the last eight years. Still, the natural growth was not enough to offset the number of people who moved out of the metro area over the same period. Between 2010 and 2018, about 7,500 more people moved out of the metro area than moved in.
Job opportunities is one of the most common reasons Americans move, and employment opportunities are relatively scarce in Sierra Vista. Over the last eight years, the number of people working in the metro area fell by nearly 10%. The metro area’s unemployment rate of 5.8% is well above the 3.9% national unemployment rate.
[in-text-ad]
19. Farmington, NM
> 2010-2018 pop. change: -4.0% (-5,159)
> 2018 unemployment: 6.1%
> 2010-2018 employment change: +0.7% (+332)
> Median household income: $49,686
There were about 6,800 more births than deaths in Farmington, New Mexico, between 2010 and 2018. Still, the natural population increase was not enough to offset the number of people who moved out of the area. As a result, the metro area’s population declined by about 4.0% over a period when the population of every other metro area in the state grew by at least 3.0%.
Crime can detract considerably from quality of life in any city, and Farmington’s violent crime rate of 1,107 incidents per 100,000 people is the highest of any metro area in the state and well more than double the national violent crime rate of 383 per 100,000.
[recirclink id=493887]

18. Lawton, OK
> 2010-2018 pop. change: -4.1% (-5,372)
> 2018 unemployment: 3.8%
> 2010-2018 employment change: +2.8% (+1,185)
> Median household income: $49,608
Oklahoma’s population has grown by nearly 5% since 2010. Not all parts of the state reported such population growth, however. And with a net loss of 5,372 residents, Lawton was the only metro area in the state to have a smaller population in 2018 than in 2010. Though births far outnumbered deaths in the metro area over that period, the growth was not enough to offset the number of people who moved away.
As is often the case in America’s fastest shrinking cities, Lawton is a relatively dangerous place. There were 675 violent crimes for every 100,000 people in 2017, well above the national violent crime rate of 383 incidents per 100,000.
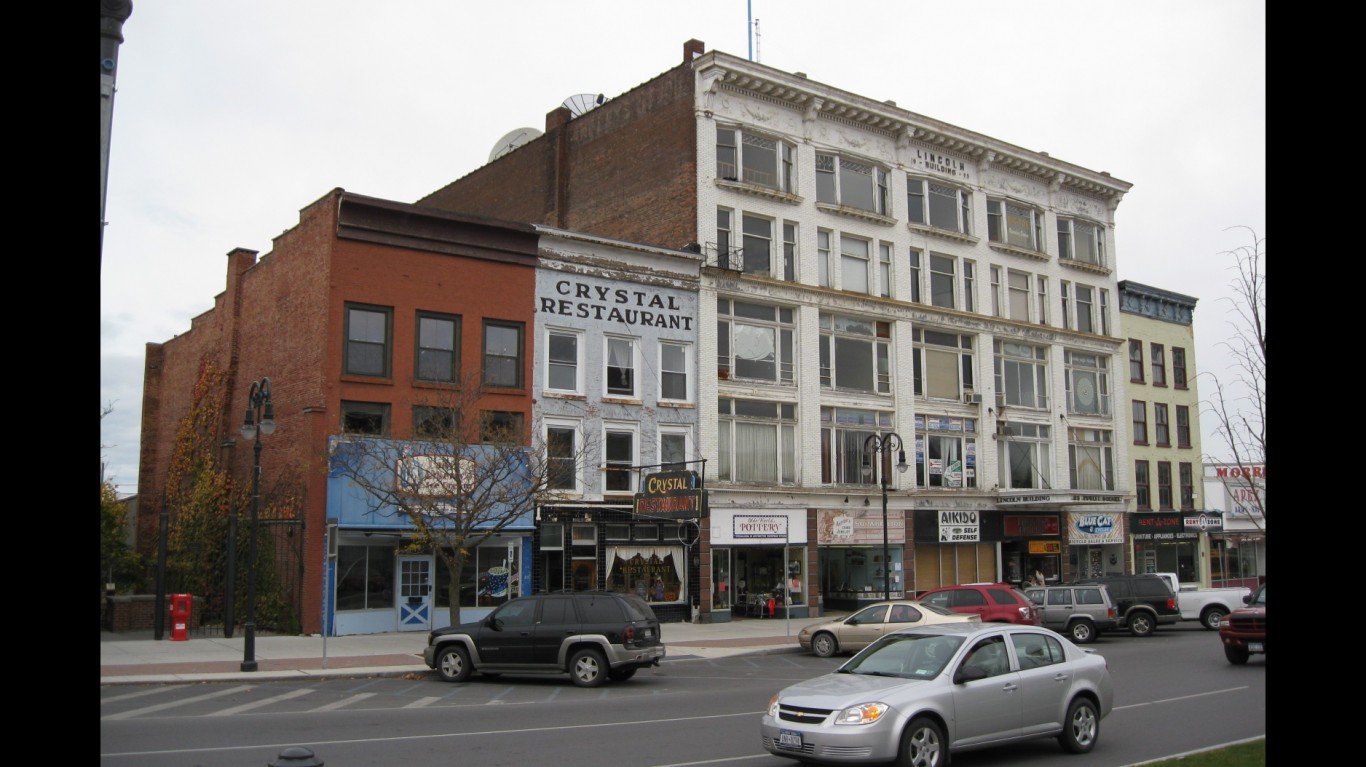
17. Watertown-Fort Drum, NY
> 2010-2018 pop. change: -4.2% (-4,839)
> 2018 unemployment: 6.6%
> 2010-2018 employment change: -3.0% (-1,263)
> Median household income: $50,322
Watertown is one of three upstate New York metro areas to report near nation-leading population decline between 2010 and 2018. Over 14,000 more people moved out of Watertown over that period than moved in. Though the metro area’s relatively high birthrate partially offset those losses, the population still shrank by 4.2% over the last eight years.
One of the most common reasons Americans decide to move is for job opportunities, and those are relatively limited in Watertown. The number of jobs in metro area fell by 3.0% in the last eight years, and the metro area’s unemployment rate of 6.6% is well above the 3.9% national unemployment rate.
[in-text-ad-2]
16. Rocky Mount, NC
> 2010-2018 pop. change: -4.2% (-6,394)
> 2018 unemployment: 5.5%
> 2010-2018 employment change: -4.5% (-2,655)
> Median household income: $41,593
North Carolina is one of the fastest growing states in the country in terms of population. In the last eight years, the state’s population ballooned by 8.5%, well above the 5.8% national population growth rate. Not all parts of the state are benefitting from population growth, however. Though Rocky Mount had slightly more births than deaths in the last eight years, over 7,000 more people moved out of the metro area than moved in over that period.
Rocky Mount residents are more likely than residents across the state as a whole to struggle financially. The typical household in Rocky Mount earns just $41,593 a year, far less than the $50,320 the typical North Carolina household earns. Additionally, 21.6% of the Rocky Mount population relies on SNAP benefits, well above the 13.7% state SNAP recipiency rate.

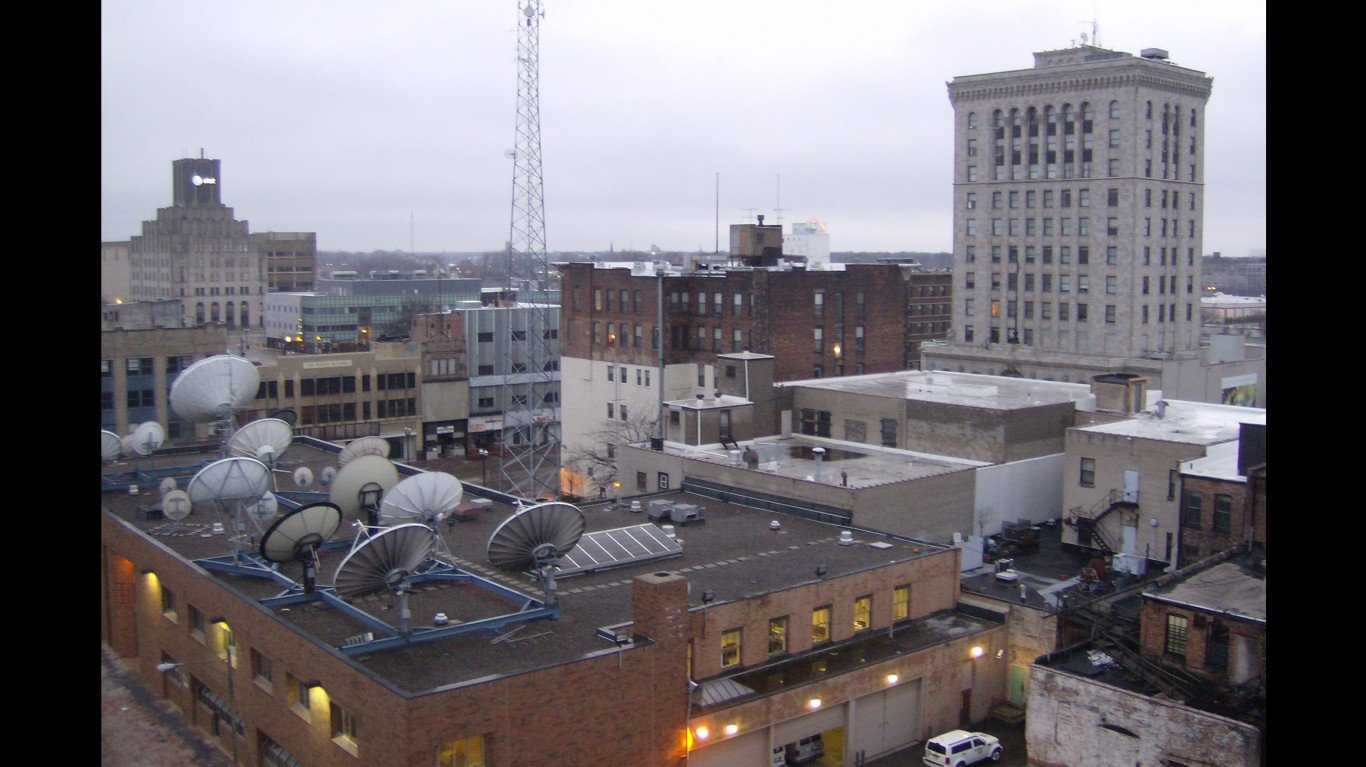
15. Flint, MI
> 2010-2018 pop. change: -4.2% (-18,059)
> 2018 unemployment: 4.9%
> 2010-2018 employment change: +6.2% (+7,820)
> Median household income: $45,231
Due entirely to net migration, the population of Flint, Michigan, declined by 18,059 between 2010 and 2018. Among the cities on this list, explanations for their population declines vary and are not always entirely clear. In Flint, much of the mass exodus is likely tied to the recent water contamination crisis.
In an effort to save money, Flint switched its water supply source in 2014. The following year, EPA tests revealed dangerous levels of lead in the water Flint residents relied on, and shortly after Michigan’s governor declared a state of emergency in the area. The crisis triggered over a dozen lawsuits and contributed to near nation-leading population decline in the metro area.
[in-text-ad]
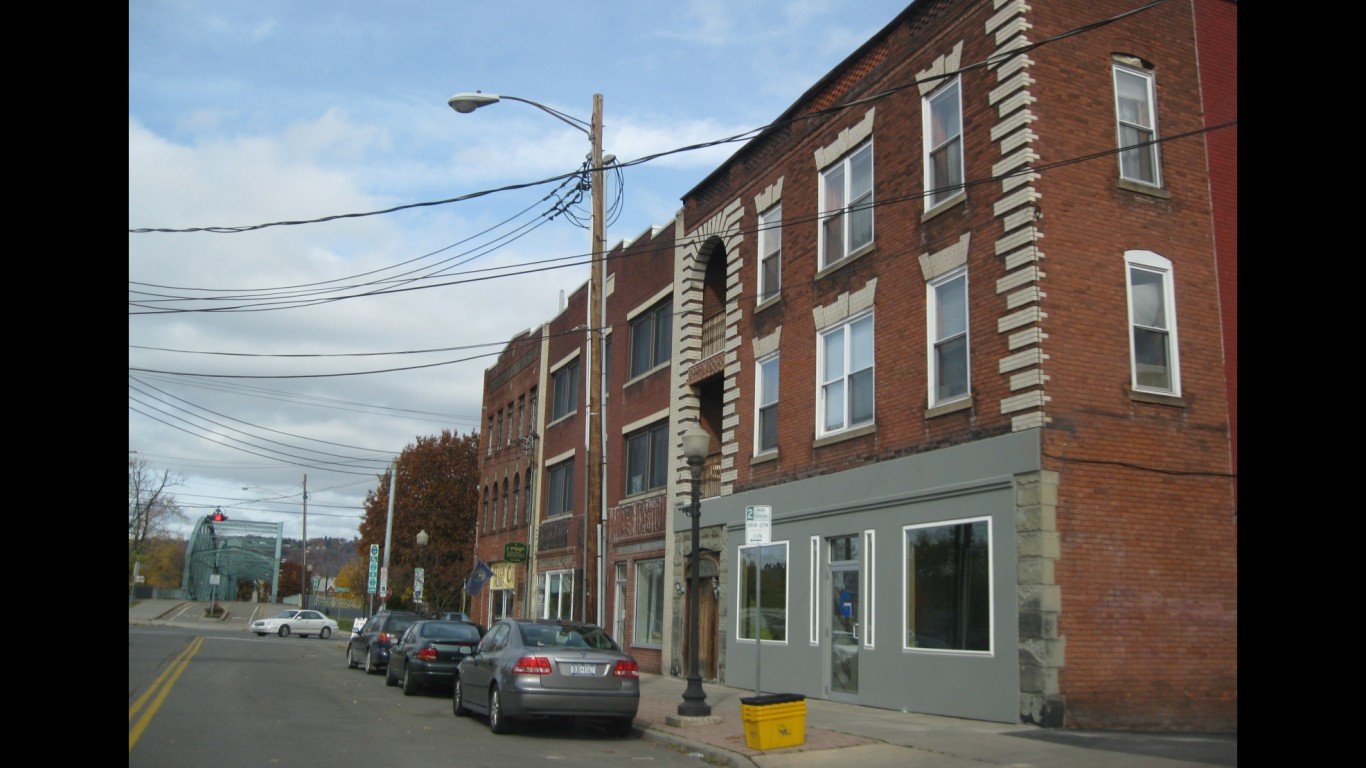
14. Binghamton, NY
> 2010-2018 pop. change: -4.5% (-11,270)
> 2018 unemployment: 5.1%
> 2010-2018 employment change: -5.1% (-5,366)
> Median household income: $50,673
Due to both natural population change and net migration, there are 11,270 fewer people living in Binghamton today than there were in 2010. One of the most common reasons Americans decide to move is for jobs and career opportunities, and those are relatively scarce in the Binghamton metro area. The area’s overall employment fell by 5.1% over the last eight years. In that same time, U.S. employment grew 12.5%.
Binghamton is one of three metro areas in New York to rank on this list, and partially as a result, New York is one of the slowest growing states in the United States. New York’s population grew by a marginal 0.7% in the last eight years. Over the same period, the U.S. population grew by 5.8%.
[recirclink id=543888]
13. Saginaw, MI
> 2010-2018 pop. change: -4.5% (-9,062)
> 2018 unemployment: 5.1%
> 2010-2018 employment change: +5.7% (+4,502)
> Median household income: $45,034
Saginaw reported a 4.5% population decline between 2010 and 2018, the largest decline of any metro area in Michigan and one of the largest in the United States. Though there were more births than deaths in the metro area, the number of people who left contributed to a net population loss of 9,062.
Crime can detract considerably from quality of life in any city, and Saginaw’s violent crime rate of 634 incidents per 100,000 people is well above the national violent crime rate of 383 incidents per 100,000. Another factor detracting from quality of life in the city is its high jobless rate — 5.1% of workers were unemployed in 2018, well above the 3.9% national unemployment rate.
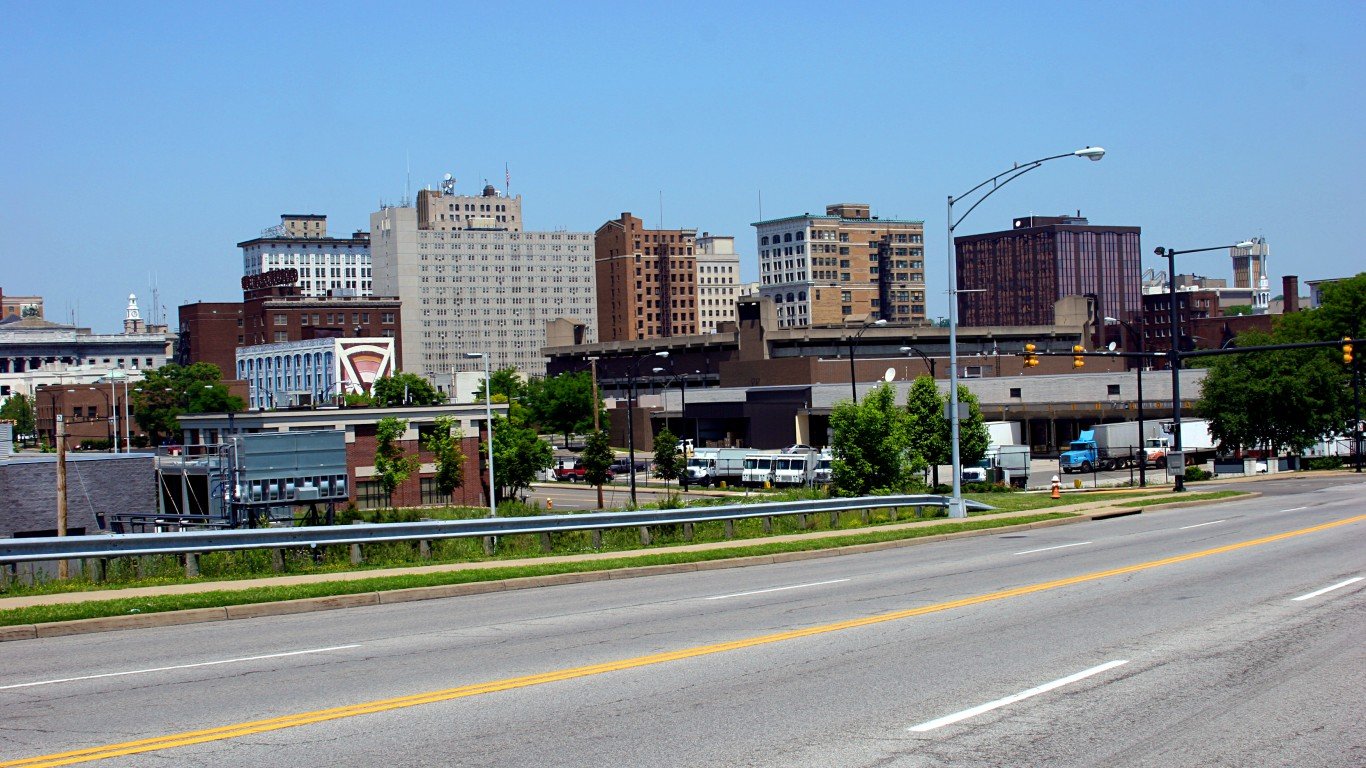
12. Youngstown-Warren-Boardman, OH-PA
> 2010-2018 pop. change: -4.6% (-25,876)
> 2018 unemployment: 6.0%
> 2010-2018 employment change: -0.8% (-1,759)
> Median household income: $44,947
There are 25,876 fewer people living in the Youngstown-Warren-Boardman metro area today than there were in 2010, a 4.6% decrease. The decline was attributable to both fewer births than deaths and a large number of people moving away.
A strong job market can be a draw to new families and new residents, and the Youngstown metro area does not appear to have a thriving economy or a strong job market. The metro area’s unemployment rate of 6.0% is well above the 3.9% national rate, and there are nearly 1,800 fewer jobs in the area today than there were eight years ago. And many of the jobs the area do not pay especially high wages. The typical household in the metro area earns less than $45,000 a year, well below the national median of $57,652.
[in-text-ad-2]
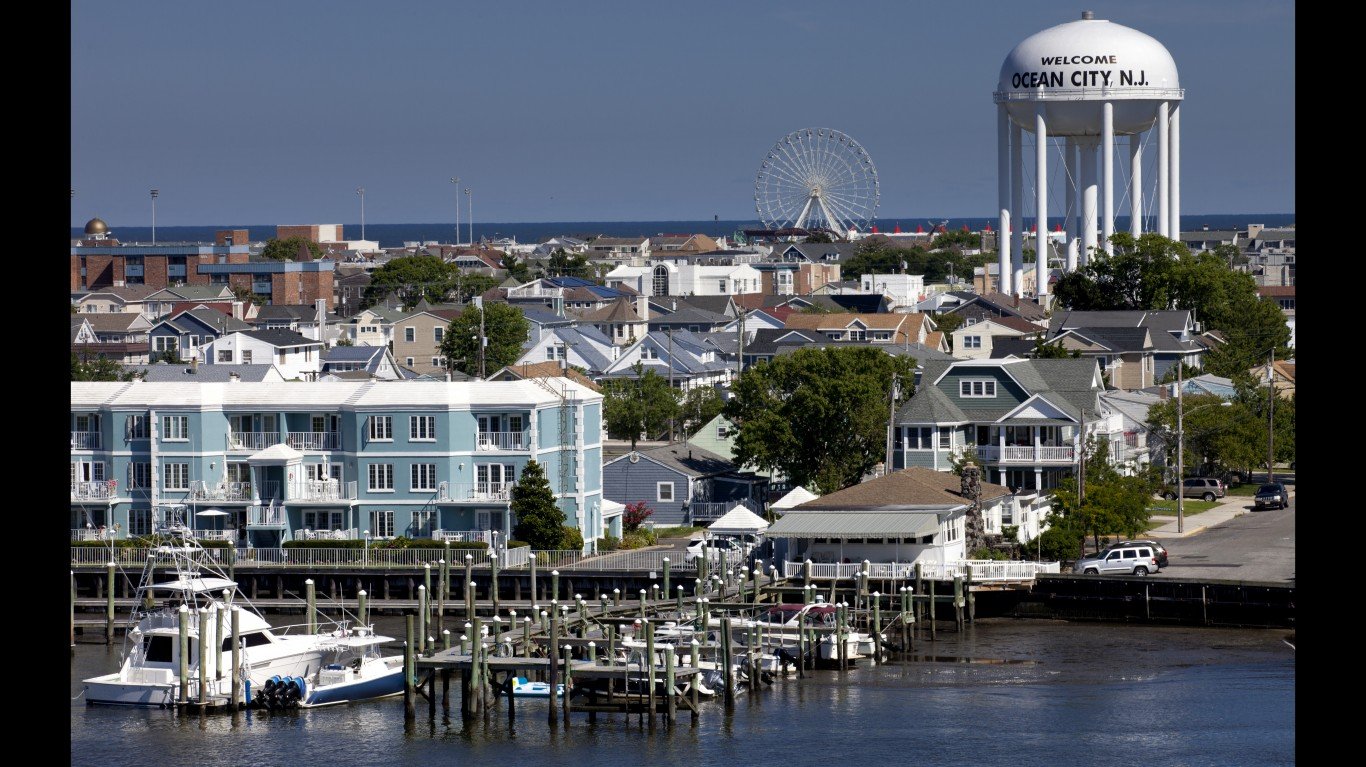
11. Ocean City, NJ
> 2010-2018 pop. change: -4.8% (-4,661)
> 2018 unemployment: 13%
> 2010-2018 employment change: +2.7% (+1,105)
> Median household income: $62,332
Ocean City reported the steepest population decline of any New Jersey metro area in the last eight years and the eleventh steepest decline of any metro area in the country. Though more people left Ocean City than moved in between 2010 and 2018, the bulk of the population decline was attributable to deaths outnumbering births. Ocean City has a far older population than the U.S. as a whole. About one in every four Ocean City residents are 65 or older, compared to just 14.9% of Americans.

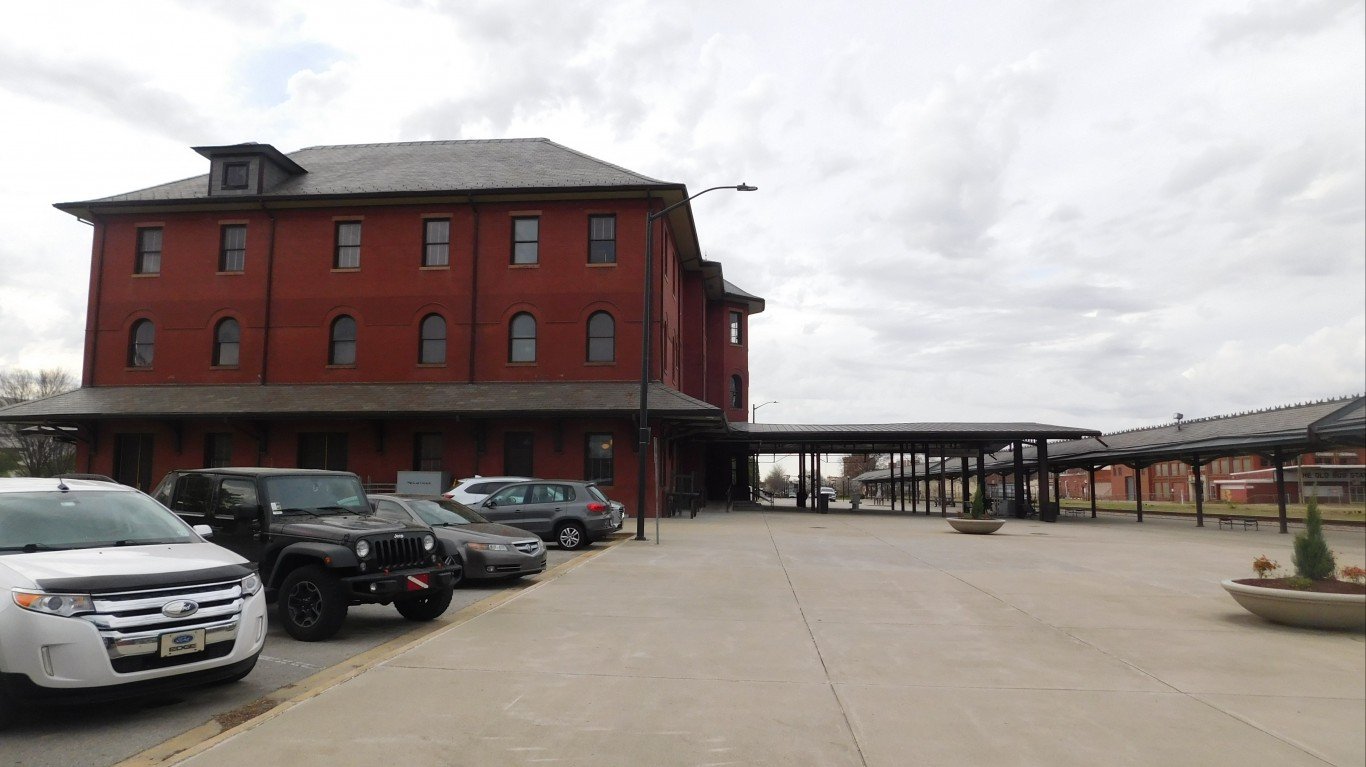
10. Cumberland, MD-WV
> 2010-2018 pop. change: -5.1% (-5,230)
> 2018 unemployment: 6.0%
> 2010-2018 employment change: -1.4% (-503)
> Median household income: $42,169
Cumberland is one of only 10 metro areas to report a more than 5% population decline over the last eight years. Natural population change — the number of births less the number of deaths — and outward migration each contributed substantially to the decline.
Areas with struggling economies are less attractive to those looking to start families and potential new residents — and economic conditions are less than ideal in the Cumberland metro area. The area’s unemployment rate of 6.0% is well above the 3.9% national rate, and there are over 500 fewer jobs in the area today than there were eight years ago. And many of the jobs do not offer especially high paying. The typical household in the metro area earns just $42,169 a year, well below the national median of $57,652.
[in-text-ad]

9. Elmira, NY
> 2010-2018 pop. change: -5.2% (-4,644)
> 2018 unemployment: 4.5%
> 2010-2018 employment change: -6.4% (-2,424)
> Median household income: $51,251
After losing a net of 4,644 residents, Elmira’s population is 5.2% smaller now than it was in 2010. The population decline was the largest of any New York metro area and ninth largest nationwide. The decline was precipitated entirely by people leaving the metro area.
One of the most common reasons Americans decide to move is for jobs and career opportunities, and those are relatively scarce in the metro area. As of 2018, there were 2,424 fewer jobs in Elmira than there were in 2010. The area’s unemployment rate of 4.5% is well above the 3.9% national unemployment rate.
[recirclink id=541510]

8. Wheeling, WV-OH
> 2010-2018 pop. change: -5.3% (-7,862)
> 2018 unemployment: 6.3%
> 2010-2018 employment change: +0.4% (+238)
> Median household income: $45,625
Due to both more deaths than births and rapid outward migration, the population of Wheeling, West Virginia, declined by 5.3% over the last eight years.
Wheeling is one of four metro areas primarily located in West Virginia to report near nation-leading population decline between 2010 and 2018. Partially as a result, along with Connecticut and Illinois, West Virginia is one of only three states with fewer residents now than in 2010. Of those three states, West Virginia lost the largest share of its population at 2.6%.
7. Decatur, IL
> 2010-2018 pop. change: -5.5% (-6,072)
> 2018 unemployment: 6.2%
> 2010-2018 employment change: -1.2% (-584)
> Median household income: $49,052
Decatur is one of two metro areas in Illinois to report a greater than 5% population decline between 2010 and 2018. Though there were more births than deaths in the metro area between 2010 and 2018, the number of people moving out was more than enough to fully offset and more the natural population growth.
Migration out of Decatur is part of a broader trend across the state as a whole. Over half a million more people moved out of Illinois than moved in between 2010 and 2018, and as a result, Illinois is one of only three states with a smaller population now than eight years ago.
[in-text-ad-2]
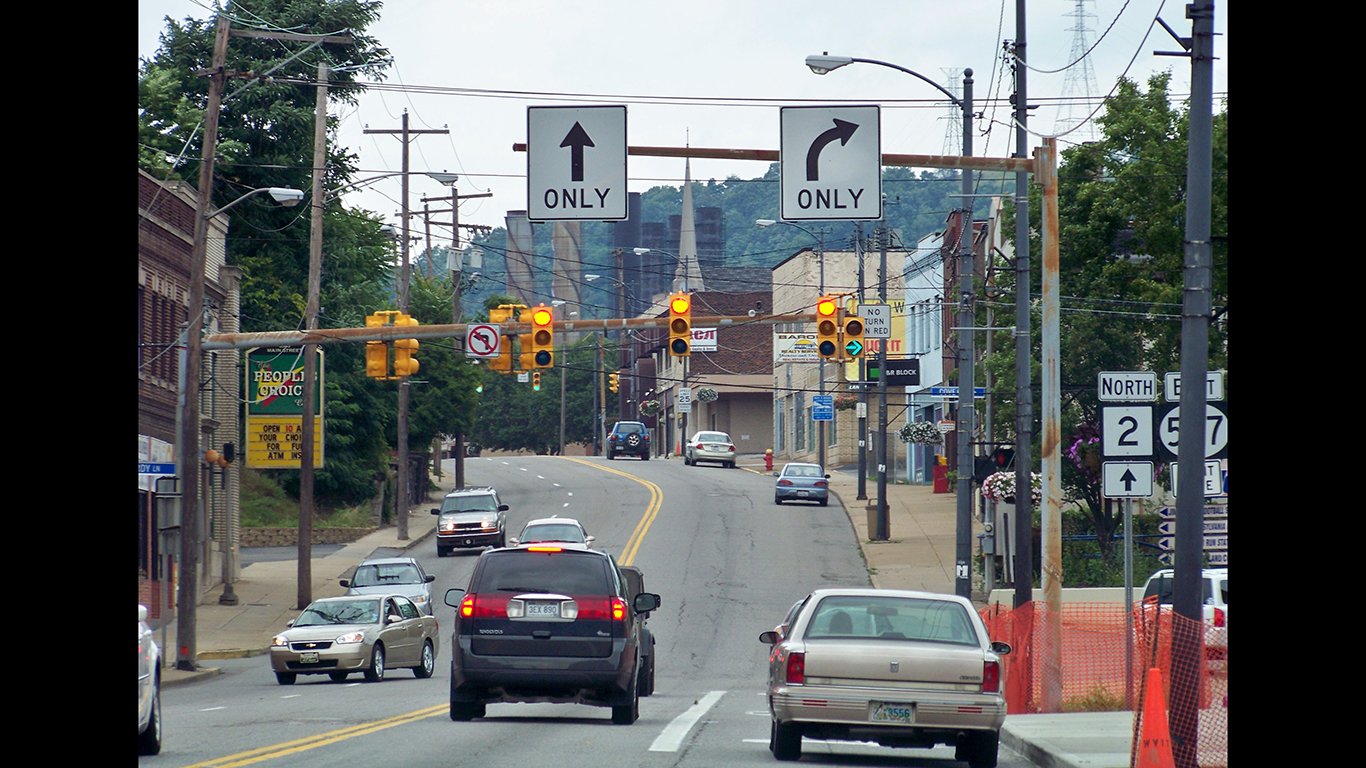
6. Weirton-Steubenville, WV-OH
> 2010-2018 pop. change: -5.8% (-7,260)
> 2018 unemployment: 6.5%
> 2010-2018 employment change: -8.4% (-3,453)
> Median household income: $44,576
The population of Weirton-Steubenville declined by 5.8% between 2010 and 2018. Though about 2,600 more people moved out of the metro area than moved in over the last eight years, the bulk of the population decline is attributable to a greater number of deaths than births. The metro area has a far older than typical population. More than one in every five Weirton-Steubenville residents are 65 or older, well above the 14.9% share of Americans.
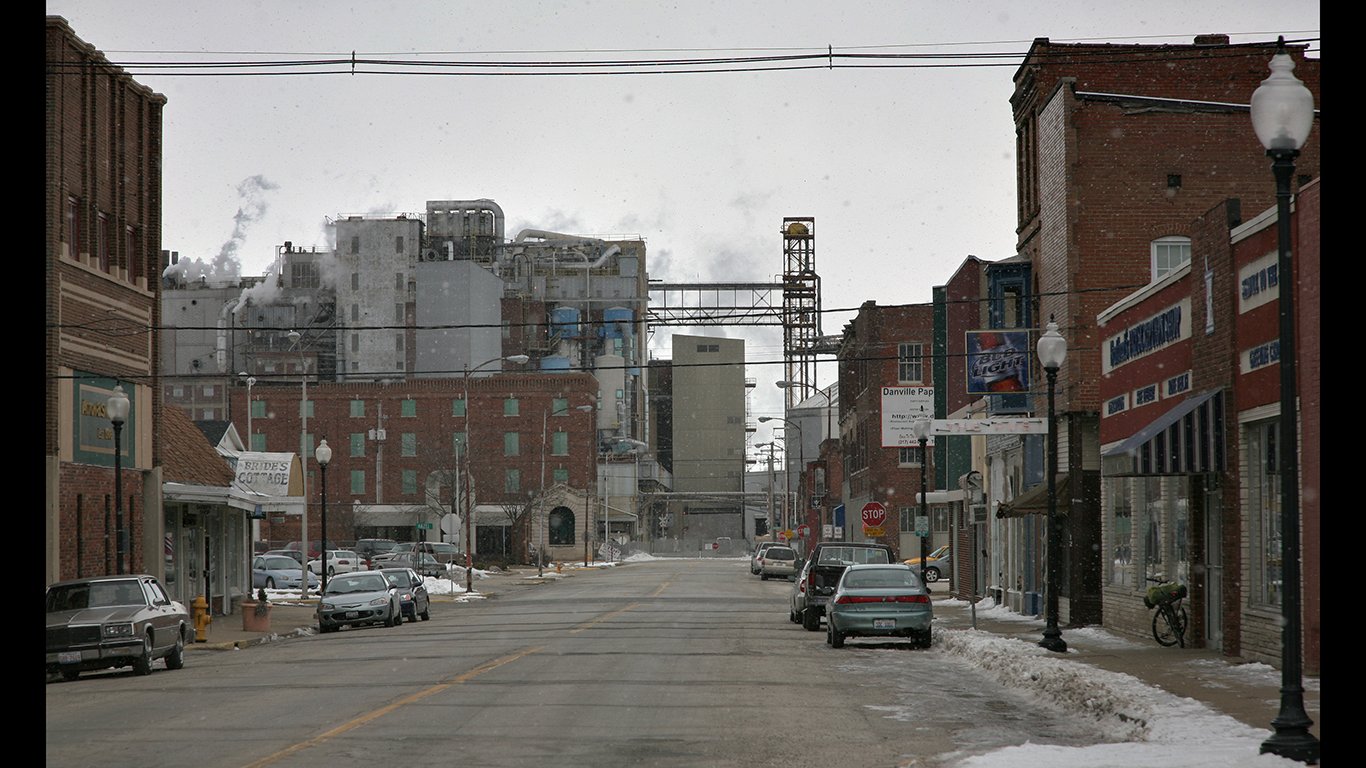
5. Danville, IL
> 2010-2018 pop. change: -5.9% (-4,833)
> 2018 unemployment: 6.3%
> 2010-2018 employment change: -2.8% (-788)
> Median household income: $44,930
Over 5,000 more people moved out of Danville, Illinois, than moved in between 2010 and 2018, contributing to a 5.9% overall population decline over that period. Danville’s population loss is a microcosm of a broader problem across the state. Over half a million more people left Illinois than arrived in the state since 2010. The state has reported population declines each of the last five years. Many argue that the state’s high taxes and weak job market are to blame. In Danville, the unemployment rate stands at 6.3%, and across Illinois it is 4.3%, each rate above the 3.9% national unemployment rate.
[in-text-ad]
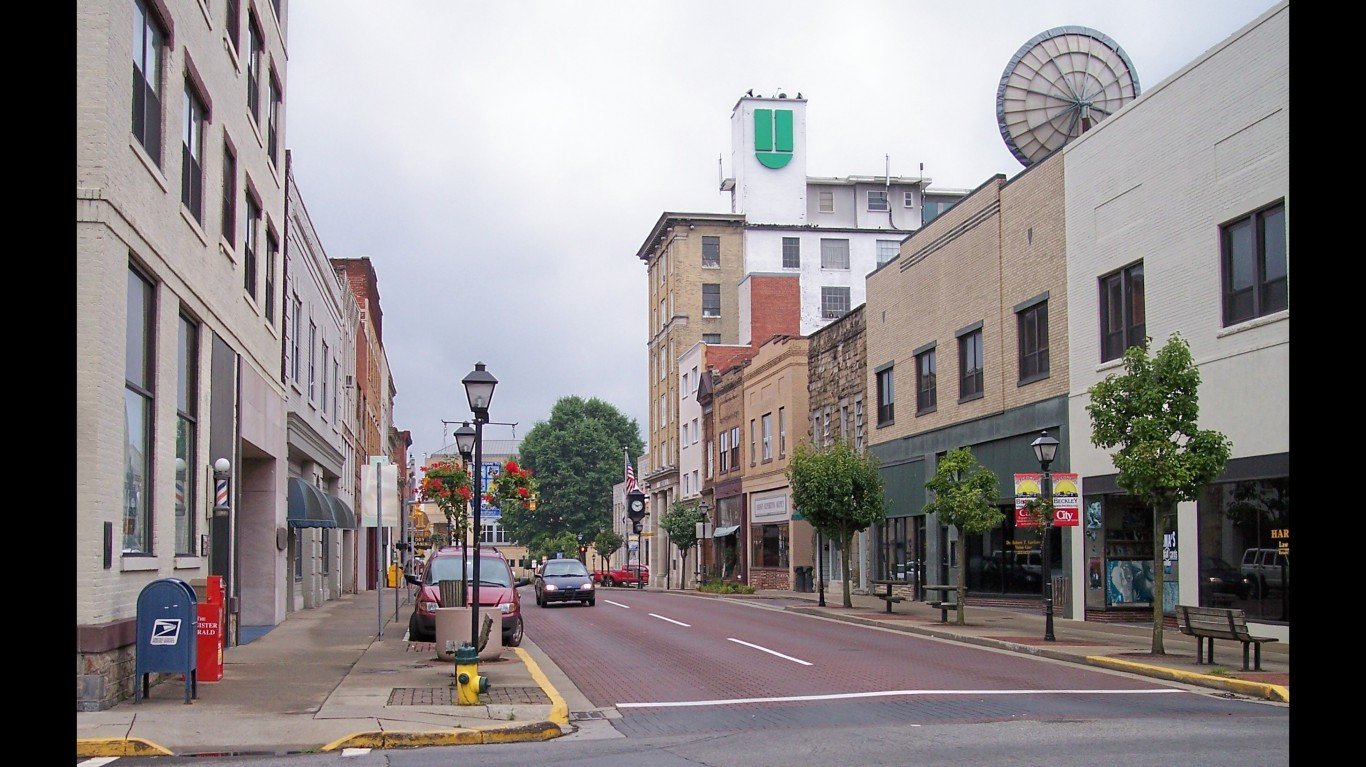
4. Beckley, WV
> 2010-2018 pop. change: -6.1% (-7,677)
> 2018 unemployment: 6.4%
> 2010-2018 employment change: +32.6% (+10,260)
> Median household income: $41,141
Beckley, West Virginia, lost a net of 7,677 residents over the last eight years, or 6.1% of its population. The decline was precipitated primarily by outward migration, but the area also had more deaths than births.
Americans often relocate for job or career opportunities, and in Beckley, employment options appear relatively limited. Some 6.4% of the metro area’s labor force is unemployed, far more than the 3.9% national unemployment rate. In addition, the available jobs in the area are not especially high paying. The typical household in Beckley earns just $41,141 a year, well below the $57,652 national median.

3. Charleston, WV
> 2010-2018 pop. change: -7.0% (-15,854)
> 2018 unemployment: 6.0%
> 2010-2018 employment change: -23.3% (-32,113)
> Median household income: $45,155
Charleston lost a net of 15,858 residents between 2010 and 2018, or 7.0% of its total population, the largest decline of any metro area in West Virginia and the third largest nationwide. Like many metro areas on this list, Charleston suffers from high crime and high jobless rate. There were 570 violent crimes for every 100,000 people in the metro area in 2017, compared to 383 per 100,000 nationwide. Additionally, Charleston’s unemployment rate of 6.0% is well above the 3.9% national unemployment rate.
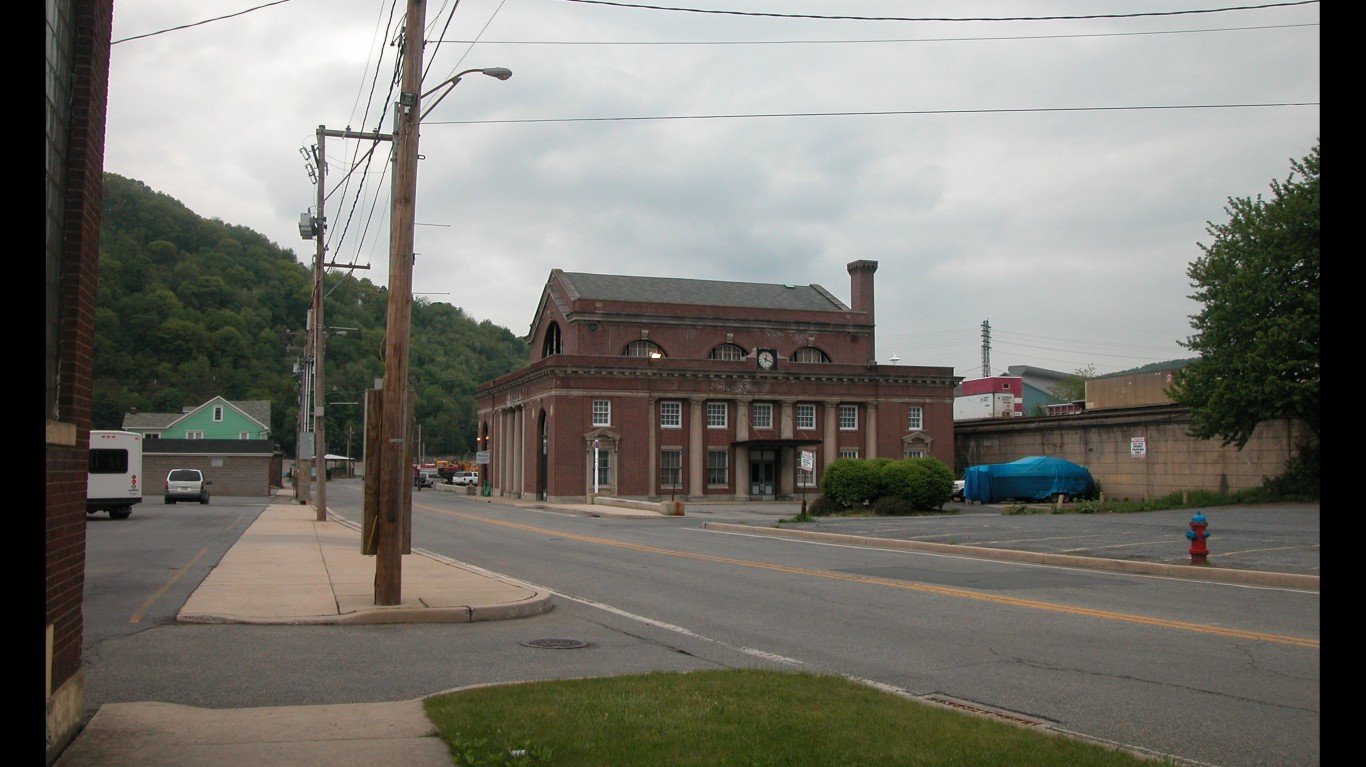
2. Johnstown, PA
> 2010-2018 pop. change: -8.2% (-11,720)
> 2018 unemployment: 5.1%
> 2010-2018 employment change: -9.0% (-5,090)
> Median household income: $44,943
There were 4,000 more deaths than births in Johnstown, Pennsylvania, between 2010 and 2018, and about 8,000 more people left than moved in. The resulting 8.2% population decline was the second largest of any U.S. metro area over that period.
One of the most common reasons Americans decide to move is for jobs and career opportunities, and those are relatively scarce in the metro area. As of 2018, there were 5,090 fewer jobs in Johnstown than there were in 2010. The area’s unemployment of 5.1% is well above the 3.9% national unemployment rate.
[in-text-ad-2]

1. Pine Bluff, AR
> 2010-2018 pop. change: -10.6% (-10,592)
> 2018 unemployment: 6.0%
> 2010-2018 employment change: -12.3% (-4,414)
> Median household income: $38,547
Due entirely to outbound migration, Pine Bluff lost a net of 10,592 residents between 2010 and 2018. The 10.6% population drop was the largest of any U.S. metro area over that period.
Crime can detract considerably from quality of life in any city, and Pine Bluffs’s violent crime rate of 1,007 incidents per 100,000 people is well above the national violent crime rate of 383 incidents per 100,000. Another factor detracting from quality of life in the city is its high jobless rate — 6.0% of metro area workers were unemployed in 2018, well above the 3.9% national unemployment rate.
[recirclink id=515229]
Methodology:
To determine the fastest shrinking U.S. cities, 24/7 Wall St. reviewed population change between July 2010 and July 2018 (the latest available data) in every U.S. metro area with data from the U.S. Census Bureau’s Population Estimates Program. Figures on each component of population growth — births, deaths, and international and domestic migration — also came from this report and are from April 2010 to July 2018. Employment change between 2010 and 2018 came from the Bureau of Labor Statistics’ Quarterly Census of Employment and Wages. 2018 unemployment rates came from the Bureau of Labor Statistics’ Local Area Unemployment Statistics. Median household income, poverty rate, SNAP recipiency rate, and demographic data are five-year averages from the U.S. Census Bureau’s 2017 American Community Survey.
Contact [email protected] for any questions or corrections.