As a nation, the United States is becoming better prepared for possible disasters, disease outbreaks, and other emergencies, according to a recently published preparedness study. The National Health Security Preparedness Index reached 6.7 out of 10 in 2018, a 3.1% increase over the prior year, and an 11.7% improvement since 2013. The level of readiness, however, is uneven across the country.
Authors of the study say the United States is facing increased frequency and intensity of health security threats. These include virulent diseases such as Zika and Ebola; growing resistance to antibiotics by infectious diseases; ongoing epidemic of opioid abuse; and globalization in travel and trade. Extreme weather events are also becoming more common. Several of the most powerful hurricanes of all time occurred within the last 10 years.
In light of the increasing threats, the study’s authors recommend that the nation improve its social and health care networks; augment data and information systems; involve the private sector in health security; expand preparedness training; ensure funding for health security resources; and target regions that are falling behind in preparedness.
24/7 Wall St. reviewed the findings of the index, prepared by the Robert Wood Johnson Foundation to determine which states are the most (and least) prepared for a disaster.
Click here to see the states most (and least) prepared for a disaster.
Click here to read our methodology.

50. Alaska
> Pct. of adults who volunteer: 40.6% (5th highest)
> Avg. EMS arrival time (urban/rural): 6.6 minutes / 16.0 minutes
> Pct. population within 50 miles of a trauma center: 6.8% (the lowest)
> State and local gov’t spending: $21,309 (the highest)
[in-text-ad]

48. Ohio (tied)
> Pct. of adults who volunteer: 33.2% (22nd highest)
> Avg. EMS arrival time (urban/rural): 6.6 minutes / 11.3 minutes
> Pct. population within 50 miles of a trauma center: 100.0% (the highest – tied)
> State and local gov’t spending: $10,809 (22nd highest)
[recirclink id=436250]
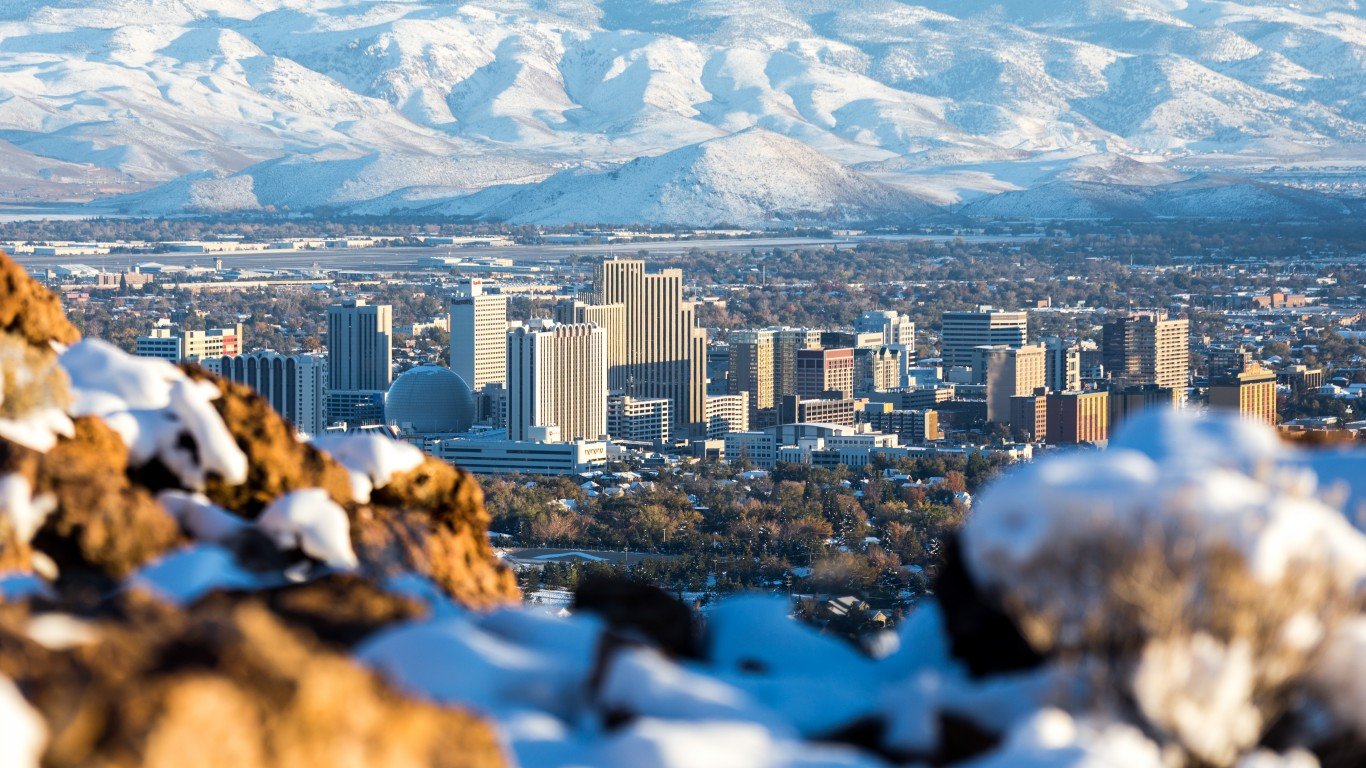
48. Nevada (tied)
> Pct. of adults who volunteer: 24.4% (3rd lowest)
> Avg. EMS arrival time (urban/rural): 5.8 minutes / 21.5 minutes
> Pct. population within 50 miles of a trauma center: 94.1% (15th lowest)
> State and local gov’t spending: $8,345 (4th lowest)
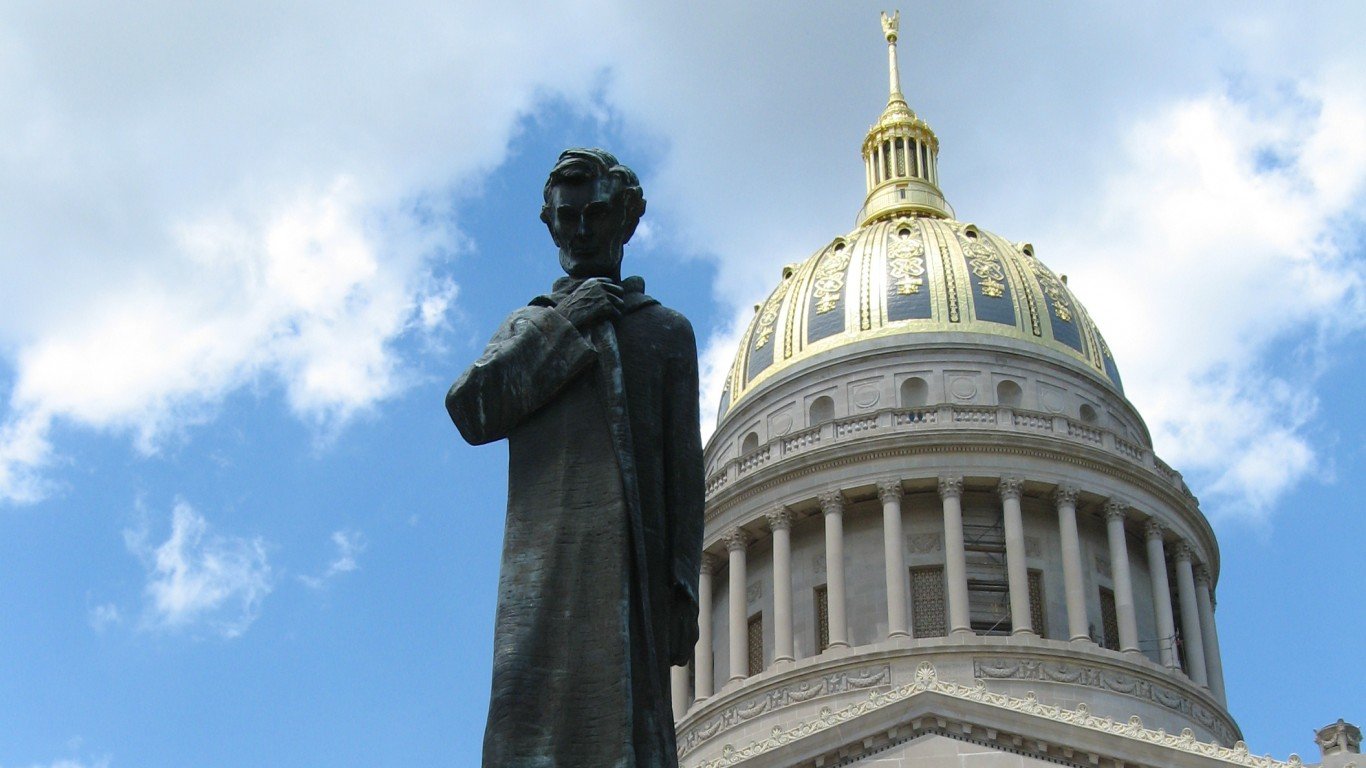
47. West Virginia
> Pct. of adults who volunteer: 28.1% (12th lowest)
> Avg. EMS arrival time (urban/rural): 9.4 minutes / 12.6 minutes
> Pct. population within 50 miles of a trauma center: 99.9% (12th highest – tied)
> State and local gov’t spending: $9,860 (22nd lowest)
[in-text-ad-2]

46. Wyoming
> Pct. of adults who volunteer: 32.7% (23rd highest)
> Avg. EMS arrival time (urban/rural): 5.8 minutes / 17.6 minutes
> Pct. population within 50 miles of a trauma center: 89.4% (10th lowest)
> State and local gov’t spending: $17,195 (2nd highest)

40. California (tied)
> Pct. of adults who volunteer: 25.4% (5th lowest)
> Avg. EMS arrival time (urban/rural): 4.0 minutes / 30.0 minutes
> Pct. population within 50 miles of a trauma center: 93.6% (14th lowest)
> State and local gov’t spending: $13,578 (5th highest)
[in-text-ad]
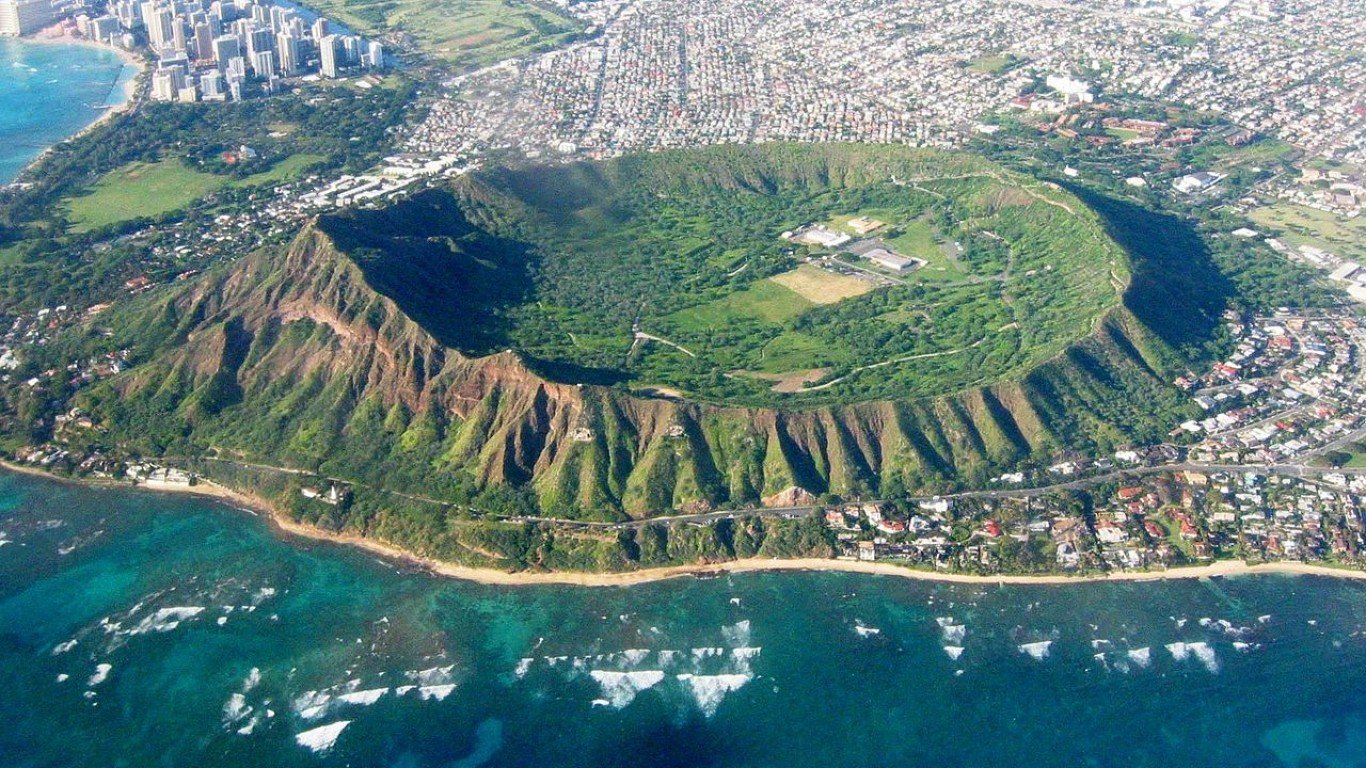
40. Hawaii (tied)
> Pct. of adults who volunteer: 28.0% (11th lowest)
> Avg. EMS arrival time (urban/rural): 8.5 minutes / 15.5 minutes
> Pct. population within 50 miles of a trauma center: 85.5% (5th lowest)
> State and local gov’t spending: $11,352 (16th highest)
[recirclink id=520329]

40. New Mexico (tied)
> Pct. of adults who volunteer: 27.1% (9th lowest)
> Avg. EMS arrival time (urban/rural): 6.9 minutes / 16.7 minutes
> Pct. population within 50 miles of a trauma center: 34.0% (2nd lowest)
> State and local gov’t spending: $11,336 (17th highest)

40. Louisiana (tied)
> Pct. of adults who volunteer: 25.8% (6th lowest)
> Avg. EMS arrival time (urban/rural): 8.7 minutes / 13.8 minutes
> Pct. population within 50 miles of a trauma center: 87.8% (8th lowest)
> State and local gov’t spending: $10,144 (25th lowest)
[in-text-ad-2]
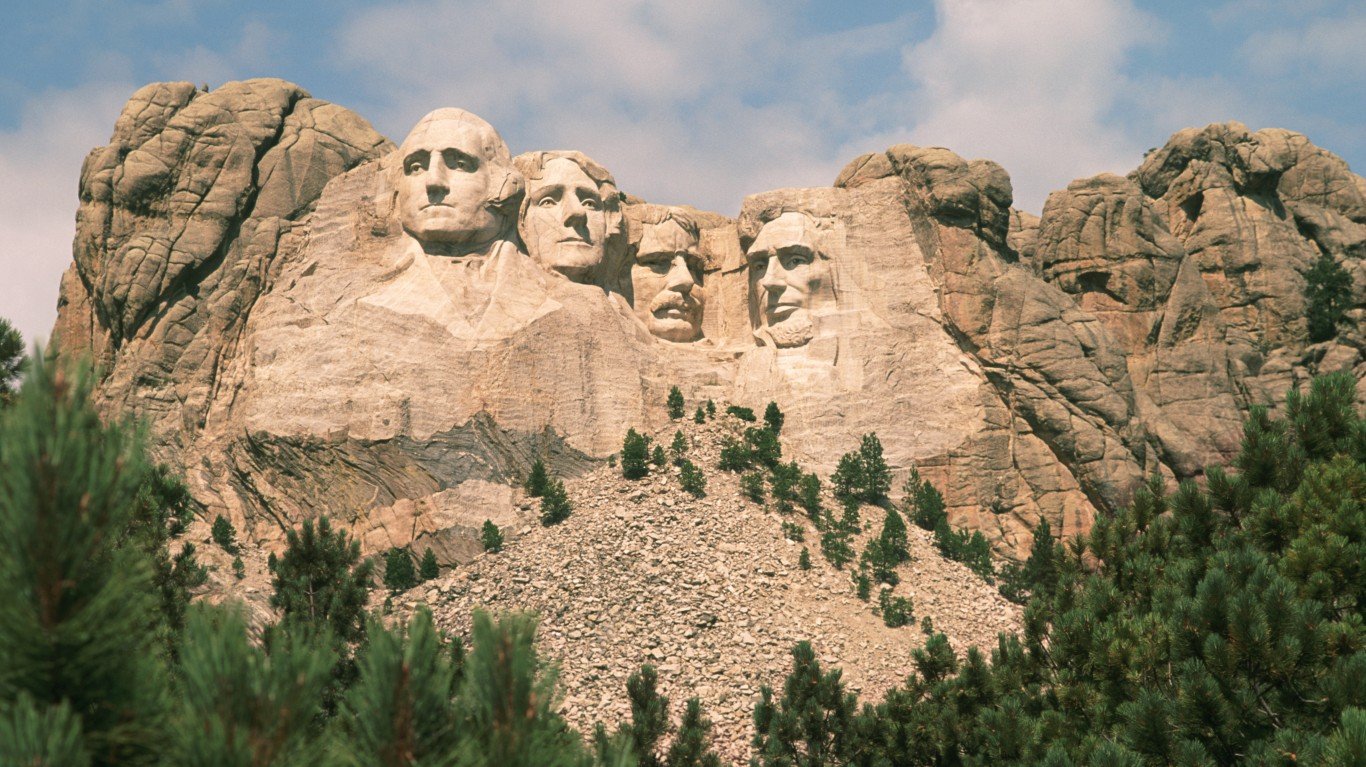
40. South Dakota (tied)
> Pct. of adults who volunteer: 36.3% (14th highest)
> Avg. EMS arrival time (urban/rural): 7.3 minutes / 13.7 minutes
> Pct. population within 50 miles of a trauma center: 94.5% (16th lowest)
> State and local gov’t spending: $9,207 (14th lowest)

40. Indiana (tied)
> Pct. of adults who volunteer: 34.9% (19th highest)
> Avg. EMS arrival time (urban/rural): N/A
> Pct. population within 50 miles of a trauma center: 98.6% (24th highest – tied)
> State and local gov’t spending: $8,732 (7th lowest)
[in-text-ad]
38. Mississippi (tied)
> Pct. of adults who volunteer: 23.8% (2nd lowest)
> Avg. EMS arrival time (urban/rural): 4.9 minutes / 5.1 minutes
> Pct. population within 50 miles of a trauma center: 100.0% (the highest – tied)
> State and local gov’t spending: $10,014 (24th lowest)
[recirclink id=528862]

38. Texas (tied)
> Pct. of adults who volunteer: 28.4% (15th lowest)
> Avg. EMS arrival time (urban/rural): 8.0 minutes / 15.1 minutes
> Pct. population within 50 miles of a trauma center: 98.7% (23rd highest)
> State and local gov’t spending: $9,059 (12th lowest)

34. Washington (tied)
> Pct. of adults who volunteer: 35.7% (16th highest)
> Avg. EMS arrival time (urban/rural): N/A
> Pct. population within 50 miles of a trauma center: 99.7% (15th highest – tied)
> State and local gov’t spending: $11,921 (13th highest)
[in-text-ad-2]

34. Michigan (tied)
> Pct. of adults who volunteer: 29.4% (16th lowest)
> Avg. EMS arrival time (urban/rural): 6.0 minutes / 10.9 minutes
> Pct. population within 50 miles of a trauma center: 98.9% (20th highest – tied)
> State and local gov’t spending: $9,731 (20th lowest)
34. Montana (tied)
> Pct. of adults who volunteer: 38.8% (7th highest)
> Avg. EMS arrival time (urban/rural): 5.0 minutes / 12.3 minutes
> Pct. population within 50 miles of a trauma center: 85.8% (6th lowest)
> State and local gov’t spending: $9,599 (19th lowest)
[in-text-ad]
34. Oklahoma (tied)
> Pct. of adults who volunteer: 32.0% (25th lowest)
> Avg. EMS arrival time (urban/rural): 7.4 minutes / 15.0 minutes
> Pct. population within 50 miles of a trauma center: 99.8% (14th highest)
> State and local gov’t spending: $8,788 (9th lowest)
[recirclink id=441939]

26. New Jersey (tied)
> Pct. of adults who volunteer: 26.1% (7th lowest)
> Avg. EMS arrival time (urban/rural): 8.8 minutes / 19.0 minutes
> Pct. population within 50 miles of a trauma center: 100.0% (the highest – tied)
> State and local gov’t spending: $12,271 (9th highest)

26. Illinois (tied)
> Pct. of adults who volunteer: 28.1% (14th lowest)
> Avg. EMS arrival time (urban/rural): 4.5 minutes / 12.5 minutes
> Pct. population within 50 miles of a trauma center: 99.3% (19th highest)
> State and local gov’t spending: $10,923 (21st highest)
[in-text-ad-2]

26. Maine (tied)
> Pct. of adults who volunteer: 38.7% (8th highest)
> Avg. EMS arrival time (urban/rural): 6.8 minutes / 11.6 minutes
> Pct. population within 50 miles of a trauma center: 96.9% (21st lowest)
> State and local gov’t spending: $9,744 (21st lowest)

26. South Carolina (tied)
> Pct. of adults who volunteer: 30.8% (20th lowest)
> Avg. EMS arrival time (urban/rural): N/A
> Pct. population within 50 miles of a trauma center: 99.4% (18th highest)
> State and local gov’t spending: $9,581 (18th lowest)
[in-text-ad]

26. Arkansas (tied)
> Pct. of adults who volunteer: 30.0% (17th lowest)
> Avg. EMS arrival time (urban/rural): 7.0 minutes / 12.6 minutes
> Pct. population within 50 miles of a trauma center: 100.0% (the highest – tied)
> State and local gov’t spending: $9,136 (13th lowest)
[recirclink id=460187]

26. Arizona (tied)
> Pct. of adults who volunteer: 30.0% (18th lowest)
> Avg. EMS arrival time (urban/rural): 6.0 minutes / 14.9 minutes
> Pct. population within 50 miles of a trauma center: 90.0% (11th lowest)
> State and local gov’t spending: $8,509 (5th lowest)

26. Georgia (tied)
> Pct. of adults who volunteer: 26.5% (8th lowest)
> Avg. EMS arrival time (urban/rural): 8.5 minutes / 11.2 minutes
> Pct. population within 50 miles of a trauma center: 92.7% (13th lowest)
> State and local gov’t spending: $7,971 (2nd lowest)
[in-text-ad-2]

26. Idaho (tied)
> Pct. of adults who volunteer: 37.9% (9th highest)
> Avg. EMS arrival time (urban/rural): 4.9 minutes / 12.6 minutes
> Pct. population within 50 miles of a trauma center: 86.1% (7th lowest)
> State and local gov’t spending: $7,430 (the lowest)
18. Oregon (tied)
> Pct. of adults who volunteer: 43.2% (3rd highest)
> Avg. EMS arrival time (urban/rural): 6.0 minutes / 12.4 minutes
> Pct. population within 50 miles of a trauma center: 99.7% (15th highest – tied)
> State and local gov’t spending: $12,130 (10th highest)
[in-text-ad]

18. Delaware (tied)
> Pct. of adults who volunteer: 31.8% (23rd lowest)
> Avg. EMS arrival time (urban/rural): 6.3 minutes / 7.4 minutes
> Pct. population within 50 miles of a trauma center: 100.0% (the highest – tied)
> State and local gov’t spending: $11,988 (12th highest)
[recirclink id=486757]

18. Kentucky (tied)
> Pct. of adults who volunteer: 28.1% (13th lowest)
> Avg. EMS arrival time (urban/rural): 6.5 minutes / 11.7 minutes
> Pct. population within 50 miles of a trauma center: 88.6% (9th lowest)
> State and local gov’t spending: $10,245 (25th highest)

18. Kansas (tied)
> Pct. of adults who volunteer: 36.5% (12th highest)
> Avg. EMS arrival time (urban/rural): 6.1 minutes / 11.7 minutes
> Pct. population within 50 miles of a trauma center: 97.5% (22nd lowest – tied)
> State and local gov’t spending: $9,903 (23rd lowest)
[in-text-ad-2]

18. Alabama (tied)
> Pct. of adults who volunteer: 27.4% (10th lowest)
> Avg. EMS arrival time (urban/rural): 8.2 minutes / 14.7 minutes
> Pct. population within 50 miles of a trauma center: 96.6% (19th lowest)
> State and local gov’t spending: $9,310 (15th lowest)

18. North Carolina (tied)
> Pct. of adults who volunteer: 35.1% (18th highest)
> Avg. EMS arrival time (urban/rural): 7.9 minutes / 10.5 minutes
> Pct. population within 50 miles of a trauma center: 96.0% (18th lowest)
> State and local gov’t spending: $8,766 (8th lowest)
[in-text-ad]

18. Tennessee (tied)
> Pct. of adults who volunteer: 31.3% (21st lowest)
> Avg. EMS arrival time (urban/rural): 8.1 minutes / 12.3 minutes
> Pct. population within 50 miles of a trauma center: 63.2% (4th lowest)
> State and local gov’t spending: $8,684 (6th lowest)
[recirclink id=488926]

18. Florida (tied)
> Pct. of adults who volunteer: 22.8% (the lowest)
> Avg. EMS arrival time (urban/rural): 6.6 minutes / 10.5 minutes
> Pct. population within 50 miles of a trauma center: 91.9% (12th lowest)
> State and local gov’t spending: $8,113 (3rd lowest)
12. North Dakota (tied)
> Pct. of adults who volunteer: 37.4% (10th highest)
> Avg. EMS arrival time (urban/rural): 3.8 minutes / 14.4 minutes
> Pct. population within 50 miles of a trauma center: 55.3% (3rd lowest)
> State and local gov’t spending: $14,240 (4th highest)
[in-text-ad-2]

12. Minnesota (tied)
> Pct. of adults who volunteer: 45.1% (2nd highest)
> Avg. EMS arrival time (urban/rural): 6.7 minutes / 11.1 minutes
> Pct. population within 50 miles of a trauma center: 99.6% (17th highest)
> State and local gov’t spending: $11,886 (14th highest)

12. Pennsylvania (tied)
> Pct. of adults who volunteer: 34.2% (20th highest)
> Avg. EMS arrival time (urban/rural): 6.7 minutes / 10.7 minutes
> Pct. population within 50 miles of a trauma center: 97.5% (22nd lowest – tied)
> State and local gov’t spending: $11,219 (18th highest)
[in-text-ad]

12. Iowa (tied)
> Pct. of adults who volunteer: 41.5% (4th highest)
> Avg. EMS arrival time (urban/rural): 5.2 minutes / 13.6 minutes
> Pct. population within 50 miles of a trauma center: 100.0% (the highest – tied)
> State and local gov’t spending: $11,139 (20th highest)
[recirclink id=328234]

12. New Hampshire (tied)
> Pct. of adults who volunteer: 35.7% (17th highest)
> Avg. EMS arrival time (urban/rural): 9.0 minutes / 12.5 minutes
> Pct. population within 50 miles of a trauma center: 100.0% (the highest – tied)
> State and local gov’t spending: $9,430 (16th lowest)

12. Missouri (tied)
> Pct. of adults who volunteer: 31.9% (24th lowest)
> Avg. EMS arrival time (urban/rural): 8.5 minutes / 13.0 minutes
> Pct. population within 50 miles of a trauma center: 94.6% (17th lowest)
> State and local gov’t spending: $8,797 (10th lowest)
[in-text-ad-2]

9. New York (tied)
> Pct. of adults who volunteer: 25.3% (4th lowest)
> Avg. EMS arrival time (urban/rural): 5.3 minutes / 9.7 minutes
> Pct. population within 50 miles of a trauma center: 98.9% (20th highest – tied)
> State and local gov’t spending: $16,778 (3rd highest)

9. Connecticut (tied)
> Pct. of adults who volunteer: 31.8% (22nd lowest)
> Avg. EMS arrival time (urban/rural): 6.8 minutes / 7.5 minutes
> Pct. population within 50 miles of a trauma center: 100.0% (the highest – tied)
> State and local gov’t spending: $12,764 (7th highest)
[in-text-ad]

9. Wisconsin (tied)
> Pct. of adults who volunteer: 37.4% (11th highest)
> Avg. EMS arrival time (urban/rural): 5.6 minutes / 10.8 minutes
> Pct. population within 50 miles of a trauma center: 100.0% (the highest – tied)
> State and local gov’t spending: $10,302 (24th highest)
[recirclink id=499027]
7. Colorado (tied)
> Pct. of adults who volunteer: 32.4% (25th highest)
> Avg. EMS arrival time (urban/rural): 6.1 minutes / 12.8 minutes
> Pct. population within 50 miles of a trauma center: 98.8% (22nd highest)
> State and local gov’t spending: $10,341 (23rd highest)
7. Utah (tied)
> Pct. of adults who volunteer: 51.0% (the highest)
> Avg. EMS arrival time (urban/rural): 7.0 minutes / 16.9 minutes
> Pct. population within 50 miles of a trauma center: 97.5% (22nd lowest – tied)
> State and local gov’t spending: $8,955 (11th lowest)
[in-text-ad-2]

4. Vermont (tied)
> Pct. of adults who volunteer: 36.0% (15th highest)
> Avg. EMS arrival time (urban/rural): 5.7 minutes / 11.9 minutes
> Pct. population within 50 miles of a trauma center: 99.9% (12th highest – tied)
> State and local gov’t spending: $12,448 (8th highest)

4. Rhode Island (tied)
> Pct. of adults who volunteer: 30.7% (19th lowest)
> Avg. EMS arrival time (urban/rural): 6.4 minutes / 7.8 minutes
> Pct. population within 50 miles of a trauma center: 100.0% (the highest – tied)
> State and local gov’t spending: $11,516 (15th highest)
[in-text-ad]

4. Virginia (tied)
> Pct. of adults who volunteer: 34.0% (21st highest)
> Avg. EMS arrival time (urban/rural): 10.5 minutes / 12.4 minutes
> Pct. population within 50 miles of a trauma center: 98.6% (24th highest – tied)
> State and local gov’t spending: $9,529 (17th lowest)
[recirclink id=436250]
2. Nebraska (tied)
> Pct. of adults who volunteer: 40.2% (6th highest)
> Avg. EMS arrival time (urban/rural): 4.9 minutes / 11.2 minutes
> Pct. population within 50 miles of a trauma center: 96.8% (20th lowest)
> State and local gov’t spending: $12,075 (11th highest)

2. Maryland (tied)
> Pct. of adults who volunteer: 36.3% (13th highest)
> Avg. EMS arrival time (urban/rural): N/A
> Pct. population within 50 miles of a trauma center: 100.0% (the highest – tied)
> State and local gov’t spending: $11,210 (19th highest)
[in-text-ad-2]

1. Massachusetts
> Pct. of adults who volunteer: 32.6% (24th highest)
> Avg. EMS arrival time (urban/rural): 6.2 minutes / 8.6 minutes
> Pct. population within 50 miles of a trauma center: 98.2% (25th lowest)
> State and local gov’t spending: $13,119 (6th highest)
“Preparedness requires contributions from different types of agencies and organizations – hospitals, public health agencies, first responders, schools, and nursing homes,” Glen P. Mays, director of the National Health Security Preparedness Index Program, told 24/7 Wall St. in a written exchange. “Geographic variation in preparedness is becoming more pronounced over time because some states and communities are finding ways to improve preparedness, while others are maintaining the status quo.”The study found that the South-Central, Upper Mountain West, Pacific Coast, and Midwest regions are lagging behind the nation overall in health security. Some of these areas have fewer community resources to utilize if an emergency occurs, according to the study, and some rank among the poorest states.
Coastal states Texas and Louisiana are trailing the national average even though they are frequent targets of hurricanes. “Part of the problem involves resource constraints,” said Mays. “Areas that experience emergency events must devote a large share of their resources to recovery, and this leaves fewer resources available to prepare for the next emergency.”
The preparedness level in some states, such as Maine, Idaho, and Michigan, has declined from previous years. All three states lost some strength in their disease surveillance and reporting capabilities, according to Mays.
Northeast, Mid-Atlantic, Upper Midwest, and Central Rocky Mountain states have average preparedness levels above the national average.
24/7 Wall St. reviewed the findings of the The National Health Security Preparedness Index that was prepared by the Robert Wood Johnson Foundation to determine which states are the most (and least) prepared for a disaster. The index considers six gauges of preparedness: Health security surveillance, community planning and engagement, information and incident management, health-care delivery, countermeasure management, and environmental and occupational health.
Contact [email protected] for any questions or corrections.