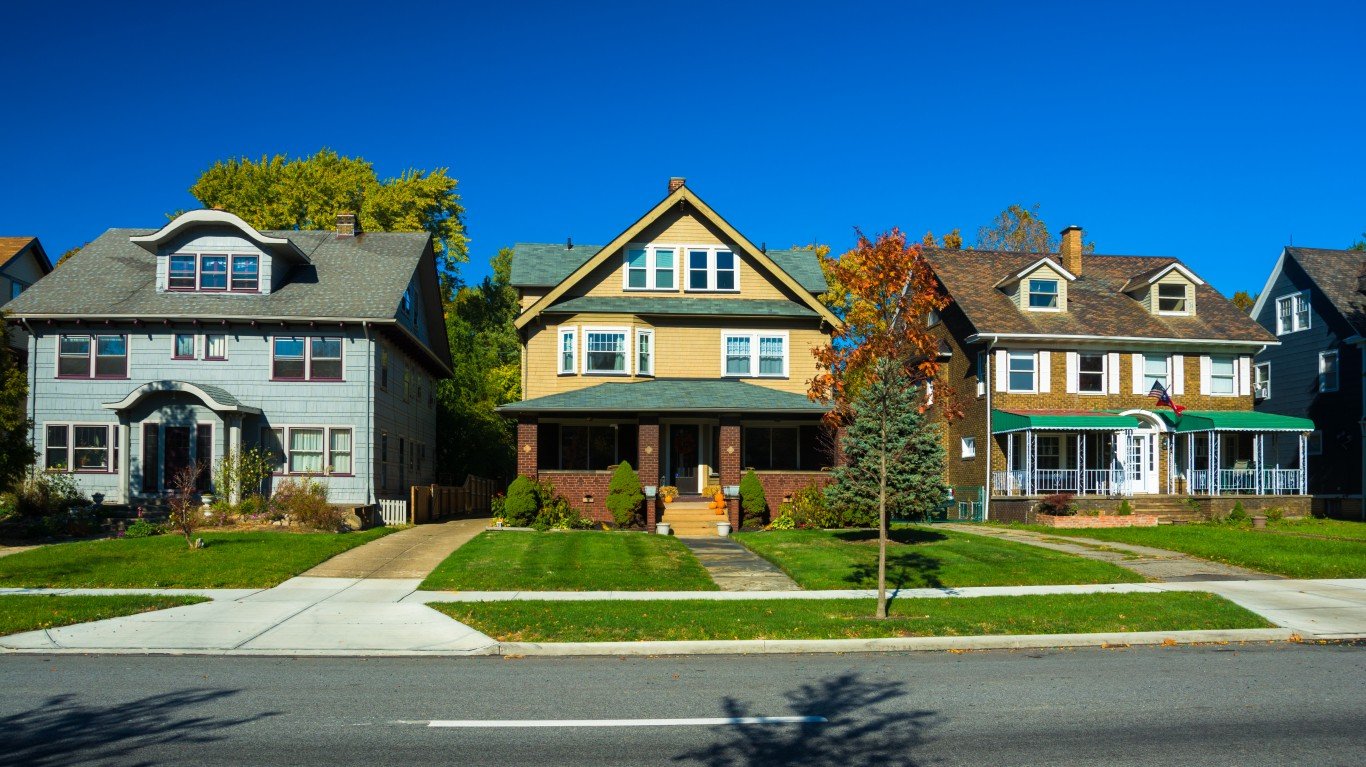
[cnxvideo id=”840066″ placement=”ros”]Many potential American homeowners dream about buying a brand new house, full of modern design elements and technology. Others, despite the risk of repairs, would much prefer an older house, steeped in history and rustic charm.
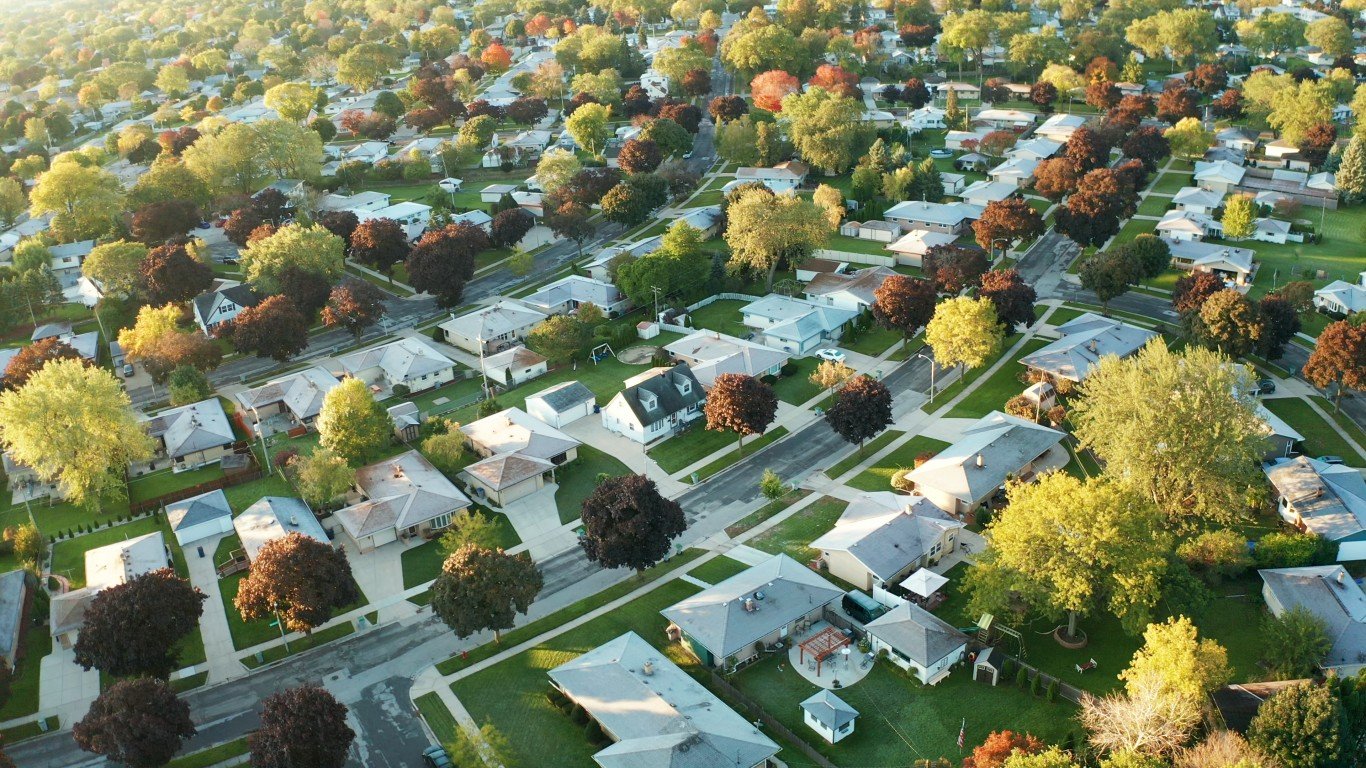
Depending on where you live, older homes are not only abundant, but they represent the vast majority of housing units in the city. According to data collected from the U.S. Census Bureau, there are 30 U.S. cities with a population of at least 65,000 where more than 70% of housing units were built before 1960, compared to about 28% of homes nationwide.
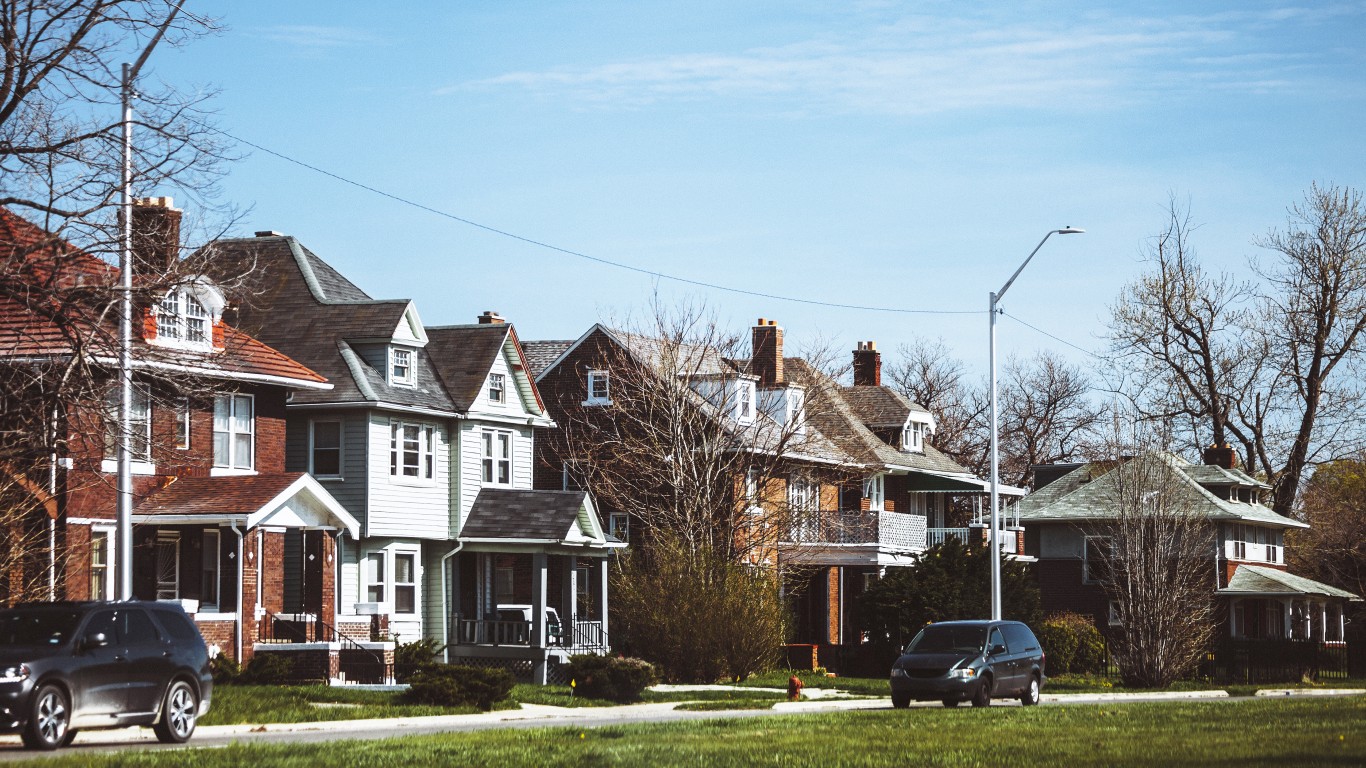
Many of the cities on this list have a large share of older homes because they are legacy cities, known also as Rust Belt cities. These places once thrived on manufacturing or materials production through the middle of the 20th century. By the 1970s, however, these industries began to shed jobs as post-industrial decline swept across the American Northeast, Midwest, and Mid Atlantic.
Today, new homes are rarely built in these cities as demand is low — few people are moving to these cities and the populations are declining. In fact, several of the cities on this list, including Detroit, are among the cities that have lost more than half their populations since 2050.
As it relates to the status of the housing market, the other byproduct of the long-term economic struggles is that homes in these cities are relatively inexpensive. The typical American home has a value of $217,600, but the median home value in many of the cities on this list is less than $100,000.
While many of the cities on this list struggle economically, others are full of wealthy Americans, and while there is relatively little new property being built, the homes that remain are expensive. These are places like New Rochelle, New York, and Somerville, Massachusetts, where the typical home is worth two to three times as much as the typical American home. These places are some of the richest cities in America.
Click here to see the cities with the oldest homes
Click here to read our methodology
30. Wilmington, DE
> Share of housing units built before 1960: 70.7% (25,112)
> Share of housing units built since 2000: 6.5% (2,303)
> Population change since 2010: -0.3% (70,851 to 70,635)
> Median home value: $176,800
[in-text-ad]
29. Dearborn, MI
> Share of housing units built before 1960: 71.2% (23,806)
> Share of housing units built since 2000: 4.0% (1,353)
> Population change since 2010: -3.9% (98,153 to 94,333)
> Median home value: $144,900
[recirclink id=553985]
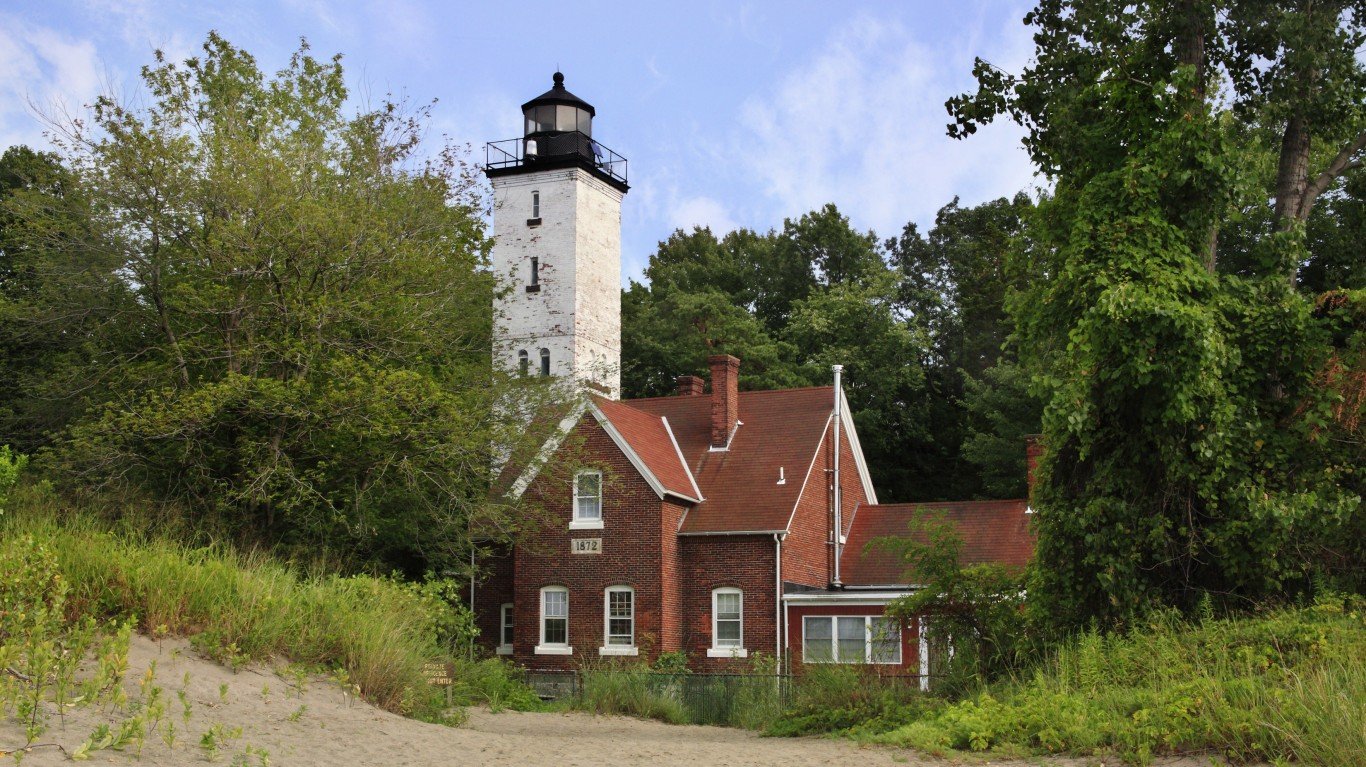
28. Erie, PA
> Share of housing units built before 1960: 71.3% (31,807)
> Share of housing units built since 2000: 2.9% (1,289)
> Population change since 2010: -5.2% (101,786 to 96,471)
> Median home value: $88,000
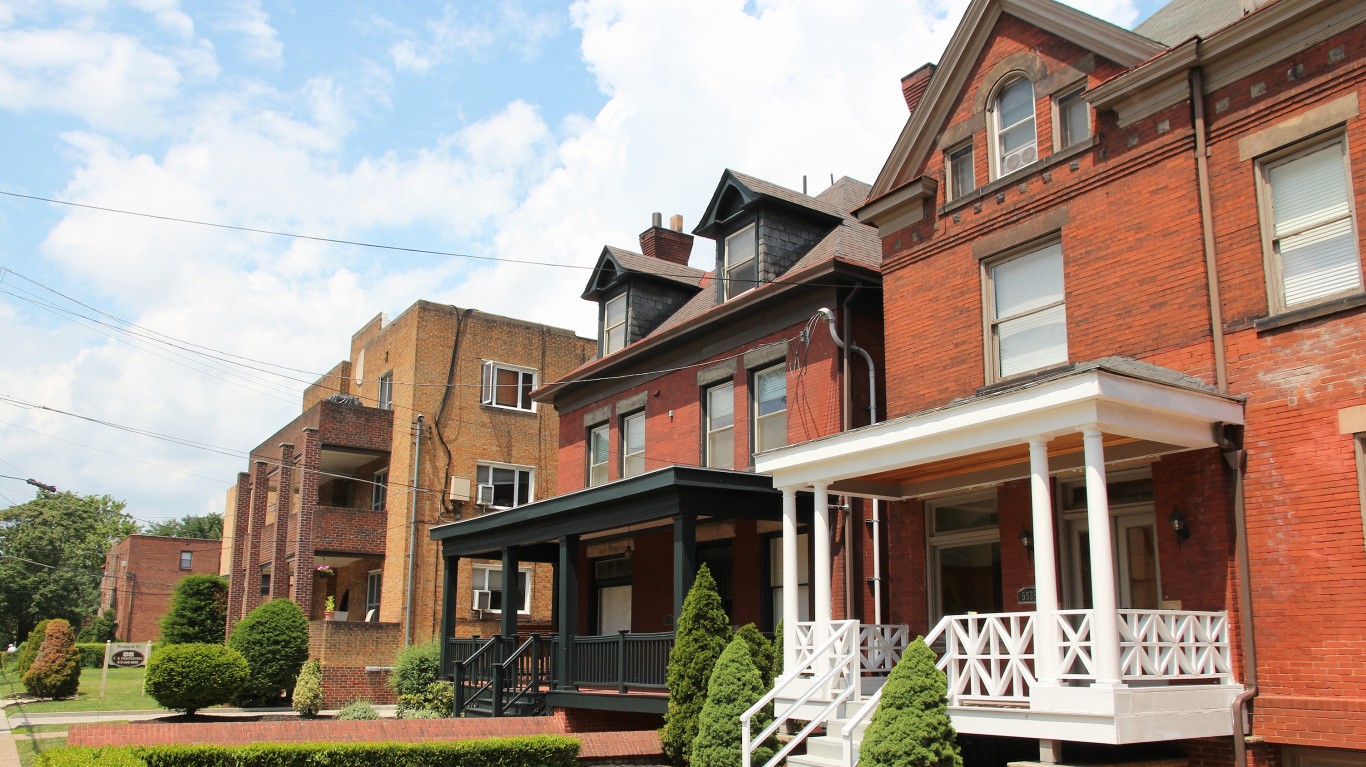
27. Pittsburgh, PA
> Share of housing units built before 1960: 71.3% (112,806)
> Share of housing units built since 2000: 5.2% (8,301)
> Population change since 2010: -1.5% (305,704 to 301,048)
> Median home value: $123,600
[in-text-ad-2]
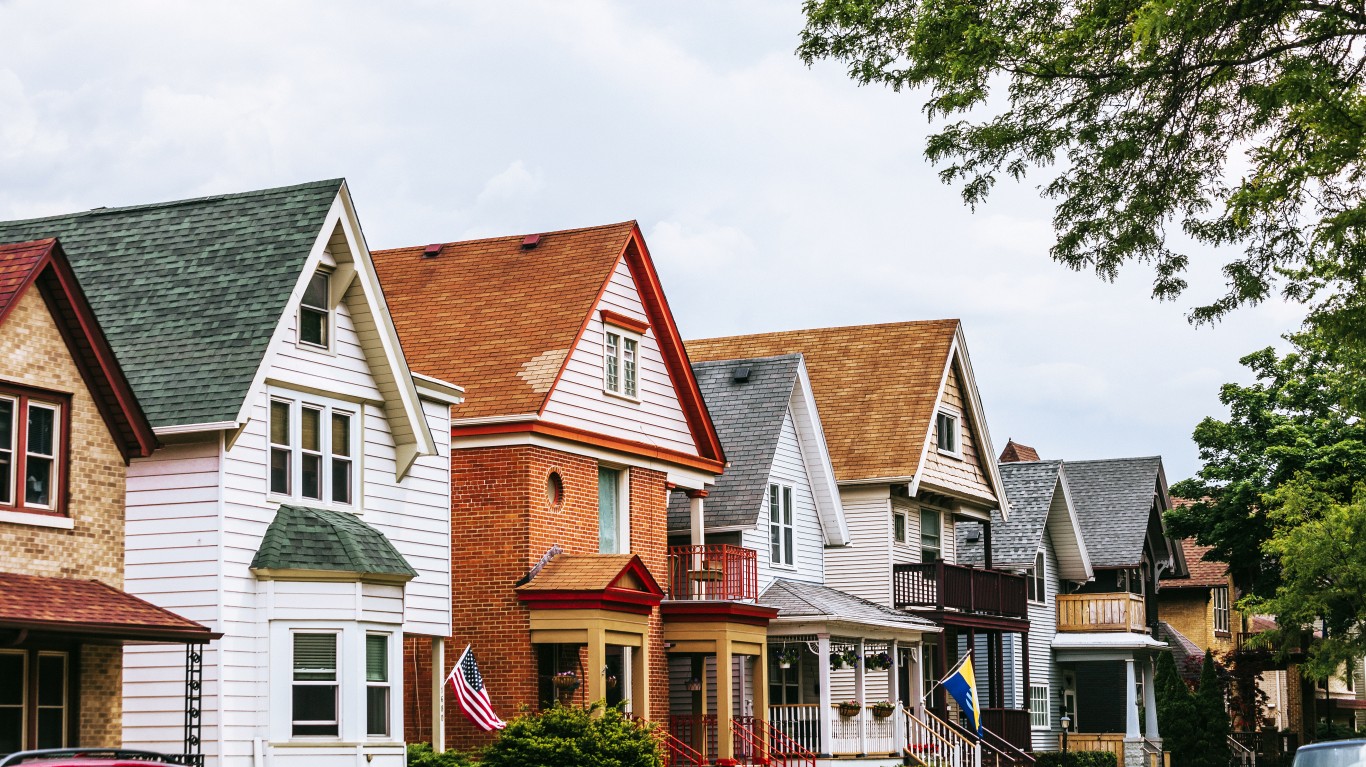
26. Milwaukee, WI
> Share of housing units built before 1960: 71.3% (185,780)
> Share of housing units built since 2000: 4.5% (11,839)
> Population change since 2010: -0.5% (594,833 to 592,025)
> Median home value: $122,300

25. Canton, OH
> Share of housing units built before 1960: 71.6% (25,017)
> Share of housing units built since 2000: 4.0% (1,383)
> Population change since 2010: -3.5% (73,007 to 70,458)
> Median home value: $74,200
[in-text-ad]
24. Philadelphia, PA
> Share of housing units built before 1960: 71.8% (492,515)
> Share of housing units built since 2000: 5.1% (34,784)
> Population change since 2010: +3.8% (1,526,006 to 1,584,138)
> Median home value: $166,200
[recirclink id=551802]
23. Whittier, CA
> Share of housing units built before 1960: 71.9% (19,904)
> Share of housing units built since 2000: 2.0% (543)
> Population change since 2010: +0.3% (64,270 to 64,457)
> Median home value: $581,300
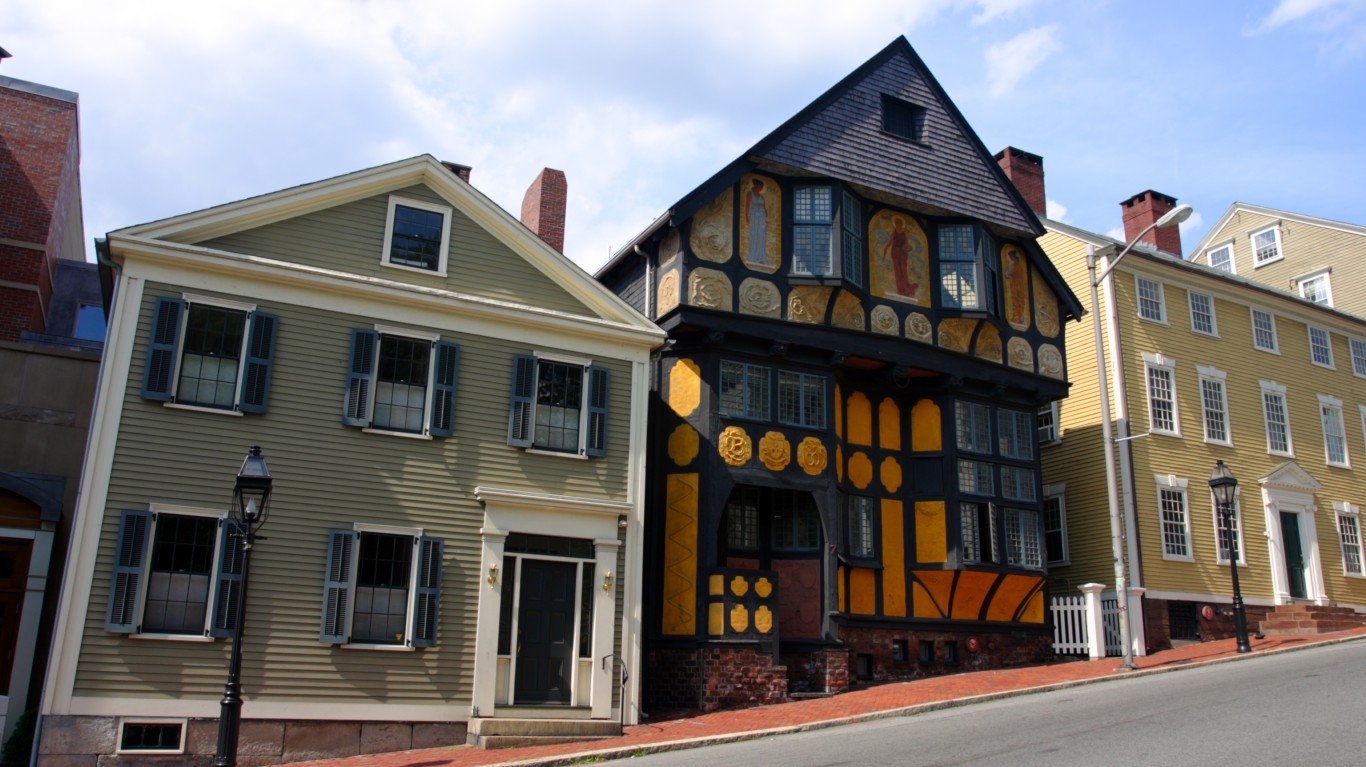
22. Providence, RI
> Share of housing units built before 1960: 72.1% (55,237)
> Share of housing units built since 2000: 3.9% (2,995)
> Population change since 2010: +0.7% (178,042 to 179,335)
> Median home value: $203,300
[in-text-ad-2]
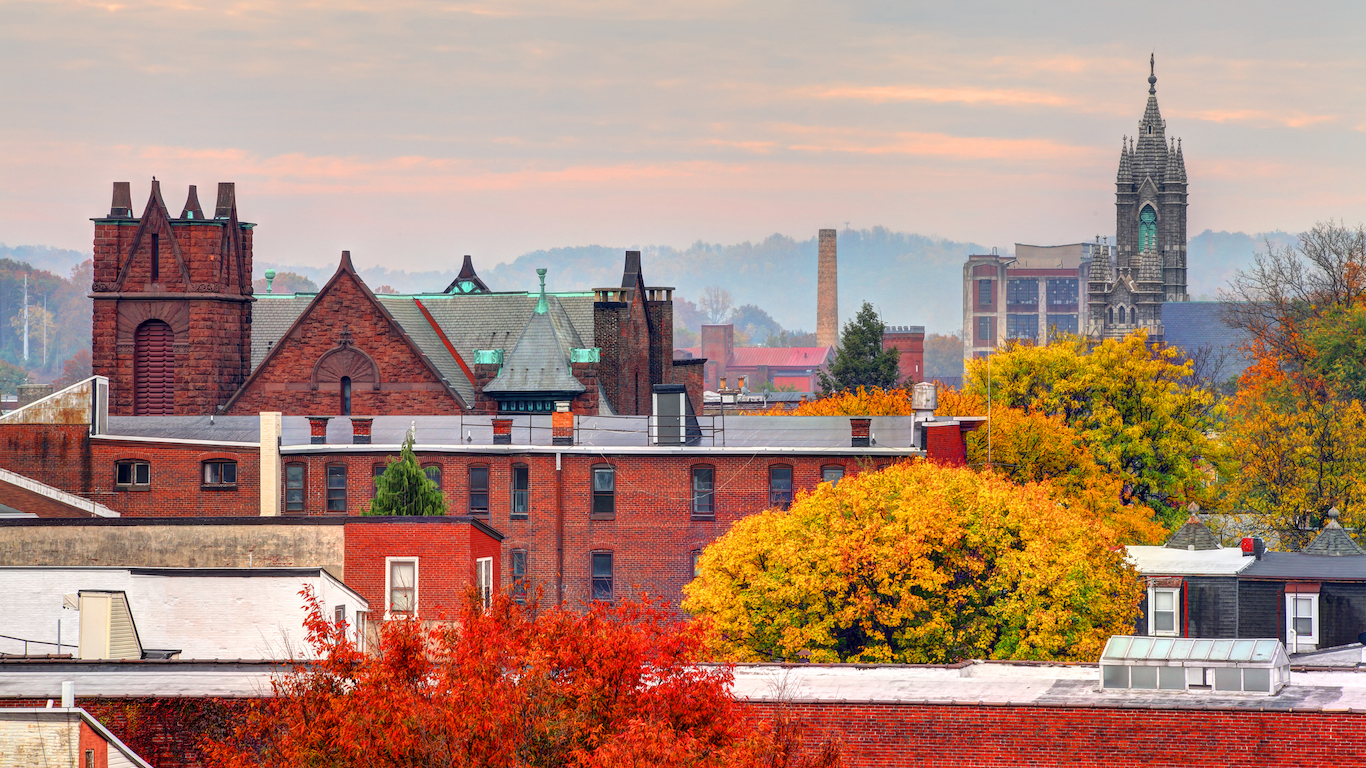
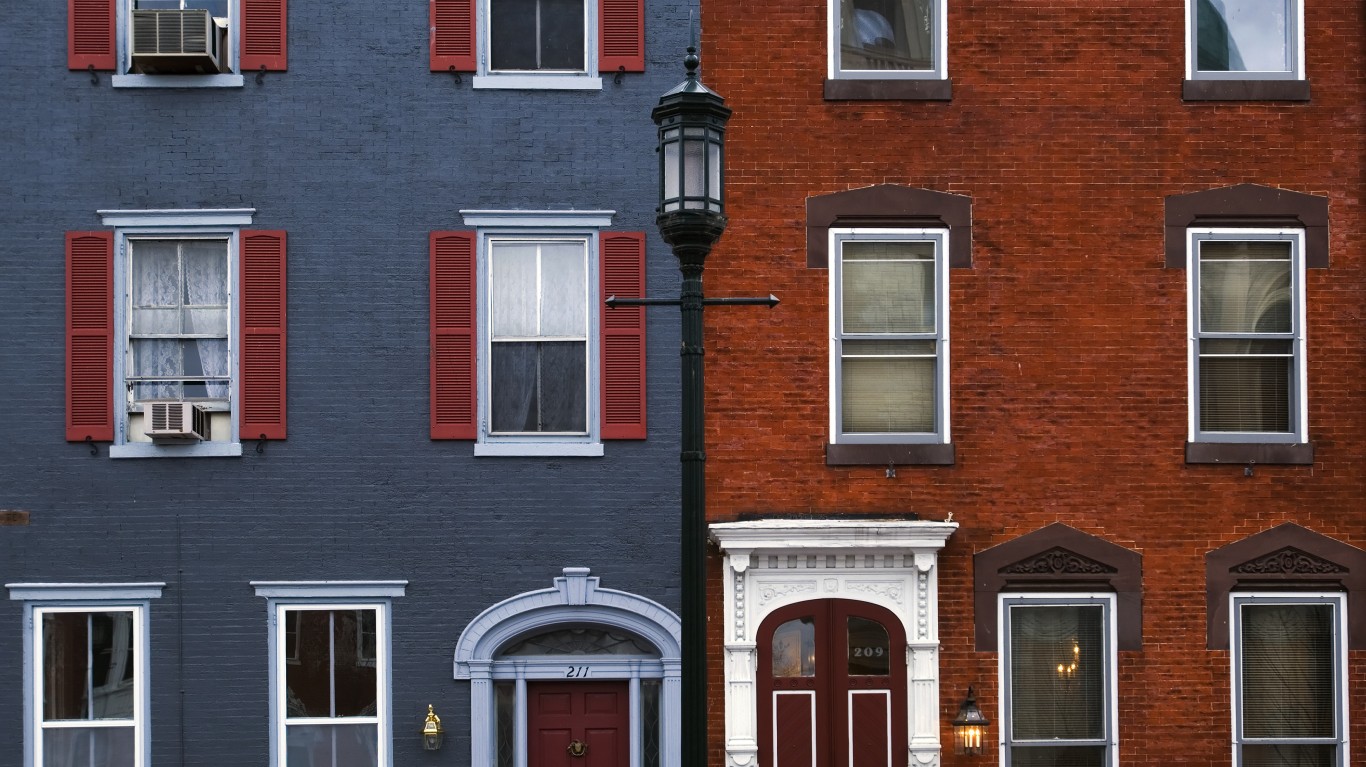
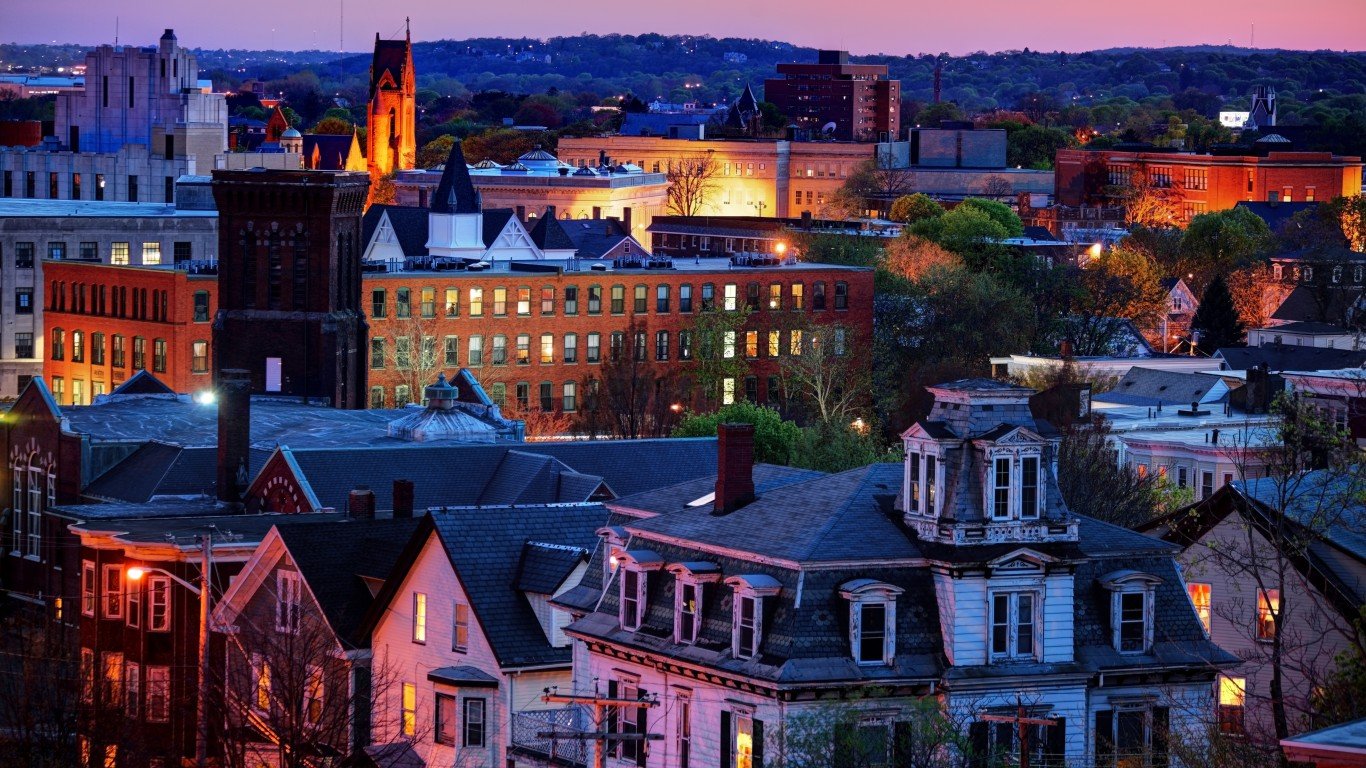
21. Reading, PA
> Share of housing units built before 1960: 72.2% (23,841)
> Share of housing units built since 2000: 1.4% (472)
> Population change since 2010: +0.5% (88,082 to 88,495)
> Median home value: $70,000
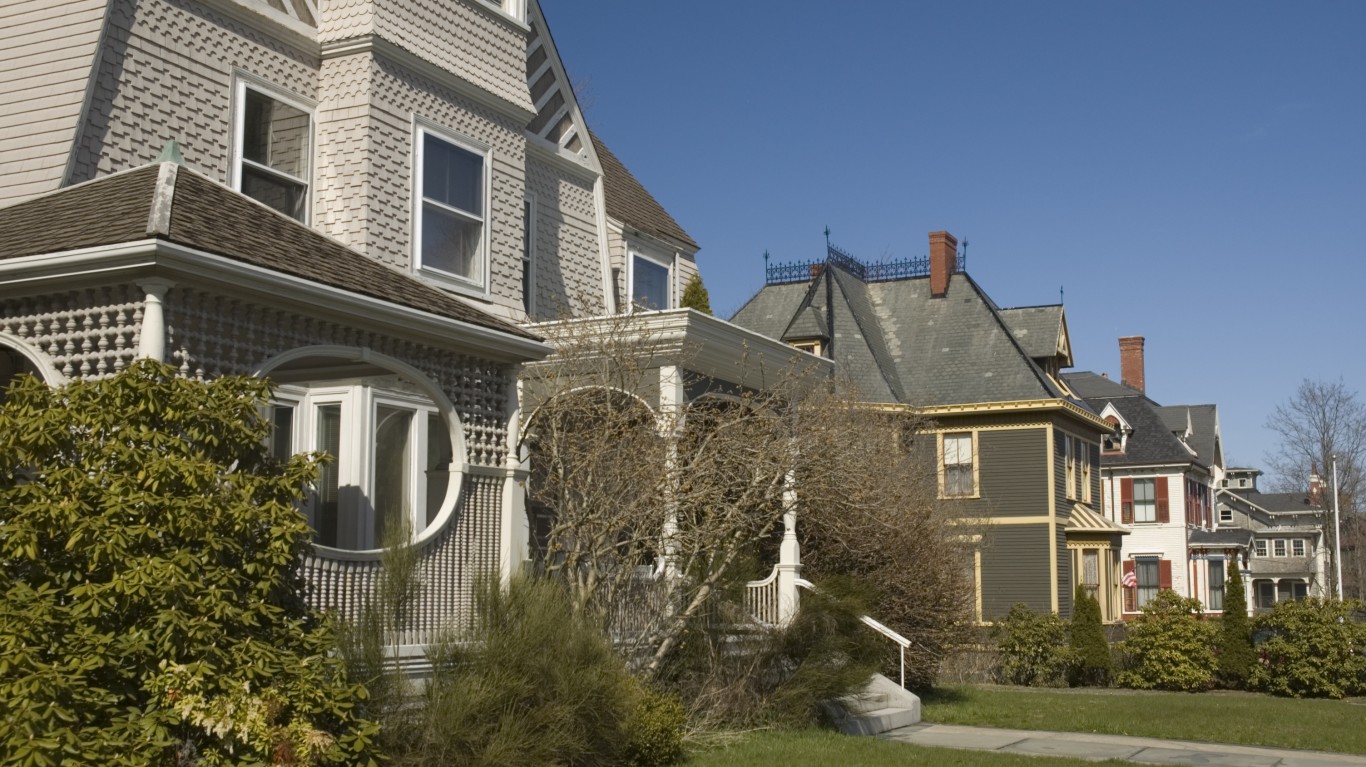
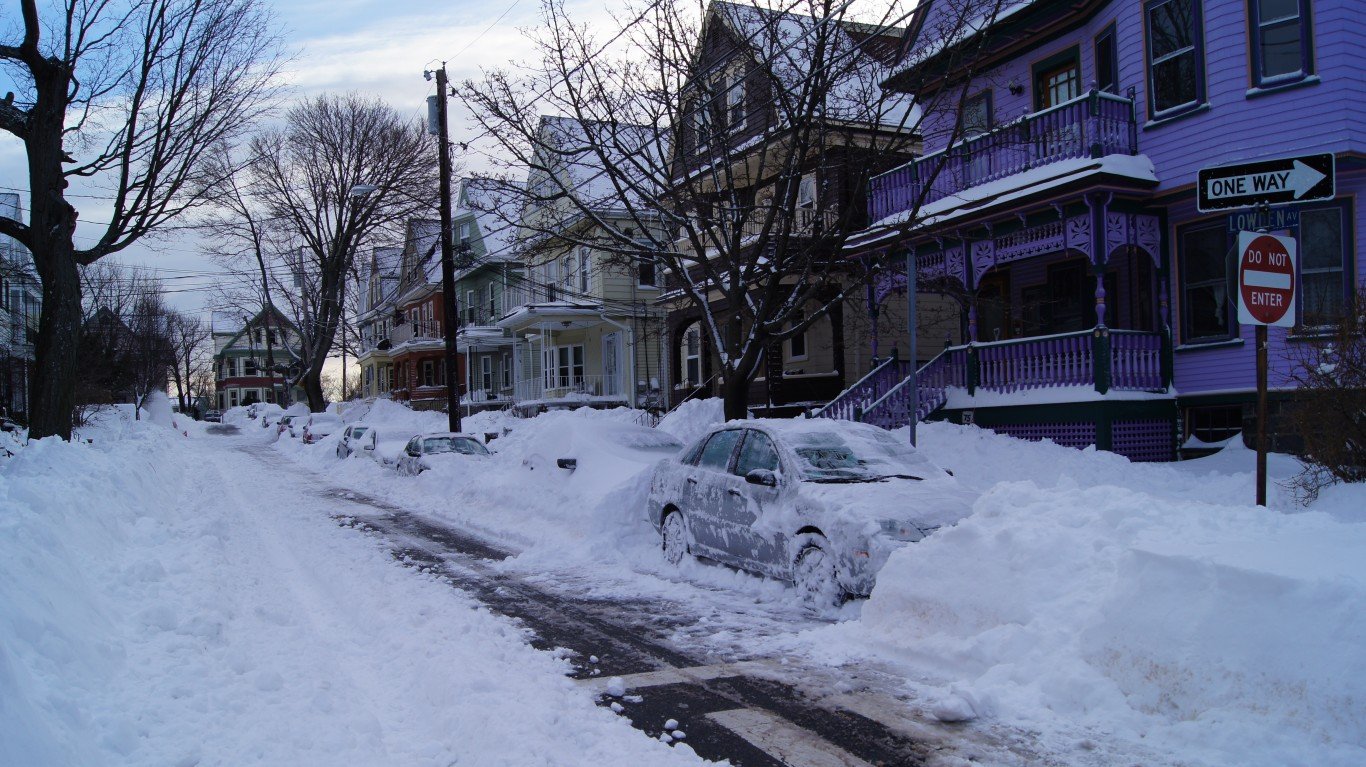
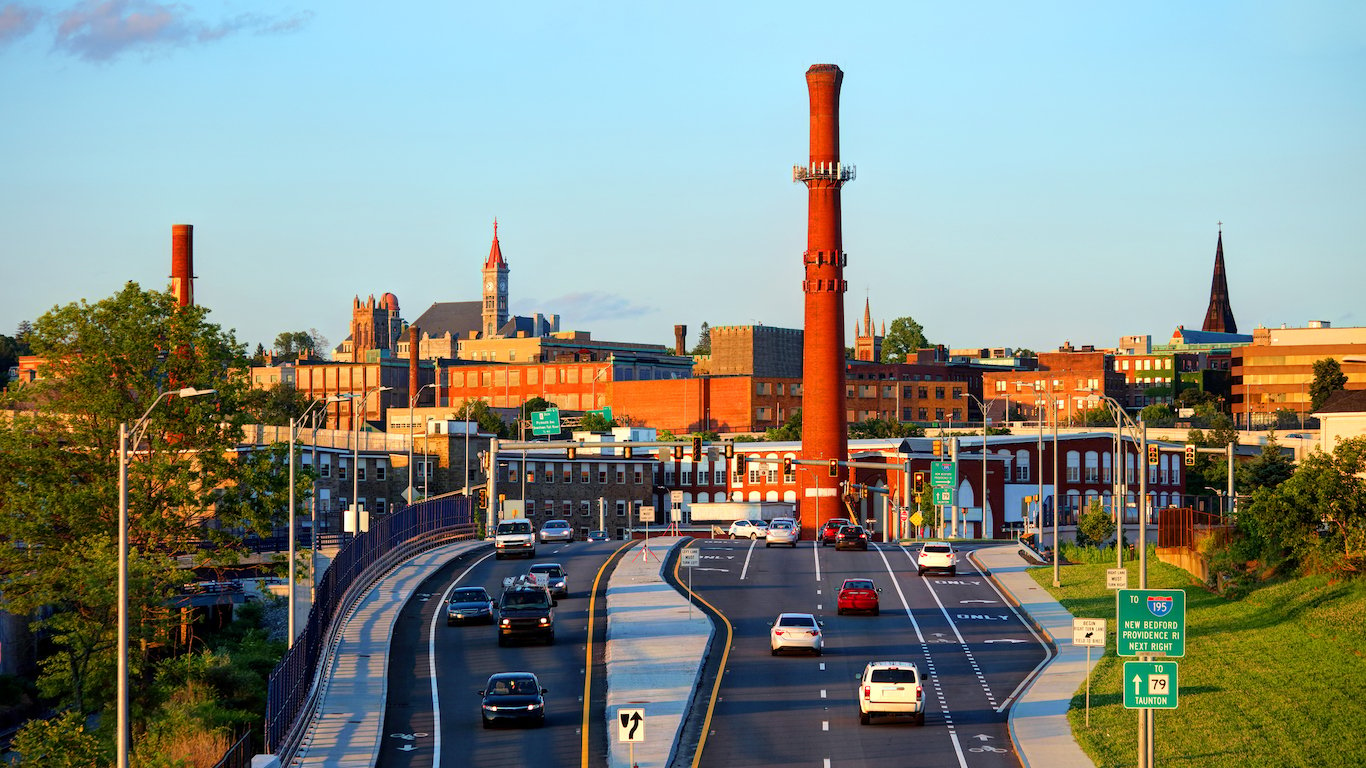
20. New Bedford, MA
> Share of housing units built before 1960: 72.4% (31,010)
> Share of housing units built since 2000: 4.4% (1,882)
> Population change since 2010: +0.3% (95,072 to 95,315)
> Median home value: $236,200
[in-text-ad]
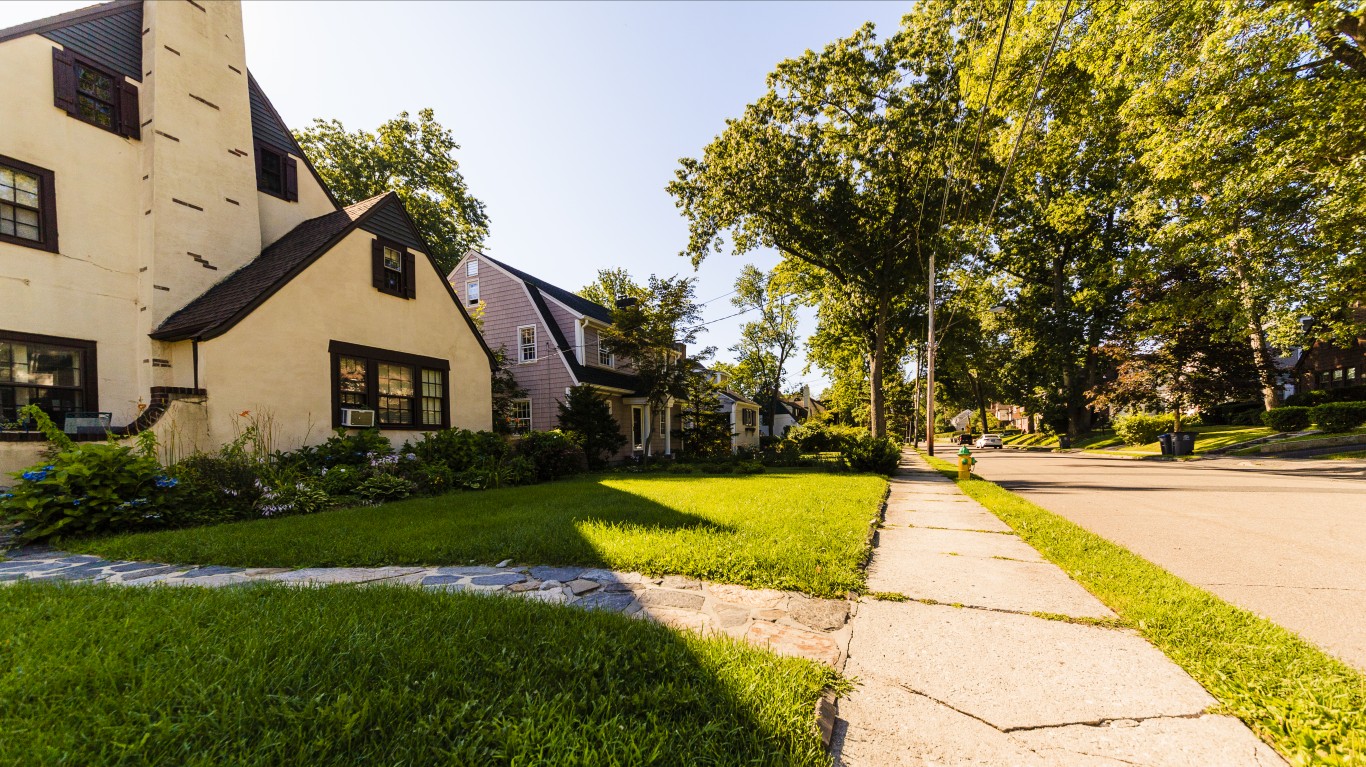
19. New Rochelle, NY
> Share of housing units built before 1960: 72.8% (21,446)
> Share of housing units built since 2000: 7.2% (2,132)
> Population change since 2010: +2.2% (77,062 to 78,742)
> Median home value: $595,000
[recirclink id=536210]
18. Somerville, MA
> Share of housing units built before 1960: 72.9% (26,803)
> Share of housing units built since 2000: 7.5% (2,752)
> Population change since 2010: +7.7% (75,754 to 81,562)
> Median home value: $666,500
17. Fall River, MA
> Share of housing units built before 1960: 72.9% (31,453)
> Share of housing units built since 2000: 4.5% (1,958)
> Population change since 2010: +0.9% (88,857 to 89,661)
> Median home value: $249,300
[in-text-ad-2]
16. Lynn, MA
> Share of housing units built before 1960: 72.9% (25,150)
> Share of housing units built since 2000: 3.5% (1,224)
> Population change since 2010: +4.8% (90,329 to 94,654)
> Median home value: $336,100
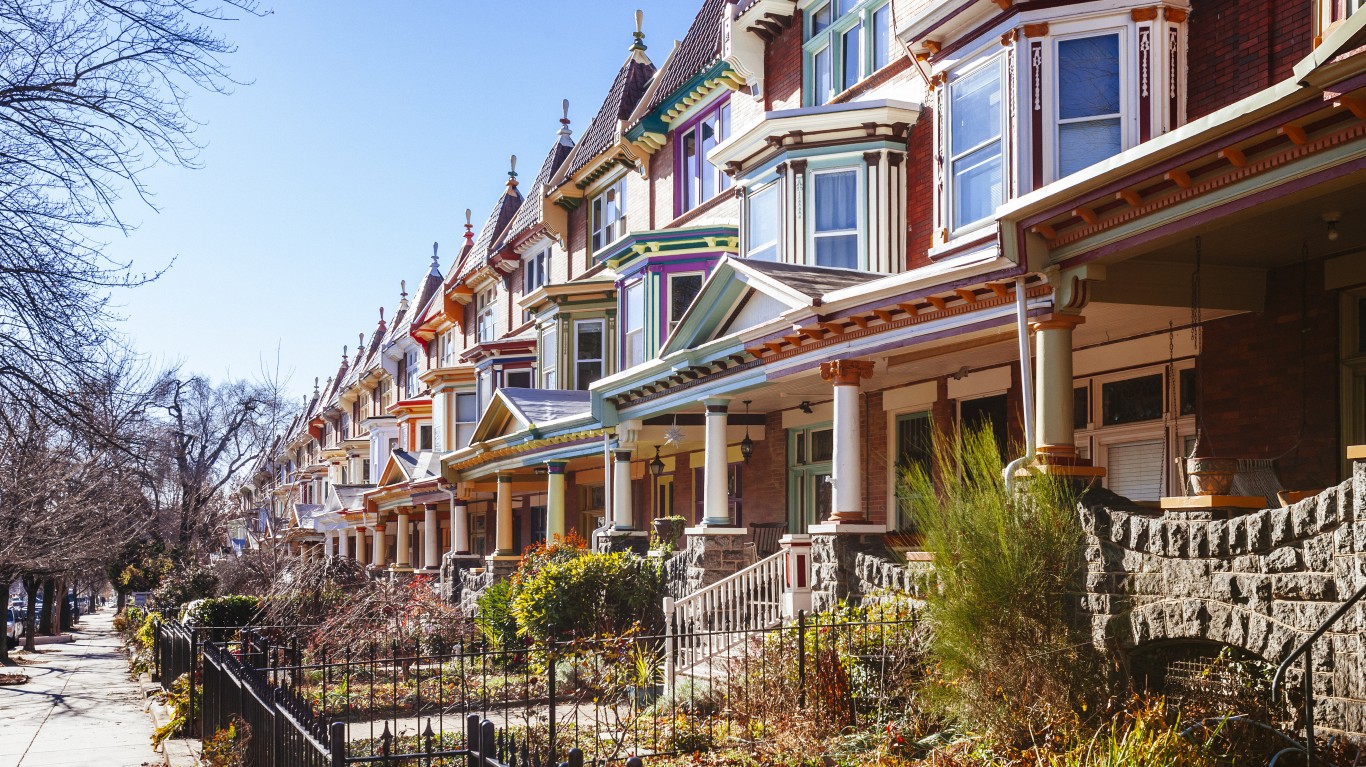
15. Baltimore, MD
> Share of housing units built before 1960: 73.1% (215,228)
> Share of housing units built since 2000: 5.2% (15,390)
> Population change since 2010: -3.0% (620,961 to 602,495)
> Median home value: $154,400
[in-text-ad]
14. Rochester, NY
> Share of housing units built before 1960: 73.5% (76,983)
> Share of housing units built since 2000: 3.5% (3,655)
> Population change since 2010: -2.0% (210,565 to 206,284)
> Median home value: $82,400
[recirclink id=545465]
13. Schenectady, NY
> Share of housing units built before 1960: 73.5% (24,749)
> Share of housing units built since 2000: 1.9% (626)
> Population change since 2010: -0.8% (66,135 to 65,575)
> Median home value: $105,900

12. Flint, MI
> Share of housing units built before 1960: 73.9% (42,135)
> Share of housing units built since 2000: 1.2% (691)
> Population change since 2010: -6.3% (102,434 to 95,943)
> Median home value: $27,400
[in-text-ad-2]
11. Hammond, IN
> Share of housing units built before 1960: 74.4% (22,416)
> Share of housing units built since 2000: 2.2% (675)
> Population change since 2010: -6.2% (80,830 to 75,795)
> Median home value: $89,200
10. Scranton, PA
> Share of housing units built before 1960: 74.8% (27,324)
> Share of housing units built since 2000: 2.3% (846)
> Population change since 2010: +1.4% (76,089 to 77,182)
> Median home value: $108,100
[in-text-ad]
9. Cleveland, OH
> Share of housing units built before 1960: 75.7% (161,001)
> Share of housing units built since 2000: 5.2% (11,098)
> Population change since 2010: -3.3% (396,815 to 383,793)
> Median home value: $70,200
[recirclink id=542036]
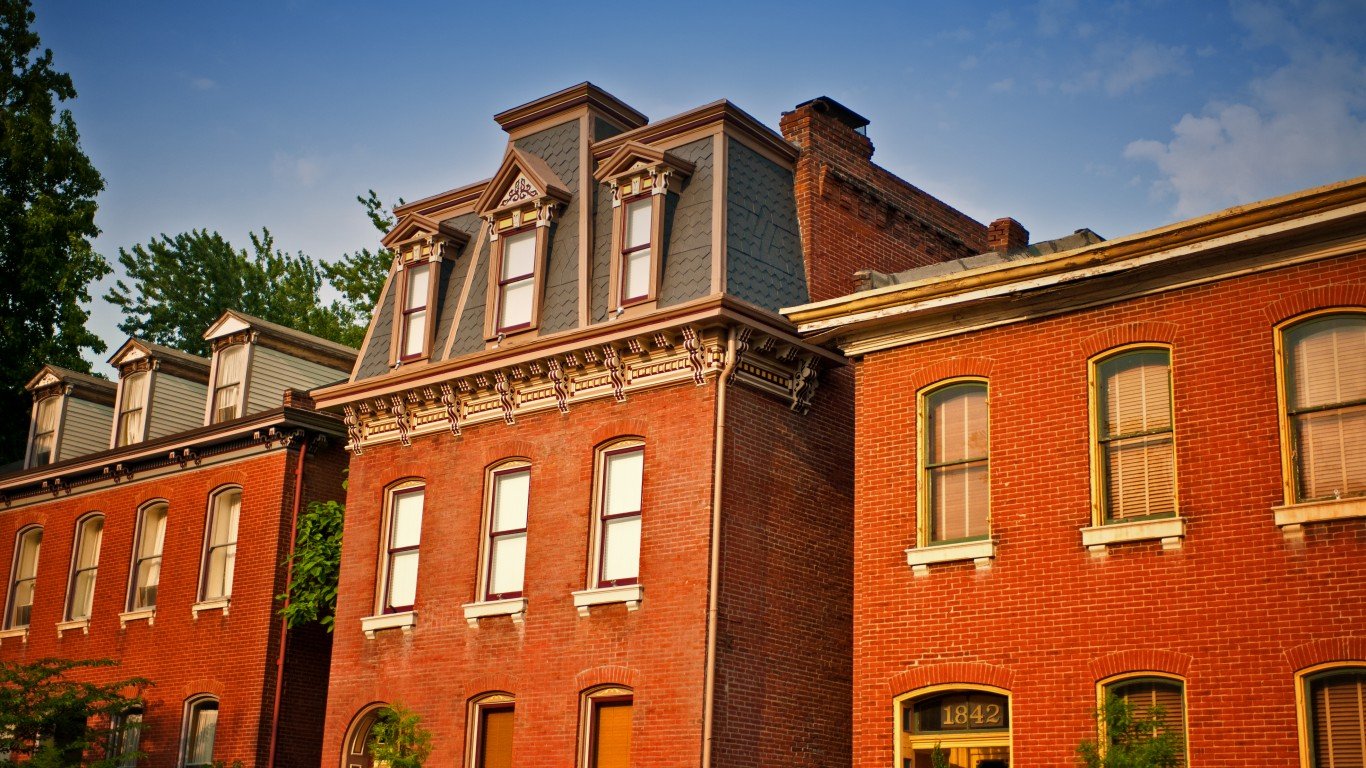
8. St. Louis, MO
> Share of housing units built before 1960: 76.0% (134,451)
> Share of housing units built since 2000: 6.9% (12,253)
> Population change since 2010: -5.2% (319,294 to 302,838)
> Median home value: $141,400
7. Syracuse, NY
> Share of housing units built before 1960: 76.4% (51,155)
> Share of housing units built since 2000: 3.9% (2,604)
> Population change since 2010: -1.7% (145,170 to 142,749)
> Median home value: $90,100
[in-text-ad-2]
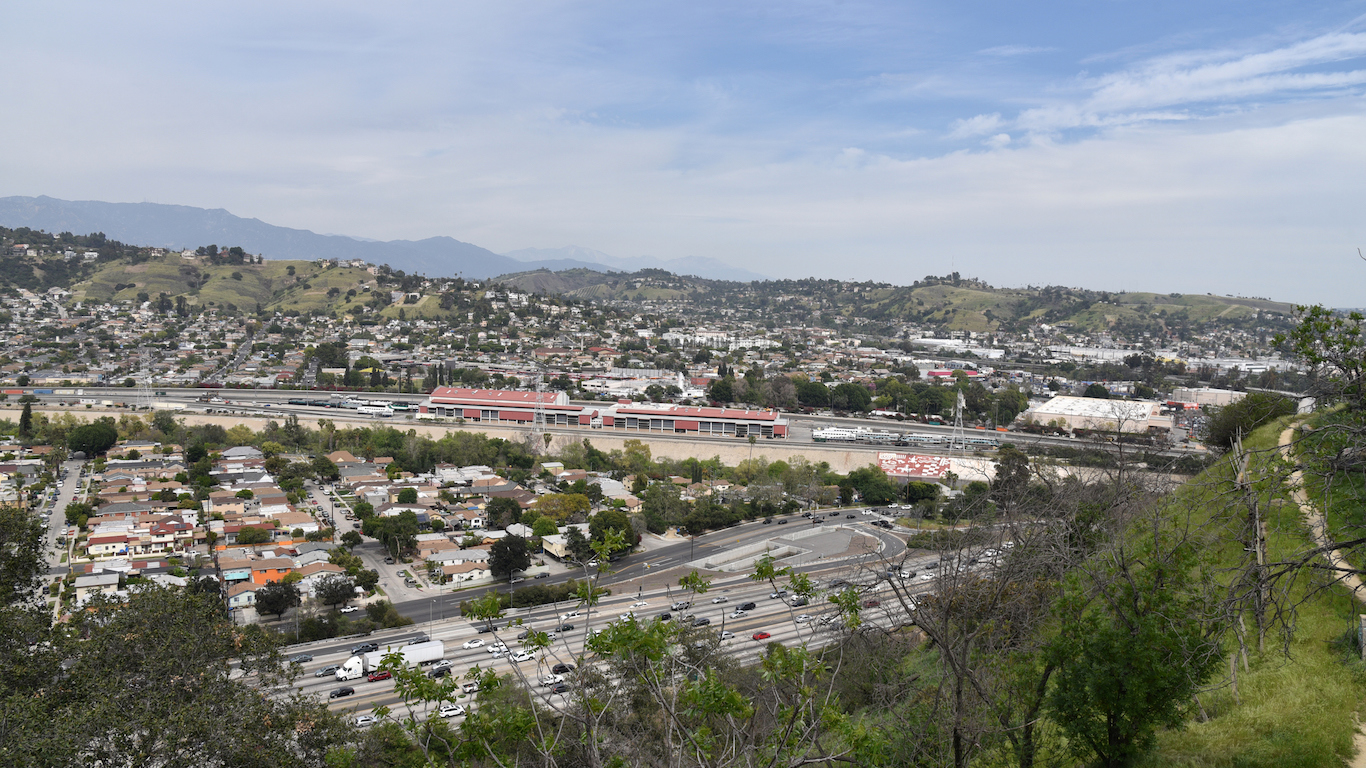
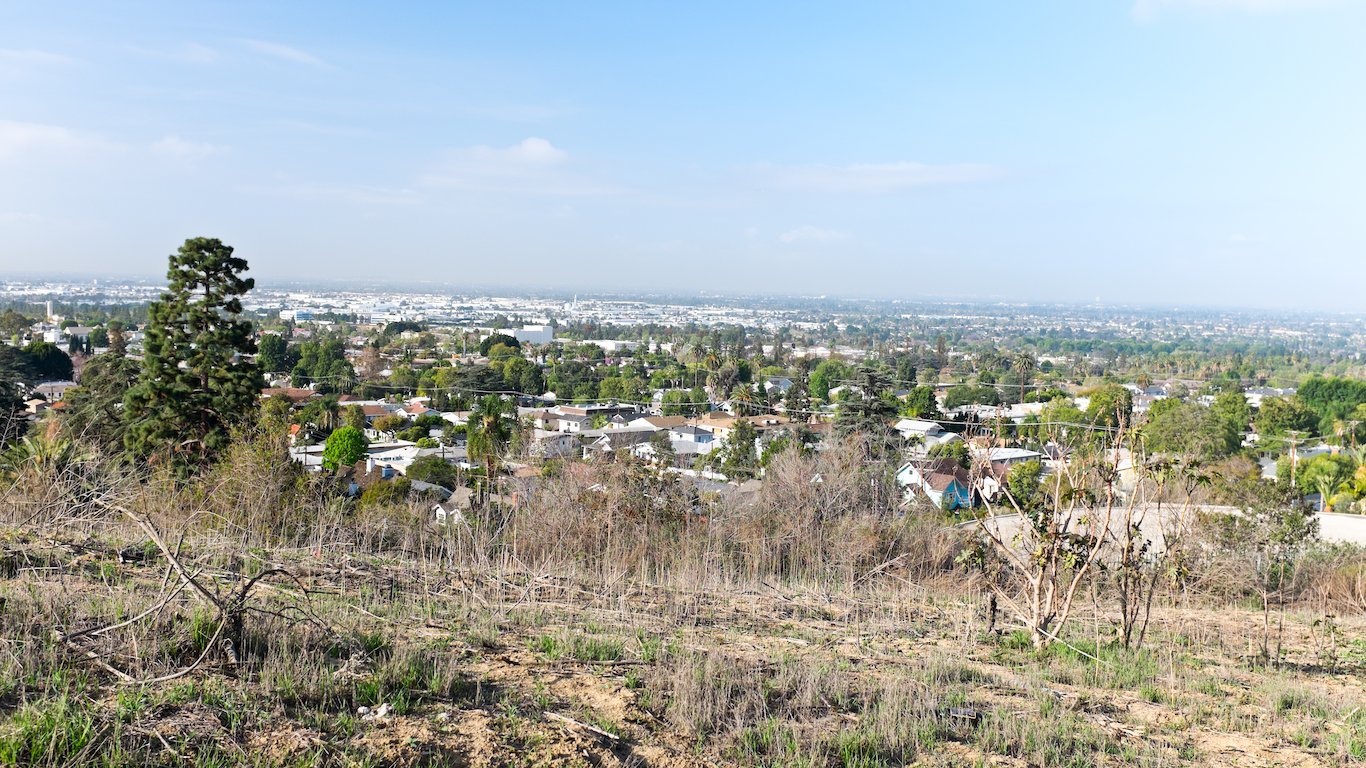
6. East Los Angeles, CA
> Share of housing units built before 1960: 80.1% (26,661)
> Share of housing units built since 2000: 3.4% (1,129)
> Population change since 2010: N/A
> Median home value: $434,200
5. Detroit, MI
> Share of housing units built before 1960: 80.4% (292,291)
> Share of housing units built since 2000: 3.3% (12,143)
> Population change since 2010: -5.8% (713,777 to 672,662)
> Median home value: $50,200
[in-text-ad]
4. Mount Vernon, NY
> Share of housing units built before 1960: 80.9% (23,932)
> Share of housing units built since 2000: 2.6% (778)
> Population change since 2010: +0.4% (67,292 to 67,593)
> Median home value: $341,400
[recirclink id=547738]

3. Trenton, NJ
> Share of housing units built before 1960: 82.1% (28,454)
> Share of housing units built since 2000: 4.8% (1,671)
> Population change since 2010: -1.1% (84,913 to 83,974)
> Median home value: $98,100
2. Buffalo, NY
> Share of housing units built before 1960: 84.1% (112,029)
> Share of housing units built since 2000: 3.4% (4,507)
> Population change since 2010: -1.9% (261,310 to 256,304)
> Median home value: $92,700
[in-text-ad-2]

1. Cicero, IL
> Share of housing units built before 1960: 87.5% (22,099)
> Share of housing units built since 2000: 0.5% (119)
> Population change since 2010: -2.7% (83,891 to 81,597)
> Median home value: $158,300
Methodology
To determine the cities with the oldest homes in the United States, 24/7 Wall St. reviewed the Census Bureau’s 2017 American Community Survey one-year estimates to find the percentage of housing structures built in 1959 or earlier. Only cities with a population of 65,000 or more as measured by the U.S. Census Bureau were included in the ranking. Median home values also came from the 2017 ACS. Population change figures came from the U.S. Census Bureau’s Annual Estimates of the Resident Population dataset, and are from April 1, 2010 through July 1, 2018.
Contact [email protected] for any questions or corrections.