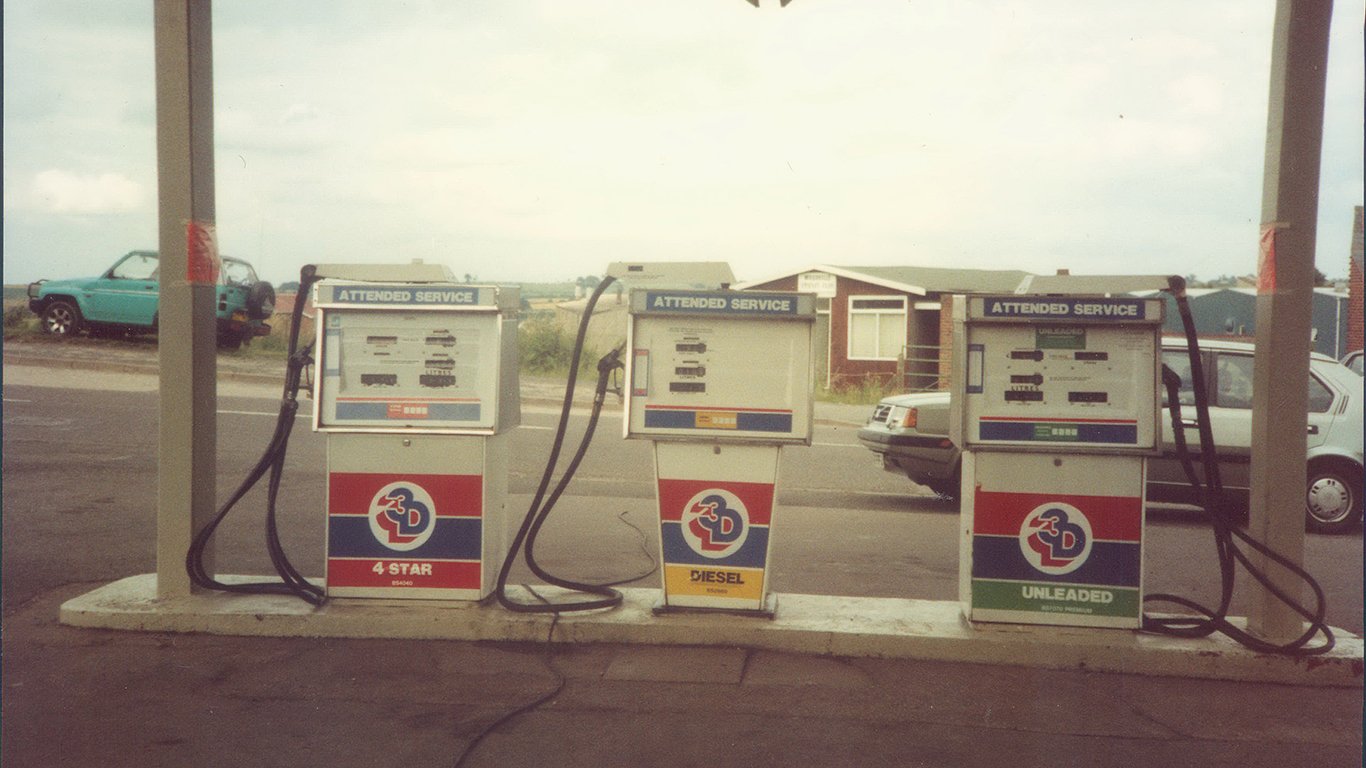
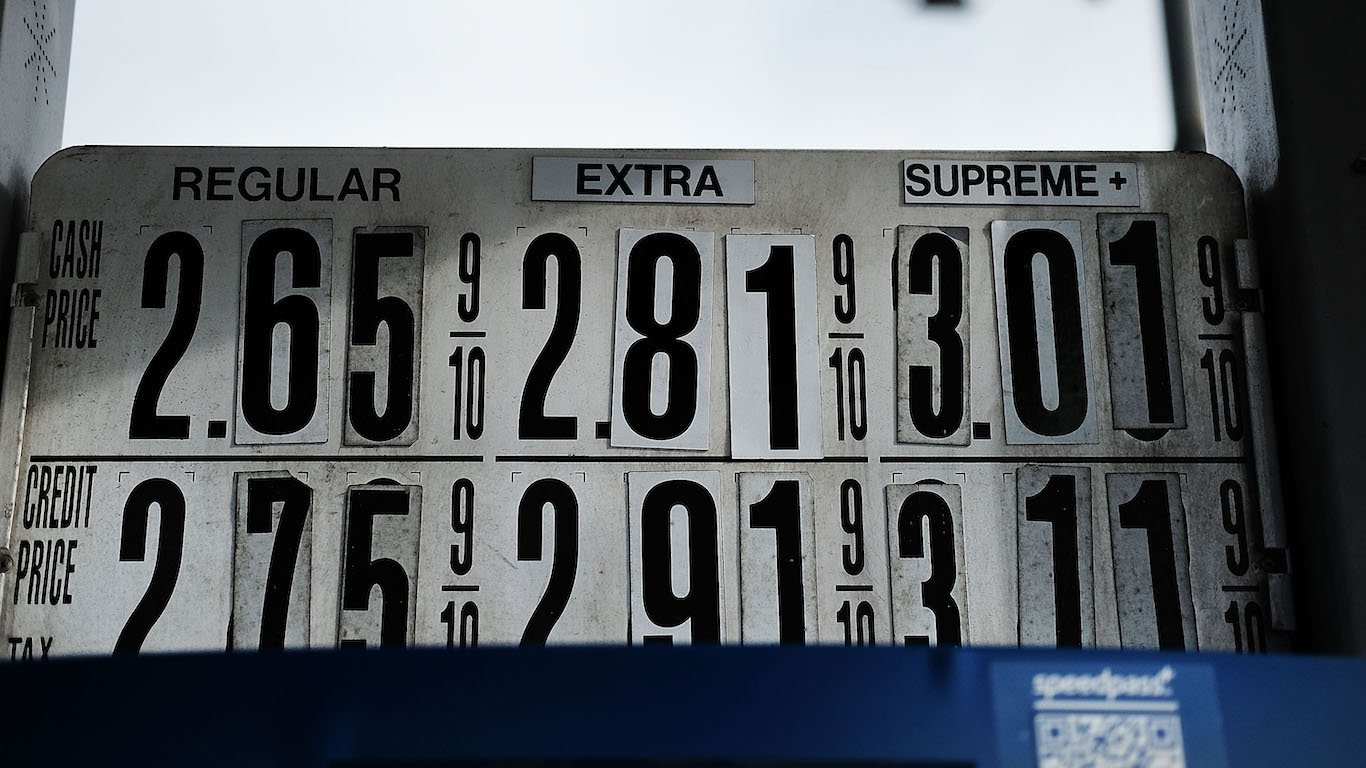
The price of gasoline is one of the most closely watched markets — and it has been since Henry Ford put America in automobiles early in the 20th century.
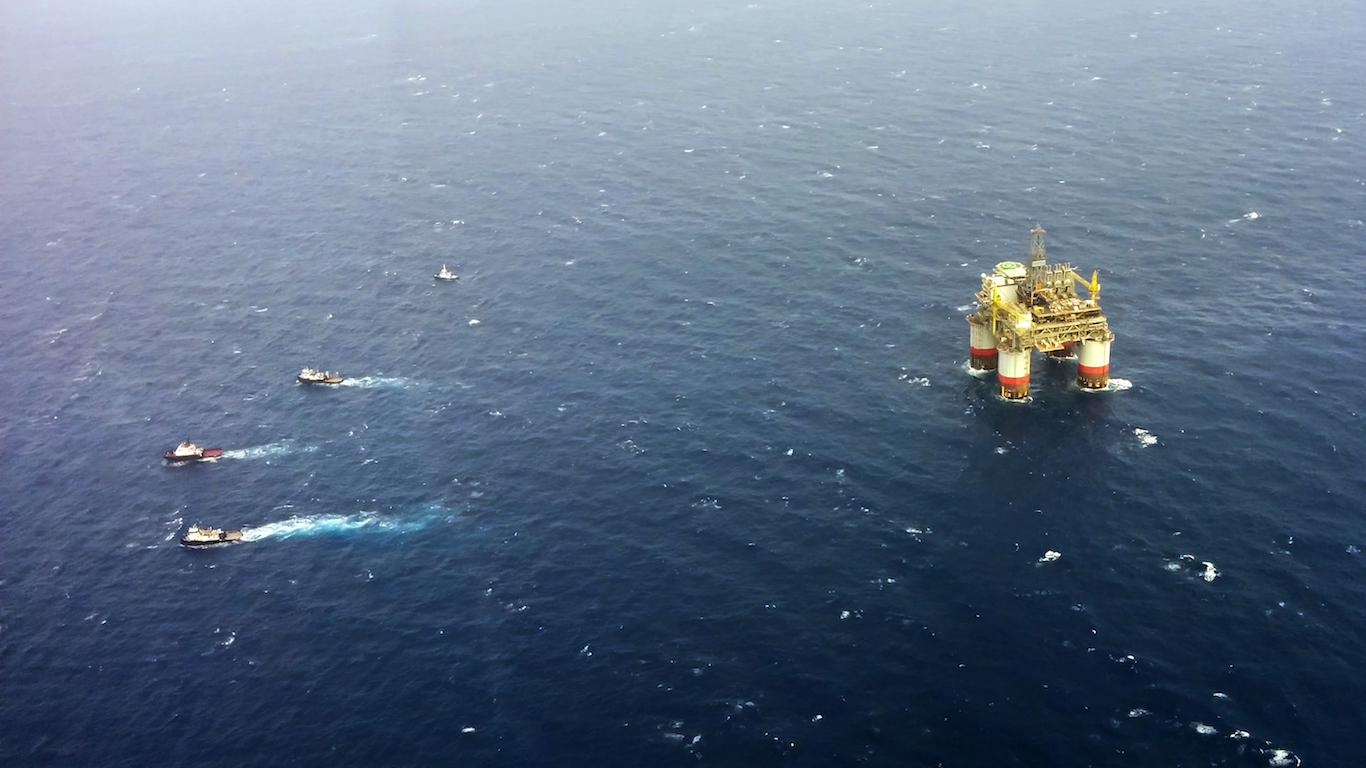
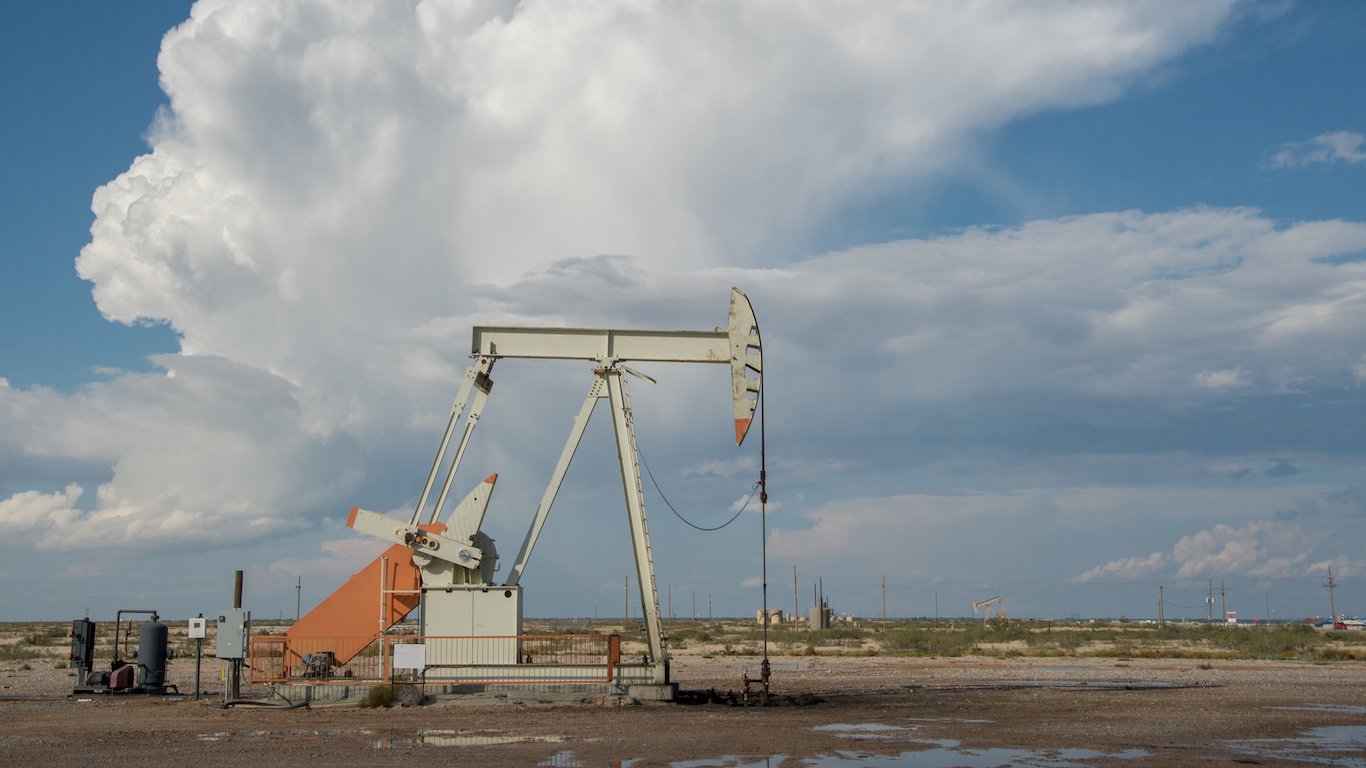
Gas prices are affected by a host of factors. Besides supply and demand, these factors include foreign and domestic oil production, consumption, financial markets, refining capacity, supply chain disruptions, transportation costs, futures speculation, and the value of the U.S. dollar.
24/7 Wall St. reviewed data from the U.S. Energy Information Administration to determine the average cost of a gallon of gas every year since 1929.
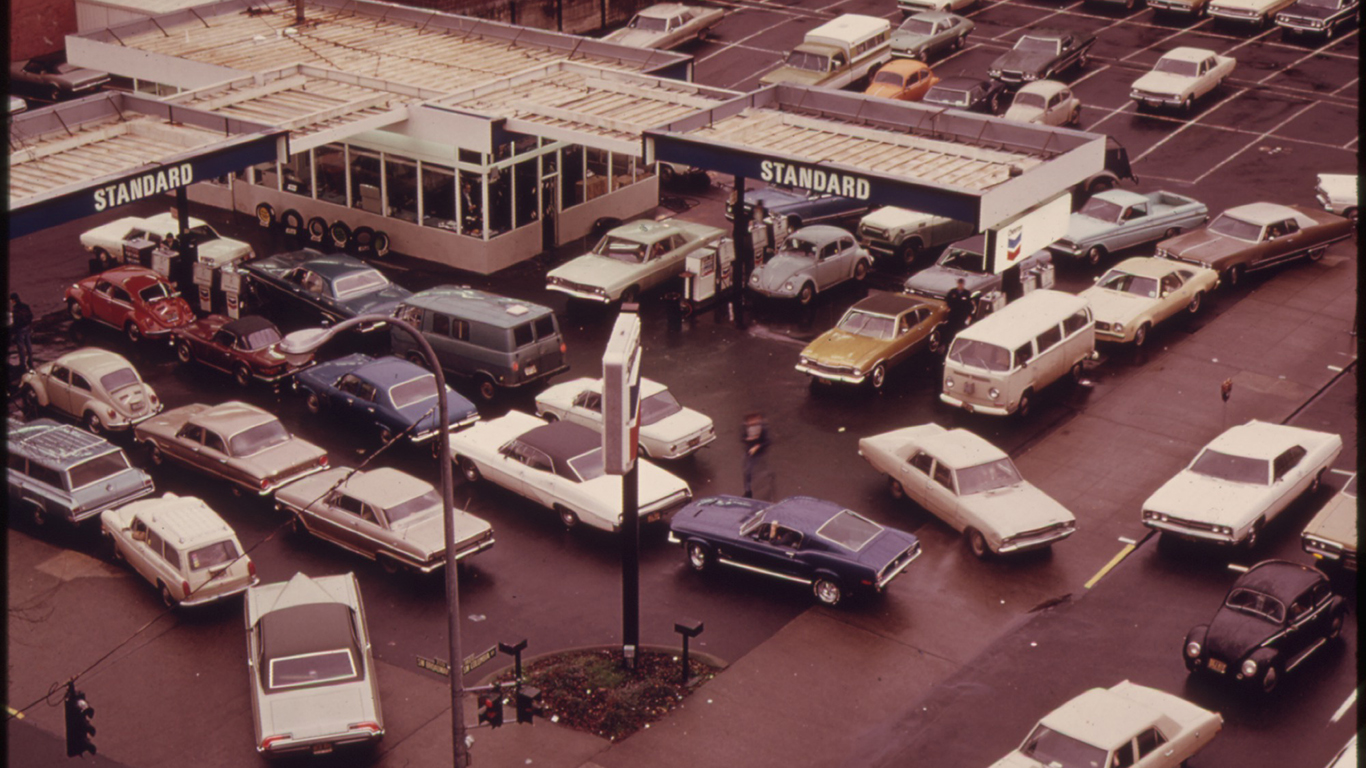
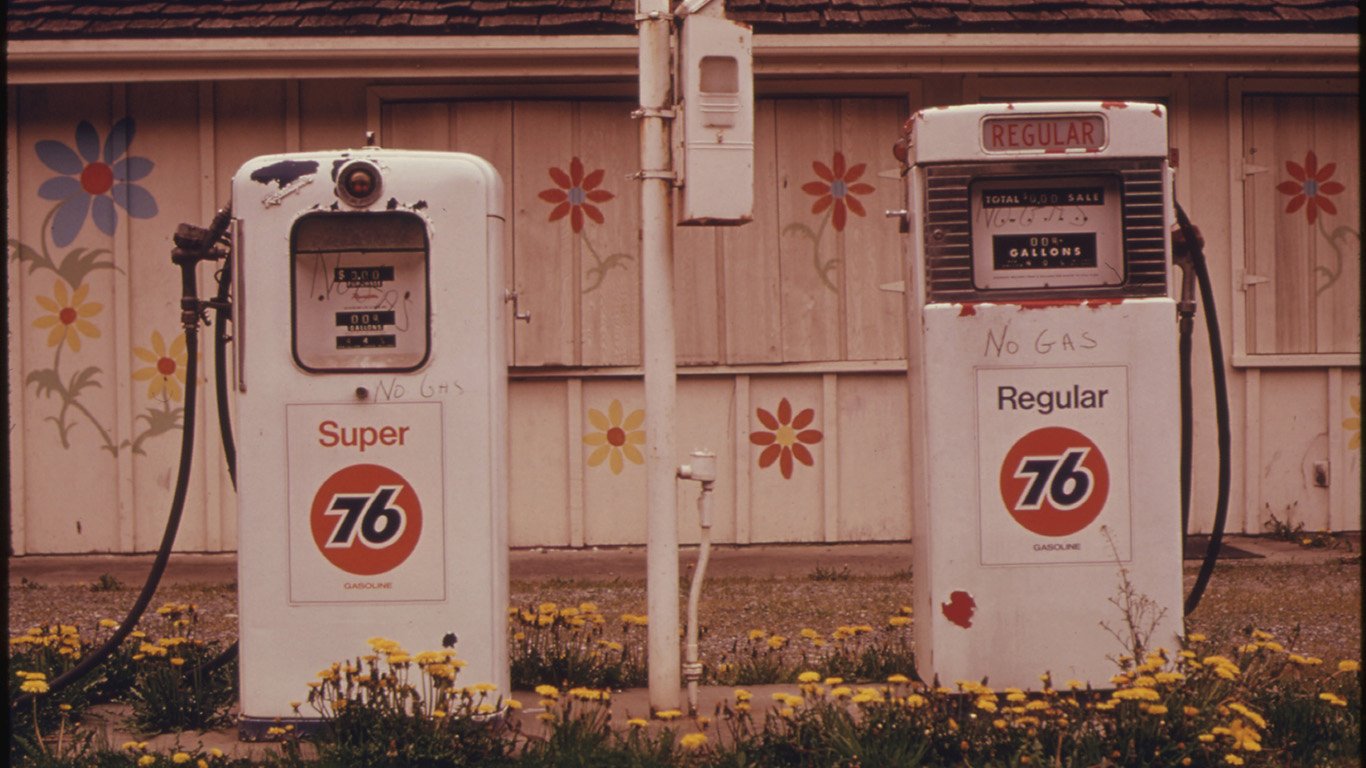
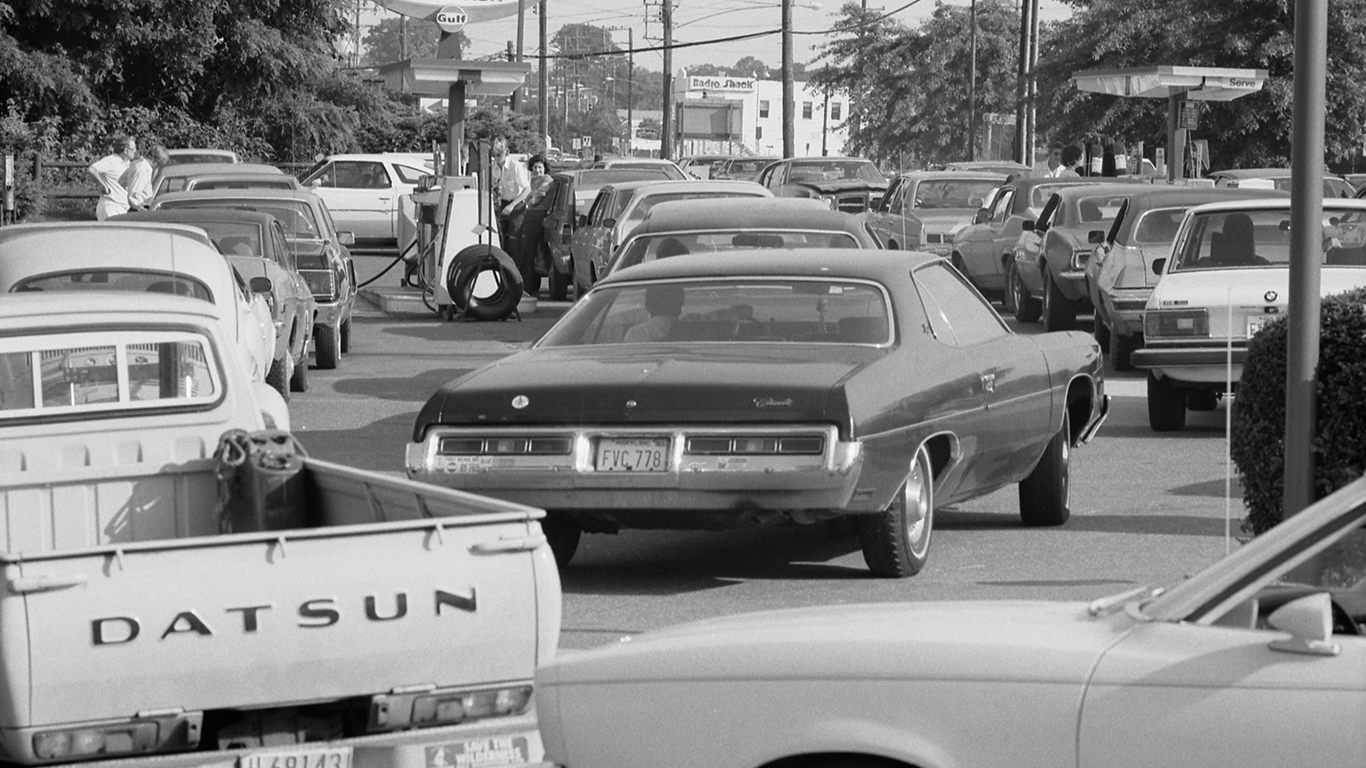
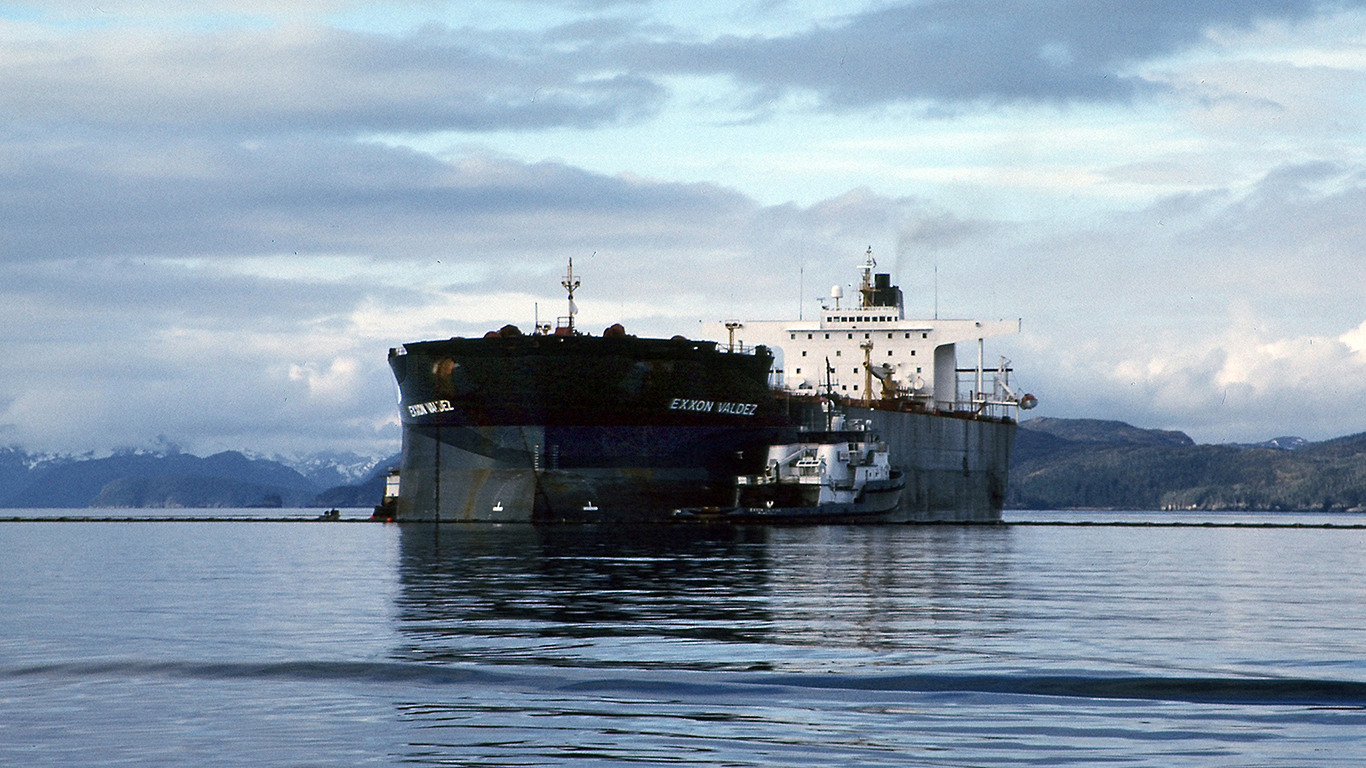
Americans have been roiled by oil-price turbulence in the past, most notably in the early 1970s. The cost of a barrel of oil doubled after OPEC led an oil embargo to retaliate against the United States support of Israel in the Yom Kippur War. Recent attacks by Iran on oil tankers in the Strait of Hormuz — the critical passageway for oil to reach Europe and other destinations — have rattled the energy markets, slightly raising prices of crude. Iran is one of these 15 countries that control the world’s oil.
Even so, we are in a period of relative oil price stability. Crude oil prices in 2018 averaged around $61.40 a barrel, and the price of a gallon of gasoline was $2.74, well below the inflation-adjusted all-time high annual average of $3.94 in 2012. States also impose gasoline taxes, which vary from state to state and affect the average price nationwide. Here are the states with the highest and lowest gas taxes.
Click here to see the cost of gas the year you were born
Click here to read our methodology

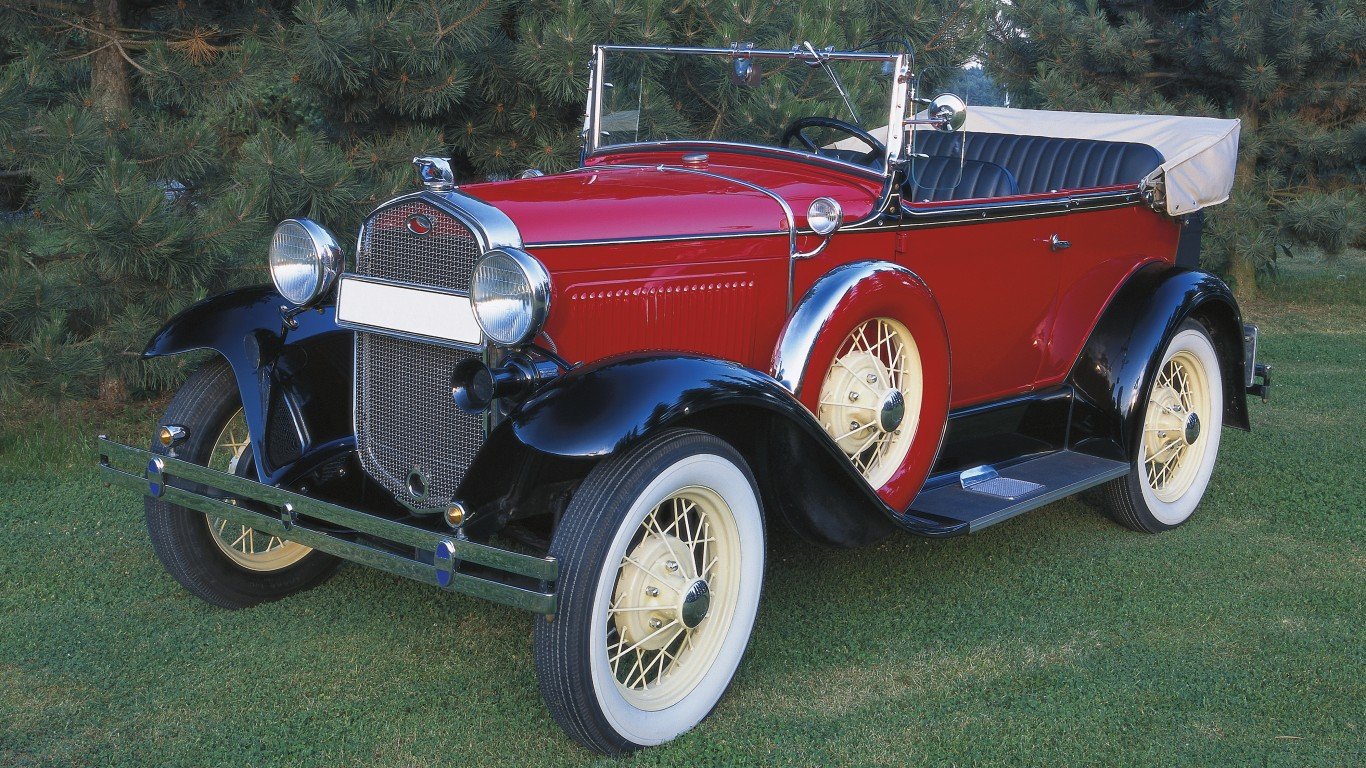
1929
> Price per gallon (inflation adj.): $0.21 ($2.49)
> U.S. oil production: 2.8 million barrels per day
> Price of a barrel of oil (inflation adj.): $1.27 ($14.76)
[in-text-ad]

1930
> Price per gallon (inflation adj.): $0.20 ($2.42)
> U.S. oil production: 2.5 million barrels per day
> Price of a barrel of oil (inflation adj.): $1.19 ($14.44)
1931
> Price per gallon (inflation adj.): $0.17 ($2.31)
> U.S. oil production: 2.3 million barrels per day
> Price of a barrel of oil (inflation adj.): $0.65 ($8.83)

1932
> Price per gallon (inflation adj.): $0.18 ($2.76)
> U.S. oil production: 2.1 million barrels per day
> Price of a barrel of oil (inflation adj.): $0.87 ($13.41)
[recirclink id=548775]
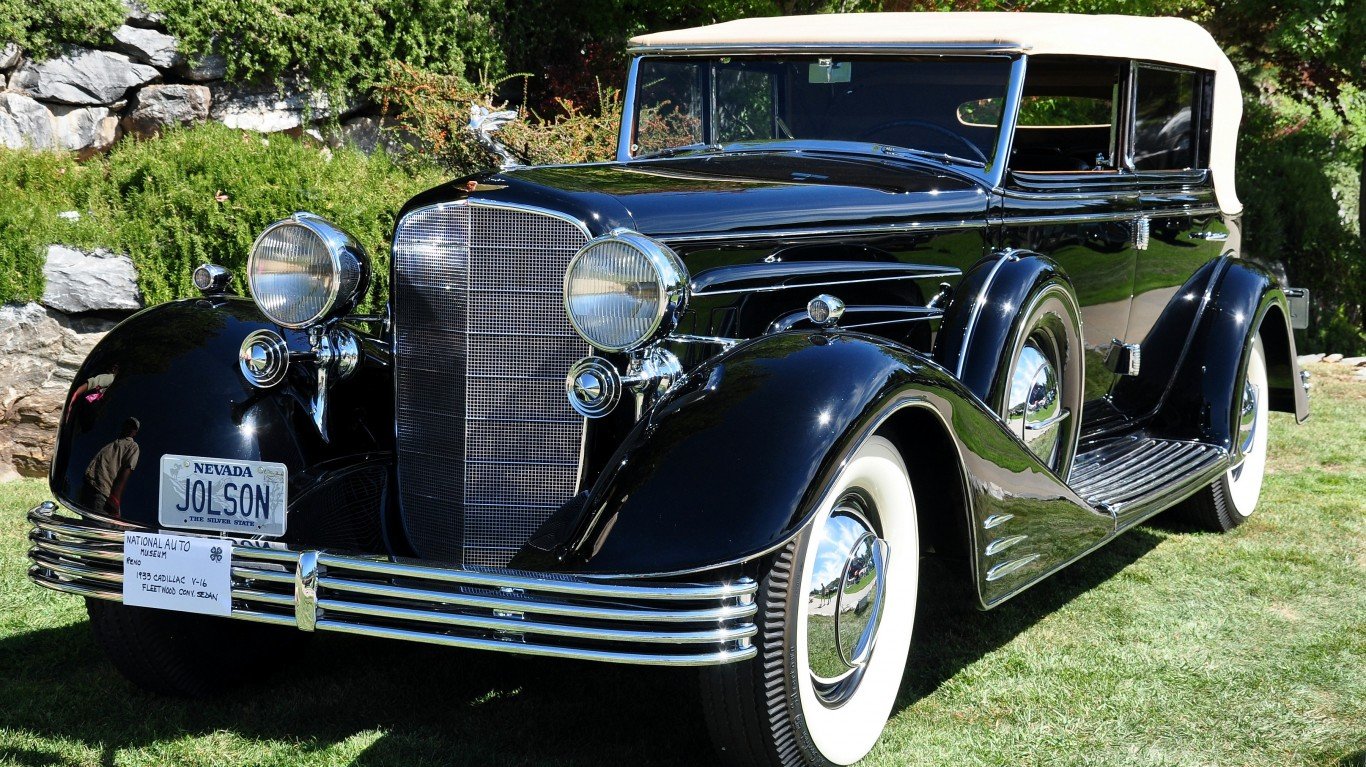
1933
> Price per gallon (inflation adj.): $0.18 ($2.85)
> U.S. oil production: 2.5 million barrels per day
> Price of a barrel of oil (inflation adj.): $0.67 ($10.70)

1934
> Price per gallon (inflation adj.): $0.19 ($2.88)
> U.S. oil production: 2.5 million barrels per day
> Price of a barrel of oil (inflation adj.): $1.00 ($15.28)

1935
> Price per gallon (inflation adj.): $0.19 ($2.81)
> U.S. oil production: 2.7 million barrels per day
> Price of a barrel of oil (inflation adj.): $0.97 ($14.47)
[in-text-ad-2]

1936
> Price per gallon (inflation adj.): $0.19 ($2.87)
> U.S. oil production: 3.0 million barrels per day
> Price of a barrel of oil (inflation adj.): $1.09 ($16.11)

1937
> Price per gallon (inflation adj.): $0.20 ($2.85)
> U.S. oil production: 3.5 million barrels per day
> Price of a barrel of oil (inflation adj.): $1.18 ($16.83)

1938
> Price per gallon (inflation adj.): $0.20 ($2.85)
> U.S. oil production: 3.3 million barrels per day
> Price of a barrel of oil (inflation adj.): $1.13 ($16.49)

1939
> Price per gallon (inflation adj.): $0.19 ($2.76)
> U.S. oil production: 3.5 million barrels per day
> Price of a barrel of oil (inflation adj.): $1.02 ($15.03)
[in-text-ad]

1940
> Price per gallon (inflation adj.): $0.18 ($2.69)
> U.S. oil production: 4.1 million barrels per day
> Price of a barrel of oil (inflation adj.): $1.02 ($14.90)
1941
> Price per gallon (inflation adj.): $0.19 ($2.65)
> U.S. oil production: 3.8 million barrels per day
> Price of a barrel of oil (inflation adj.): $1.14 ($15.68)

1942
> Price per gallon (inflation adj.): $0.20 ($2.50)
> U.S. oil production: 3.8 million barrels per day
> Price of a barrel of oil (inflation adj.): $1.19 ($14.56)
[recirclink id=537241]

1943
> Price per gallon (inflation adj.): $0.21 ($2.30)
> U.S. oil production: 4.1 million barrels per day
> Price of a barrel of oil (inflation adj.): $1.20 ($13.44)
1944
> Price per gallon (inflation adj.): $0.21 ($2.18)
> U.S. oil production: 4.6 million barrels per day
> Price of a barrel of oil (inflation adj.): $1.21 ($12.82)

1945
> Price per gallon (inflation adj.): $0.20 ($2.09)
> U.S. gas consumption: 0.6 billion barrels
> Per capita gas consumption: 173.9 gallons
> U.S. oil production: 4.7 million barrels per day
> Price of a barrel of oil (inflation adj.): $1.22 ($12.43)
[in-text-ad-2]

1946
> Price per gallon (inflation adj.): $0.21 ($1.98)
> U.S. gas consumption: 0.7 billion barrels
> Per capita gas consumption: 214.6 gallons
> U.S. oil production: 4.7 million barrels per day
> Price of a barrel of oil (inflation adj.): $1.41 ($13.43)

1947
> Price per gallon (inflation adj.): $0.23 ($2.00)
> U.S. gas consumption: 0.8 billion barrels
> Per capita gas consumption: 225.4 gallons
> U.S. oil production: 5.1 million barrels per day
> Price of a barrel of oil (inflation adj.): $1.93 ($16.69)

1948
> Price per gallon (inflation adj.): $0.26 ($2.12)
> U.S. gas consumption: 0.8 billion barrels
> Per capita gas consumption: 239.0 gallons
> U.S. oil production: 5.5 million barrels per day
> Price of a barrel of oil (inflation adj.): $2.60 ($21.28)
1949
> Price per gallon (inflation adj.): $0.27 ($2.21)
> U.S. gas consumption: 0.9 billion barrels
> Per capita gas consumption: 247.7 gallons
> U.S. oil production: 5.0 million barrels per day
> Price of a barrel of oil (inflation adj.): $2.54 ($20.95)
[in-text-ad]

1950
> Price per gallon (inflation adj.): $0.27 ($2.18)
> U.S. gas consumption: 1.0 billion barrels
> Per capita gas consumption: 263.3 gallons
> U.S. oil production: 5.4 million barrels per day
> Price of a barrel of oil (inflation adj.): $2.51 ($20.46)
1951
> Price per gallon (inflation adj.): $0.27 ($2.08)
> U.S. gas consumption: 1.1 billion barrels
> Per capita gas consumption: 295.5 gallons
> U.S. oil production: 6.2 million barrels per day
> Price of a barrel of oil (inflation adj.): $2.53 ($19.31)
1952
> Price per gallon (inflation adj.): $0.27 ($2.05)
> U.S. gas consumption: 1.1 billion barrels
> Per capita gas consumption: 288.2 gallons
> U.S. oil production: 6.3 million barrels per day
> Price of a barrel of oil (inflation adj.): $2.53 ($18.92)
[recirclink id=483416]
1953
> Price per gallon (inflation adj.): $0.29 ($2.12)
> U.S. gas consumption: 1.1 billion barrels
> Per capita gas consumption: 297.6 gallons
> U.S. oil production: 6.5 million barrels per day
> Price of a barrel of oil (inflation adj.): $2.68 ($19.78)

1954
> Price per gallon (inflation adj.): $0.29 ($2.12)
> U.S. gas consumption: 1.2 billion barrels
> Per capita gas consumption: 300.3 gallons
> U.S. oil production: 6.3 million barrels per day
> Price of a barrel of oil (inflation adj.): $2.78 ($20.35)
1955
> Price per gallon (inflation adj.): $0.29 ($2.12)
> U.S. gas consumption: 1.3 billion barrels
> Per capita gas consumption: 320.0 gallons
> U.S. oil production: 6.8 million barrels per day
> Price of a barrel of oil (inflation adj.): $2.77 ($20.20)
[in-text-ad-2]

1956
> Price per gallon (inflation adj.): $0.30 ($2.14)
> U.S. gas consumption: 1.3 billion barrels
> Per capita gas consumption: 322.9 gallons
> U.S. oil production: 7.2 million barrels per day
> Price of a barrel of oil (inflation adj.): $2.79 ($19.94)

1957
> Price per gallon (inflation adj.): $0.31 ($2.15)
> U.S. gas consumption: 1.3 billion barrels
> Per capita gas consumption: 322.2 gallons
> U.S. oil production: 7.2 million barrels per day
> Price of a barrel of oil (inflation adj.): $3.09 ($21.44)
1958
> Price per gallon (inflation adj.): $0.30 ($2.06)
> U.S. gas consumption: 1.4 billion barrels
> Per capita gas consumption: 325.3 gallons
> U.S. oil production: 6.7 million barrels per day
> Price of a barrel of oil (inflation adj.): $3.01 ($20.40)
1959
> Price per gallon (inflation adj.): $0.30 ($2.04)
> U.S. gas consumption: 1.4 billion barrels
> Per capita gas consumption: 332.7 gallons
> U.S. oil production: 7.1 million barrels per day
> Price of a barrel of oil (inflation adj.): $2.90 ($19.37)
[in-text-ad]

1960
> Price per gallon (inflation adj.): $0.31 ($2.04)
> U.S. gas consumption: 1.5 billion barrels
> Per capita gas consumption: 337.7 gallons
> U.S. oil production: 7.0 million barrels per day
> Price of a barrel of oil (inflation adj.): $2.88 ($18.92)

1961
> Price per gallon (inflation adj.): $0.31 ($2.00)
> U.S. gas consumption: 1.5 billion barrels
> Per capita gas consumption: 337.4 gallons
> U.S. oil production: 7.2 million barrels per day
> Price of a barrel of oil (inflation adj.): $2.89 ($18.79)

1962
> Price per gallon (inflation adj.): $0.31 ($1.97)
> U.S. gas consumption: 1.5 billion barrels
> Per capita gas consumption: 345.1 gallons
> U.S. oil production: 7.3 million barrels per day
> Price of a barrel of oil (inflation adj.): $2.90 ($18.64)
[recirclink id=553783]

1963
> Price per gallon (inflation adj.): $0.30 ($1.93)
> U.S. gas consumption: 1.6 billion barrels
> Per capita gas consumption: 351.1 gallons
> U.S. oil production: 7.5 million barrels per day
> Price of a barrel of oil (inflation adj.): $2.89 ($18.36)
1964
> Price per gallon (inflation adj.): $0.30 ($1.90)
> U.S. gas consumption: 1.6 billion barrels
> Per capita gas consumption: 352.7 gallons
> U.S. oil production: 7.6 million barrels per day
> Price of a barrel of oil (inflation adj.): $2.88 ($18.03)
1965
> Price per gallon (inflation adj.): $0.31 ($1.93)
> U.S. gas consumption: 1.7 billion barrels
> Per capita gas consumption: 362.3 gallons
> U.S. oil production: 7.8 million barrels per day
> Price of a barrel of oil (inflation adj.): $2.86 ($17.65)
[in-text-ad-2]
1966
> Price per gallon (inflation adj.): $0.32 ($1.93)
> U.S. gas consumption: 1.8 billion barrels
> Per capita gas consumption: 375.0 gallons
> U.S. oil production: 8.3 million barrels per day
> Price of a barrel of oil (inflation adj.): $2.88 ($17.34)
1967
> Price per gallon (inflation adj.): $0.33 ($1.95)
> U.S. gas consumption: 1.8 billion barrels
> Per capita gas consumption: 382.5 gallons
> U.S. oil production: 8.8 million barrels per day
> Price of a barrel of oil (inflation adj.): $2.92 ($17.15)
1968
> Price per gallon (inflation adj.): $0.34 ($1.90)
> U.S. gas consumption: 1.9 billion barrels
> Per capita gas consumption: 402.9 gallons
> U.S. oil production: 9.1 million barrels per day
> Price of a barrel of oil (inflation adj.): $2.94 ($16.61)
1969
> Price per gallon (inflation adj.): $0.35 ($1.88)
> U.S. gas consumption: 2.0 billion barrels
> Per capita gas consumption: 418.0 gallons
> U.S. oil production: 9.2 million barrels per day
> Price of a barrel of oil (inflation adj.): $3.09 ($16.71)
[in-text-ad]
1970
> Price per gallon (inflation adj.): $0.36 ($1.84)
> U.S. gas consumption: 2.1 billion barrels
> Per capita gas consumption: 432.5 gallons
> U.S. oil production: 9.6 million barrels per day
> Price of a barrel of oil (inflation adj.): $3.18 ($16.43)

1971
> Price per gallon (inflation adj.): $0.36 ($1.80)
> U.S. gas consumption: 2.2 billion barrels
> Per capita gas consumption: 444.0 gallons
> U.S. oil production: 9.5 million barrels per day
> Price of a barrel of oil (inflation adj.): $3.39 ($16.80)
1972
> Price per gallon (inflation adj.): $0.36 ($1.73)
> U.S. gas consumption: 2.3 billion barrels
> Per capita gas consumption: 467.0 gallons
> U.S. oil production: 9.4 million barrels per day
> Price of a barrel of oil (inflation adj.): $3.39 ($16.24)
[recirclink id=553714]
1973
> Price per gallon (inflation adj.): $0.39 ($1.76)
> U.S. gas consumption: 2.4 billion barrels
> Per capita gas consumption: 482.8 gallons
> U.S. oil production: 9.2 million barrels per day
> Price of a barrel of oil (inflation adj.): $3.89 ($17.69)
1974
> Price per gallon (inflation adj.): $0.53 ($2.19)
> U.S. gas consumption: 2.4 billion barrels
> Per capita gas consumption: 468.6 gallons
> U.S. oil production: 8.8 million barrels per day
> Price of a barrel of oil (inflation adj.): $6.87 ($28.29)
1975
> Price per gallon (inflation adj.): $0.57 ($2.16)
> U.S. gas consumption: 2.4 billion barrels
> Per capita gas consumption: 473.8 gallons
> U.S. oil production: 8.4 million barrels per day
> Price of a barrel of oil (inflation adj.): $7.67 ($29.16)
[in-text-ad-2]
1976
> Price per gallon (inflation adj.): $0.59 ($2.13)
> U.S. gas consumption: 2.6 billion barrels
> Per capita gas consumption: 491.9 gallons
> U.S. oil production: 8.1 million barrels per day
> Price of a barrel of oil (inflation adj.): $8.19 ($29.52)

1977
> Price per gallon (inflation adj.): $0.62 ($2.10)
> U.S. gas consumption: 2.6 billion barrels
> Per capita gas consumption: 499.6 gallons
> U.S. oil production: 8.2 million barrels per day
> Price of a barrel of oil (inflation adj.): $8.57 ($29.00)
1978
> Price per gallon (inflation adj.): $0.63 ($1.98)
> U.S. gas consumption: 2.7 billion barrels
> Per capita gas consumption: 510.5 gallons
> U.S. oil production: 8.7 million barrels per day
> Price of a barrel of oil (inflation adj.): $9.00 ($28.47)
1979
> Price per gallon (inflation adj.): $0.86 ($2.49)
> U.S. gas consumption: 2.6 billion barrels
> Per capita gas consumption: 479.2 gallons
> U.S. oil production: 8.6 million barrels per day
> Price of a barrel of oil (inflation adj.): $12.64 ($36.72)
[in-text-ad]
1980
> Price per gallon (inflation adj.): $1.19 ($3.12)
> U.S. gas consumption: 2.4 billion barrels
> Per capita gas consumption: 445.0 gallons
> U.S. oil production: 8.6 million barrels per day
> Price of a barrel of oil (inflation adj.): $21.59 ($56.63)
1981
> Price per gallon (inflation adj.): $1.31 ($3.16)
> U.S. gas consumption: 2.4 billion barrels
> Per capita gas consumption: 440.1 gallons
> U.S. oil production: 8.6 million barrels per day
> Price of a barrel of oil (inflation adj.): $31.77 ($76.48)

1982
> Price per gallon (inflation adj.): $1.22 ($2.79)
> U.S. gas consumption: 2.4 billion barrels
> Per capita gas consumption: 437.2 gallons
> U.S. oil production: 8.6 million barrels per day
> Price of a barrel of oil (inflation adj.): $28.52 ($65.04)
[recirclink id=503230]
1983
> Price per gallon (inflation adj.): $1.16 ($2.53)
> U.S. gas consumption: 2.4 billion barrels
> Per capita gas consumption: 434.2 gallons
> U.S. oil production: 8.7 million barrels per day
> Price of a barrel of oil (inflation adj.): $26.19 ($57.29)
1984
> Price per gallon (inflation adj.): $1.13 ($2.38)
> U.S. gas consumption: 2.4 billion barrels
> Per capita gas consumption: 436.2 gallons
> U.S. oil production: 8.9 million barrels per day
> Price of a barrel of oil (inflation adj.): $25.88 ($54.56)
1985
> Price per gallon (inflation adj.): $1.12 ($2.27)
> U.S. gas consumption: 2.5 billion barrels
> Per capita gas consumption: 440.1 gallons
> U.S. oil production: 9.0 million barrels per day
> Price of a barrel of oil (inflation adj.): $24.09 ($49.07)
[in-text-ad-2]

1986
> Price per gallon (inflation adj.): $0.86 ($1.71)
> U.S. gas consumption: 2.6 billion barrels
> Per capita gas consumption: 449.1 gallons
> U.S. oil production: 8.7 million barrels per day
> Price of a barrel of oil (inflation adj.): $12.51 ($24.94)

1987
> Price per gallon (inflation adj.): $0.90 ($1.73)
> U.S. gas consumption: 2.6 billion barrels
> Per capita gas consumption: 455.9 gallons
> U.S. oil production: 8.3 million barrels per day
> Price of a barrel of oil (inflation adj.): $15.40 ($29.78)
1988
> Price per gallon (inflation adj.): $0.90 ($1.68)
> U.S. gas consumption: 2.7 billion barrels
> Per capita gas consumption: 461.3 gallons
> U.S. oil production: 8.1 million barrels per day
> Price of a barrel of oil (inflation adj.): $12.58 ($23.41)
1989
> Price per gallon (inflation adj.): $1.00 ($1.78)
> U.S. gas consumption: 2.7 billion barrels
> Per capita gas consumption: 455.1 gallons
> U.S. oil production: 7.6 million barrels per day
> Price of a barrel of oil (inflation adj.): $15.86 ($28.28)
[in-text-ad]
1990
> Price per gallon (inflation adj.): $1.15 ($1.96)
> U.S. gas consumption: 2.6 billion barrels
> Per capita gas consumption: 444.6 gallons
> U.S. oil production: 7.4 million barrels per day
> Price of a barrel of oil (inflation adj.): $20.03 ($34.22)
1991
> Price per gallon (inflation adj.): $1.14 ($1.88)
> U.S. gas consumption: 2.6 billion barrels
> Per capita gas consumption: 437.0 gallons
> U.S. oil production: 7.4 million barrels per day
> Price of a barrel of oil (inflation adj.): $16.54 ($27.34)

1992
> Price per gallon (inflation adj.): $1.13 ($1.81)
> U.S. gas consumption: 2.7 billion barrels
> Per capita gas consumption: 438.1 gallons
> U.S. oil production: 7.2 million barrels per day
> Price of a barrel of oil (inflation adj.): $15.99 ($25.75)
[recirclink id=544240]
1993
> Price per gallon (inflation adj.): $1.11 ($1.74)
> U.S. gas consumption: 2.7 billion barrels
> Per capita gas consumption: 444.6 gallons
> U.S. oil production: 6.8 million barrels per day
> Price of a barrel of oil (inflation adj.): $14.25 ($22.39)
1994
> Price per gallon (inflation adj.): $1.11 ($1.71)
> U.S. gas consumption: 2.8 billion barrels
> Per capita gas consumption: 447.6 gallons
> U.S. oil production: 6.7 million barrels per day
> Price of a barrel of oil (inflation adj.): $13.19 ($20.30)
1995
> Price per gallon (inflation adj.): $1.15 ($1.73)
> U.S. gas consumption: 2.8 billion barrels
> Per capita gas consumption: 454.3 gallons
> U.S. oil production: 6.6 million barrels per day
> Price of a barrel of oil (inflation adj.): $14.62 ($22.03)
[in-text-ad-2]

1996
> Price per gallon (inflation adj.): $1.23 ($1.82)
> U.S. gas consumption: 2.9 billion barrels
> Per capita gas consumption: 457.3 gallons
> U.S. oil production: 6.5 million barrels per day
> Price of a barrel of oil (inflation adj.): $18.46 ($27.24)
1997
> Price per gallon (inflation adj.): $1.23 ($1.79)
> U.S. gas consumption: 2.9 billion barrels
> Per capita gas consumption: 458.9 gallons
> U.S. oil production: 6.5 million barrels per day
> Price of a barrel of oil (inflation adj.): $17.23 ($24.99)
![]()
1998
> Price per gallon (inflation adj.): $1.06 ($1.52)
> U.S. gas consumption: 3.0 billion barrels
> Per capita gas consumption: 468.2 gallons
> U.S. oil production: 6.3 million barrels per day
> Price of a barrel of oil (inflation adj.): $10.87 ($15.64)
1999
> Price per gallon (inflation adj.): $1.17 ($1.65)
> U.S. gas consumption: 3.1 billion barrels
> Per capita gas consumption: 474.0 gallons
> U.S. oil production: 5.9 million barrels per day
> Price of a barrel of oil (inflation adj.): $15.56 ($22.06)
[in-text-ad]
2000
> Price per gallon (inflation adj.): $1.51 ($2.09)
> U.S. gas consumption: 3.1 billion barrels
> Per capita gas consumption: 461.6 gallons
> U.S. oil production: 5.8 million barrels per day
> Price of a barrel of oil (inflation adj.): $26.72 ($36.96)

2001
> Price per gallon (inflation adj.): $1.46 ($1.98)
> U.S. gas consumption: 3.1 billion barrels
> Per capita gas consumption: 463.2 gallons
> U.S. oil production: 5.8 million barrels per day
> Price of a barrel of oil (inflation adj.): $21.84 ($29.64)
2002
> Price per gallon (inflation adj.): $1.36 ($1.82)
> U.S. gas consumption: 3.2 billion barrels
> Per capita gas consumption: 471.6 gallons
> U.S. oil production: 5.7 million barrels per day
> Price of a barrel of oil (inflation adj.): $22.51 ($30.16)
[recirclink id=548775]

2003
> Price per gallon (inflation adj.): $1.59 ($2.09)
> U.S. gas consumption: 3.3 billion barrels
> Per capita gas consumption: 472.1 gallons
> U.S. oil production: 5.6 million barrels per day
> Price of a barrel of oil (inflation adj.): $27.56 ($36.22)
2004
> Price per gallon (inflation adj.): $1.88 ($2.41)
> U.S. gas consumption: 3.3 billion barrels
> Per capita gas consumption: 478.0 gallons
> U.S. oil production: 5.4 million barrels per day
> Price of a barrel of oil (inflation adj.): $36.77 ($47.15)

2005
> Price per gallon (inflation adj.): $2.30 ($2.86)
> U.S. gas consumption: 3.3 billion barrels
> Per capita gas consumption: 475.1 gallons
> U.S. oil production: 5.2 million barrels per day
> Price of a barrel of oil (inflation adj.): $50.28 ($62.69)
[in-text-ad-2]
2006
> Price per gallon (inflation adj.): $2.59 ($3.14)
> U.S. gas consumption: 3.4 billion barrels
> Per capita gas consumption: 475.4 gallons
> U.S. oil production: 5.1 million barrels per day
> Price of a barrel of oil (inflation adj.): $59.69 ($72.45)

2007
> Price per gallon (inflation adj.): $2.80 ($3.32)
> U.S. gas consumption: 3.4 billion barrels
> Per capita gas consumption: 472.6 gallons
> U.S. oil production: 5.1 million barrels per day
> Price of a barrel of oil (inflation adj.): $66.52 ($78.74)

2008
> Price per gallon (inflation adj.): $3.27 ($3.75)
> U.S. gas consumption: 3.3 billion barrels
> Per capita gas consumption: 454.4 gallons
> U.S. oil production: 5.0 million barrels per day
> Price of a barrel of oil (inflation adj.): $94.04 ($108.07)
2009
> Price per gallon (inflation adj.): $2.35 ($2.70)
> U.S. gas consumption: 3.3 billion barrels
> Per capita gas consumption: 449.6 gallons
> U.S. oil production: 5.3 million barrels per day
> Price of a barrel of oil (inflation adj.): $56.35 ($64.82)
[in-text-ad]

2010
> Price per gallon (inflation adj.): $2.79 ($3.15)
> U.S. gas consumption: 3.3 billion barrels
> Per capita gas consumption: 445.6 gallons
> U.S. oil production: 5.5 million barrels per day
> Price of a barrel of oil (inflation adj.): $74.71 ($84.49)
2011
> Price per gallon (inflation adj.): $3.53 ($3.89)
> U.S. gas consumption: 3.2 billion barrels
> Per capita gas consumption: 430.5 gallons
> U.S. oil production: 5.6 million barrels per day
> Price of a barrel of oil (inflation adj.): $95.73 ($105.58)
[recirclink id=438317]

2012
> Price per gallon (inflation adj.): $3.64 ($3.94)
> U.S. gas consumption: 3.2 billion barrels
> Per capita gas consumption: 424.9 gallons
> U.S. oil production: 6.5 million barrels per day
> Price of a barrel of oil (inflation adj.): $94.52 ($102.30)

2013
> Price per gallon (inflation adj.): $3.53 ($3.77)
> U.S. gas consumption: 3.2 billion barrels
> Per capita gas consumption: 428.4 gallons
> U.S. oil production: 7.5 million barrels per day
> Price of a barrel of oil (inflation adj.): $95.99 ($102.51)
2014
> Price per gallon (inflation adj.): $3.37 ($3.54)
> U.S. gas consumption: 3.3 billion barrels
> Per capita gas consumption: 428.8 gallons
> U.S. oil production: 8.8 million barrels per day
> Price of a barrel of oil (inflation adj.): $87.39 ($91.95)
[in-text-ad-2]
2015
> Price per gallon (inflation adj.): $2.45 ($2.57)
> U.S. gas consumption: 3.4 billion barrels
> Per capita gas consumption: 437.8 gallons
> U.S. oil production: 9.4 million barrels per day
> Price of a barrel of oil (inflation adj.): $44.39 ($46.59)
2016
> Price per gallon (inflation adj.): $2.14 ($2.22)
> U.S. gas consumption: 3.4 billion barrels
> Per capita gas consumption: 442.9 gallons
> U.S. oil production: 8.9 million barrels per day
> Price of a barrel of oil (inflation adj.): $38.29 ($39.76)
2017
> Price per gallon (inflation adj.): $2.41 ($2.46)
> U.S. gas consumption: 3.4 billion barrels
> Per capita gas consumption: 439.7 gallons
> U.S. oil production: 9.4 million barrels per day
> Price of a barrel of oil (inflation adj.): $48.05 ($49.03)
2018
> Price per gallon (inflation adj.): $2.74 ($2.74)
> U.S. gas consumption: N/A
> Per capita gas consumption: N/A
> U.S. oil production: 11.0 million barrels per day
> Price of a barrel of oil (inflation adj.): $61.40
Methodology
To identify the price of gas the year you were born, 24/7 Wall St. reviewed the inflation-adjusted annual average price of a gallon of regular gasoline (leaded pre-1990) from the U.S. Energy Information Administration’s Energy Review.
The average price of a barrel of crude oil and annual gasoline consumption also came from the EIA. Annual U.S. crude oil imports and production also came from the EIA.
Per-capita gas consumption was calculated using population estimates from the U.S. Census Bureau. All inflation-adjusted prices are tied to 2019 dollars.
Contact [email protected] for any questions or corrections.