
[cnxvideo id=”882568″ placement=”ros”]
U.S. annual population growth recently hit its lowest level in 80 years. Even with the recent slowdown, the U.S. population has been growing steadily for years. There are nearly 18.5 million more people living in the United States today than there were in 2010 — a 6.0% increase.
Despite the long-term population growth on a national level, there are areas across the country that are home to fewer people now than in 2010. Even the states with the fastest growing populations include counties experiencing long-term population decline. Here is a list of the fastest growing (and shrinking) states.
Reviewing population change figures from the Census Bureau from April 2010 through July 2018, 24/7 Wall St. identified the fastest shrinking county in each state. County equivalents like parishes and boroughs were also considered. In four states — Delaware, Hawaii, South Dakota, and Washington — no county’s population has declined.
Natural growth — births minus deaths — is the largest source of population growth for the United States as a whole. Immigration from other countries accounts for the rest of the growth. In the fastest shrinking county in each state, however, most of the population decline is due to people moving away at a much faster rate than arriving.
In a written exchange with 24/7 Wall St., William H. Frey, a demographer with the Brookings Institution, pointed to some of the factors that could explain the population decline in many of these counties. “They have fewer economic prospects than other parts of the state and, therefore, are less likely to attract migrants from elsewhere in the state, much less those from other states or immigrants from abroad,” Frey said.
Indeed, economic opportunity is often relatively scarce in the counties on this list. The unemployment rate in the vast majority of these counties is higher than it is statewide. In some counties on this list, the unemployment rate is more than double the national annual unemployment rate of 3.9%. Here is a list of the 50 U.S. counties with the highest unemployment.
The counties on this list also tend to be home to older populations living in rural areas.
Click here to see the fastest shrinking county in every state
Click here to read our methodology

1. Alabama: Macon County
> 2010-2018 population change: -14.0% (21,448 to 18,439)
> 2010-2018 population change, Alabama: +2.3% (4.8 million to 4.9 million)
> 2010-2018 pop. change due to migration: -2,724
> 2018 unemployment: 5.5% (state: 3.9%)
[in-text-ad]

2. Alaska: Kodiak Island Borough
> 2010-2018 population change: -1.9% (13,606 to 13,345)
> 2010-2018 population change, Alaska: +3.8% (710,249 to 737,438)
> 2010-2018 pop. change due to migration: -1,638
> 2018 unemployment: 5.8% (state: 6.6%)
[recirclink id=563869]

3. Arizona: Cochise County
> 2010-2018 population change: -3.5% (131,357 to 126,770)
> 2010-2018 population change, Arizona: +12.2% (6.4 million to 7.2 million)
> 2010-2018 pop. change due to migration: -7,484
> 2018 unemployment: 5.6% (state: 4.8%)

4. Arkansas: Phillips County
> 2010-2018 population change: -17.1% (21,755 to 18,029)
> 2010-2018 population change, Arkansas: +3.4% (2.9 million to 3.0 million)
> 2010-2018 pop. change due to migration: -4,050
> 2018 unemployment: 6.1% (state: 3.7%)
[in-text-ad-2]
5. California: Lassen County
> 2010-2018 population change: -11.7% (34,895 to 30,802)
> 2010-2018 population change, California: +6.2% (37.3 million to 39.6 million)
> 2010-2018 pop. change due to migration: -4,926
> 2018 unemployment: 4.8% (state: 4.2%)

6. Colorado: Las Animas County
> 2010-2018 population change: -6.5% (15,507 to 14,503)
> 2010-2018 population change, Colorado: +13.2% (5.0 million to 5.7 million)
> 2010-2018 pop. change due to migration: -734
> 2018 unemployment: 4.7% (state: 3.3%)
[in-text-ad]

7. Connecticut: Litchfield County
> 2010-2018 population change: -4.6% (189,925 to 181,111)
> 2010-2018 population change, Connecticut: +0.0% (3.6 million to 3.6 million)
> 2010-2018 pop. change due to migration: -6,183
> 2018 unemployment: 3.8% (state: 4.1%)
[recirclink id=560754]

8. Delaware: New Castle County
> 2010-2018 population change: +3.9% (538,479 to 559,335)
> 2010-2018 population change, Delaware: +7.7% (897,934 to 967,171)
> 2010-2018 pop. change due to migration: +4,279
> 2018 unemployment: 3.7% (state: 3.8%)
9. Florida: Taylor County
> 2010-2018 population change: -4.2% (22,571 to 21,623)
> 2010-2018 population change, Florida: +13.3% (18.8 million to 21.3 million)
> 2010-2018 pop. change due to migration: -938
> 2018 unemployment: 3.8% (state: 3.6%)
[in-text-ad-2]
10. Georgia: Macon County
> 2010-2018 population change: -10.9% (14,743 to 13,143)
> 2010-2018 population change, Georgia: +8.6% (9.7 million to 10.5 million)
> 2010-2018 pop. change due to migration: -1,476
> 2018 unemployment: 6.2% (state: 3.9%)

11. Hawaii: Honolulu County
> 2010-2018 population change: +2.8% (953,206 to 980,080)
> 2010-2018 population change, Hawaii: +4.4% (1.4 million to 1.4 million)
> 2010-2018 pop. change due to migration: -19,098
> 2018 unemployment: 2.3% (state: 2.4%)
[in-text-ad]

12. Idaho: Gooding County
> 2010-2018 population change: -1.8% (15,472 to 15,196)
> 2010-2018 population change, Idaho: +11.9% (1.6 million to 1.8 million)
> 2010-2018 pop. change due to migration: -819
> 2018 unemployment: 2.4% (state: 2.8%)
[recirclink id=555564]

13. Illinois: Cass County
> 2010-2018 population change: -10.1% (13,641 to 12,260)
> 2010-2018 population change, Illinois: -0.7% (12.8 million to 12.7 million)
> 2010-2018 pop. change due to migration: -1,630
> 2018 unemployment: 4.5% (state: 4.3%)
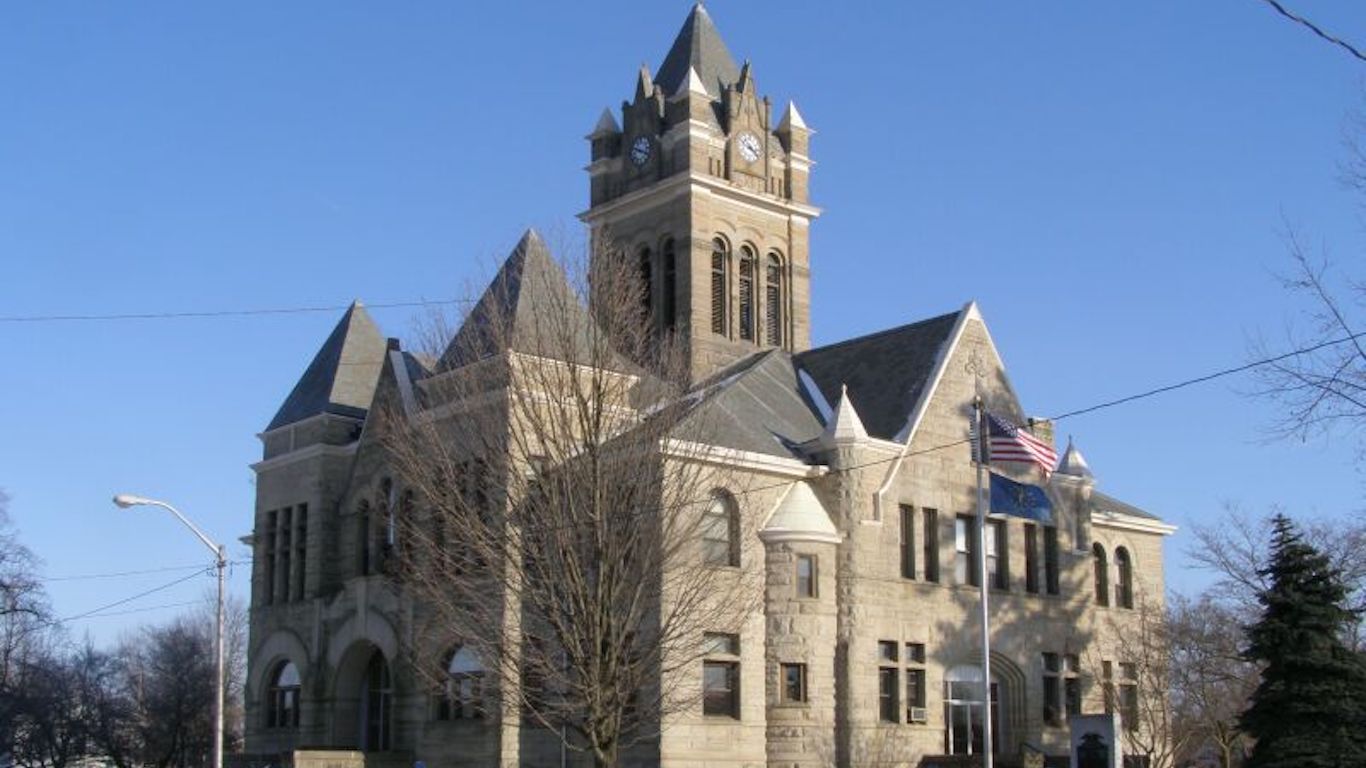
14. Indiana: Pulaski County
> 2010-2018 population change: -6.9% (13,386 to 12,469)
> 2010-2018 population change, Indiana: +3.2% (6.5 million to 6.7 million)
> 2010-2018 pop. change due to migration: -810
> 2018 unemployment: 3.1% (state: 3.4%)
[in-text-ad-2]

15. Iowa: Emmet County
> 2010-2018 population change: -10.2% (10,302 to 9,253)
> 2010-2018 population change, Iowa: +3.6% (3.0 million to 3.2 million)
> 2010-2018 pop. change due to migration: -939
> 2018 unemployment: 2.7% (state: 2.5%)

16. Kansas: Montgomery County
> 2010-2018 population change: -9.4% (35,468 to 32,120)
> 2010-2018 population change, Kansas: +2.0% (2.9 million to 2.9 million)
> 2010-2018 pop. change due to migration: -3,368
> 2018 unemployment: 4.3% (state: 3.4%)
[in-text-ad]
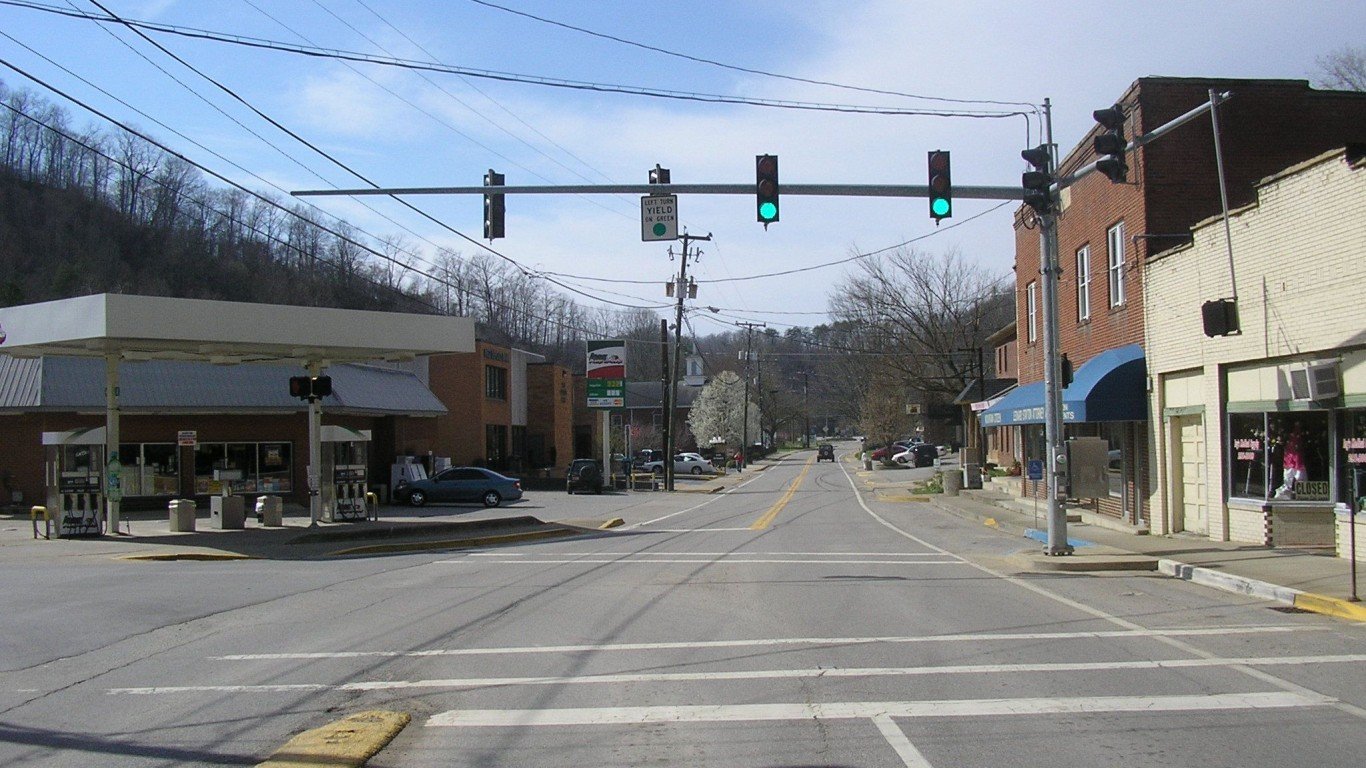
17. Kentucky: Martin County
> 2010-2018 population change: -12.4% (12,929 to 11,323)
> 2010-2018 population change, Kentucky: +3.0% (4.3 million to 4.5 million)
> 2010-2018 pop. change due to migration: -1,535
> 2018 unemployment: 6.5% (state: 4.3%)
[recirclink id=436250]

18. Louisiana: Morehouse Parish
> 2010-2018 population change: -9.2% (27,979 to 25,398)
> 2010-2018 population change, Louisiana: +2.8% (4.5 million to 4.7 million)
> 2010-2018 pop. change due to migration: -2,530
> 2018 unemployment: 8.2% (state: 4.9%)
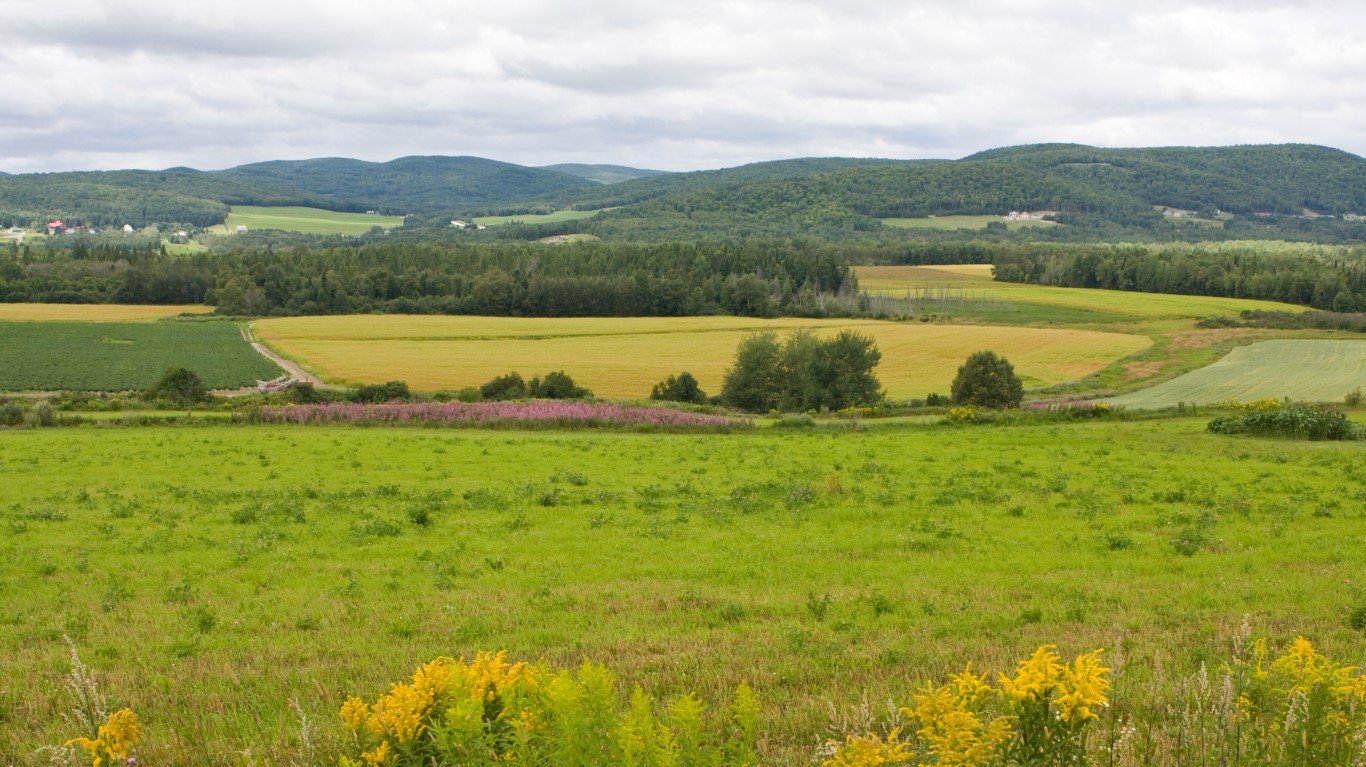
19. Maine: Aroostook County
> 2010-2018 population change: -6.6% (71,873 to 67,111)
> 2010-2018 population change, Maine: +0.8% (1.3 million to 1.3 million)
> 2010-2018 pop. change due to migration: -3,060
> 2018 unemployment: 4.8% (state: 3.4%)
[in-text-ad-2]
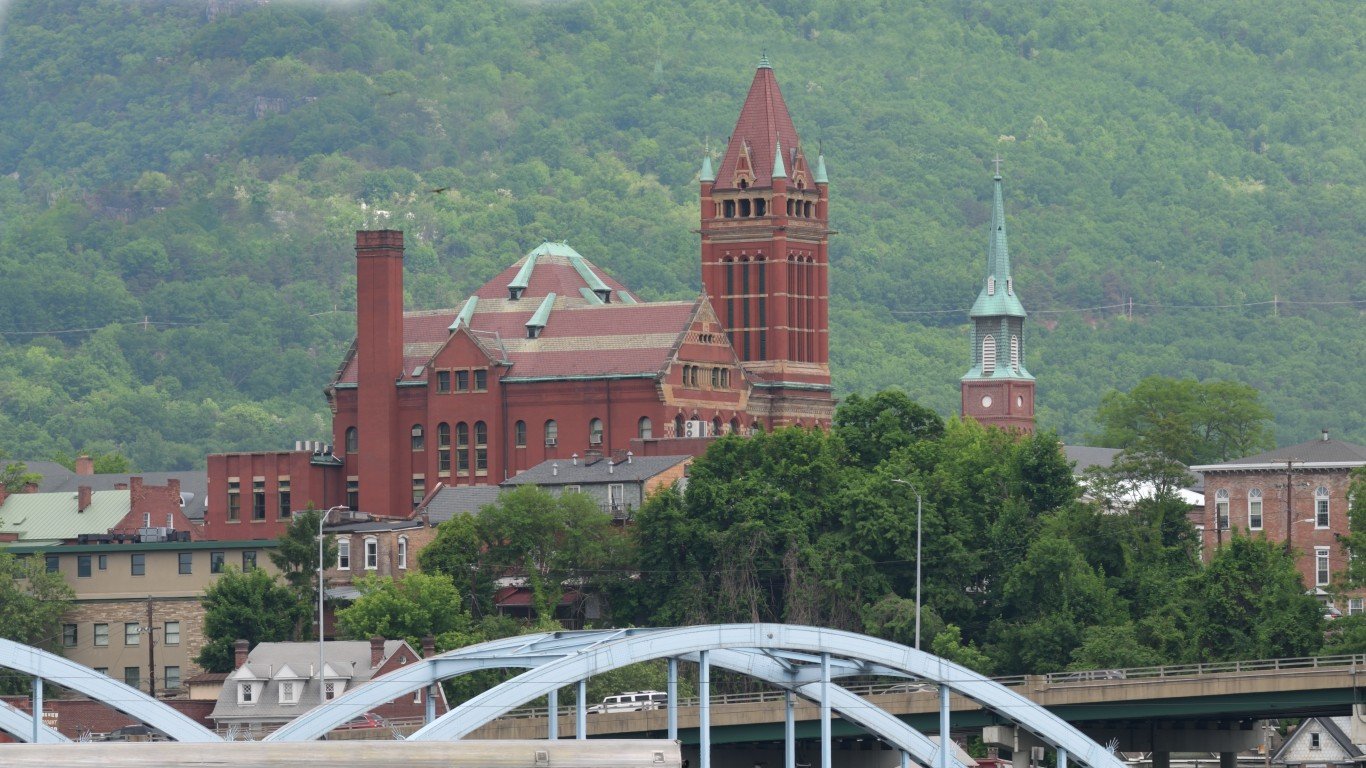
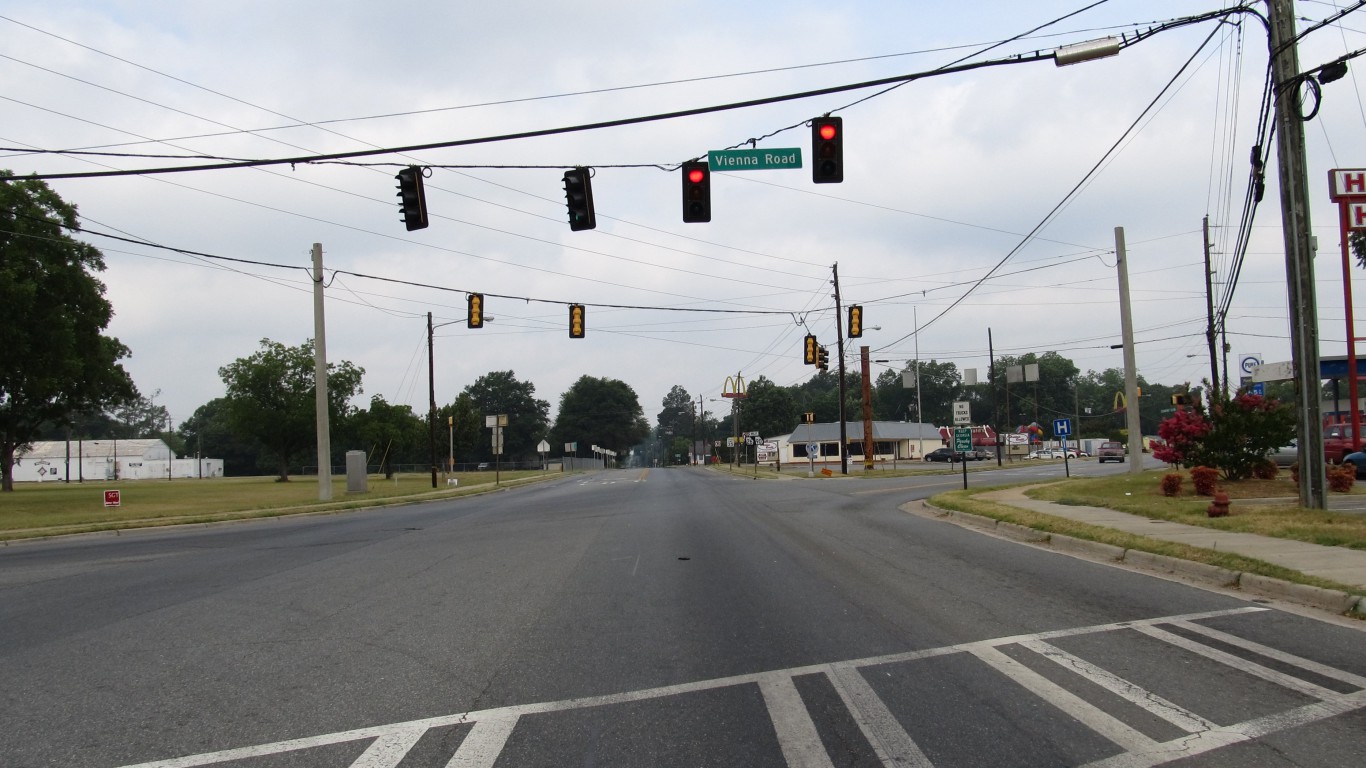
20. Maryland: Allegany County
> 2010-2018 population change: -5.4% (75,047 to 70,975)
> 2010-2018 population change, Maryland: +4.7% (5.8 million to 6.0 million)
> 2010-2018 pop. change due to migration: -2,076
> 2018 unemployment: 5.5% (state: 3.9%)
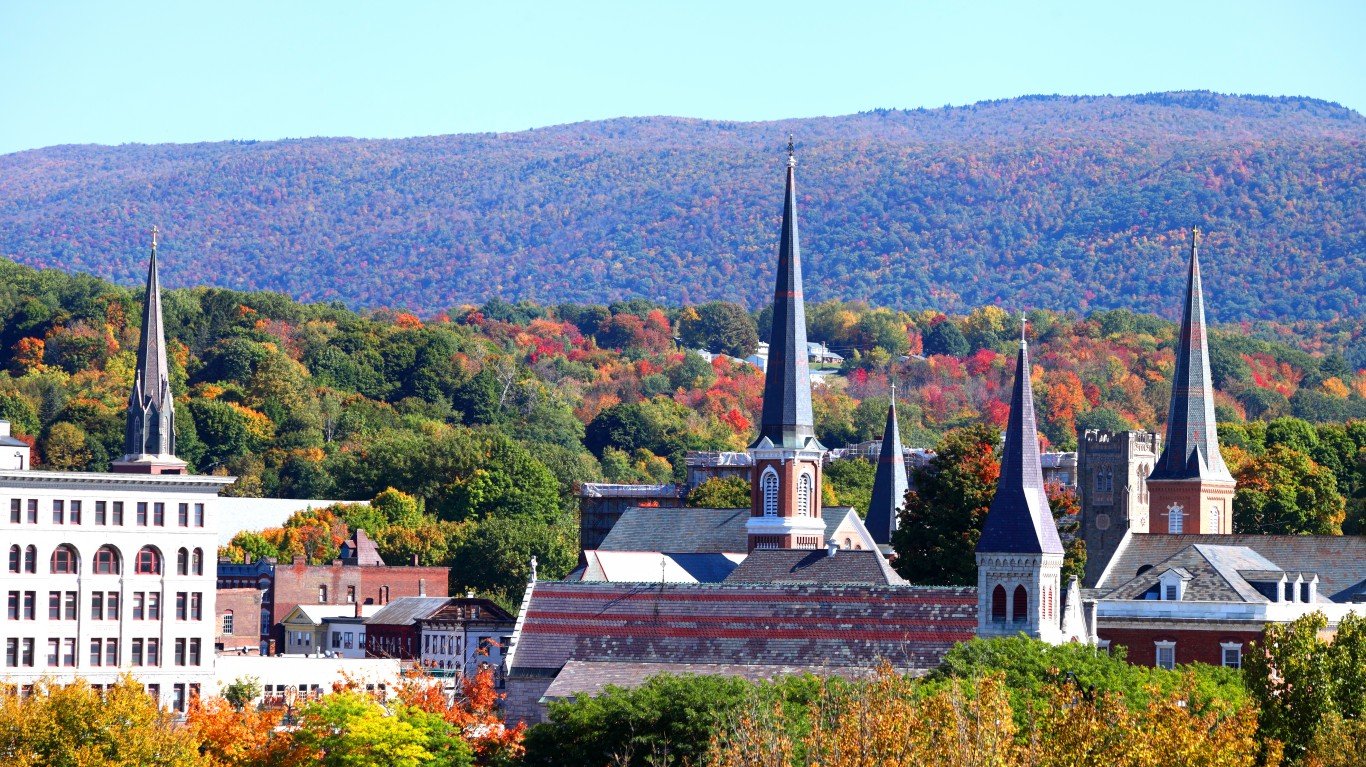
21. Massachusetts: Berkshire County
> 2010-2018 population change: -3.8% (131,275 to 126,348)
> 2010-2018 population change, Massachusetts: +5.4% (6.5 million to 6.9 million)
> 2010-2018 pop. change due to migration: -1,606
> 2018 unemployment: 4.0% (state: 3.3%)
[in-text-ad]

22. Michigan: Gogebic County
> 2010-2018 population change: -8.1% (16,424 to 15,096)
> 2010-2018 population change, Michigan: +1.1% (9.9 million to 10.0 million)
> 2010-2018 pop. change due to migration: -597
> 2018 unemployment: 5.1% (state: 4.1%)
[recirclink id=563869]
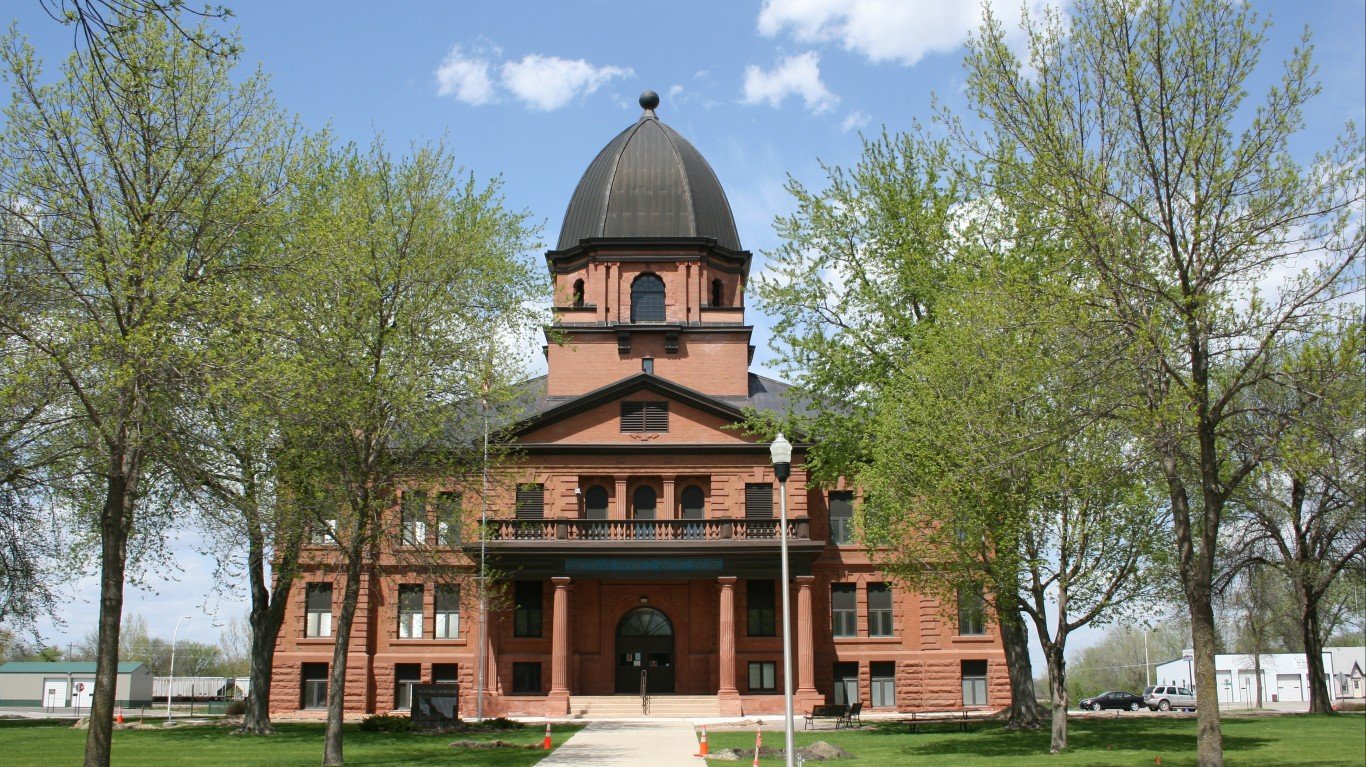
23. Minnesota: Renville County
> 2010-2018 population change: -7.1% (15,728 to 14,612)
> 2010-2018 population change, Minnesota: +5.8% (5.3 million to 5.6 million)
> 2010-2018 pop. change due to migration: -1,068
> 2018 unemployment: 3.9% (state: 2.9%)
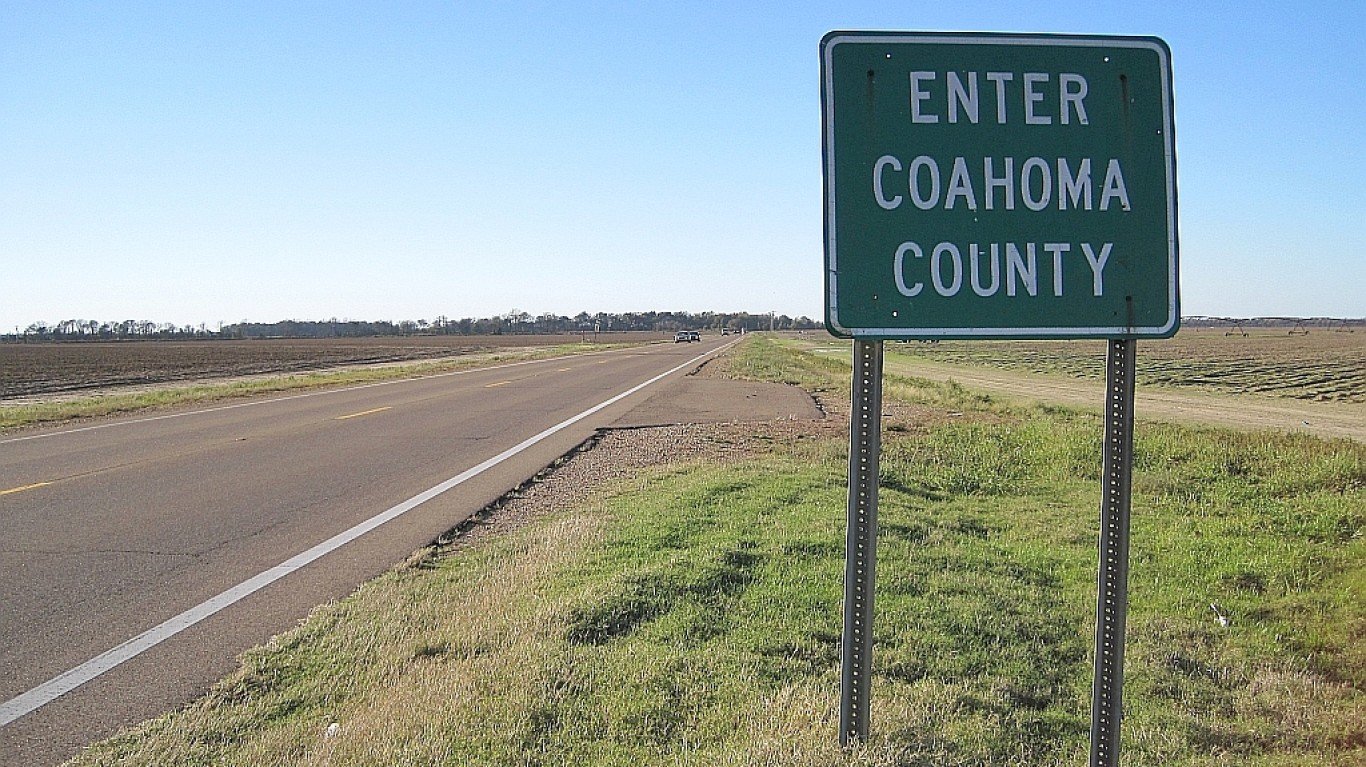
24. Mississippi: Coahoma County
> 2010-2018 population change: -13.5% (26,145 to 22,628)
> 2010-2018 population change, Mississippi: +0.6% (3.0 million to 3.0 million)
> 2010-2018 pop. change due to migration: -4,490
> 2018 unemployment: 6.8% (state: 4.8%)
[in-text-ad-2]

25. Missouri: Pemiscot County
> 2010-2018 population change: -11.1% (18,296 to 16,272)
> 2010-2018 population change, Missouri: +2.3% (6.0 million to 6.1 million)
> 2010-2018 pop. change due to migration: -2,360
> 2018 unemployment: 5.5% (state: 3.2%)

26. Montana: Fergus County
> 2010-2018 population change: -4.1% (11,593 to 11,113)
> 2010-2018 population change, Montana: +7.4% (1.0 million to 1.1 million)
> 2010-2018 pop. change due to migration: -162
> 2018 unemployment: 3.7% (state: 3.7%)
[in-text-ad]

27. Nebraska: Box Butte County
> 2010-2018 population change: -4.7% (11,308 to 10,772)
> 2010-2018 population change, Nebraska: +5.6% (1.8 million to 1.9 million)
> 2010-2018 pop. change due to migration: -832
> 2018 unemployment: 2.8% (state: 2.8%)
[recirclink id=560754]

28. Nevada: White Pine County
> 2010-2018 population change: -5.5% (10,026 to 9,475)
> 2010-2018 population change, Nevada: +12.4% (2.7 million to 3.0 million)
> 2010-2018 pop. change due to migration: -648
> 2018 unemployment: 3.7% (state: 4.6%)

29. New Hampshire: Coos County
> 2010-2018 population change: -4.4% (33,052 to 31,589)
> 2010-2018 population change, New Hampshire: +3.0% (1.3 million to 1.4 million)
> 2010-2018 pop. change due to migration: -12
> 2018 unemployment: 3.2% (state: 2.5%)
[in-text-ad-2]

30. New Jersey: Sussex County
> 2010-2018 population change: -5.4% (148,909 to 140,799)
> 2010-2018 population change, New Jersey: +1.3% (8.8 million to 8.9 million)
> 2010-2018 pop. change due to migration: -8,719
> 2018 unemployment: 4.0% (state: 4.1%)

31. New Mexico: Colfax County
> 2010-2018 population change: -11.9% (13,750 to 12,110)
> 2010-2018 population change, New Mexico: +1.8% (2.1 million to 2.1 million)
> 2010-2018 pop. change due to migration: -1,507
> 2018 unemployment: 4.9% (state: 4.9%)
[in-text-ad]

32. New York: Delaware County
> 2010-2018 population change: -7.2% (47,963 to 44,527)
> 2010-2018 population change, New York: +0.8% (19.4 million to 19.5 million)
> 2010-2018 pop. change due to migration: -2,127
> 2018 unemployment: 4.8% (state: 4.1%)
[recirclink id=555564]

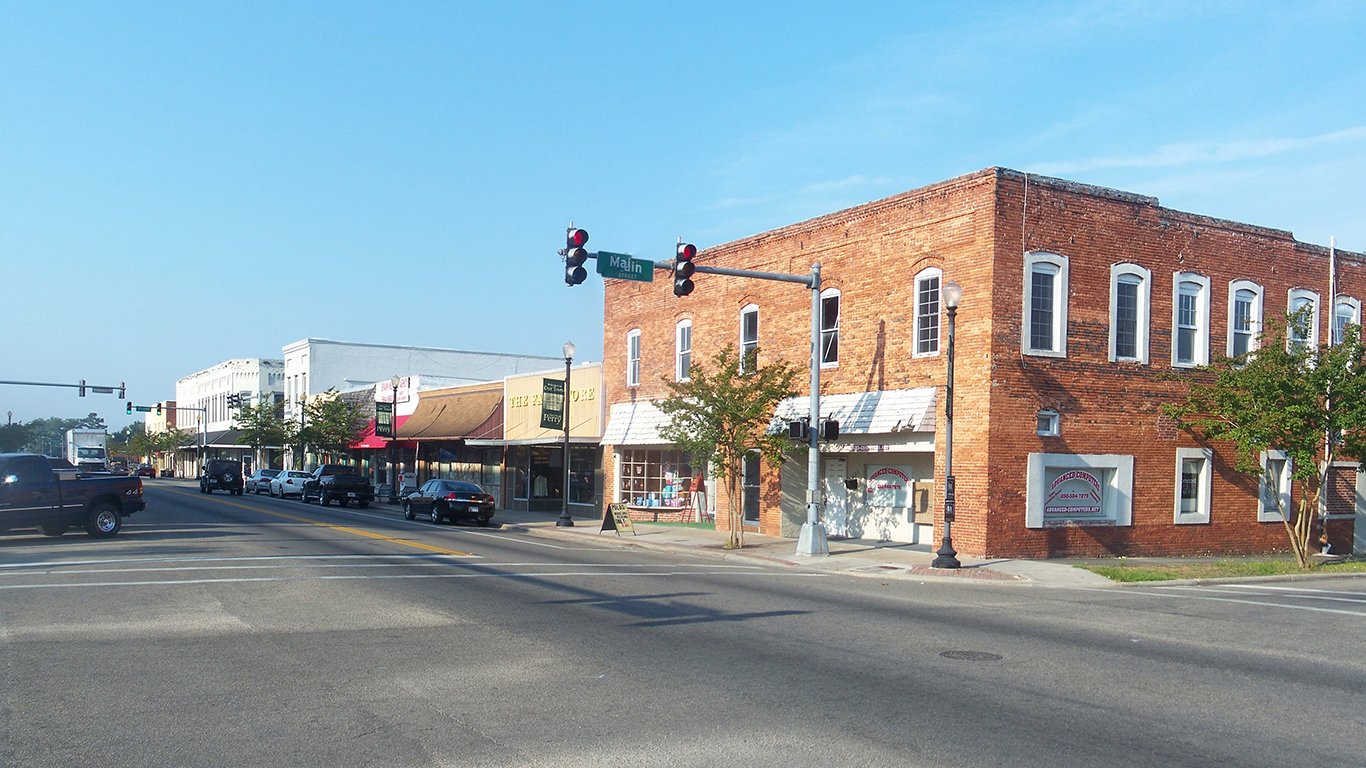
33. North Carolina: Northampton County
> 2010-2018 population change: -11.0% (22,106 to 19,676)
> 2010-2018 population change, North Carolina: +8.9% (9.5 million to 10.4 million)
> 2010-2018 pop. change due to migration: -1,699
> 2018 unemployment: 5.1% (state: 3.9%)

34. North Dakota: Barnes County
> 2010-2018 population change: -4.7% (11,064 to 10,542)
> 2010-2018 population change, North Dakota: +13.0% (672,576 to 760,077)
> 2010-2018 pop. change due to migration: -372
> 2018 unemployment: 2.7% (state: 2.6%)
[in-text-ad-2]

35. Ohio: Carroll County
> 2010-2018 population change: -6.1% (28,835 to 27,081)
> 2010-2018 population change, Ohio: +1.3% (11.5 million to 11.7 million)
> 2010-2018 pop. change due to migration: -1,472
> 2018 unemployment: 5.3% (state: 4.6%)

36. Oklahoma: Blaine County
> 2010-2018 population change: -20.6% (11,942 to 9,485)
> 2010-2018 population change, Oklahoma: +5.1% (3.8 million to 3.9 million)
> 2010-2018 pop. change due to migration: -2,962
> 2018 unemployment: 2.0% (state: 3.4%)
[in-text-ad]

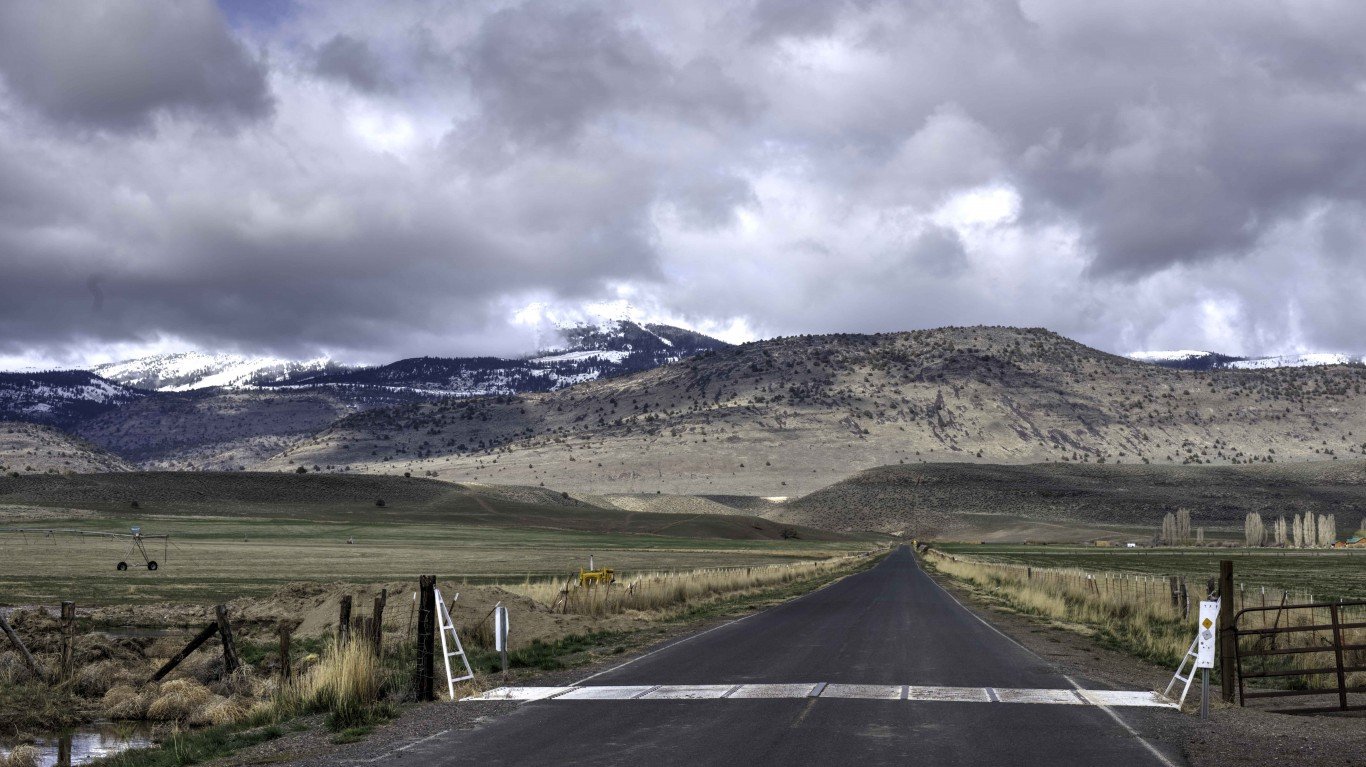
37. Oregon: Malheur County
> 2010-2018 population change: -1.9% (31,316 to 30,725)
> 2010-2018 population change, Oregon: +9.4% (3.8 million to 4.2 million)
> 2010-2018 pop. change due to migration: -1,729
> 2018 unemployment: 4.6% (state: 4.2%)
[recirclink id=436250]

38. Pennsylvania: Cambria County
> 2010-2018 population change: -8.3% (143,681 to 131,730)
> 2010-2018 population change, Pennsylvania: +0.8% (12.7 million to 12.8 million)
> 2010-2018 pop. change due to migration: -7,980
> 2018 unemployment: 5.2% (state: 4.3%)

39. Rhode Island: Bristol County
> 2010-2018 population change: -2.4% (49,847 to 48,649)
> 2010-2018 population change, Rhode Island: +0.4% (1.1 million to 1.1 million)
> 2010-2018 pop. change due to migration: +161
> 2018 unemployment: 3.5% (state: 4.1%)
[in-text-ad-2]

40. South Carolina: Allendale County
> 2010-2018 population change: -14.6% (10,419 to 8,903)
> 2010-2018 population change, South Carolina: +9.9% (4.6 million to 5.1 million)
> 2010-2018 pop. change due to migration: -1,375
> 2018 unemployment: 5.8% (state: 3.4%)

41. South Dakota: Butte County
> 2010-2018 population change: +1.1% (10,112 to 10,222)
> 2010-2018 population change, South Dakota: +8.4% (814,198 to 882,235)
> 2010-2018 pop. change due to migration: -64
> 2018 unemployment: 3.3% (state: 3.0%)
[in-text-ad]
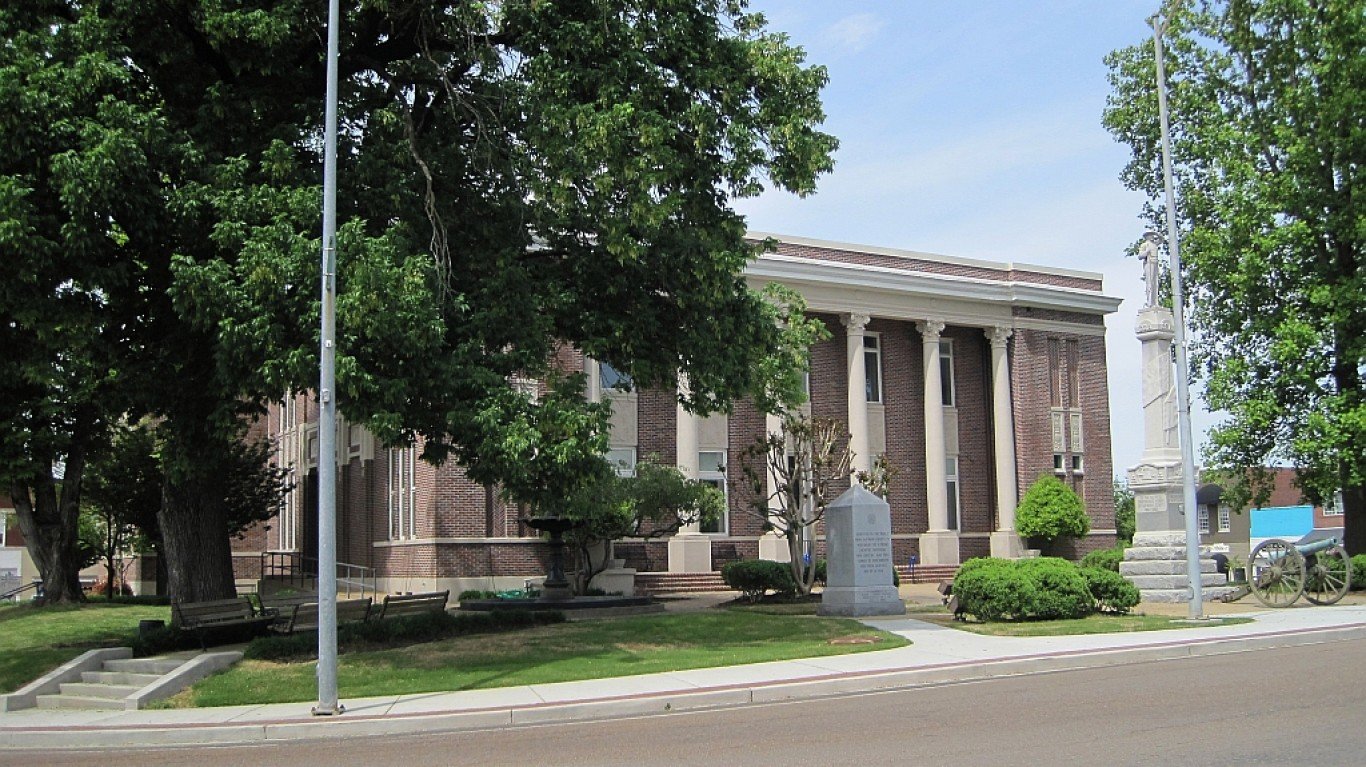
42. Tennessee: Haywood County
> 2010-2018 population change: -7.8% (18,807 to 17,335)
> 2010-2018 population change, Tennessee: +6.7% (6.3 million to 6.8 million)
> 2010-2018 pop. change due to migration: -1,634
> 2018 unemployment: 5.4% (state: 3.5%)
[recirclink id=563869]

43. Texas: Dawson County
> 2010-2018 population change: -8.8% (13,833 to 12,619)
> 2010-2018 population change, Texas: +14.1% (25.1 million to 28.7 million)
> 2010-2018 pop. change due to migration: -1,642
> 2018 unemployment: 4.3% (state: 3.9%)

44. Utah: Emery County
> 2010-2018 population change: -8.8% (10,976 to 10,014)
> 2010-2018 population change, Utah: +14.4% (2.8 million to 3.2 million)
> 2010-2018 pop. change due to migration: -1,436
> 2018 unemployment: 4.8% (state: 3.1%)
[in-text-ad-2]

45. Vermont: Rutland County
> 2010-2018 population change: -4.8% (61,653 to 58,672)
> 2010-2018 population change, Vermont: +0.1% (625,744 to 626,99)
> 2010-2018 pop. change due to migration: -1,836
> 2018 unemployment: 3.1% (state: 2.7%)
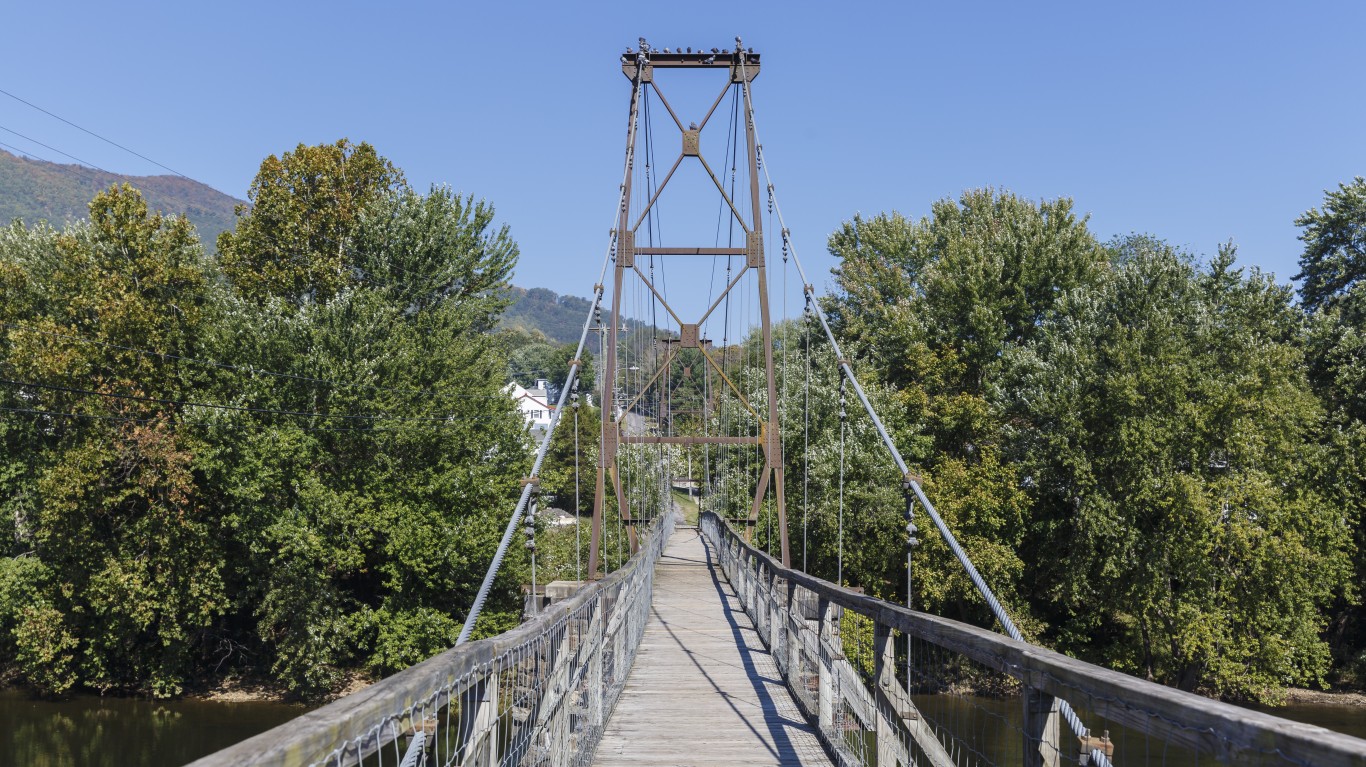
46. Virginia: Buchanan County
> 2010-2018 population change: -11.9% (24,100 to 21,221)
> 2010-2018 population change, Virginia: +6.5% (8.0 million to 8.5 million)
> 2010-2018 pop. change due to migration: -2,015
> 2018 unemployment: 5.5% (state: 3.0%)
[in-text-ad]

47. Washington: Grays Harbor County
> 2010-2018 population change: +1.5% (72,798 to 73,901)
> 2010-2018 population change, Washington: +12.1% (6.7 million to 7.5 million)
> 2010-2018 pop. change due to migration: +1,436
> 2018 unemployment: 6.7% (state: 4.5%)
[recirclink id=560754]
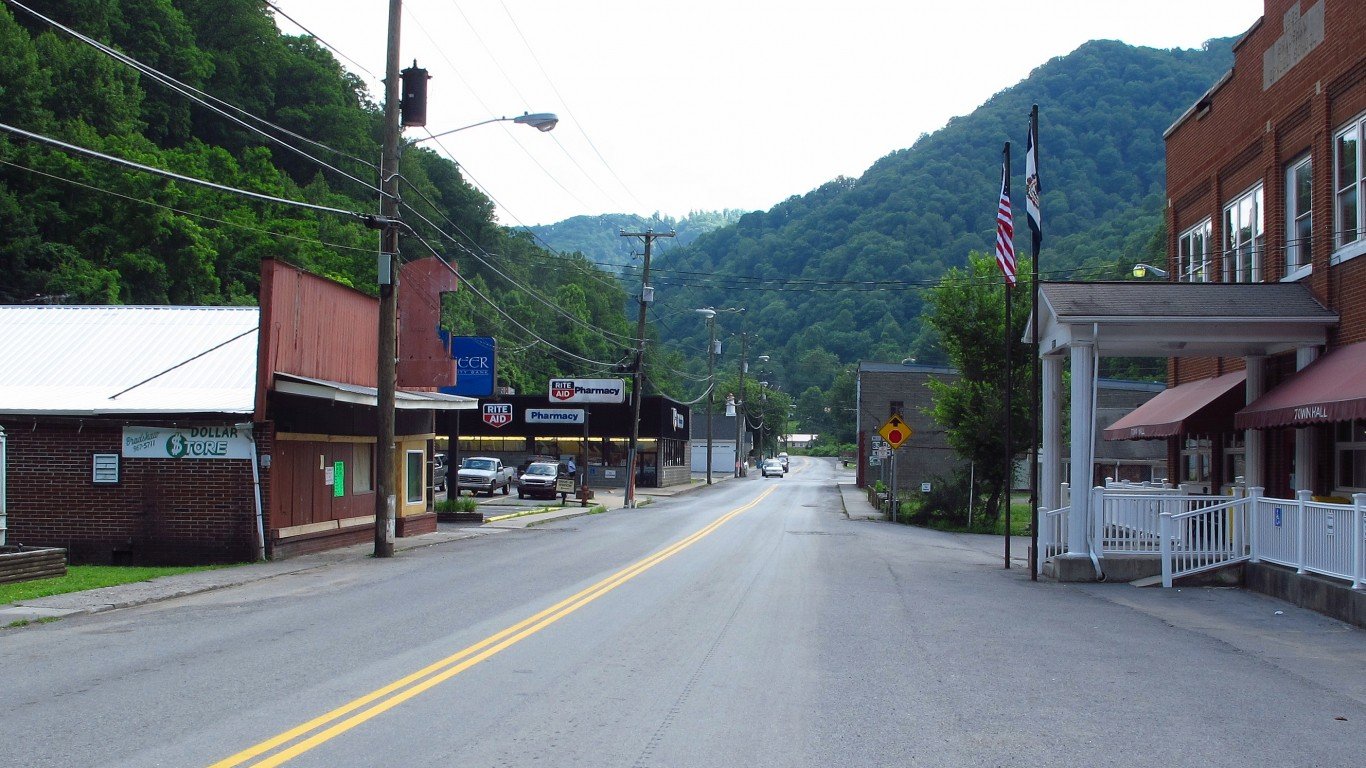
48. West Virginia: McDowell County
> 2010-2018 population change: -17.6% (22,111 to 18,223)
> 2010-2018 population change, West Virginia: -2.5% (1.9 million to 1.8 million)
> 2010-2018 pop. change due to migration: -3,029
> 2018 unemployment: 9.4% (state: 5.3%)
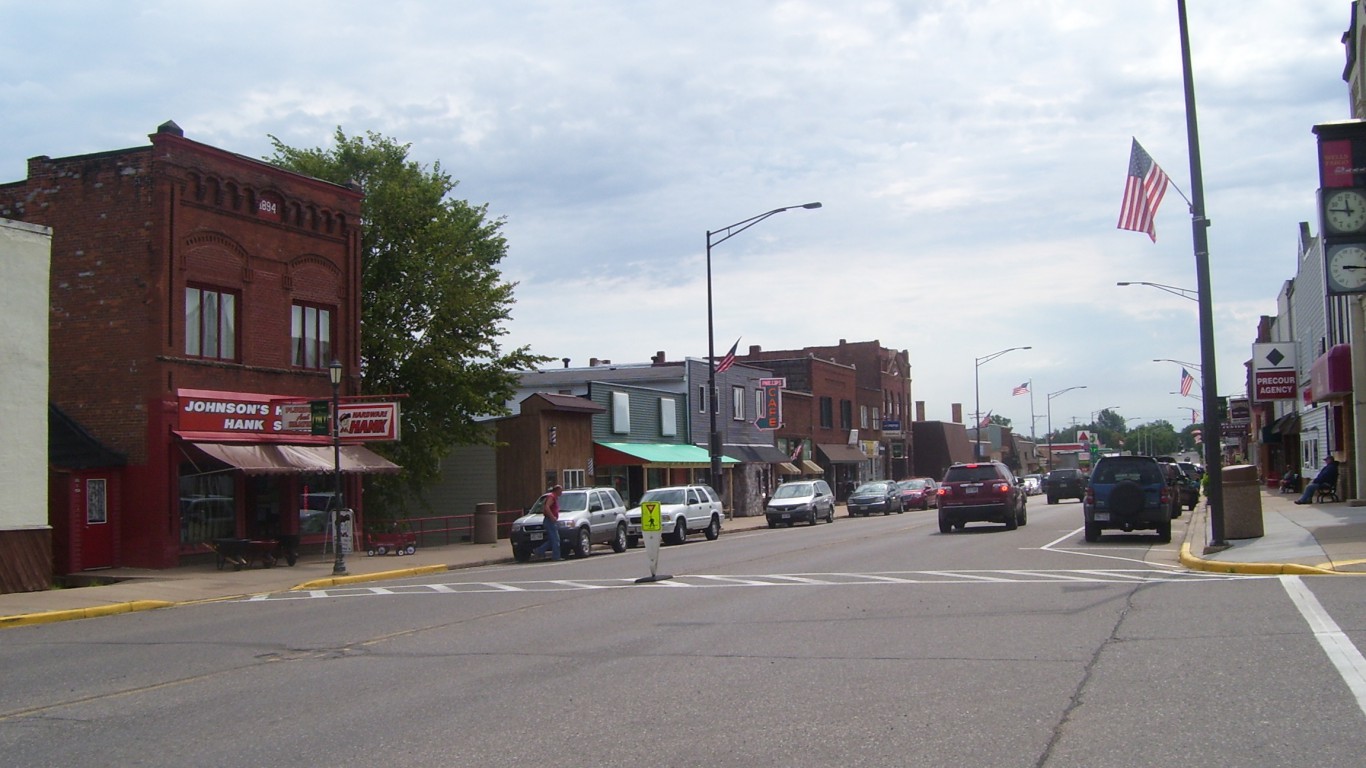
49. Wisconsin: Price County
> 2010-2018 population change: -5.4% (14,159 to 13,397)
> 2010-2018 population change, Wisconsin: +2.2% (5.7 million to 5.8 million)
> 2010-2018 pop. change due to migration: -211
> 2018 unemployment: 3.7% (state: 3.0%)
[in-text-ad-2]
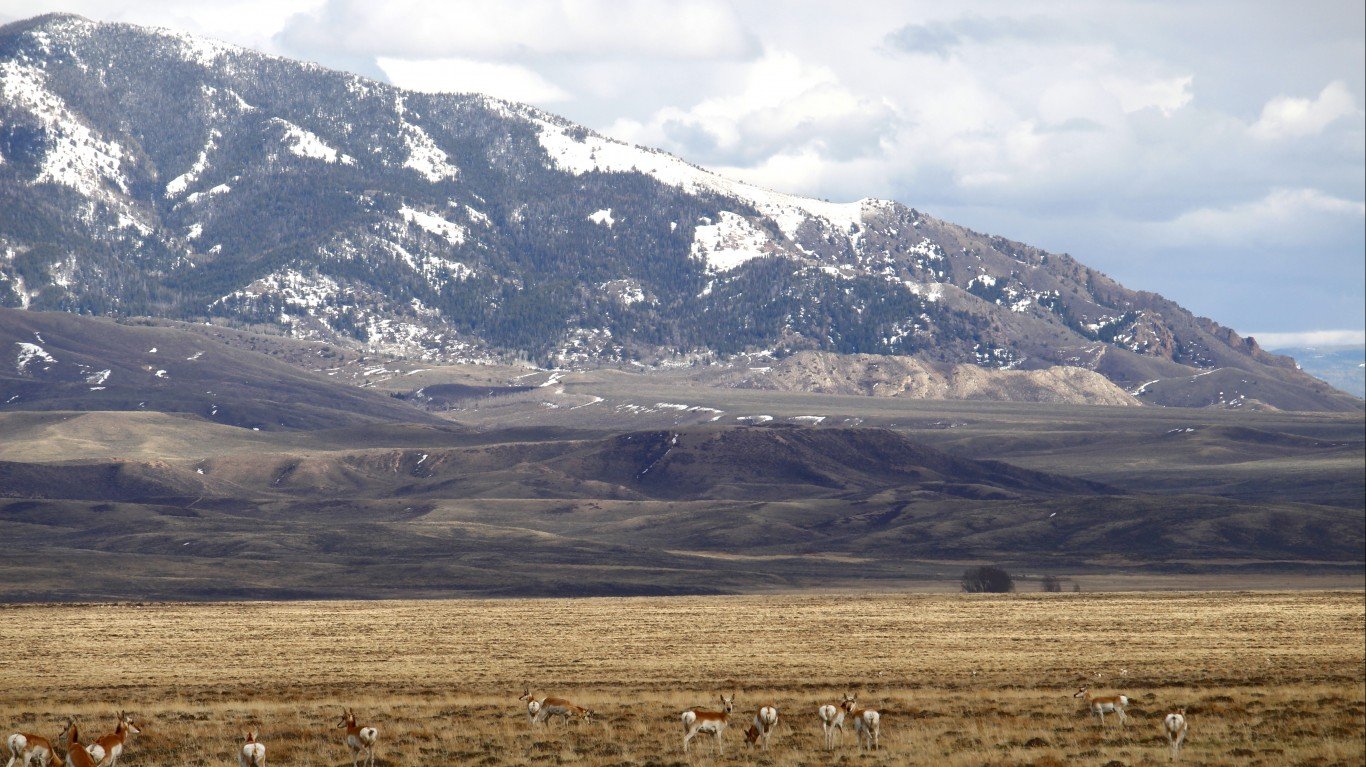
50. Wyoming: Carbon County
> 2010-2018 population change: -5.7% (15,884 to 14,971)
> 2010-2018 population change, Wyoming: +2.5% (563,773 to 577,737)
> 2010-2018 pop. change due to migration: -1,497
> 2018 unemployment: 3.8% (state: 4.1%)
Methodology
To identify the fastest shrinking county in every state, 24/7 Wall St. reviewed the eight-year population estimate change from the U.S Census Bureau’s Annual Estimates of the Resident Population from April 2010-July 2018. Only counties with a base population (from April 2010) greater than 10,000 were considered. If a county had a six-year decline but saw population growth in the final two years of consideration, the county was removed.
Contact [email protected] for any questions or corrections.