[cnxvideo id=”890001″ placement=”ros”]
New home construction in the United States is not keeping pace with demand. The housing vacancy rate fell to 4.4% last year, its lowest level since 1994. The reduction in housing options has put pressure on home prices and rental costs — and in many parts of the country, this has led to a housing affordability crisis for millions of middle and working class Americans.
The U.S. government considers anyone spending 30% or more of their income on housing to be housing cost burdened — meaning they may not have enough money for other necessities. According to “The State of the Nation’s Housing 2019,” a recent report published by the Joint Center for Housing Studies of Harvard University, 28.4% of middle-class households are burdened by housing costs.
24/7 Wall St. reviewed housing cost burden rates in the 100 largest U.S. metropolitan areas to identify the cities where the middle class can no longer afford a home. Nationwide, there are 18 metro areas where over a third of middle-income households — homeowners or renters — are housing cost burdened. For the purposes of this story, middle-class households are those that fall within the $45,000 to $74,999 per year income range — which is roughly in line with the earnings range of the middle 20% of U.S. households — provided by the JCHS.
Many of the cities on this list are home to relatively large shares of wealthy residents. In affluent parts of cities like Washington, D.C., New York, and San Francisco, real estate developers are incentivised to focus on the luxury market, leaving the middle- and low-income markets underserved. As a result, housing is a far greater financial burden than it should be for many in those cities, and parts of some of the cities on this list rank among the worst in the country for housing affordability for the entire population. These are America’s 25 least affordable housing markets.
In several cities on this list, housing has become increasingly unaffordable in recent years as housing costs have risen far faster than incomes. While steady year-over-year growth in home values is generally considered healthy, too much growth too quickly can lead to market instability and could lead to a collapse in the long term. Rapid increases in home value in some cities on this list could be creating the conditions for a housing bubble. Here are a list of cities on the verge of a housing crisis.
The cities where the middle class can no longer afford a home are largely concentrated in California. In many of those California cities, however, private businesses and local governments often step in to improve housing affordability. In San Diego, for example, the city council recently approved a measure that would increase penalties for developers who fail to include affordable housing options in new development projects. Similarly, in the Silicon Valley region, Google recently pledged $1 billion for a housing initiative that includes allocating $250 million in incentives for developers to build 5,000 affordable housing units.
Click here to see the cities where the middle class can no longer afford housing
Click here to read our methodology

18. Hartford-West Hartford-East Hartford, CT
> Cost-burdened middle-class households: 34.3%
> Median home value: $245,000
> Median household income: $71,414
> Homeownership rate: 66.5%
Hartford is one of several metro areas in the Northeastern United States where over a third of middle-class households are burdened by housing costs. The higher than typical share of cost-burdened middle class residents is due in part to the higher housing prices in the area. The typical Hartford home is worth $247,900, and rental costs in the area are about 8.5% more expensive than they are on average nationwide.
Higher-income households in the metro area are far less likely to spend over 30% of their income on housing than the middle class. Just 5.7% of households earning $75,000 or more per year in Hartford are burdened by the cost of housing.
[in-text-ad]

17. Portland-Vancouver-Hillsboro, OR-WA
> Cost-burdened middle-class households: 36.1%
> Median home value: $357,000
> Median household income: $71,931
> Homeownership rate: 63.2%
Housing is far less affordable in the Portland metro area today than it has been in years past. As recently as 2013, the median home price in the area was 4.5 times greater than the median income. As of 2018, the median home price was 5.2 times greater. Real estate prices are outpacing income growth likely due in part to increased demand driven by population growth. Over the same five year period, the number of people living in the metro area increased by 7.1% — far faster than the comparable national population growth of 3.8%.
Currently, 36.1% of middle income earners in Portland are spending more than 30% of their income on housing.
[recirclink id=550418]

16. Denver-Aurora-Lakewood, CO
> Cost-burdened middle-class households: 36.8%
> Median home value: $375,000
> Median household income: $76,643
> Homeownership rate: 64.1%
Denver is one of the fastest growing metro areas in the country. In the last five years, the number of people living in the area climbed from 2.6 million to 2.9 million, a 9.2% growth. The rapid population growth has given way to an increasingly unaffordable real estate market. As of 2018, the median home in the metro area was worth 5.6 times more than the median income. As recently as 2013, the typical Denver home was worth 4.4 times the median income.
Of all middle-class households in the metro area, 31.9% spend between 30% and 50% of their income on housing, and 4.9% spend over half of their income on housing.

15. Stockton-Lodi, CA
> Cost-burdened middle-class households: 38.0%
> Median home value: $349,000
> Median household income: $61,164
> Homeownership rate: 57.0%
Stockton-Lodi is one of eight California metro areas to rank on this list. The typical area home is worth $349,000, well above the national median home value of roughly $200,000. The high housing costs put financial strain on the city’s middle income earners. About 32% of middle-class households spend between 30% and 50% on housing, and nearly 6% spend over half of their income on housing.
As is the case nationwide, renters are more likely to be housing cost burdened than homeowners in Stockton-Lodi. The 56.9% share of renters who spend at least 30% of their income on housing is more than double the comparable 26.6% share of homeowners.
[in-text-ad-2]
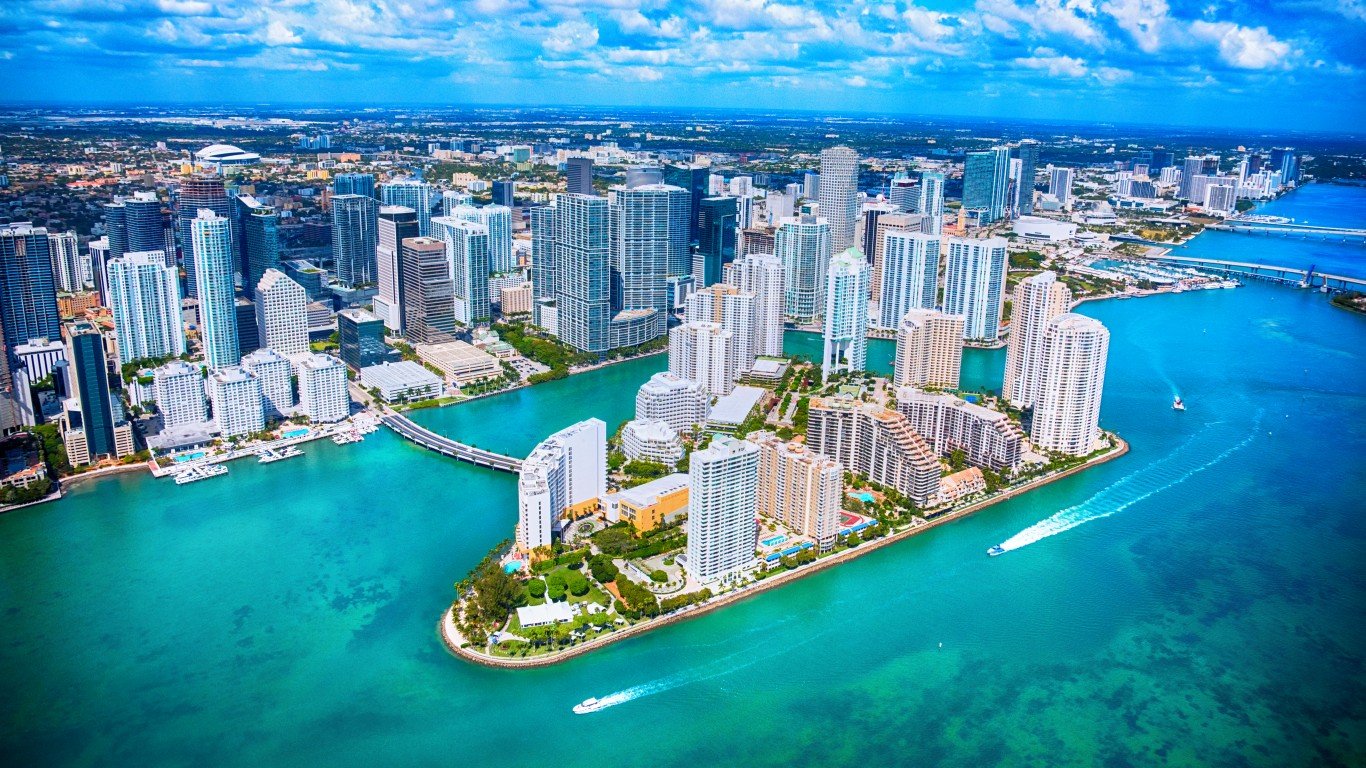
14. Miami-Fort Lauderdale-West Palm Beach, FL
> Cost-burdened middle-class households: 39.5%
> Median home value: $268,000
> Median household income: $54,284
> Homeownership rate: 59.5%
Nearly four in every 10 middle-class households in the Miami metro area spend at least 30% of their income on housing. Renters in the city are more likely to struggle to afford housing than in any other metro areas in the country. Miami’s rental market is 30% more expensive than average nationwide, and partially as a result, 61.1% of renters are housing-cost burdened, the largest share of any major U.S. metro area. Miami is also one of only four metro areas nationwide where more than one in every three homeowners are burdened with relatively high housing costs.

13. Sacramento–Roseville–Arden-Arcade, CA
> Cost-burdened middle-class households: 41.2%
> Median home value: $380,000
> Median household income: $67,902
> Homeownership rate: 60.2%
Sacramento is one of only 13 metro areas nationwide where over 40% of middle-class households spend a larger than recommended share of their income on housing. Of all middle-class households, 7% spend over half of their income on housing.
In the last five years, housing has become far less affordable in the metro area. As recently as 2013, the median home value was 4.1 times greater than the median household income. As of 2018, the typical home in the metro area cost 5.3 times the annual income of the typical household .
[in-text-ad]

12. Seattle-Tacoma-Bellevue, WA
> Cost-burdened middle-class households: 41.6%
> Median home value: $420,000
> Median household income: $82,133
> Homeownership rate: 60.0%
Seattle is one of the fastest growing metro areas in the United States. In the last five years, the number of people living in the area climbed from 3.6 million to 3.9 million. The 8.9% population growth is more than double the national population growth over the same period of 3.8%. The rapidly growing population has driven up demand for housing and likely contributed to reduced housing affordability. The typical area home is worth nearly six times the median income in the area, when as recently as 2013, the typical home was worth five times the median income.
Currently, over 40% of middle-income households in the metro area spend at least 30% of their income on housing, a larger share than in all but 11 other major metro areas.
[recirclink id=545465]
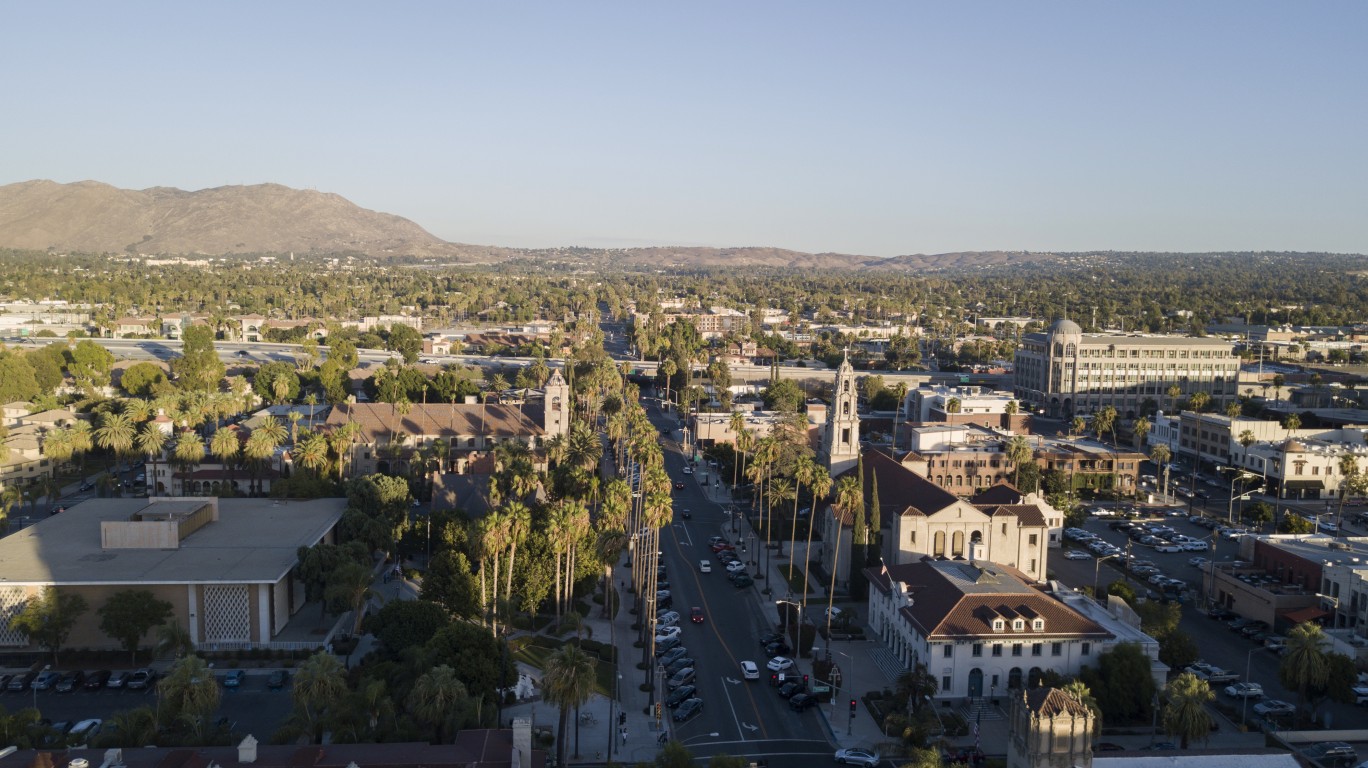
11. Riverside-San Bernardino-Ontario, CA
> Cost-burdened middle-class households: 43.3%
> Median home value: $330,000
> Median household income: $61,994
> Homeownership rate: 63.0%
The Riverside metro area is one of several in California metros where the middle-class is being squeezed financially by an expensive housing market. The typical metro area home costs about 5.6 times as much as the median income in the metro area, well above the 4.1 ratio nationwide. The disproportionately high housing prices put a considerable cost burden on the area’s middle-class residents. Of metro area households earning between $45,000 to $74,999 annually, 43.3% spend at least 30% of their income on housing. Nationwide, 28.4% of middle-income earners are similarly burdened by housing costs.

10. Boston-Cambridge-Newton, MA-NH
> Cost-burdened middle-class households: 45.2%
> Median home value: $410,000
> Median household income: $85,691
> Homeownership rate: 61.8%
Boston is one of the most expensive real estate markets in the country. The typical area home is worth $410,000, more than double the $200,000 value of the typical American home. The high real estate prices make it a tough market for middle-income earners. Of all metro area households earning $45,000 to $74,999 annually, 10% spend over half of their income on housing, and 45.2% spend 30% or more of their income.
The city of Boston offers its lower-income residents a range of options to improve housing affordability, including subsidized rentals and housing vouchers. Earlier this year, Boston mayor Marty Walsh approved $26 million to be put toward hundreds of affordable housing units in neighborhoods across the city. Still, nearly 68% of households in the $30,000 to $44,999 income bracket are unduly burdened by housing costs.
[in-text-ad-2]

9. New York-Newark-Jersey City, NY-NJ-PA
> Cost-burdened middle-class households: 50.0%
> Median home value: $415,000
> Median household income: $75,368
> Homeownership rate: 51.8%
The New York metro area is one of the most expensive real estate markets in the country. Housing rental prices in the area are 53.1% more expensive than they are nationwide, on average. Additionally, the typical home in the area is worth $415,000, more than double the $200,000 value of the typical American home. Throughout the metro area across all income brackets, one in every three homeowners and just over half of all renters spend over 30% of their income on housing.
New York’s middle class is especially burdened by the area’s high housing costs. Of all area households earning $45,000 to $74,999 annually, 13.6% spend over half of their income on housing, and 50.0% spend 30% or more of their income.

8. Washington-Arlington-Alexandria, DC-VA-MD-WV
> Cost-burdened middle-class households: 51.3%
> Median home value: $400,000
> Median household income: $99,669
> Homeownership rate: 63.6%
Washington D.C. is one of only eight major U.S. metro areas where over half of all households earning between $45,000 and $74,999 annually spend at least 30% of their income on housing.
Washington is one of the fastest growing metro areas in the country population-wise, and growing demand is driving up housing costs. In the last five years, the number of people living in the region climbed by 7.1%, well above the 3.8% national population growth. The lack of affordable housing for middle- and low-income residents is partially is also attributable to the high demand for luxury rentals, fueled by the city’s relatively large high-income population. Over 17% of households in the D.C. metro area earn $200,000 or more per year, well more than double the comparable 6.9% share of households nationwide.
[in-text-ad]

7. Urban Honolulu, HI
> Cost-burdened middle-class households: 52.8%
> Median home value: $650,000
> Median household income: $81,284
> Homeownership rate: 56.4%
Honolulu has some of the most expensive real estate in the country. The typical area home is worth $650,000, more than triple the median home value across the U.S. as a whole of $200,000. Additionally, the cost of renting in the metro area is about 77% more expensive than it is on average nationwide. As a result, the city’s middle income earners are unduly burdened by housing costs. Of area households earning between $45,000 and $74,999 annually, 52.8% spend at least 30% of their income on housing, and a staggering 21.5% spend over half of their income on housing.
[recirclink id=553985]

6. San Diego-Carlsbad, CA
> Cost-burdened middle-class households: 53.2%
> Median home value: $545,000
> Median household income: $76,207
> Homeownership rate: 53.5%
San Diego is one of the least affordable housing markets in the United States. The typical home is worth eight times as much as the median income in the metro area, nearly double the comparable ratio nationwide. Low- and middle-income residents of the metro area are disproportionately affected by the high housing costs. Nearly three in every four households in the $30,000 to $44,999 income range spend at least 30% of their income on housing, as do 53.2% of all households earning $45,000 to $74,999 annually.
Late last month, the San Diego City Council narrowly approved an update to the city’s inclusionary housing policy. Under the new terms, developers who fail to include affordable housing in new housing projects will face steeper fees.

5. Los Angeles-Long Beach-Anaheim, CA
> Cost-burdened middle-class households: 53.2%
> Median home value: $600,000
> Median household income: $69,992
> Homeownership rate: 48.4%
Housing in Los Angeles is among the most expensive in the country. The typical home in the metro area is worth $600,000, triple the median home value across the U.S. as a whole of $200,000, and rental costs are about 66% higher on average than they are nationwide. As a result, area residents are far more likely to be squeezed financially by housing costs than most Americans. Nearly 46% of all metro area households spend over 30% of their income on housing compared to about 31% of households nationwide.
Los Angeles’s middle class is even more likely to be burdened by housing costs than the city’s population as a whole. Of metro area households earning between $45,000 and $74,999 annually, 53.2% spend over 30% of their income on housing, and 13.6% spend over half of their income on housing.
[in-text-ad-2]
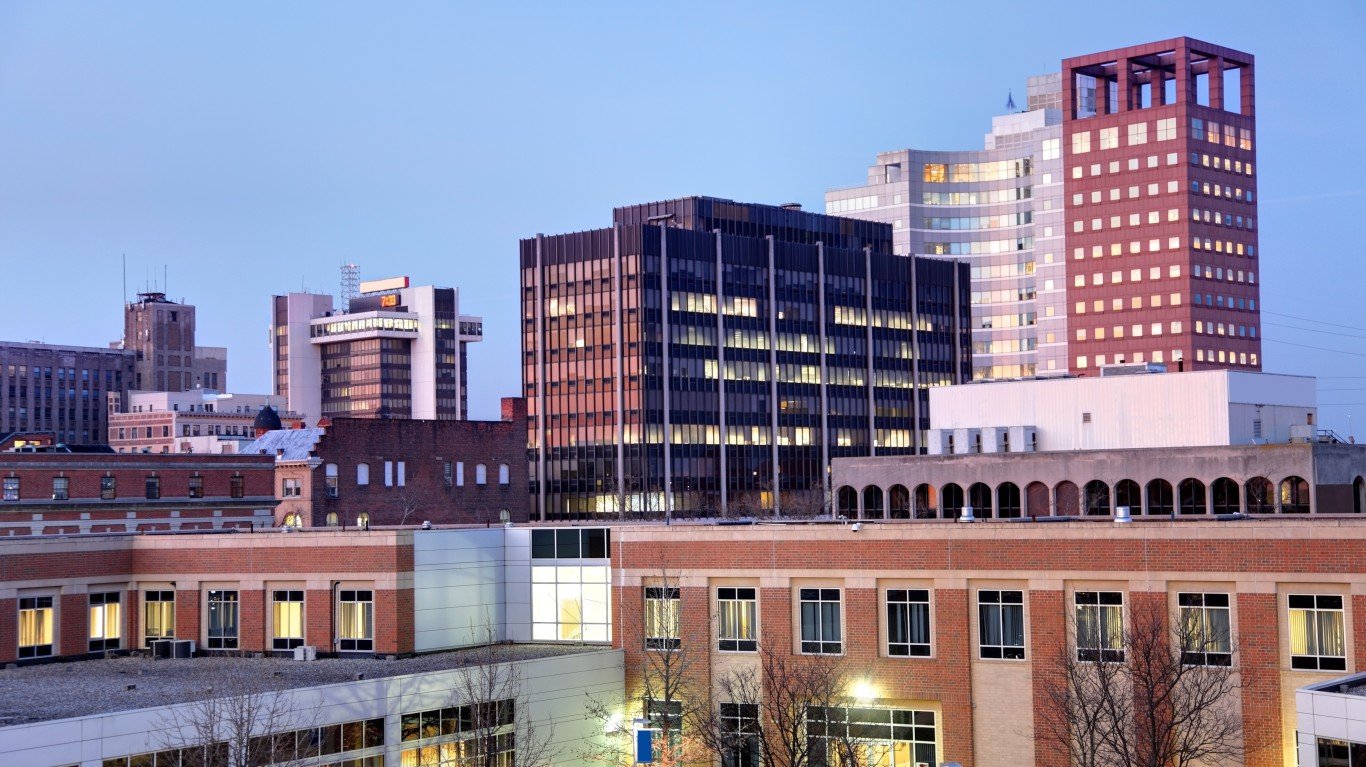
4. Bridgeport-Stamford-Norwalk, CT
> Cost-burdened middle-class households: 56.8%
> Median home value: $400,000
> Median household income: $91,198
> Homeownership rate: 66.8%
Nearly 57% of middle-class households in Bridgeport-Stamford-Norwalk are housing cost burdened, the largest share of any metro area outside of California. Unlike most metro areas on this list, however, housing in the Bridgeport metro area has gotten more affordable in recent years. As recently as 2013, the median home value in the metro area was 5.5 times higher than the median income. As of 2018, the typical home was worth just 4.8 times the median income.
Incomes in the area may be rising faster than property values due to the relatively low growth in demand for housing. In the last five years, the number of people living in the metro area increased by just 1.7% — less than half the comparable national population growth of 3.8%.

3. San Francisco-Oakland-Hayward, CA
> Cost-burdened middle-class households: 58.0%
> Median home value: $800,000
> Median household income: $101,714
> Homeownership rate: 54.6%
San Francisco is one of the most expensive real estate markets in the country. The typical metro area home is worth $800,000, four times the median home value nationwide of $200,000. Renters in and around the city are not spared. The average cost of renting in the metro area is nearly double the average across the U.S. as a whole.
The high housing costs in and around San Francisco put a considerable financial strain on many of the metro area’s middle-class residents. Of area households earning between $45,000 and $74,999 annually, 58.0% spend over 30% of their income on housing, and 19.9% spend over half of their income on housing.
[in-text-ad]

2. Oxnard-Thousand Oaks-Ventura, CA
> Cost-burdened middle-class households: 60.8%
> Median home value: $550,000
> Median household income: $82,857
> Homeownership rate: 62.8%
Oxnard-Thousand Oaks-Ventura is one of only two major U.S. metro areas where more than 60% of middle-class households spend over 30% of their income on housing. The metro area’s housing market has become far less affordable in recent years. Currently, the typical home in the area is worth about 7.5 times the median household income, when as recently as 2013, the median home value was only 5.9 times greater than the median income.
Housing costs are so high in the area that even those in the highest income bracket are far more likely than typical to be burdened by housing costs. About 19% of households earning at least $75,000 a year in the area spend 30% or more of their income on housing, the second largest share of any major metro area and more than double the 7.4% share nationwide.
[recirclink id=566629]
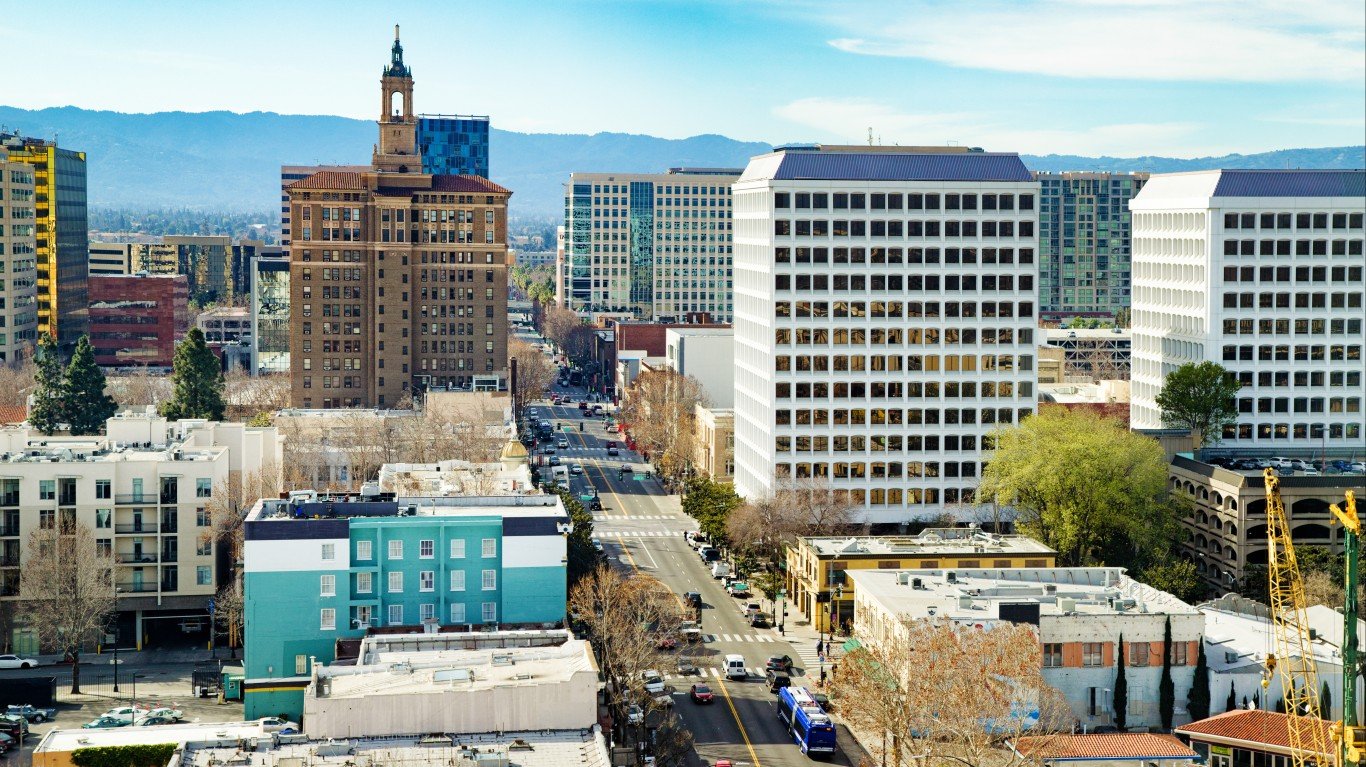
1. San Jose-Sunnyvale-Santa Clara, CA
> Cost-burdened middle-class households: 61.9%
> Median home value: $900,000
> Median household income: $117,474
> Homeownership rate: 57.2%
The San Jose-Sunnyvale-Santa Clara covers much of California’s Silicon Valley region, an area characterized by its high-paying tech industry. Living in one of the wealthiest parts of the country, the typical metro area household earns $117,474 a year, and over one-quarter of households earn at least $200,000 a year. The area’s high incomes have driven up property values, making it difficult for those like teachers, service workers, and firefighters, who earn incomes that fall in the middle-class range on a national scale, to afford housing. Of area households earning between $45,000 and $74,999 annually, 61.9% spend over 30% of their income on housing, making it more difficult to afford other necessities.
The area’s booming tech industry helped create the housing crisis, and now many of those same companies are taking measures to solve it. For example, Google recently pledged $1 billion for a housing initiative. The plan includes allocating $250 million in incentives for developers to build 5,000 affordable housing units and $50 million to nonprofits that help the homeless find shelter.
Methodology
To determine the cities where the middle class can no longer afford a home, 24/7 Wall St. reviewed the share of households — homeowners and renters — that spend at least 30% of their income on housing of all those earning $45,000 to $74,999 annually in the 100 largest U.S. metropolitan areas. Historically, we have used this income bracket to represent the middle class and are continuing to use this criteria as an approximation for the middle class across the United States.
Housing cost data came from “The State of the Nation’s Housing 2019” report of the Joint Center for Housing Studies of Harvard University. Median household income to median home value ratios also came from the JCHS report and are as of 2018, unless otherwise noted. There are 18 metro areas in which more than a third of households in the income bracket are “moderately” burdened (spending 30% to 50% of household income on housing costs) or “severely” burdened (upwards of 50%).
Overall cost of living, including average rental cost, came from the Bureau of Economic Analysis.
Data on population, homeownership, and income distribution by quintile are for 2017 and came from the U.S. Census Bureau’s American Community Survey.
Contact [email protected] for any questions or corrections.