[cnxvideo id=”924890″ placement=”ros”]
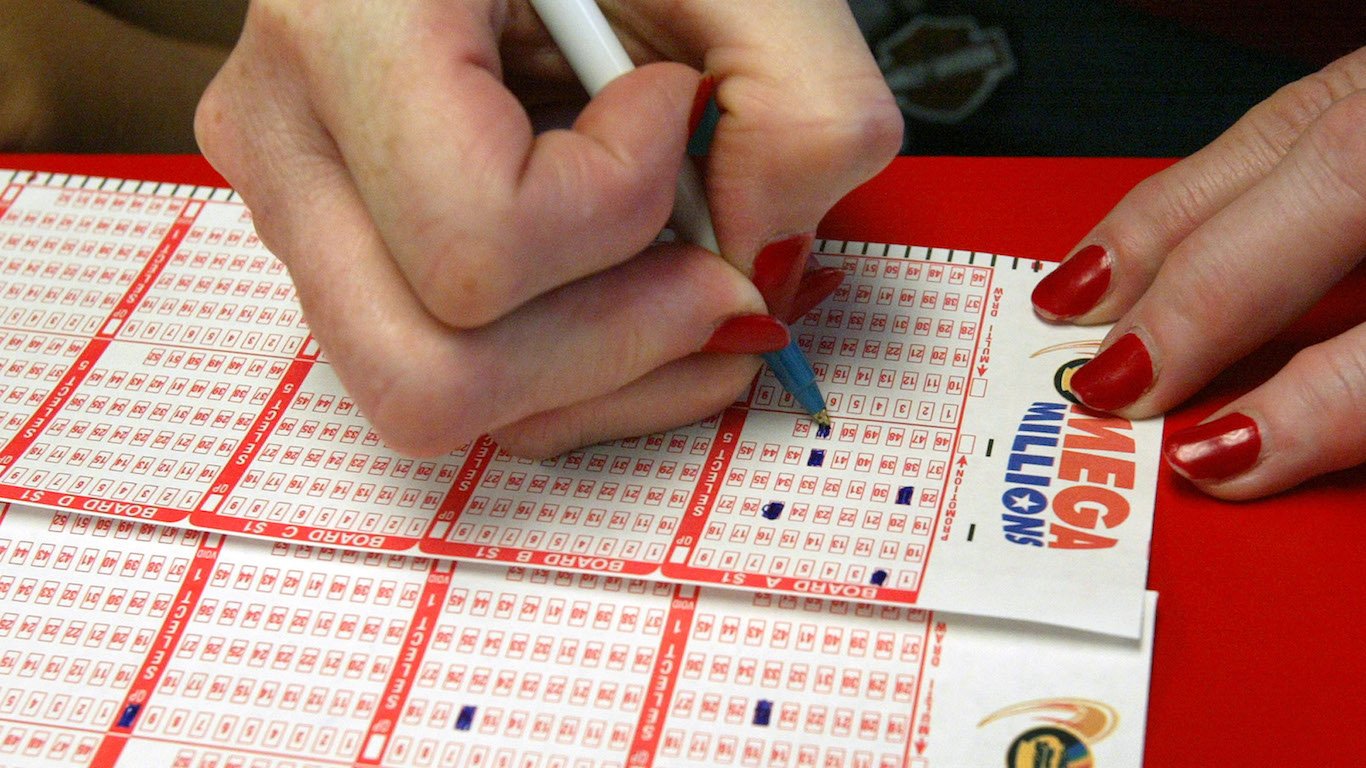
As American author Ambrose Bierce famously wrote, the lottery is “a tax on people who are bad at math.” Indeed, the odds of winning big in games like Powerball or Mega Millions are about 175 million to one. Still, millions of Americans willingly spend their hard-earned money for a chance at an early retirement, lifelong financial security, and the extravagant lifestyle that a single lucky ticket could provide.
Americans spent a staggering $71.8 billion on lottery tickets in 2017 — or about $285 per adult. Of course, lottery ticket spending is not the same across all states, and in some parts of the country, Americans appear much more willing to spend in the hopes of hitting the jackpot.
Using data from the U.S. Census Bureau’s 2017 Annual Survey of State Government Finances, 24/7 Wall St. reviewed total lottery spending per person 18 and over to identify how much the average adult spends on the lottery in every state.
Population figures and income data came from the U.S. Census Bureau’s 2017 American Community survey. Per capita spending on the lottery ranges by state, from as little as $45 to as much nearly $927. Alabama, Alaska, Hawaii, Mississippi, Nevada, and Utah did not permit the sale of lottery tickets in 2017, the most recent year for which ticket sale data is available.
According to a 2016 Gallup poll, higher-income Americans are more likely to play the lottery than those on the lower end of the income spectrum. In keeping with that finding, the majority of states with greater lottery spending per adult also have higher than average median household incomes. Here is a look at America’s richest and poorest states.
For a number of state governments, the lottery is an important source of revenue. States collect far more in lottery ticket sales than they pay out to winners. After accounting for prize money and administrative costs, proceeds from state lotteries often total in the hundreds of millions and even billions of dollars. Still, most states get the largest portion of their annual revenue from either income or sales taxes. Here is a look at the states where Americans pay the most in taxes.
Click here to see how much the average person spends on the lottery in every state

1. Alabama*
> Lottery spending per adult: N/A
> Total lottery ticket sales: N/A
> Prize money awarded in 2017: N/A
> Median household income: $49,861 (6th lowest)
*No state lottery.
[in-text-ad]

2. Alaska*
> Lottery spending per adult: N/A
> Total lottery ticket sales: N/A
> Prize money awarded in 2017: N/A
> Median household income: $74,346 (8th highest)
*No state lottery.
[recirclink id=497115]

3. Arizona
> Lottery spending per adult: $150.79 (14th lowest)
> Total lottery ticket sales: $811.8 million (22nd highest)
> Prize money awarded in 2017: $557.4 million ($103.55 per adult)
> Median household income: $59,246 (24th lowest)

4. Arkansas
> Lottery spending per adult: $184.61 (16th lowest)
> Total lottery ticket sales: $423.8 million (14th lowest)
> Prize money awarded in 2017: $306.4 million ($133.47 per adult)
> Median household income: $47,062 (3rd lowest)
[in-text-ad-2]

5. California
> Lottery spending per adult: $204.52 (17th lowest)
> Total lottery ticket sales: $6.2 billion (2nd highest)
> Prize money awarded in 2017: $4.0 billion ($130.04 per adult)
> Median household income: $75,277 (6th highest)

6. Colorado
> Lottery spending per adult: $118.44 (9th lowest)
> Total lottery ticket sales: $514.6 million (18th lowest)
> Prize money awarded in 2017: $341.5 million ($78.60 per adult)
> Median household income: $71,953 (11th highest)
[in-text-ad]

7. Connecticut
> Lottery spending per adult: $403.48 (9th highest)
> Total lottery ticket sales: $1.1 billion (18th highest)
> Prize money awarded in 2017: $756.3 million ($265.75 per adult)
> Median household income: $76,348 (5th highest)
[recirclink id=554829]

8. Delaware
> Lottery spending per adult: $607.34 (3rd highest)
> Total lottery ticket sales: $460.1 million (16th lowest)
> Prize money awarded in 2017: $135.0 million ($178.13 per adult)
> Median household income: $64,805 (16th highest)
9. Florida
> Lottery spending per adult: $346.73 (13th highest)
> Total lottery ticket sales: $5.8 billion (3rd highest)
> Prize money awarded in 2017: $4.0 billion ($238.13 per adult)
> Median household income: $55,462 (14th lowest)
[in-text-ad-2]

10. Georgia
> Lottery spending per adult: $507.46 (5th highest)
> Total lottery ticket sales: $4.0 billion (6th highest)
> Prize money awarded in 2017: $2.7 billion ($345.88 per adult)
> Median household income: $58,756 (23rd lowest)

11. Hawaii*
> Lottery spending per adult: N/A
> Total lottery ticket sales: N/A
> Prize money awarded in 2017: N/A
> Median household income: $80,212 (3rd highest)
*No state lottery.
[in-text-ad]

12. Idaho
> Lottery spending per adult: $173.90 (15th lowest)
> Total lottery ticket sales: $221.5 million (9th lowest)
> Prize money awarded in 2017: $160.3 million ($125.86 per adult)
> Median household income: $55,583 (15th lowest)
[recirclink id=531165]

13. Illinois
> Lottery spending per adult: $287.07 (16th highest)
> Total lottery ticket sales: $2.8 billion (10th highest)
> Prize money awarded in 2017: $1.8 billion ($183.72 per adult)
> Median household income: $65,030 (15th highest)

14. Indiana
> Lottery spending per adult: $222.19 (18th lowest)
> Total lottery ticket sales: $1.1 billion (19th highest)
> Prize money awarded in 2017: $774.4 million ($152.06 per adult)
> Median household income: $55,746 (17th lowest)
[in-text-ad-2]

15. Iowa
> Lottery spending per adult: $145.83 (13th lowest)
> Total lottery ticket sales: $352.2 million (13th lowest)
> Prize money awarded in 2017: $215.6 million ($89.27 per adult)
> Median household income: $59,955 (25th highest)

16. Kansas
> Lottery spending per adult: $110.29 (6th lowest)
> Total lottery ticket sales: $242.7 million (10th lowest)
> Prize money awarded in 2017: $149.7 million ($68.03 per adult)
> Median household income: $58,218 (21st lowest)
[in-text-ad]

17. Kentucky
> Lottery spending per adult: $269.01 (19th highest)
> Total lottery ticket sales: $925.3 million (21st highest)
> Prize money awarded in 2017: $628.8 million ($182.82 per adult)
> Median household income: $50,247 (7th lowest)
[recirclink id=537928]

18. Louisiana
> Lottery spending per adult: $120.13 (11th lowest)
> Total lottery ticket sales: $429.5 million (15th lowest)
> Prize money awarded in 2017: $242.9 million ($67.96 per adult)
> Median household income: $47,905 (5th lowest)

19. Maine
> Lottery spending per adult: $229.56 (21st lowest)
> Total lottery ticket sales: $248.3 million (11th lowest)
> Prize money awarded in 2017: $171.8 million ($158.79 per adult)
> Median household income: $55,602 (16th lowest)
[in-text-ad-2]

20. Maryland
> Lottery spending per adult: $409.77 (8th highest)
> Total lottery ticket sales: $1.9 billion (13th highest)
> Prize money awarded in 2017: $1.3 billion ($286.88 per adult)
> Median household income: $83,242 (the highest)

21. Massachusetts
> Lottery spending per adult: $926.71 (the highest)
> Total lottery ticket sales: $5.1 billion (4th highest)
> Prize money awarded in 2017: $3.7 billion ($668.52 per adult)
> Median household income: $79,835 (4th highest)
[in-text-ad]

22. Michigan
> Lottery spending per adult: $387.72 (10th highest)
> Total lottery ticket sales: $3.0 billion (8th highest)
> Prize money awarded in 2017: $2.0 billion ($262.52 per adult)
> Median household income: $56,697 (20th lowest)
[recirclink id=497115]

23. Minnesota
> Lottery spending per adult: $120.13 (10th lowest)
> Total lottery ticket sales: $514.0 million (17th lowest)
> Prize money awarded in 2017: $351.7 million ($82.19 per adult)
> Median household income: $70,315 (13th highest)

24. Mississippi*
> Lottery spending per adult: N/A
> Total lottery ticket sales: N/A
> Prize money awarded in 2017: N/A
> Median household income: $44,717 (2nd lowest)
*State lottery not in effect in 2017.
[in-text-ad-2]

25. Missouri
> Lottery spending per adult: $267.50 (20th highest)
> Total lottery ticket sales: $1.3 billion (17th highest)
> Prize money awarded in 2017: $932.1 million ($197.23 per adult)
> Median household income: $54,478 (12th lowest)

26. Montana
> Lottery spending per adult: $77.05 (4th lowest)
> Total lottery ticket sales: $63.2 million (3rd lowest)
> Prize money awarded in 2017: $33.7 million ($41.04 per adult)
> Median household income: $55,328 (13th lowest)
[in-text-ad]

27. Nebraska
> Lottery spending per adult: $112.55 (7th lowest)
> Total lottery ticket sales: $162.7 million (8th lowest)
> Prize money awarded in 2017: $101.9 million ($70.50 per adult)
> Median household income: $59,566 (25th lowest)
[recirclink id=554829]

28. Nevada*
> Lottery spending per adult: N/A
> Total lottery ticket sales: N/A
> Prize money awarded in 2017: N/A
> Median household income: $58,646 (22nd lowest)
*No state lottery.

29. New Hampshire
> Lottery spending per adult: $264.63 (21st highest)
> Total lottery ticket sales: $287.0 million (12th lowest)
> Prize money awarded in 2017: $191.8 million ($176.82 per adult)
> Median household income: $74,991 (7th highest)
[in-text-ad-2]

30. New Jersey
> Lottery spending per adult: $427.65 (6th highest)
> Total lottery ticket sales: $3.0 billion (9th highest)
> Prize money awarded in 2017: $2.0 billion ($280.71 per adult)
> Median household income: $81,740 (2nd highest)

31. New Mexico
> Lottery spending per adult: $78.86 (5th lowest)
> Total lottery ticket sales: $126.0 million (5th lowest)
> Prize money awarded in 2017: $67.2 million ($42.03 per adult)
> Median household income: $47,169 (4th lowest)
[in-text-ad]

32. New York
> Lottery spending per adult: $530.72 (4th highest)
> Total lottery ticket sales: $8.3 billion (the highest)
> Prize money awarded in 2017: $4.6 billion ($295.56 per adult)
> Median household income: $67,844 (14th highest)
[recirclink id=531165]

33. North Carolina
> Lottery spending per adult: $283.31 (18th highest)
> Total lottery ticket sales: $2.3 billion (12th highest)
> Prize money awarded in 2017: $1.5 billion ($193.50 per adult)
> Median household income: $53,855 (11th lowest)

34. North Dakota
> Lottery spending per adult: $45.27 (the lowest)
> Total lottery ticket sales: $26.4 million (2nd lowest)
> Prize money awarded in 2017: $14.3 million ($24.60 per adult)
> Median household income: $63,837 (18th highest)
[in-text-ad-2]

35. Ohio
> Lottery spending per adult: $310.93 (14th highest)
> Total lottery ticket sales: $2.8 billion (11th highest)
> Prize money awarded in 2017: $1.9 billion ($210.90 per adult)
> Median household income: $56,111 (18th lowest)

36. Oklahoma
> Lottery spending per adult: $51.02 (2nd lowest)
> Total lottery ticket sales: $151.5 million (6th lowest)
> Prize money awarded in 2017: $73.3 million ($24.70 per adult)
> Median household income: $51,924 (8th lowest)
[in-text-ad]

37. Oregon
> Lottery spending per adult: $308.15 (15th highest)
> Total lottery ticket sales: $1.0 billion (20th highest)
> Prize money awarded in 2017: $217.2 million ($66.43 per adult)
> Median household income: $63,426 (19th highest)
[recirclink id=537928]

38. Pennsylvania
> Lottery spending per adult: $366.98 (12th highest)
> Total lottery ticket sales: $3.7 billion (7th highest)
> Prize money awarded in 2017: $2.6 billion ($255.24 per adult)
> Median household income: $60,905 (21st highest)

39. Rhode Island
> Lottery spending per adult: $622.50 (2nd highest)
> Total lottery ticket sales: $530.8 million (19th lowest)
> Prize money awarded in 2017: $157.0 million ($184.16 per adult)
> Median household income: $64,340 (17th highest)
[in-text-ad-2]

40. South Carolina
> Lottery spending per adult: $387.57 (11th highest)
> Total lottery ticket sales: $1.5 billion (15th highest)
> Prize money awarded in 2017: $1.1 billion ($276.90 per adult)
> Median household income: $52,306 (9th lowest)

41. South Dakota
> Lottery spending per adult: $232.52 (22nd lowest)
> Total lottery ticket sales: $152.6 million (7th lowest)
> Prize money awarded in 2017: $28.7 million ($43.78 per adult)
> Median household income: $56,274 (19th lowest)
[in-text-ad]

42. Tennessee
> Lottery spending per adult: $261.32 (22nd highest)
> Total lottery ticket sales: $1.4 billion (16th highest)
> Prize money awarded in 2017: $948.3 million ($182.10 per adult)
> Median household income: $52,375 (10th lowest)
[recirclink id=497115]

43. Texas
> Lottery spending per adult: $229.29 (20th lowest)
> Total lottery ticket sales: $4.8 billion (5th highest)
> Prize money awarded in 2017: $3.3 billion ($155.56 per adult)
> Median household income: $60,629 (24th highest)

44. Utah*
> Lottery spending per adult: N/A
> Total lottery ticket sales: N/A
> Prize money awarded in 2017: N/A
> Median household income: $71,414 (12th highest)
*No state lottery.
[in-text-ad-2]

45. Vermont
> Lottery spending per adult: $227.08 (19th lowest)
> Total lottery ticket sales: $114.9 million (4th lowest)
> Prize money awarded in 2017: $79.6 million ($157.44 per adult)
> Median household income: $60,782 (22nd highest)

46. Virginia
> Lottery spending per adult: $284.45 (17th highest)
> Total lottery ticket sales: $1.9 billion (14th highest)
> Prize money awarded in 2017: $1.2 billion ($183.93 per adult)
> Median household income: $72,577 (10th highest)
[in-text-ad]

47. Washington
> Lottery spending per adult: $116.92 (8th lowest)
> Total lottery ticket sales: $673.3 million (22nd lowest)
> Prize money awarded in 2017: $499.3 million ($86.70 per adult)
> Median household income: $74,073 (9th highest)
[recirclink id=554829]

48. West Virginia
> Lottery spending per adult: $422.99 (7th highest)
> Total lottery ticket sales: $610.1 million (21st lowest)
> Prize money awarded in 2017: $512.0 million ($354.92 per adult)
> Median household income: $44,097 (the lowest)

49. Wisconsin
> Lottery spending per adult: $125.96 (12th lowest)
> Total lottery ticket sales: $568.9 million (20th lowest)
> Prize money awarded in 2017: $363.0 million ($80.37 per adult)
> Median household income: $60,773 (23rd highest)
[in-text-ad-2]

50. Wyoming
> Lottery spending per adult: $57.43 (3rd lowest)
> Total lottery ticket sales: $25.3 million (the lowest)
> Prize money awarded in 2017: $14.5 million ($32.85 per adult)
> Median household income: $61,584 (20th highest)
Contact [email protected] for any questions or corrections.