[cnxvideo id=”712476″ placement=”ros”]
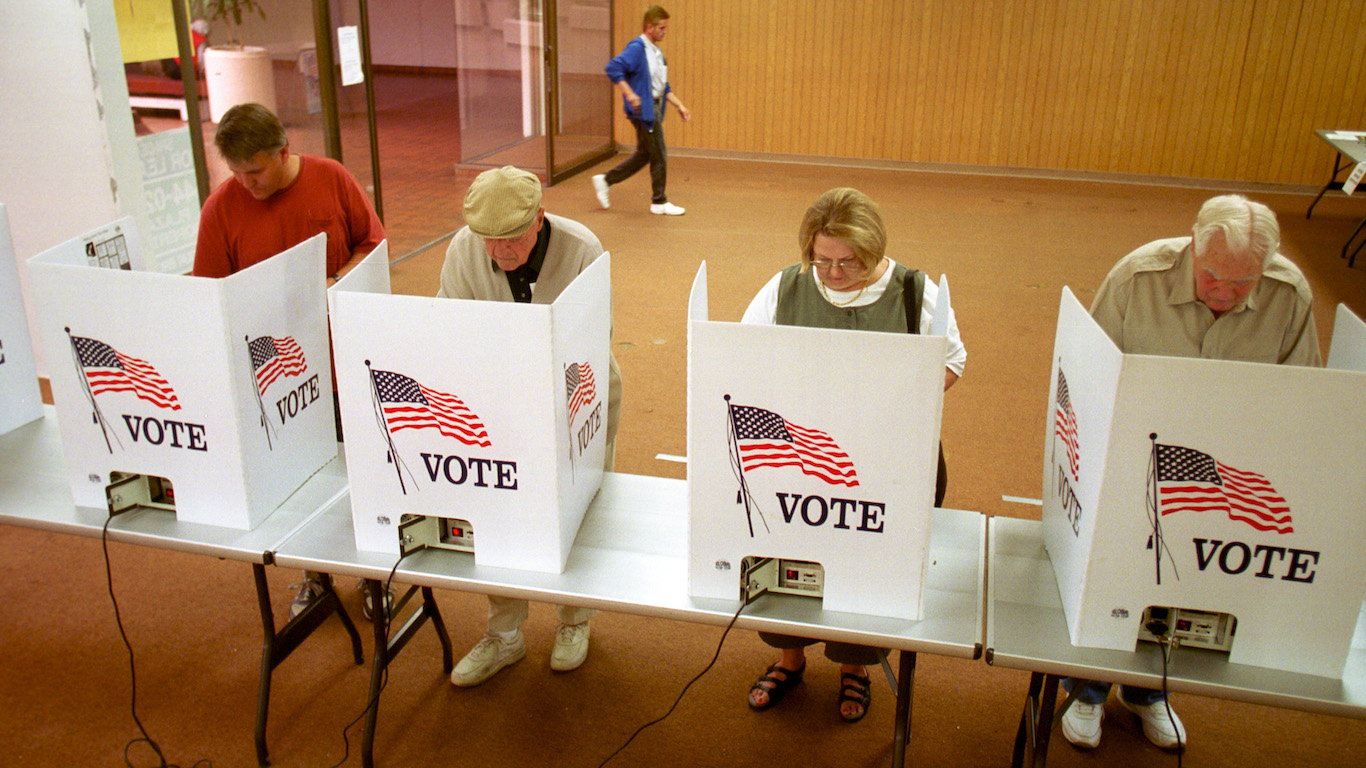
The 2020 presidential nomination process begins Feb. 3 with the Iowa Caucuses, followed by the New Hampshire primary on Feb.11. Candidates from both parties battle it out during primaries and caucuses to try to win their party’s presidential nomination, which will be decided at their national conventions in July for the Democratic Party and in August for the Republican Party.
Although the primary vote is critical in choosing the next president, interest in the primaries varies from state to state. As the primary campaign gets underway, 24/7 Wall St. has identified the states with the highest and lowest voter turnout rates in the primaries and caucuses by analyzing data from the United States Election Project.
In primaries, voters directly select their nominee, and most states use the primary method to select candidates. A caucus is a meeting of party members who convene to discuss policies, actions, or meet to nominate a presidential candidate. Those participating in the caucuses choose delegates who will represent them when they vote for candidates at the national convention. Here is how important the Iowa Caucuses were in every election.
States such as New Hampshire and Wisconsin are usually among the states with the highest voter turnout in primaries. New Hampshire has the advantage of going first in the primary season — state law requires New Hampshire to vote first — which stokes voter interest. The Granite State is famous for its political engagement. Its state legislature has 424 members, the most of any American representative body besides the U.S. Congress.
Wisconsin has a long history of civic involvement as well, dating back to Progressive Republican Gov. Robert La Follette in the early 20th century. He believed voters have a stake in an efficient and honest government. Here is the best and worst thing about every state.
Click here to see the states where the most (and fewest) people vote in the primaries
To determine how many people voted in the primaries and caucuses in each state, 24/7 Wall St. analyzed data from the United States Election Project. Turnout rates were calculated by taking the number of votes in each party’s primary or caucus and dividing by the eligible voter population. We did not include vote totals when delegates were decided at a party’s convention.

1. Alabama
> 2016 primary election voting rate: 35.0% (10th highest)
> Election type: Primary
> Voting eligible population: 3,602,334
> Vote in party contest – Democratic: 399,899
> Vote in party contest – Republican: 860,652
[in-text-ad]

2. Alaska
> 2016 primary election voting rate: 6.2% (4th lowest)
> Election type: Caucus
> Voting eligible population: 520,731
> Vote in party contest – Democratic: 10,600
> Vote in party contest – Republican: 21,930
[recirclink id=605544]
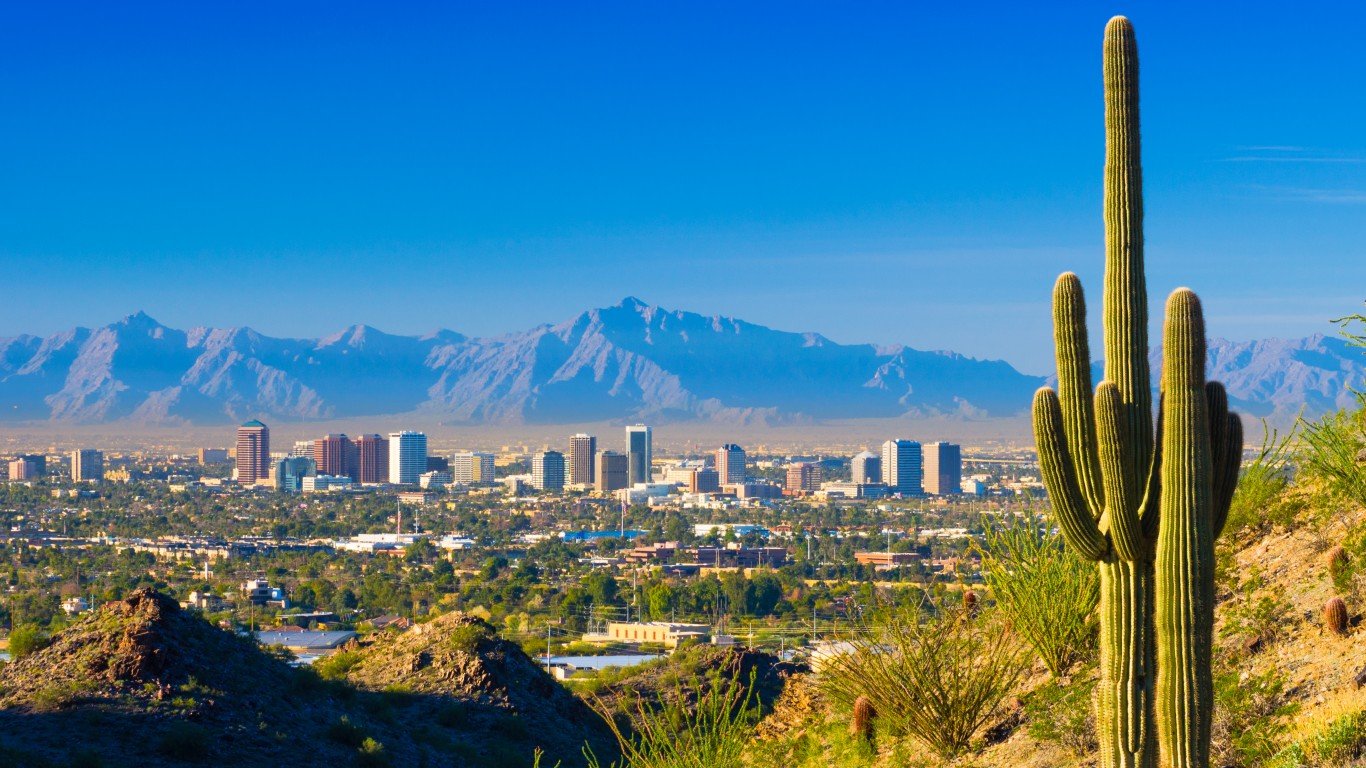
3. Arizona
> 2016 primary election voting rate: 23.5% (19th lowest)
> Election type: Primary
> Voting eligible population: 4,659,373
> Vote in party contest – Democratic: 468,461
> Vote in party contest – Republican: 625,770

4. Arkansas
> 2016 primary election voting rate: 30.2% (19th highest)
> Election type: Primary
> Voting eligible population: 2,137,115
> Vote in party contest – Democratic: 221,020
> Vote in party contest – Republican: 410,920
[in-text-ad-2]

5. California
> 2016 primary election voting rate: 34.0% (13th highest)
> Election type: Primary
> Voting eligible population: 25,126,973
> Vote in party contest – Democratic: 5,173,338
> Vote in party contest – Republican: 2,227,306

6. Colorado
> 2016 primary election voting rate: N/A
> Election type: Caucus
> Voting eligible population: 3,928,790
> Vote in party contest – Democratic: 123,508
> Vote in party contest – Republican: Convention
[in-text-ad]
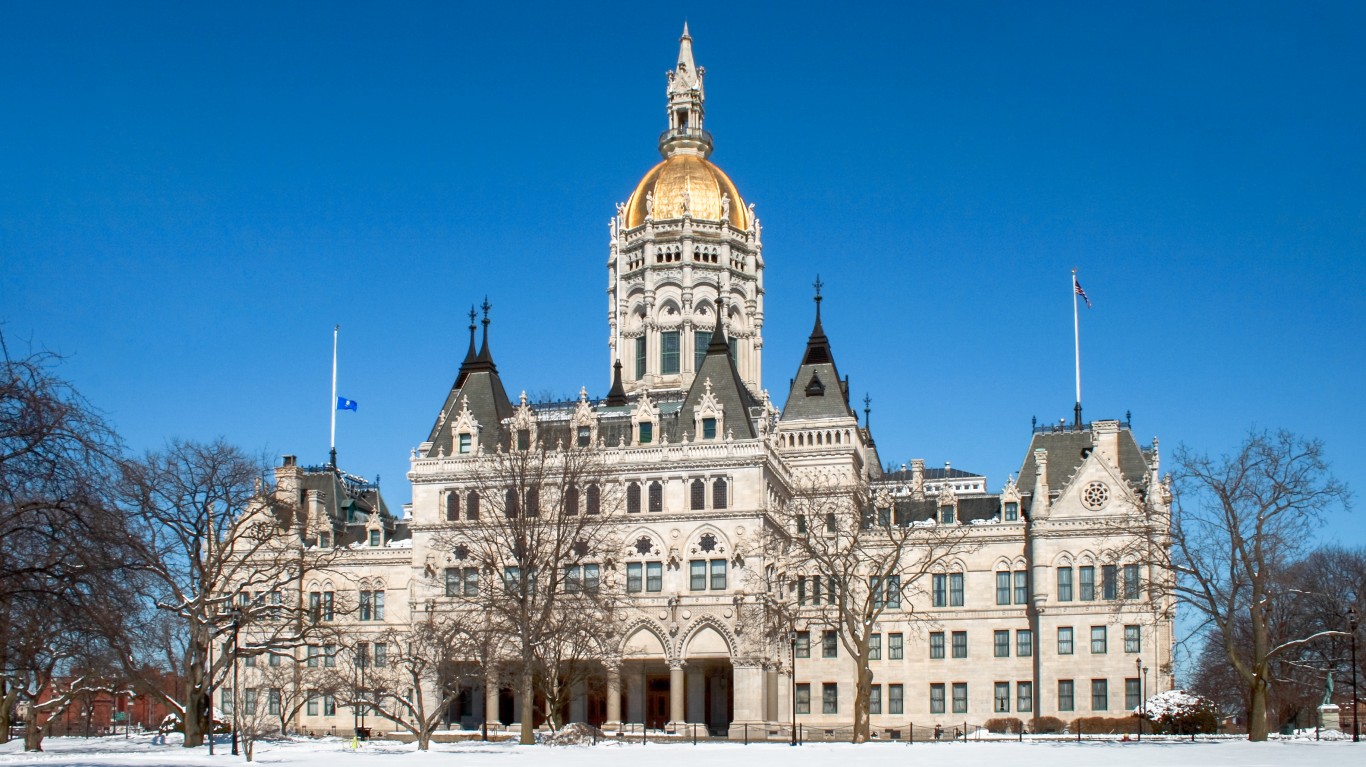
7. Connecticut
> 2016 primary election voting rate: 21.0% (14th lowest)
> Election type: Primary
> Voting eligible population: 2,579,776
> Vote in party contest – Democratic: 328,624
> Vote in party contest – Republican: 213,647
[recirclink id=534854]

8. Delaware
> 2016 primary election voting rate: 23.5% (20th lowest)
> Election type: Primary
> Voting eligible population: 695,642
> Vote in party contest – Democratic: 93,640
> Vote in party contest – Republican: 69,892
9. Florida
> 2016 primary election voting rate: 28.2% (24th lowest)
> Election type: Primary
> Voting eligible population: 14,445,578
> Vote in party contest – Democratic: 1,709,183
> Vote in party contest – Republican: 2,361,805
[in-text-ad-2]

10. Georgia
> 2016 primary election voting rate: 29.9% (21st highest)
> Election type: Primary
> Voting eligible population: 6,900,387
> Vote in party contest – Democratic: 765,366
> Vote in party contest – Republican: 1,295,963

11. Hawaii
> 2016 primary election voting rate: 4.6% (the lowest)
> Election type: Caucus
> Voting eligible population: 1,025,208
> Vote in party contest – Democratic: 33,716
> Vote in party contest – Republican: 13,377
[in-text-ad]

12. Idaho
> 2016 primary election voting rate: 21.9% (17th lowest)
> Election type: Caucus
> Voting eligible population: 1,149,007
> Vote in party contest – Democratic: 23,884
> Vote in party contest – Republican: 226,711
[recirclink id=370831]
13. Illinois
> 2016 primary election voting rate: 38.9% (4th highest)
> Election type: Primary
> Voting eligible population: 9,015,796
> Vote in party contest – Democratic: 2,056,047
> Vote in party contest – Republican: 1,449,748

14. Indiana
> 2016 primary election voting rate: 36.0% (7th highest)
> Election type: Primary
> Voting eligible population: 4,855,984
> Vote in party contest – Democratic: 638,779
> Vote in party contest – Republican: 1,110,543
[in-text-ad-2]

15. Iowa
> 2016 primary election voting rate: 15.7% (8th lowest)
> Election type: Caucus
> Voting eligible population: 2,286,197
> Vote in party contest – Democratic: 171,109
> Vote in party contest – Republican: 186,874
16. Kansas
> 2016 primary election voting rate: 5.5% (2nd lowest)
> Election type: Caucus
> Voting eligible population: 2,062,778
> Vote in party contest – Democratic: 40,000
> Vote in party contest – Republican: 73,116
[in-text-ad]
17. Kentucky
> 2016 primary election voting rate: 21.0% (15th lowest)
> Election type: Primary
> Voting eligible population: 3,265,260
> Vote in party contest – Democratic: 454,573
> Vote in party contest – Republican: 229,667
[recirclink id=605544]
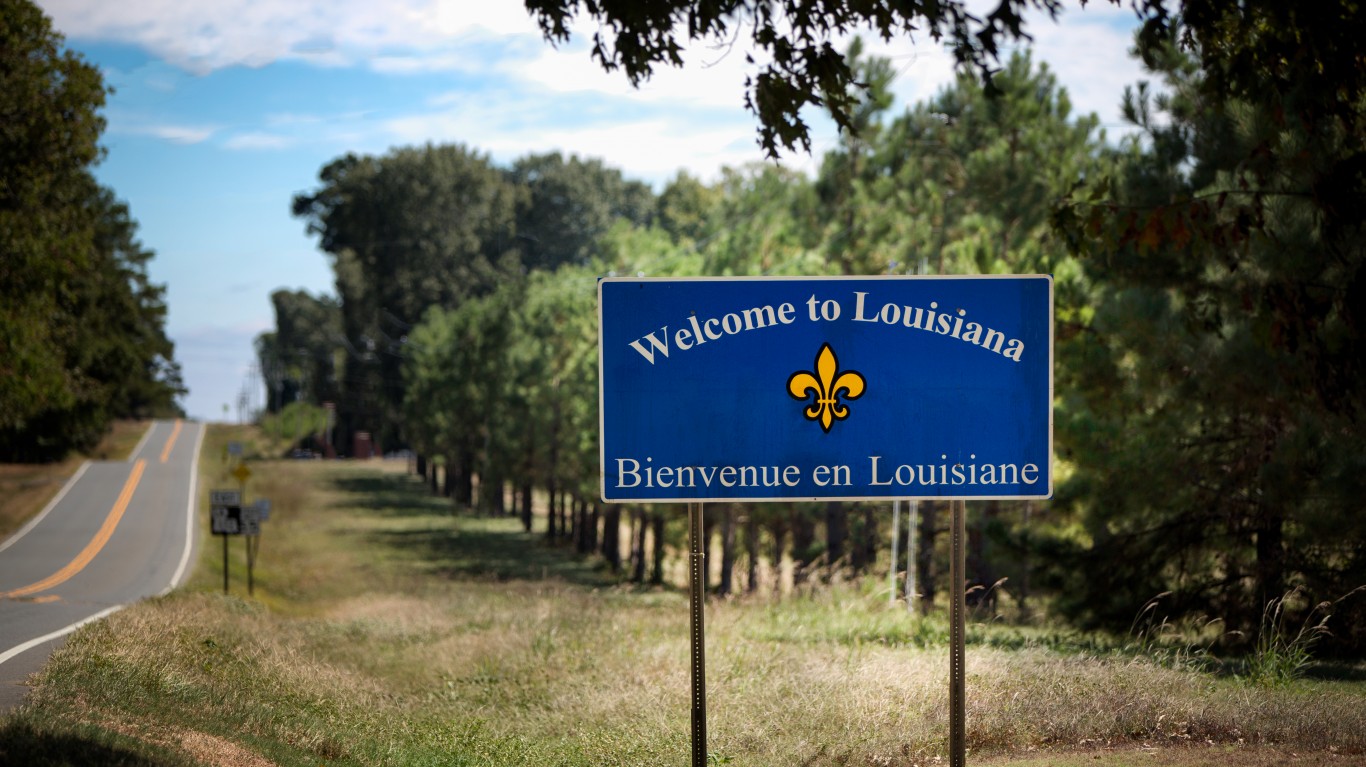
18. Louisiana
> 2016 primary election voting rate: 18.2% (11th lowest)
> Election type: Primary
> Voting eligible population: 3,373,552
> Vote in party contest – Democratic: 311,776
> Vote in party contest – Republican: 301,241

19. Maine
> 2016 primary election voting rate: 6.1% (3rd lowest)
> Election type: Caucus
> Voting eligible population: 1,054,309
> Vote in party contest – Democratic: 46,000
> Vote in party contest – Republican: 18,650
[in-text-ad-2]

20. Maryland
> 2016 primary election voting rate: 32.8% (15th highest)
> Election type: Primary
> Voting eligible population: 4,190,917
> Vote in party contest – Democratic: 916,763
> Vote in party contest – Republican: 459,066

21. Massachusetts
> 2016 primary election voting rate: 37.4% (6th highest)
> Election type: Primary
> Voting eligible population: 4,966,742
> Vote in party contest – Democratic: 1,220,296
> Vote in party contest – Republican: 637,703
[in-text-ad]

22. Michigan
> 2016 primary election voting rate: 34.1% (12th highest)
> Election type: Primary
> Voting eligible population: 7,419,694
> Vote in party contest – Democratic: 1,205,552
> Vote in party contest – Republican: 1,323,589
[recirclink id=594996]

23. Minnesota
> 2016 primary election voting rate: 8.1% (5th lowest)
> Election type: Caucus
> Voting eligible population: 3,967,061
> Vote in party contest – Democratic: 207,109
> Vote in party contest – Republican: 114,245
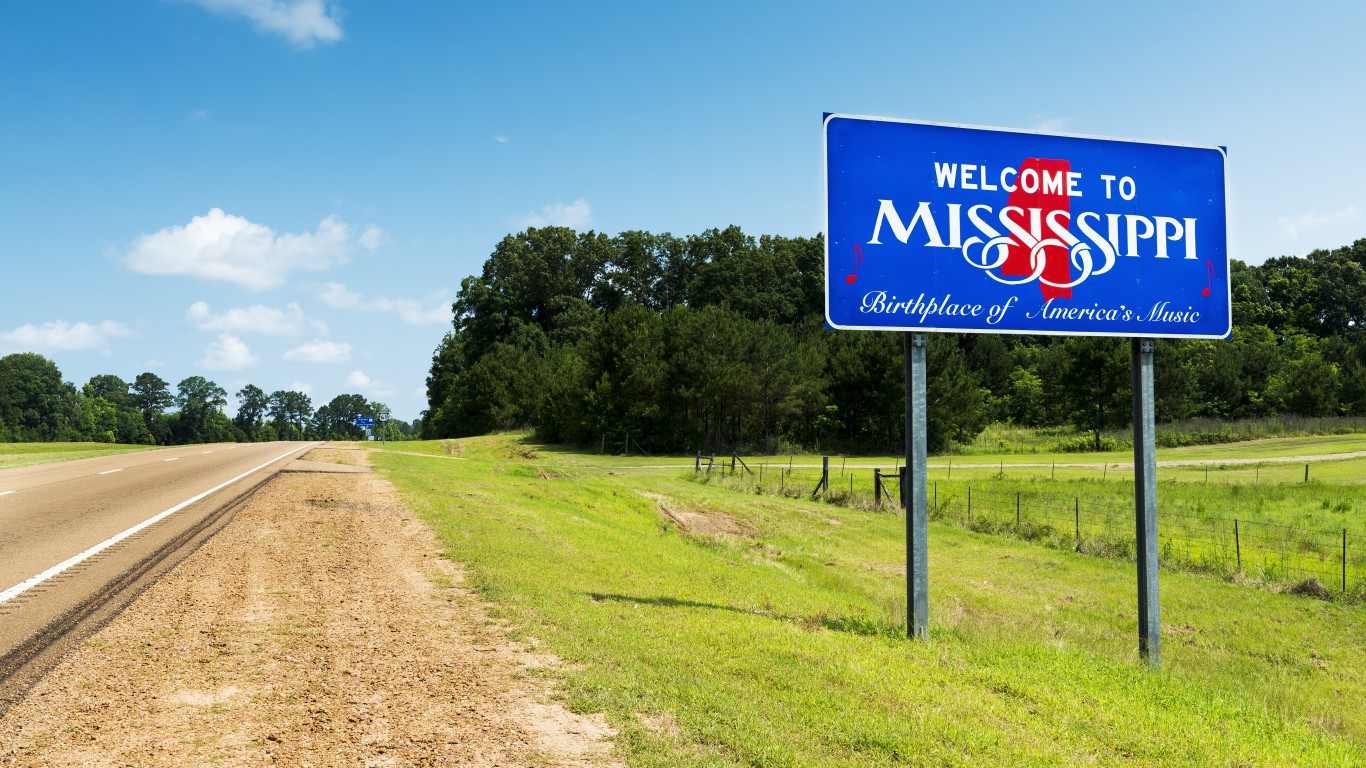
24. Mississippi
> 2016 primary election voting rate: 29.5% (22nd highest)
> Election type: Primary
> Voting eligible population: 2,181,159
> Vote in party contest – Democratic: 227,164
> Vote in party contest – Republican: 416,252
[in-text-ad-2]

25. Missouri
> 2016 primary election voting rate: 34.8% (11th highest)
> Election type: Primary
> Voting eligible population: 4,518,767
> Vote in party contest – Democratic: 629,425
> Vote in party contest – Republican: 939,270

26. Montana
> 2016 primary election voting rate: 35.5% (9th highest)
> Election type: Primary
> Voting eligible population: 798,787
> Vote in party contest – Democratic: 126,376
> Vote in party contest – Republican: 156,888
[in-text-ad]
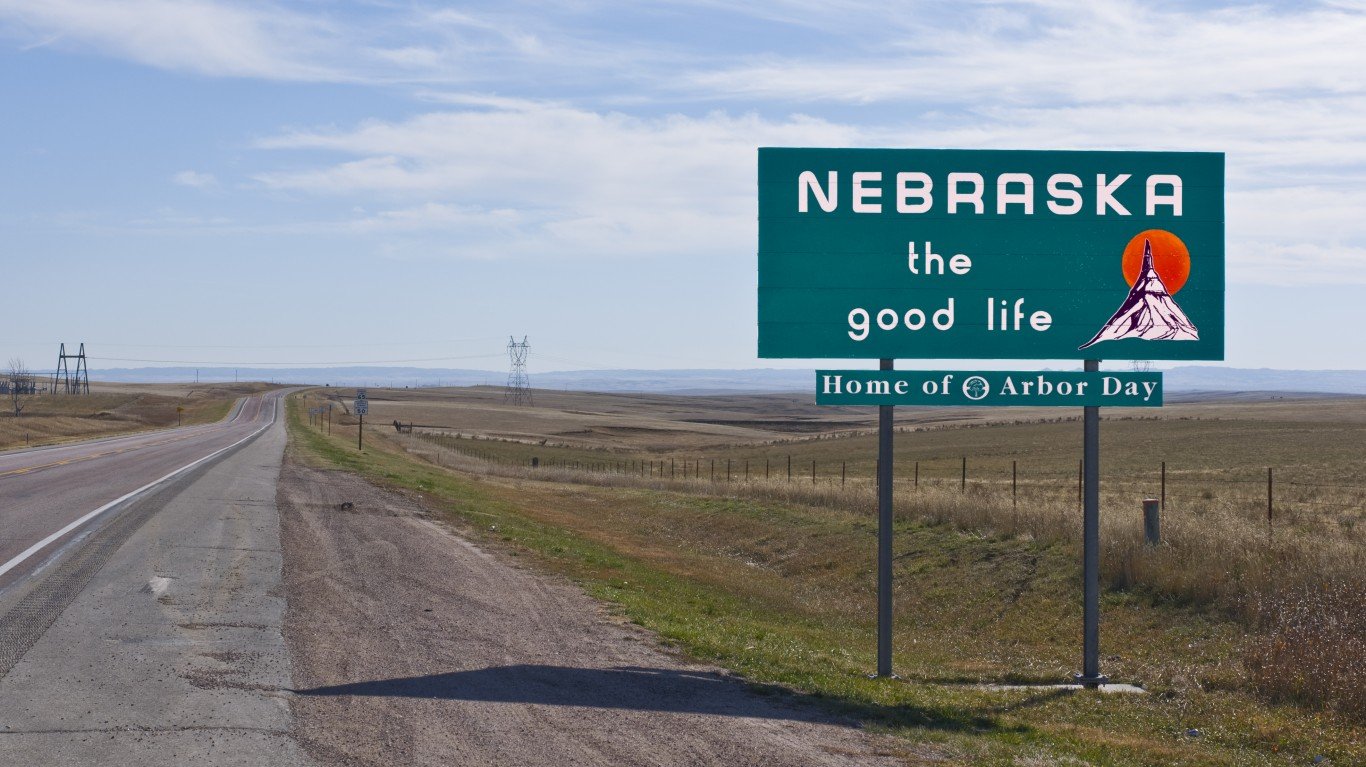
27. Nebraska
> 2016 primary election voting rate: 17.2% (10th lowest)
> Election type: Primary
> Voting eligible population: 1,349,169
> Vote in party contest – Democratic: 33,460
> Vote in party contest – Republican: 197,430
[recirclink id=606148]
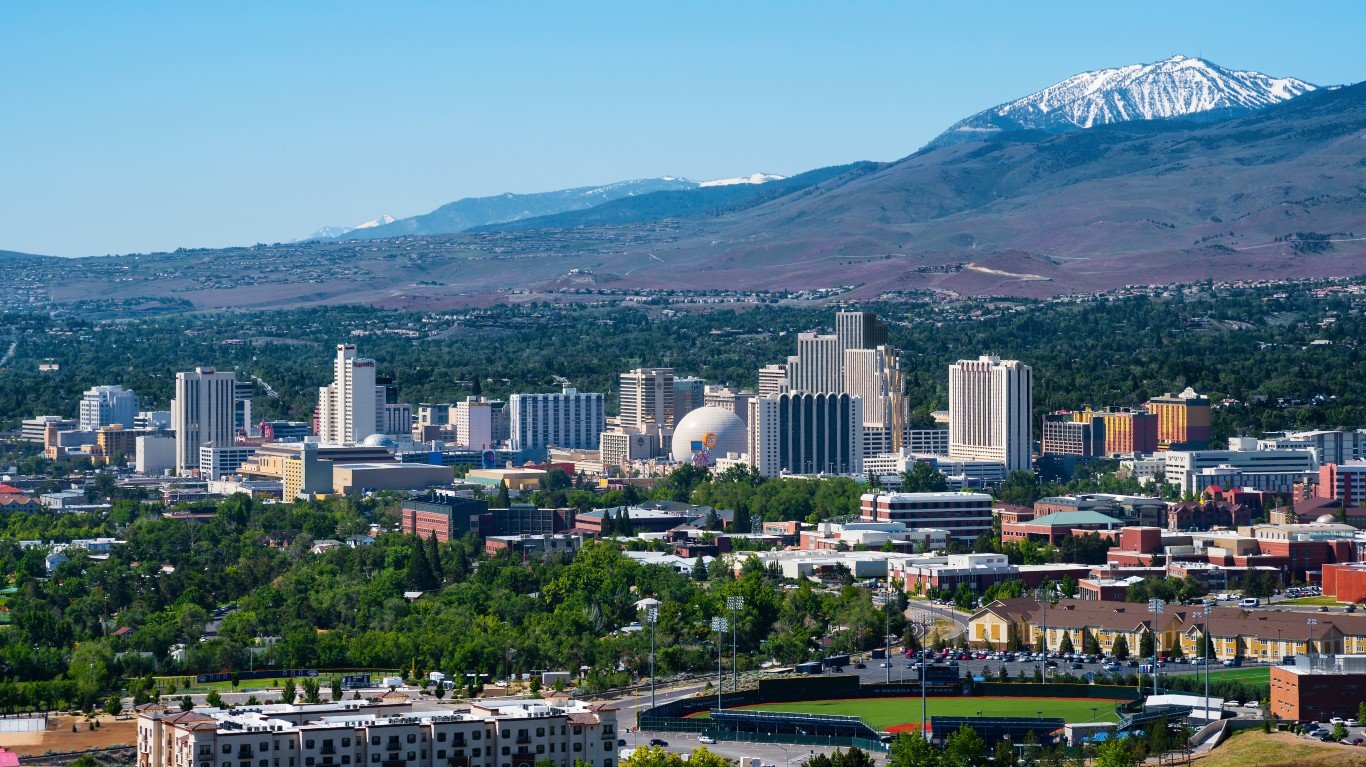
28. Nevada
> 2016 primary election voting rate: 8.2% (6th lowest)
> Election type: Caucus
> Voting eligible population: 1,936,072
> Vote in party contest – Democratic: 84,000
> Vote in party contest – Republican: 75,216
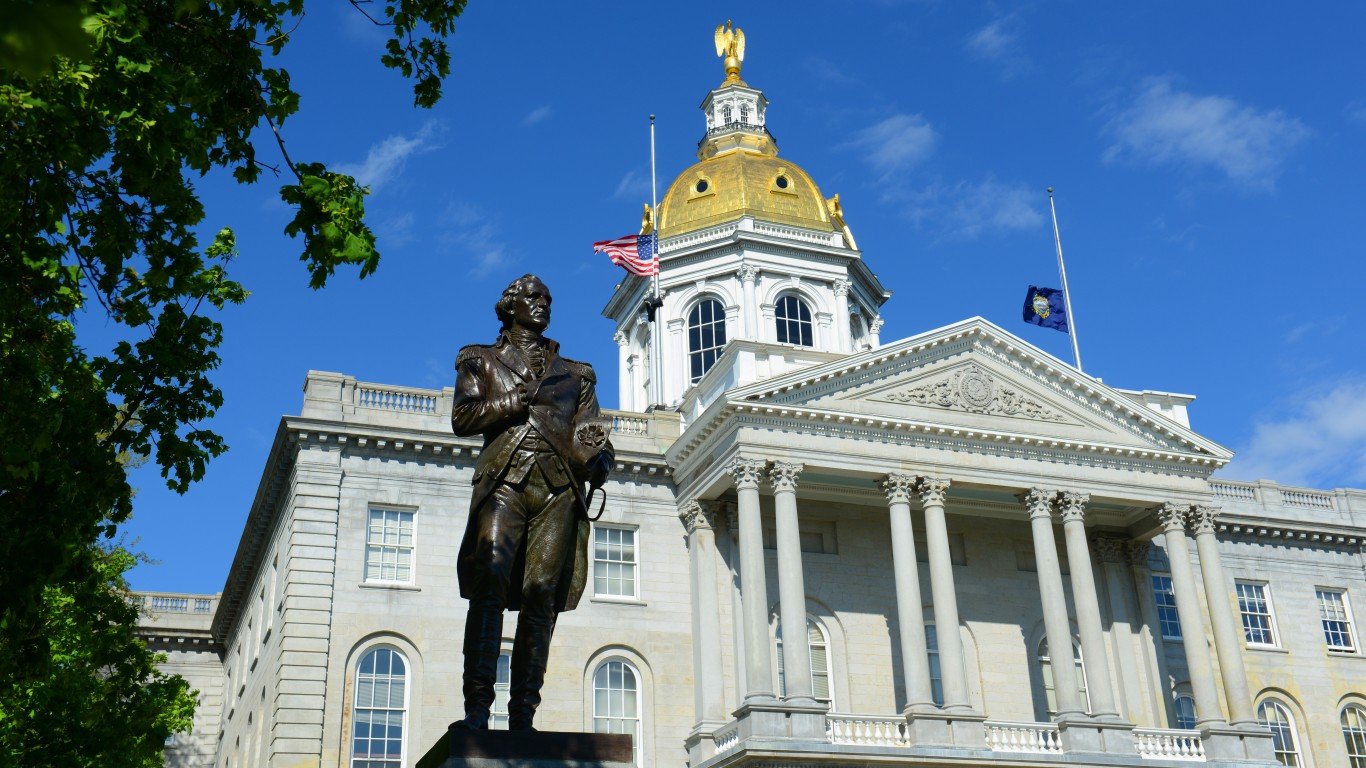
29. New Hampshire
> 2016 primary election voting rate: 52.4% (the highest)
> Election type: Primary
> Voting eligible population: 1,035,734
> Vote in party contest – Democratic: 254,776
> Vote in party contest – Republican: 287,683
[in-text-ad-2]

30. New Jersey
> 2016 primary election voting rate: 20.4% (13th lowest)
> Election type: Primary
> Voting eligible population: 6,060,729
> Vote in party contest – Democratic: 793,548
> Vote in party contest – Republican: 443,062

31. New Mexico
> 2016 primary election voting rate: 22.6% (18th lowest)
> Election type: Primary
> Voting eligible population: 1,455,013
> Vote in party contest – Democratic: 216,705
> Vote in party contest – Republican: 104,627
[in-text-ad]

32. New York
> 2016 primary election voting rate: 21.2% (16th lowest)
> Election type: Primary
> Voting eligible population: 13,638,797
> Vote in party contest – Democratic: 1,970,900
> Vote in party contest – Republican: 921,771
[recirclink id=502746]

33. North Carolina
> 2016 primary election voting rate: 31.6% (16th highest)
> Election type: Primary
> Voting eligible population: 7,266,734
> Vote in party contest – Democratic: 1,142,916
> Vote in party contest – Republican: 1,149,530
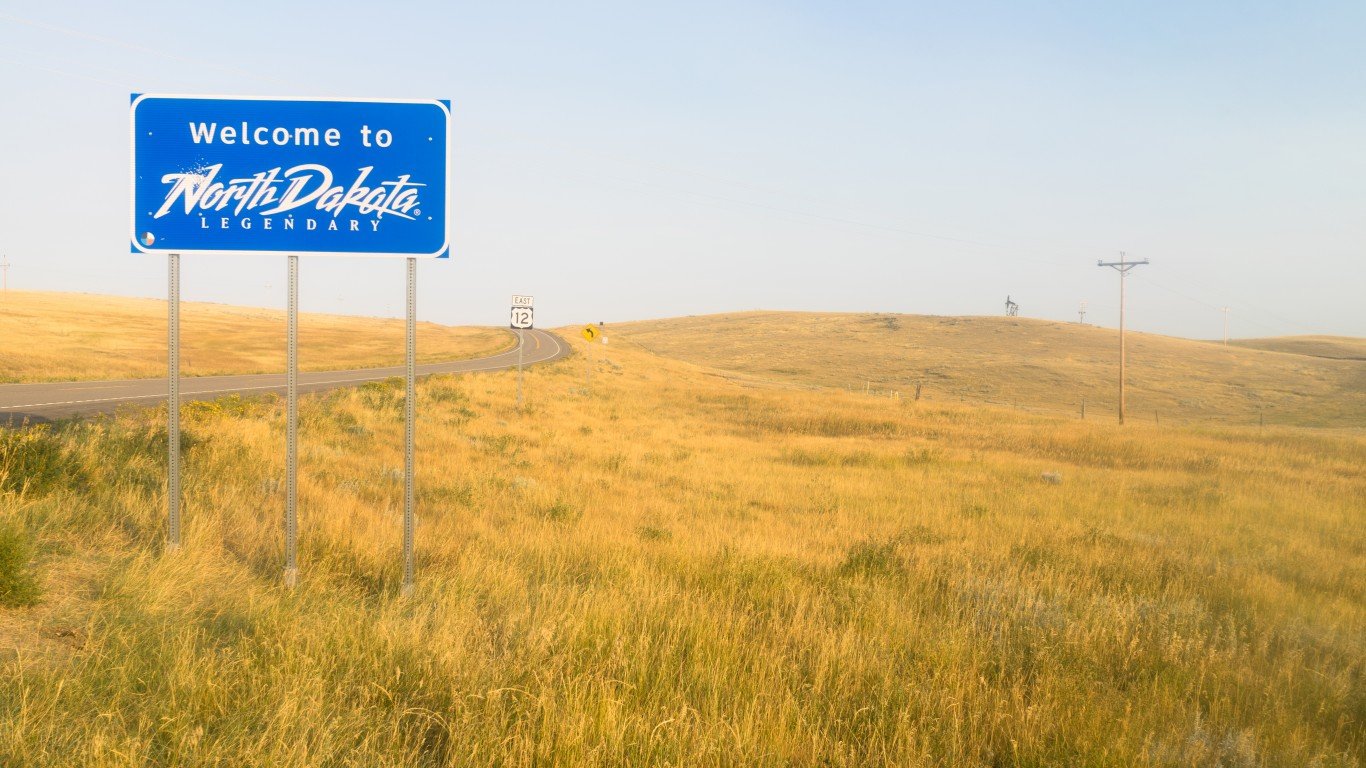
34. North Dakota
> 2016 primary election voting rate: N/A
> Election type: Caucus
> Voting eligible population: 578,789
> Vote in party contest – Democratic: 4,000
> Vote in party contest – Republican: Convention
[in-text-ad-2]

35. Ohio
> 2016 primary election voting rate: 37.5% (5th highest)
> Election type: Primary
> Voting eligible population: 8,738,019
> Vote in party contest – Democratic: 1,259,754
> Vote in party contest – Republican: 2,014,396
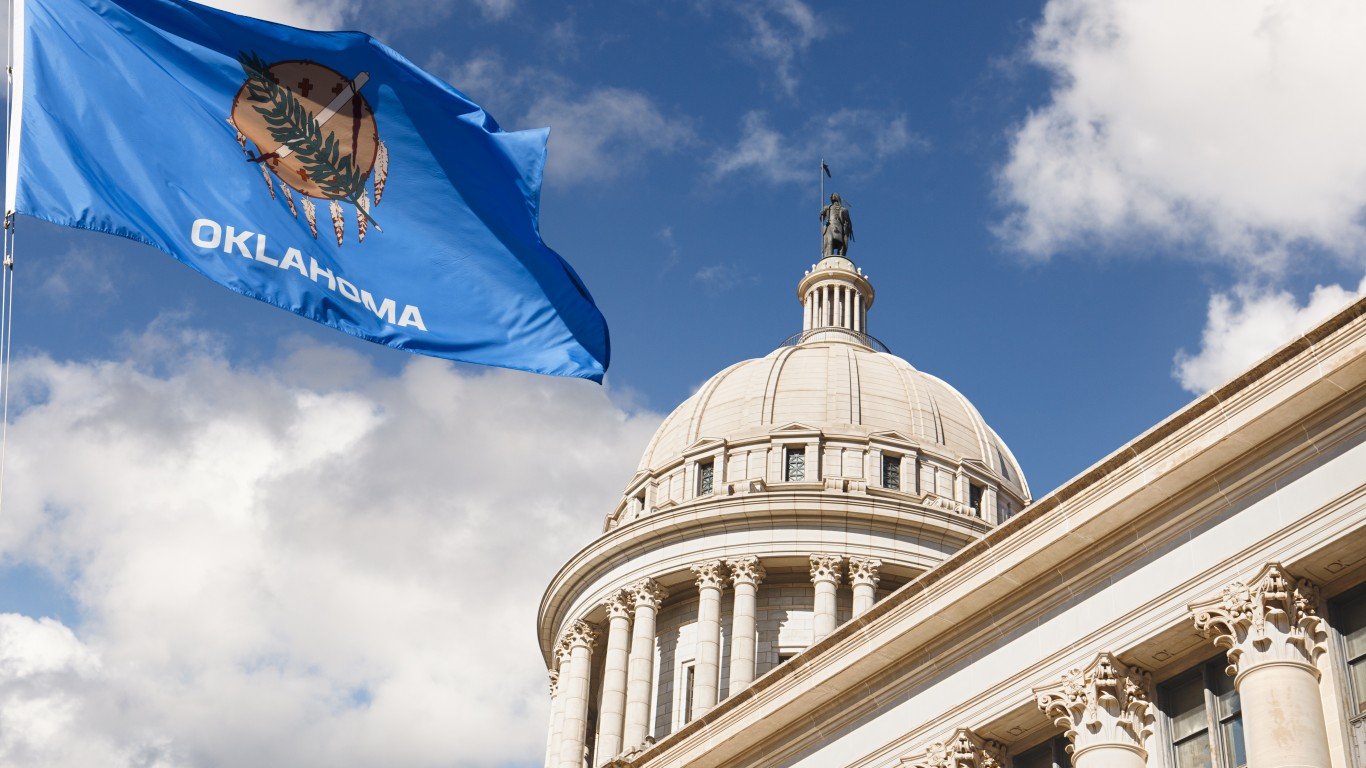
36. Oklahoma
> 2016 primary election voting rate: 28.6% (23rd highest)
> Election type: Primary
> Voting eligible population: 2,781,841
> Vote in party contest – Democratic: 335,843
> Vote in party contest – Republican: 459,922
[in-text-ad]
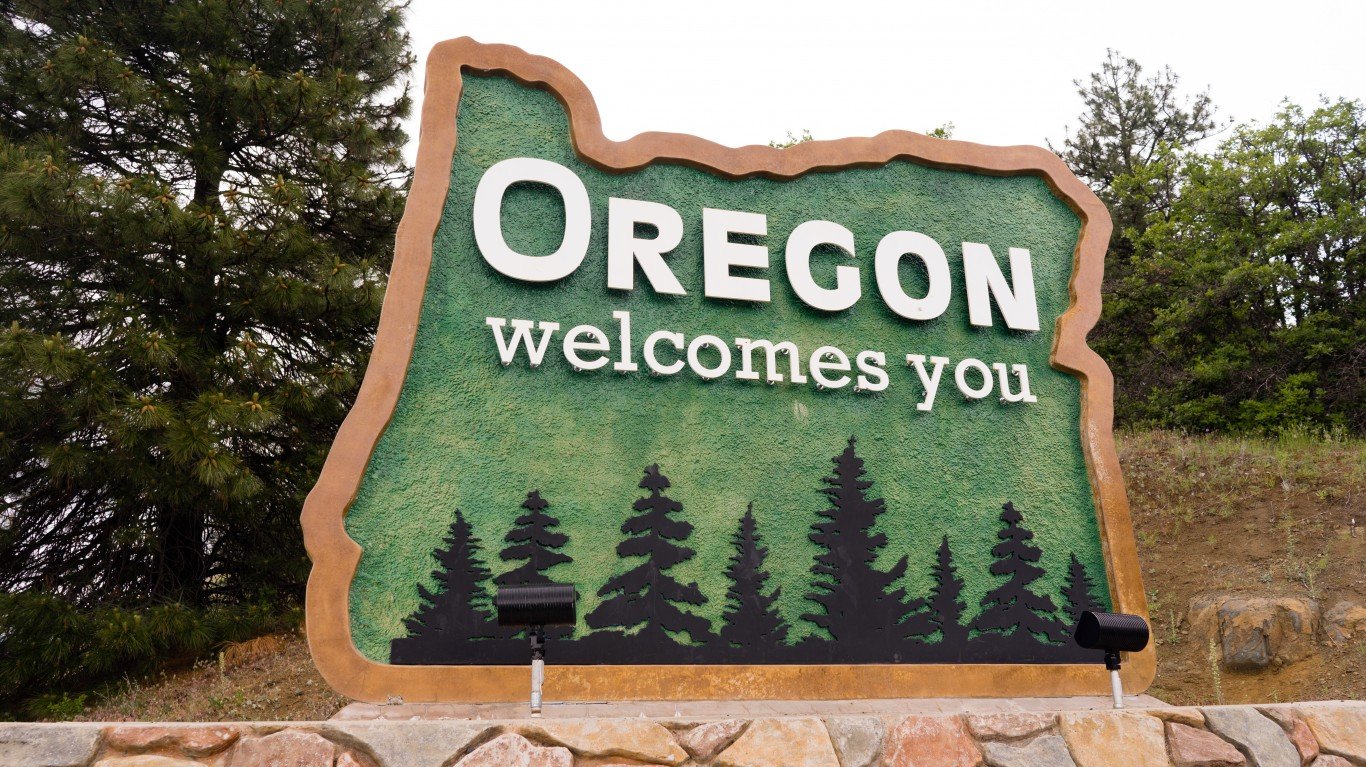
37. Oregon
> 2016 primary election voting rate: 36.0% (7th highest)
> Election type: Primary
> Voting eligible population: 2,980,345
> Vote in party contest – Democratic: 658,102
> Vote in party contest – Republican: 415,103
[recirclink id=370831]

38. Pennsylvania
> 2016 primary election voting rate: 33.7% (14th highest)
> Election type: Primary
> Voting eligible population: 9,721,843
> Vote in party contest – Democratic: 1,681,427
> Vote in party contest – Republican: 1,594,475

39. Rhode Island
> 2016 primary election voting rate: 23.6% (21st lowest)
> Election type: Primary
> Voting eligible population: 780,998
> Vote in party contest – Democratic: 122,458
> Vote in party contest – Republican: 61,614
[in-text-ad-2]

40. South Carolina
> 2016 primary election voting rate: 30.5% (18th highest)
> Election type: Primary
> Voting eligible population: 3,663,583
> Vote in party contest – Democratic: 373,063
> Vote in party contest – Republican: 745,405
41. South Dakota
> 2016 primary election voting rate: 19.9% (12th lowest)
> Election type: Primary
> Voting eligible population: 634,281
> Vote in party contest – Democratic: 53,006
> Vote in party contest – Republican: 66,879
[in-text-ad]

42. Tennessee
> 2016 primary election voting rate: 25.3% (23rd lowest)
> Election type: Primary
> Voting eligible population: 4,874,592
> Vote in party contest – Democratic: 377,222
> Vote in party contest – Republican: 855,729
[recirclink id=534854]

43. Texas
> 2016 primary election voting rate: 24.7% (22nd lowest)
> Election type: Primary
> Voting eligible population: 17,299,279
> Vote in party contest – Democratic: 1,435,895
> Vote in party contest – Republican: 2,836,488
44. Utah
> 2016 primary election voting rate: 14.3% (7th lowest)
> Election type: Caucus
> Voting eligible population: 1,963,474
> Vote in party contest – Democratic: 81,606
> Vote in party contest – Republican: 200,000
[in-text-ad-2]

45. Vermont
> 2016 primary election voting rate: 39.8% (3rd highest)
> Election type: Primary
> Voting eligible population: 495,563
> Vote in party contest – Democratic: 135,256
> Vote in party contest – Republican: 61,756

46. Virginia
> 2016 primary election voting rate: 30.1% (20th highest)
> Election type: Primary
> Voting eligible population: 6,022,089
> Vote in party contest – Democratic: 785,041
> Vote in party contest – Republican: 1,025,425
[in-text-ad]

47. Washington
> 2016 primary election voting rate: 16.0% (9th lowest)
> Election type: Primary
> Voting eligible population: 5,095,707
> Vote in party contest – Democratic: 230,000
> Vote in party contest – Republican: 587,152
[recirclink id=605544]

48. West Virginia
> 2016 primary election voting rate: 31.1% (17th highest)
> Election type: Primary
> Voting eligible population: 1,434,982
> Vote in party contest – Democratic: 242,539
> Vote in party contest – Republican: 204,061

49. Wisconsin
> 2016 primary election voting rate: 49.4% (2nd highest)
> Election type: Primary
> Voting eligible population: 4,282,271
> Vote in party contest – Democratic: 1,007,600
> Vote in party contest – Republican: 1,105,944
[in-text-ad-2]

50. Wyoming
> 2016 primary election voting rate: N/A
> Election type: Caucus
> Voting eligible population: 428,411
> Vote in party contest – Democratic: 7,000
> Vote in party contest – Republican: Convention