
[cnxvideo id=”893014″ placement=”ros”]
The U.S. unemployment rate was 3.5% in December 2019, unchanged from the multi-decade low the previous month. While it may be easier for the typical American to find a job today than it has been in decades, there are specific jobs that have unemployment rates many times higher than the national rate.
Using data from the Bureau of Labor Statistics, 24/7 Wall St. reviewed unemployment rates by occupation to identify the jobs with the worst job security. To be counted among a certain occupation, an unemployed individual needed to have held that specific job immediately prior to being unemployed.
When unemployment is high, it is often the result of weak economic conditions such as a recession. However, the U.S. economy is currently experiencing the longest period of sustained growth in its history. The high unemployment among the jobs on this list is often the result of a number of other factors.
Many jobs on this list are entry-level occupations, without stringent education or experience requirements. Such jobs, which include parking lot attendants, fast food workers, and dishwashers, tend not to pay very much or offer room for growth. As a result, the high unemployment in these professions is often likely voluntary, as people may choose to quit in order to find something better. Not all jobs with low education requirements are low paying, however. Here is a look at the highest paying jobs you can get without a college degree.
Other potential explanations for high unemployment among the jobs on this list include decreasing demand for workers due to increasing automation. While most of these jobs will continue to hire rapidly in the coming years, others, such as door-to-door sales, cashiers, and hand packagers will be in far lower demand as technological advances continue to reduce the need for personnel. Here is a list of the U.S. cities that will lose the most jobs to automation.
Click here to see the jobs with the worst job security
Click here to see the jobs with the best job security
Click here to read our methodology

34. Cooks
> Unemployment rate: 6.5% (tied – 33rd highest)
> Labor force: 2,172,000
> Median annual wage: $25,200
> Projected employment change 2018-2028: +11.3%
> Typical entry level edu. required: High school diploma or equivalent
[in-text-ad]

33. Miscellaneous community and social service specialists including health educators and community health workers
> Unemployment rate: 6.5% (tied – 33rd highest)
> Labor force: 83,000
> Median annual wage: $38,160
> Projected employment change 2018-2028: +10.6%
> Typical entry level edu. required: Bachelor’s degree
[recirclink id=598777]

32. Helpers–production workers
> Unemployment rate: 6.6% (tied – 30th highest)
> Labor force: 58,000
> Median annual wage: $27,730
> Projected employment change 2018-2028: +8.8%
> Typical entry level edu. required: High school diploma or equivalent

31. Bakers
> Unemployment rate: 6.6% (tied – 30th highest)
> Labor force: 244,000
> Median annual wage: $26,520
> Projected employment change 2018-2028: +5.8%
> Typical entry level edu. required: No formal educational credential
[in-text-ad-2]

30. Logging workers
> Unemployment rate: 6.6% (tied – 30th highest)
> Labor force: 71,000
> Median annual wage: $40,650
> Projected employment change 2018-2028: -13.9%
> Typical entry level edu. required: High school diploma or equivalent

29. Roofers
> Unemployment rate: 6.7% (tied – 27th highest)
> Labor force: 238,000
> Median annual wage: $39,970
> Projected employment change 2018-2028: +11.8%
> Typical entry level edu. required: No formal educational credential
[in-text-ad]

28. Door-to-door sales workers, news and street vendors, and related workers
> Unemployment rate: 6.7% (tied – 27th highest)
> Labor force: 145,000
> Median annual wage: $26,430
> Projected employment change 2018-2028: -7.2%
> Typical entry level edu. required: No formal educational credential
[recirclink id=638383]

27. Stock clerks and order fillers
> Unemployment rate: 6.7% (tied – 27th highest)
> Labor force: 1,620,000
> Median annual wage: $25,700
> Projected employment change 2018-2028: +1.7%
> Typical entry level edu. required: High school diploma or equivalent

26. Laborers and freight, stock, and material movers, hand
> Unemployment rate: 6.8% (tied – 23rd highest)
> Labor force: 2,398,000
> Median annual wage: $28,260
> Projected employment change 2018-2028: +4.9%
> Typical entry level edu. required: No formal educational credential
[in-text-ad-2]

25. Brickmasons, blockmasons, and stonemasons
> Unemployment rate: 6.8% (tied – 23rd highest)
> Labor force: 163,000
> Median annual wage: $49,450
> Projected employment change 2018-2028: +9.6%
> Typical entry level edu. required: High school diploma or equivalent

24. Baggage porters, bellhops, and concierges
> Unemployment rate: 6.8% (tied – 23rd highest)
> Labor force: 99,000
> Median annual wage: $26,850
> Projected employment change 2018-2028: +5.7%
> Typical entry level edu. required: High school diploma or equivalent
[in-text-ad]

23. Food preparation workers
> Unemployment rate: 6.8% (tied – 23rd highest)
> Labor force: 1,157,000
> Median annual wage: $23,730
> Projected employment change 2018-2028: +8.2%
> Typical entry level edu. required: No formal educational credential
[recirclink id=570279]

22. Combined food preparation and serving workers, including fast food
> Unemployment rate: 6.9% (22nd highest)
> Labor force: 400,000
> Median annual wage: $21,250
> Projected employment change 2018-2028: +17.3%
> Typical entry level edu. required: No formal educational credential

21. Parking lot attendants
> Unemployment rate: 7.0% (21st highest)
> Labor force: 89,000
> Median annual wage: $23,870
> Projected employment change 2018-2028: +0.1%
> Typical entry level edu. required: No formal educational credential
[in-text-ad-2]

20. Cabinetmakers and bench carpenters
> Unemployment rate: 7.2% (20th highest)
> Labor force: 70,000
> Median annual wage: $34,740
> Projected employment change 2018-2028: -0.3%
> Typical entry level edu. required: High school diploma or equivalent

19. Cashiers
> Unemployment rate: 7.3% (19th highest)
> Labor force: 3,412,000
> Median annual wage: $22,440
> Projected employment change 2018-2028: -3.8%
> Typical entry level edu. required: No formal educational credential
[in-text-ad]

18. Cleaners of vehicles and equipment
> Unemployment rate: 7.4% (18th highest)
> Labor force: 371,000
> Median annual wage: $24,530
> Projected employment change 2018-2028: +6.0%
> Typical entry level edu. required: No formal educational credential
[recirclink id=577593]

17. Packaging and filling machine operators and tenders
> Unemployment rate: 7.5% (tied – 14th highest)
> Labor force: 283,000
> Median annual wage: $30,160
> Projected employment change 2018-2028: +1.3%
> Typical entry level edu. required: High school diploma or equivalent

16. Construction laborers
> Unemployment rate: 7.5% (tied – 14th highest)
> Labor force: 2,218,000
> Median annual wage: $35,800
> Projected employment change 2018-2028: +10.5%
> Typical entry level edu. required: No formal educational credential
[in-text-ad-2]

15. Grounds maintenance workers
> Unemployment rate: 7.5% (tied – 14th highest)
> Labor force: 1,377,000
> Median annual wage: $29,400
> Projected employment change 2018-2028: +8.8%
> Typical entry level edu. required: No formal educational credential

14. Dining room and cafeteria attendants and bartender helpers
> Unemployment rate: 7.5% (tied – 14th highest)
> Labor force: 365,000
> Median annual wage: $22,270
> Projected employment change 2018-2028: +9.7%
> Typical entry level edu. required: No formal educational credential
[in-text-ad]

13. Cement masons, concrete finishers, and terrazzo workers
> Unemployment rate: 7.6% (tied – 12th highest)
> Labor force: 70,000
> Median annual wage: $43,000
> Projected employment change 2018-2028: +11.1%
> Typical entry level edu. required: N/A
[recirclink id=571898]

12. Insulation workers
> Unemployment rate: 7.6% (tied – 12th highest)
> Labor force: 64,000
> Median annual wage: $41,910
> Projected employment change 2018-2028: +5.3%
> Typical entry level edu. required: N/A

11. Tax examiners and collectors, and revenue agents
> Unemployment rate: 7.9% (11th highest)
> Labor force: 58,000
> Median annual wage: $54,440
> Projected employment change 2018-2028: -2.4%
> Typical entry level edu. required: Bachelor’s degree
[in-text-ad-2]

10. Packers and packagers, hand
> Unemployment rate: 8.1% (10th highest)
> Labor force: 683,000
> Median annual wage: $24,580
> Projected employment change 2018-2028: -3.5%
> Typical entry level edu. required: No formal educational credential

9. Miscellaneous entertainment attendants and related workers
> Unemployment rate: 8.4% (9th highest)
> Labor force: 229,000
> Median annual wage: $22,420
> Projected employment change 2018-2028: +7.5%
> Typical entry level edu. required: High school diploma or equivalent
[in-text-ad]

8. Tax preparers
> Unemployment rate: 9.0% (8th highest)
> Labor force: 107,000
> Median annual wage: $39,390
> Projected employment change 2018-2028: +5.6%
> Typical entry level edu. required: High school diploma or equivalent
[recirclink id=577594]
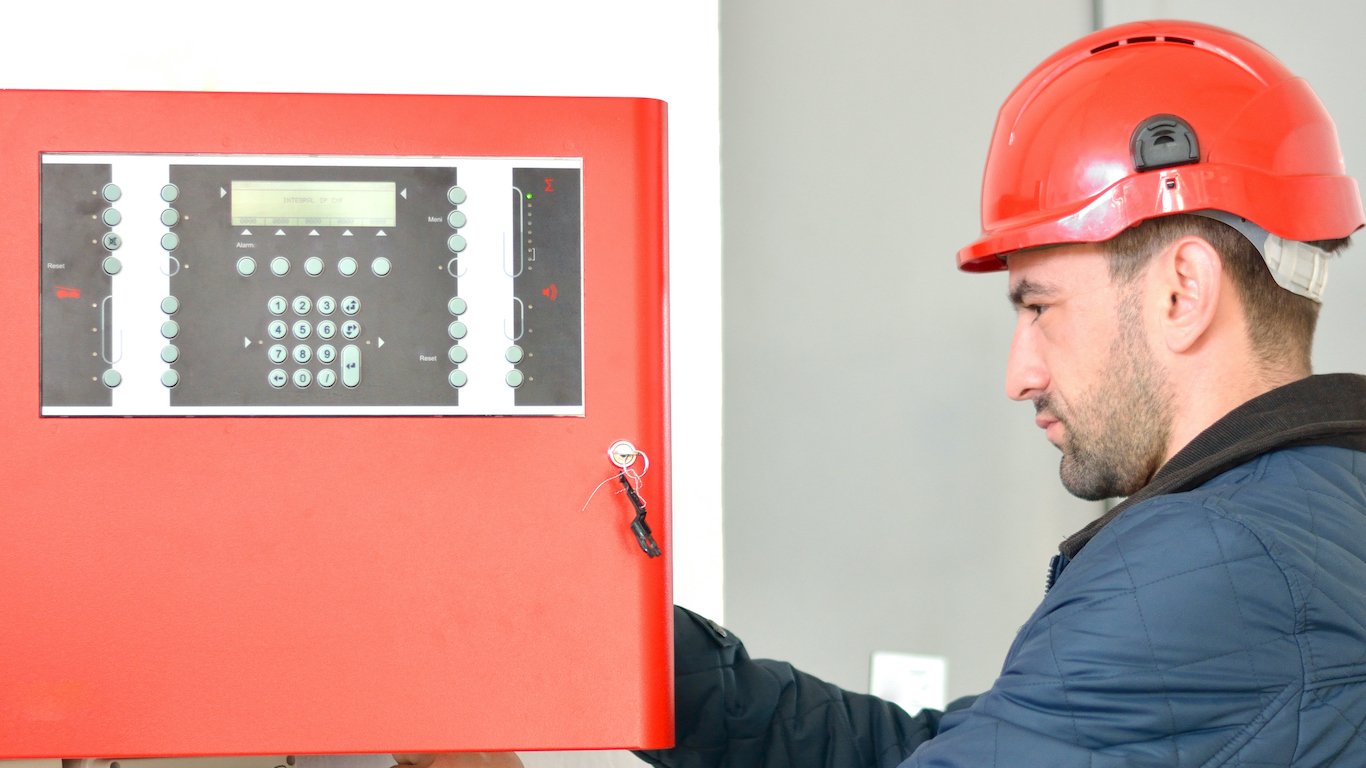
7. Security and fire alarm systems installers
> Unemployment rate: 9.1% (7th highest)
> Labor force: 64,000
> Median annual wage: $47,190
> Projected employment change 2018-2028: +11.2%
> Typical entry level edu. required: High school diploma or equivalent

6. Miscellaneous agricultural workers
> Unemployment rate: 9.8% (6th highest)
> Labor force: 960,000
> Median annual wage: $24,600
> Projected employment change 2018-2028: +1.2%
> Typical entry level edu. required: No formal educational credential
[in-text-ad-2]

5. Lifeguards and other recreational, and all other protective service workers
> Unemployment rate: 10.9% (5th highest)
> Labor force: 156,000
> Median annual wage: $22,410
> Projected employment change 2018-2028: +7.0%
> Typical entry level edu. required: No formal educational credential

4. Dishwashers
> Unemployment rate: 11.0% (4th highest)
> Labor force: 297,000
> Median annual wage: $22,730
> Projected employment change 2018-2028: +3.3%
> Typical entry level edu. required: No formal educational credential
[in-text-ad]

3. Helpers, construction trades
> Unemployment rate: 13.8% (3rd highest)
> Labor force: 58,000
> Median annual wage: $31,200
> Projected employment change 2018-2028: +10.5%
> Typical entry level edu. required: No formal educational credential
[recirclink id=637298]

2. Graders and sorters, agricultural products
> Unemployment rate: 14.0% (2nd highest)
> Labor force: 102,000
> Median annual wage: $24,430
> Projected employment change 2018-2028: -1.5%
> Typical entry level edu. required: No formal educational credential

1. Crossing guards
> Unemployment rate: 18.7% (the highest)
> Labor force: 64,000
> Median annual wage: $28,960
> Projected employment change 2018-2028: +5.6%
> Typical entry level edu. required: No formal educational credential
Methodology
To identify the 34 jobs with the worst job security, 24/7 Wall St. reviewed 2018 unemployment rates for 330 occupations from the Bureau of Labor Statistics. We only considered occupations with a labor force of 50,000 or more. Unemployed members of an occupational labor force need to have been last employed in this occupation prior to unemployment.
Data on projected job growth from 2018 to 2028 and the typical entry-level education requirement for each occupation came from the BLS Employment Projections program. Data on median annual wage came from the BLS Occupational Employment Statistics program and are current as of May 2018. Annual wages exclude part-time workers in a given profession. Occupations that represent the remainder of a broader classification, defined by the BLS as “all other,” were excluded from our analysis.
Data on median annual wage, 10-year projected job growth, and typical educational attainment required were not always available from the BLS for the exact job listed. We used the data for the closest matching occupational categories in some of those cases when possible.
Contact [email protected] for any questions or corrections.