[cnxvideo id=”1068408″ placement=”ros”]
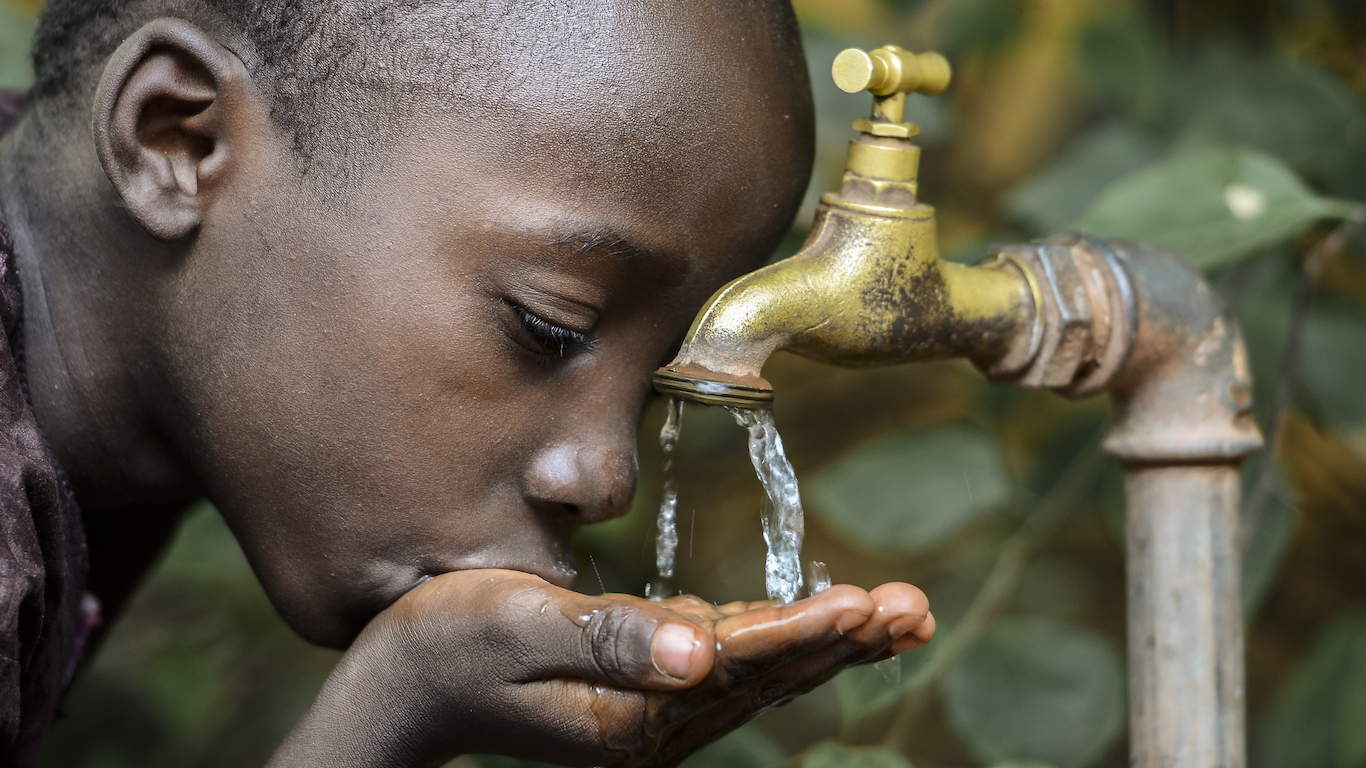
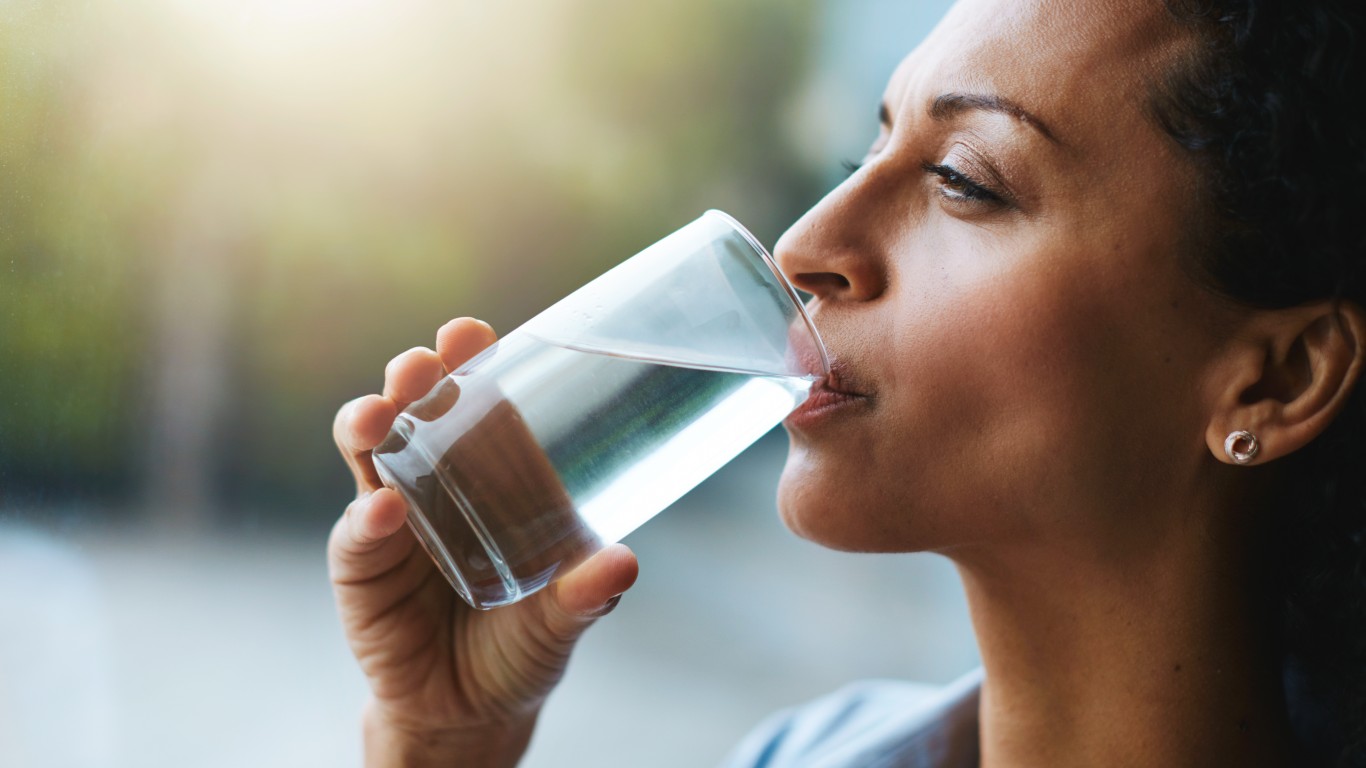
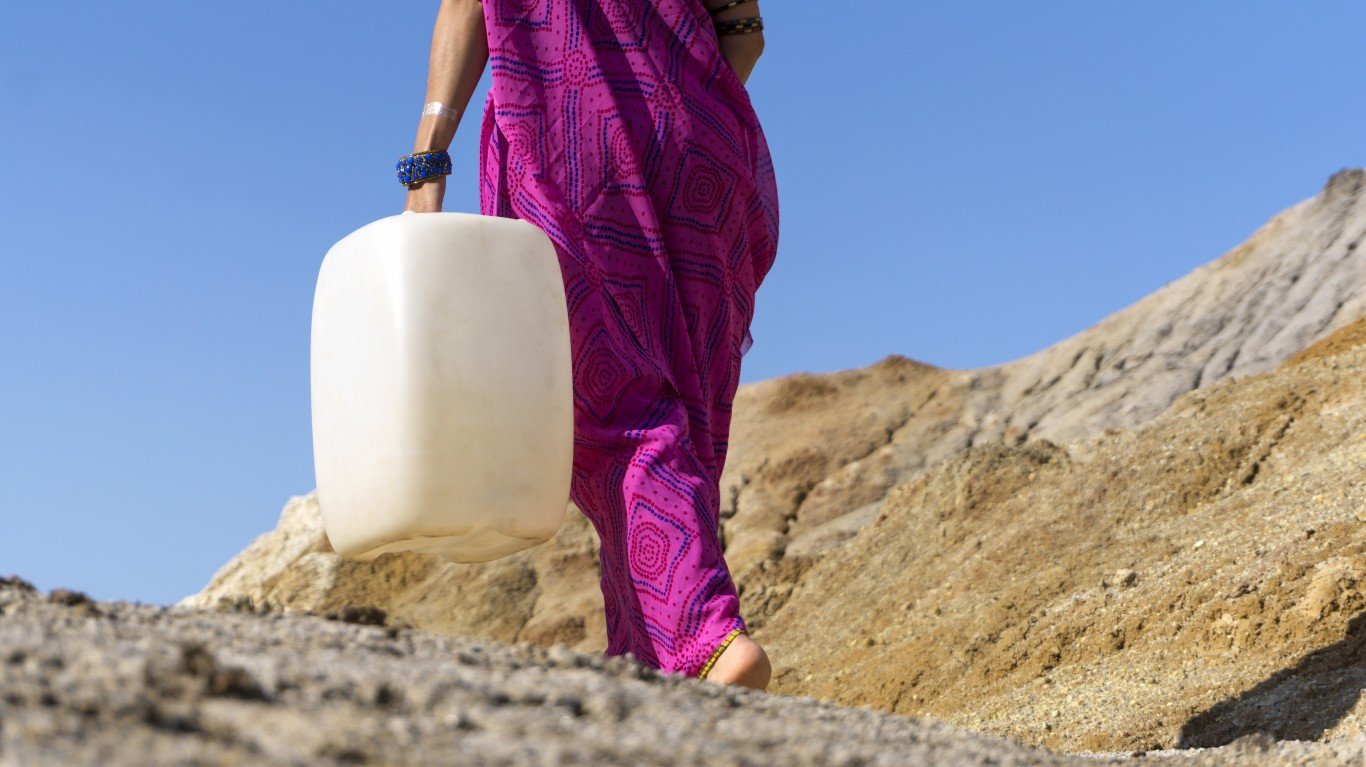
In the midst of the coronavirus pandemic, hand washing is more important than ever as one of the most accessible and most effective ways for ordinary people to combat the outbreak. Even at the best of times, safe and reliable access to water is essential for health.
While easy to take for granted in many affected regions, billions of people around the world do not have reliable access to clean drinking water.
In fact, in the countries with available data, approximately 1.6 billion people in 2017 lacked access to facilities with water and soap, and 1.4 billion people had no access at all to a hand washing facility.
24/7 Tempo reviewed household survey data in “Progress on household drinking water, sanitation and hygiene 2000-2017,” a report produced jointly by UNICEF and the World Health Organization. Our ranking is based on the percentage of a country’s population with access to at least basic drinking water services. We only included the 29 countries for which just two-thirds of the population or less had access to drinking water.
Click here to read our full methodology.
Click here to see the countries with the worst access to drinking water.
29. Afghanistan
> Population in 2017: 35,530,000
> Pop. with at least basic drinking water services: 67.0%
> With limited access (round trip of 30 mins +): 3.0%
> With water unimproved by sanitation processes: 19.0%
> Relying on surface water: 11.0%
> Pct. urban pop. in 2017: 25.0%
> GDP per capita: $1,735
[in-text-ad]
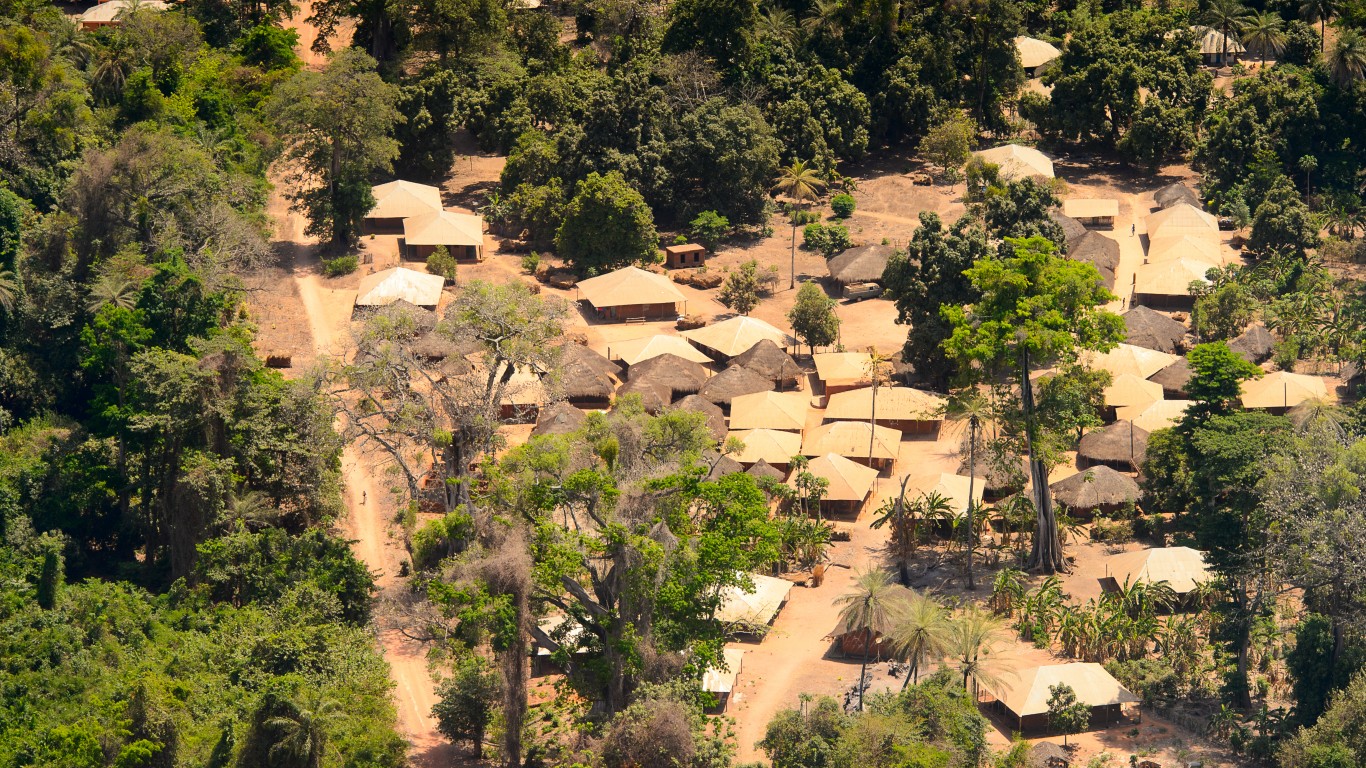
28. Guinea-Bissau
> Population in 2017: 1,861,000
> Pop. with at least basic drinking water services: 67.0%
> With limited access (round trip of 30 mins +): 7.0%
> With water unimproved by sanitation processes: 26.0%
> Relying on surface water: Not available
> Pct. urban pop. in 2017: 43.0%
> GDP per capita: $1,596
[recirclink id=591001]
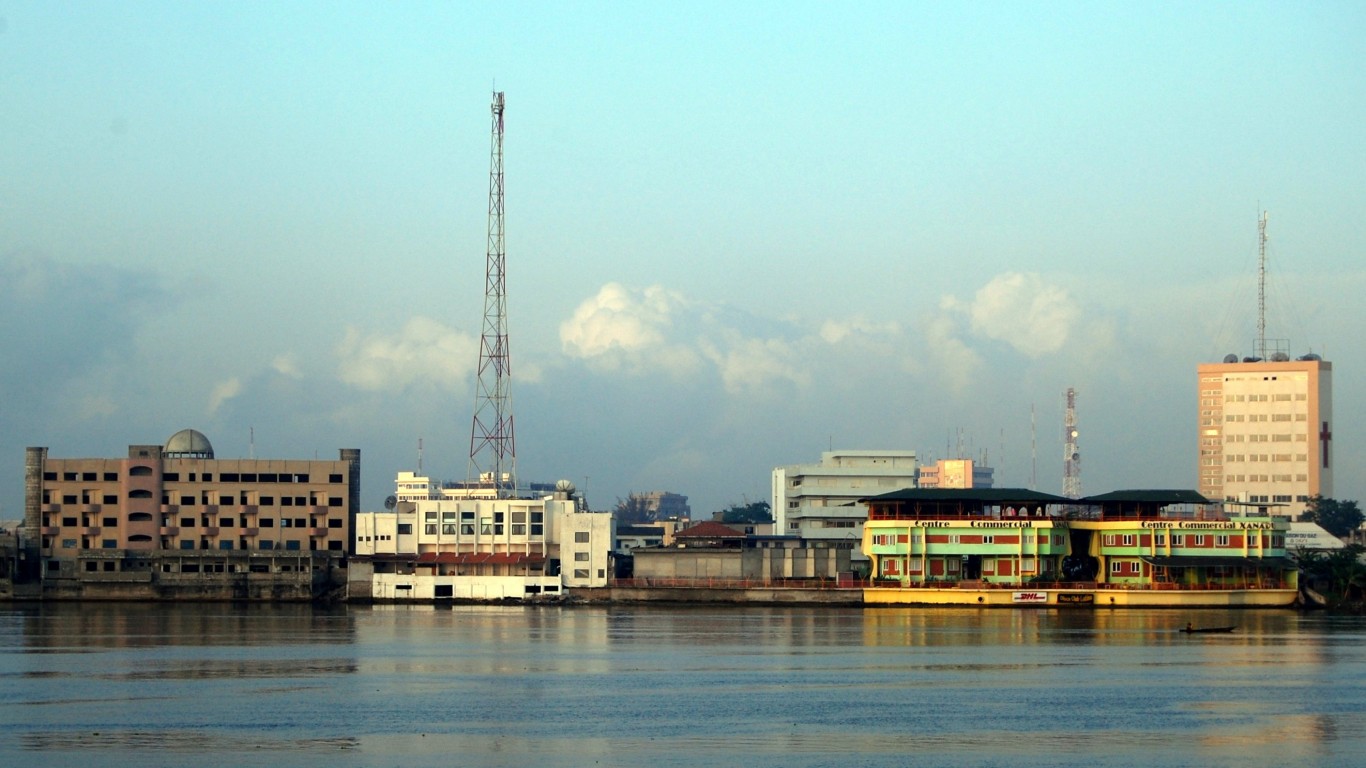
27. Benin
> Population in 2017: 11,176,000
> Pop. with at least basic drinking water services: 66.0%
> With limited access (round trip of 30 mins +): 10.0%
> With water unimproved by sanitation processes: 20.0%
> Relying on surface water: 4.0%
> Pct. urban pop. in 2017: 47.0%
> GDP per capita: $2,152
26. Togo
> Population in 2017: 7,798,000
> Pop. with at least basic drinking water services: 65.0%
> With limited access (round trip of 30 mins +): 6.0%
> With water unimproved by sanitation processes: 16.0%
> Relying on surface water: 13.0%
> Pct. urban pop. in 2017: 41.0%
> GDP per capita: $1,574
[in-text-ad-2]
25. Haiti
> Population in 2017: 10,981,000
> Pop. with at least basic drinking water services: 65.0%
> With limited access (round trip of 30 mins +): 10.0%
> With water unimproved by sanitation processes: 25.0%
> Relying on surface water: Not available
> Pct. urban pop. in 2017: 54.0%
> GDP per capita: $1,656
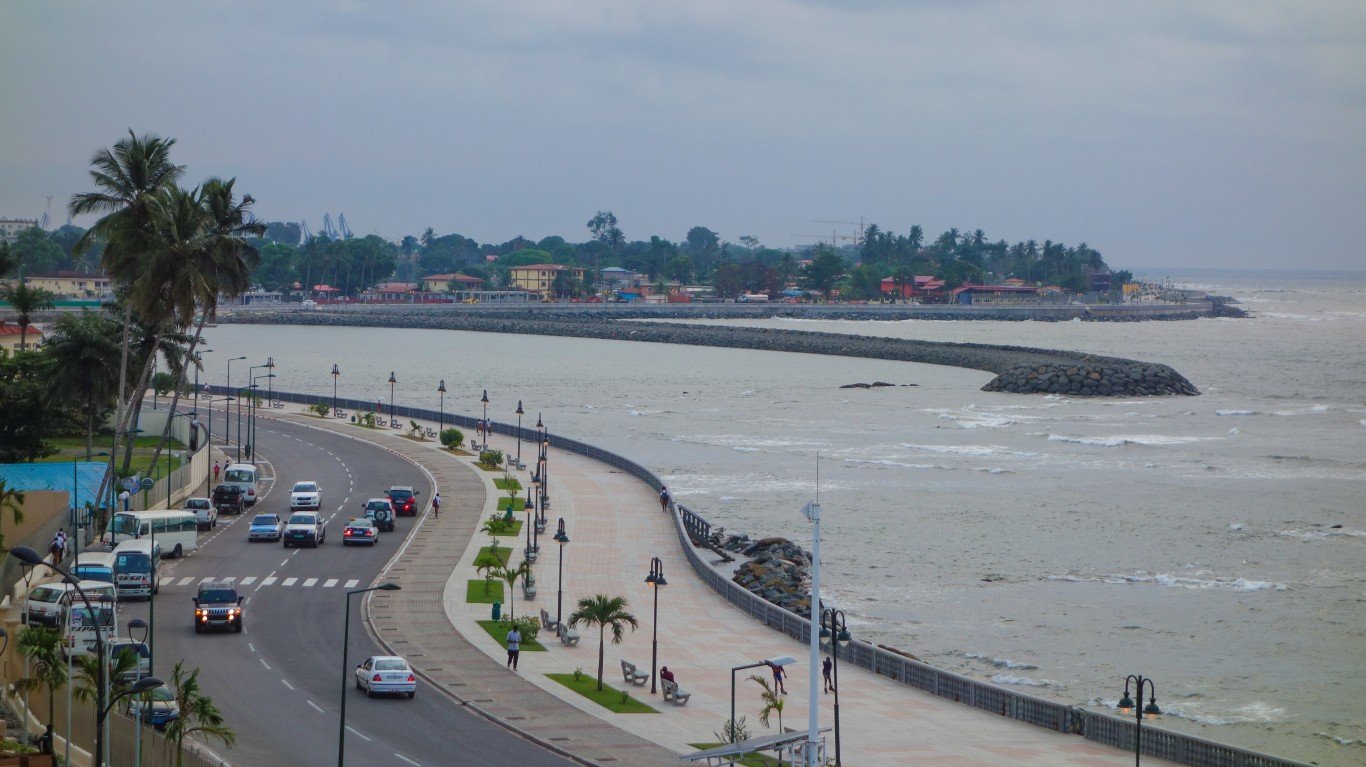
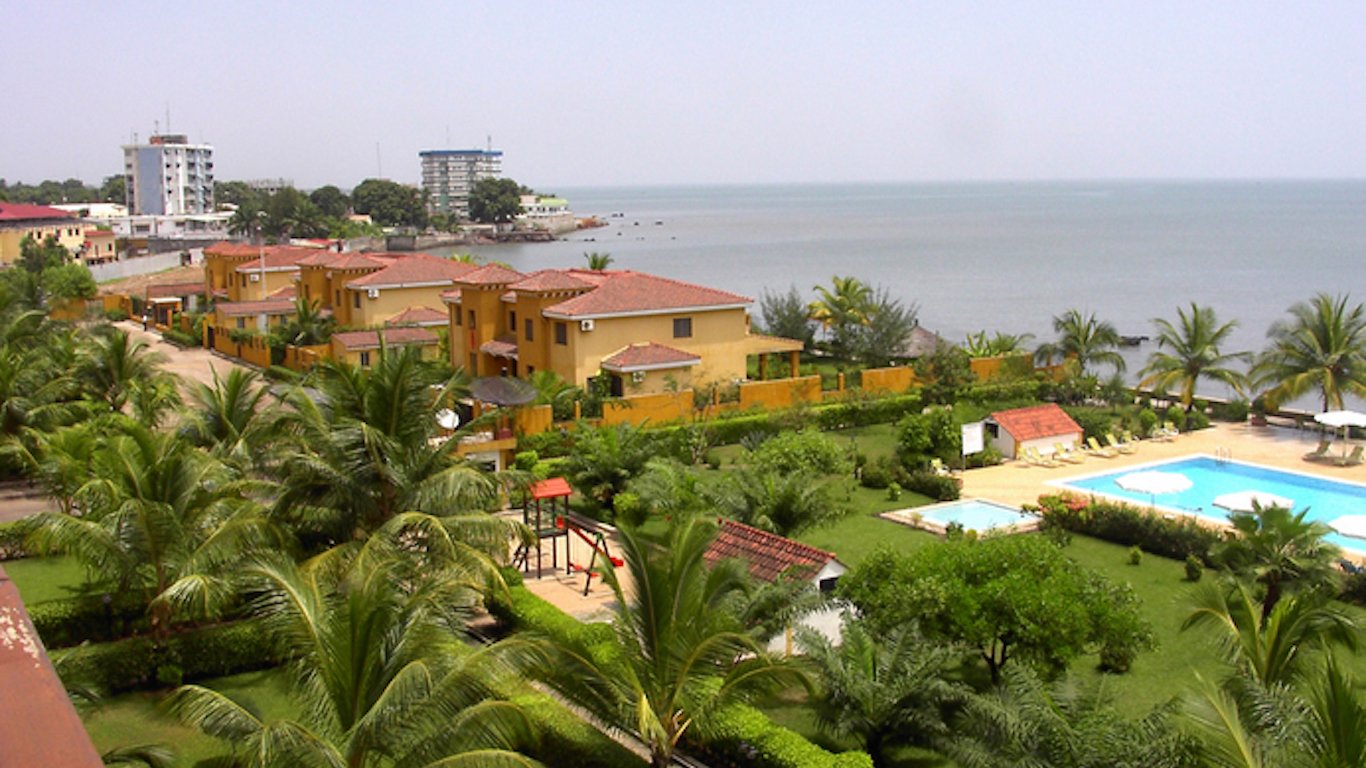
24. Equatorial Guinea
> Population in 2017: 1,268,000
> Pop. with at least basic drinking water services: 65.0%
> With limited access (round trip of 30 mins +): 3.0%
> With water unimproved by sanitation processes: 26.0%
> Relying on surface water: 6.0%
> Pct. urban pop. in 2017: 72.0%
> GDP per capita: $20,181
[in-text-ad]
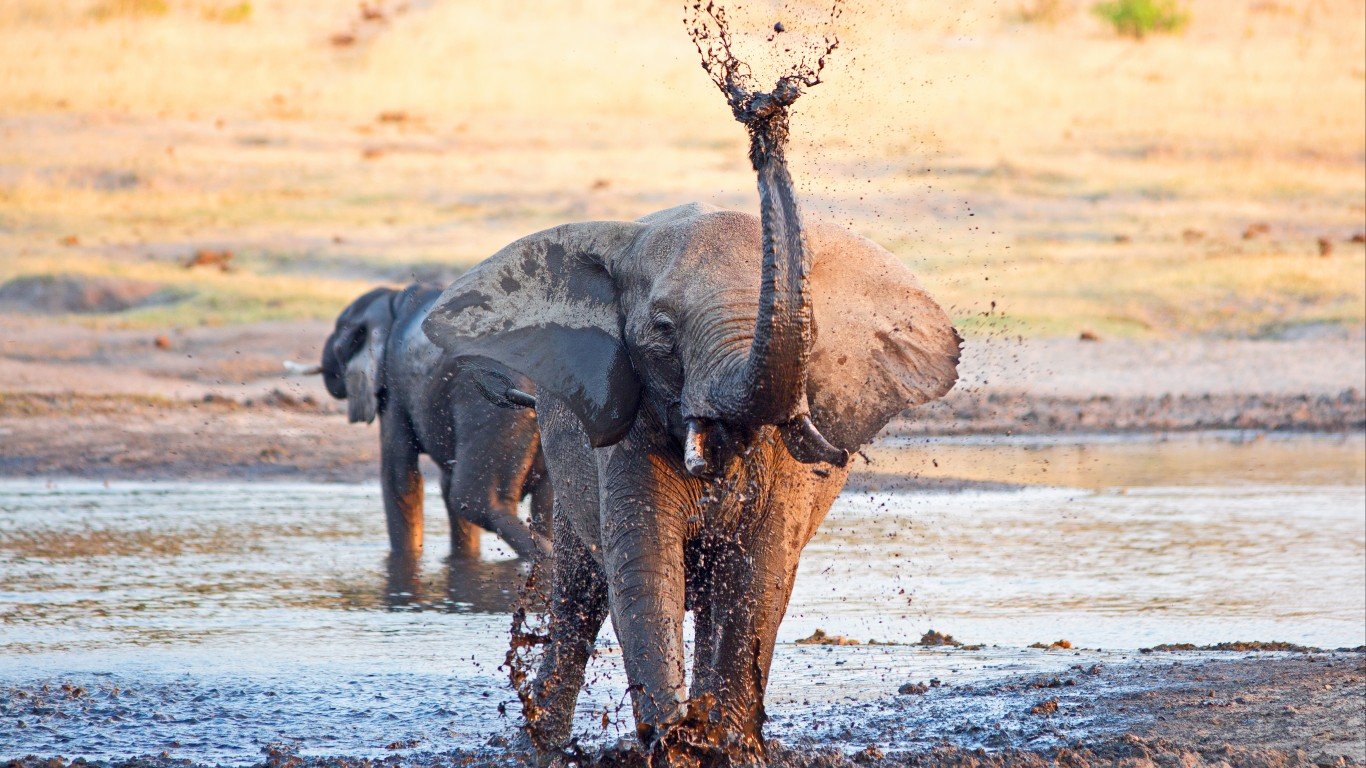
23. Zimbabwe
> Population in 2017: 16,530,000
> Pop. with at least basic drinking water services: 64.0%
> With limited access (round trip of 30 mins +): 13.0%
> With water unimproved by sanitation processes: 16.0%
> Relying on surface water: 7.0%
> Pct. urban pop. in 2017: 32.0%
> GDP per capita: $2,688
[recirclink id=524575]
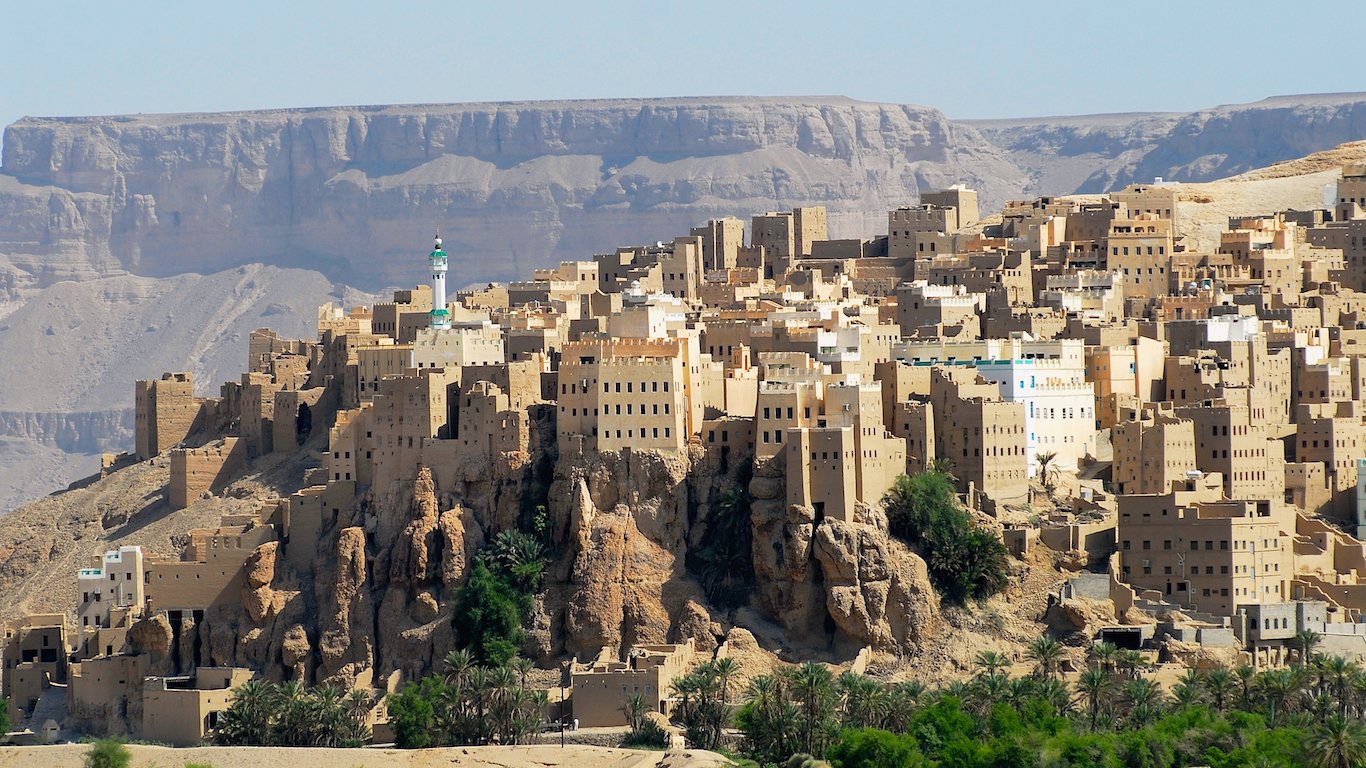
22. Yemen, Rep.
> Population in 2017: 28,250,000
> Pop. with at least basic drinking water services: 63.0%
> With limited access (round trip of 30 mins +): 29.0%
> With water unimproved by sanitation processes: 4.0%
> Relying on surface water: 4.0%
> Pct. urban pop. in 2017: 36.0%
> GDP per capita: $2,285
21. Guinea
> Population in 2017: 12,717,000
> Pop. with at least basic drinking water services: 62.0%
> With limited access (round trip of 30 mins +): 18.0%
> With water unimproved by sanitation processes: 9.0%
> Relying on surface water: 11.0%
> Pct. urban pop. in 2017: 36.0%
> GDP per capita: $2,223
[in-text-ad-2]
20. Burundi
> Population in 2017: 10,864,000
> Pop. with at least basic drinking water services: 61.0%
> With limited access (round trip of 30 mins +): 20.0%
> With water unimproved by sanitation processes: 15.0%
> Relying on surface water: 5.0%
> Pct. urban pop. in 2017: 13.0%
> GDP per capita: $660
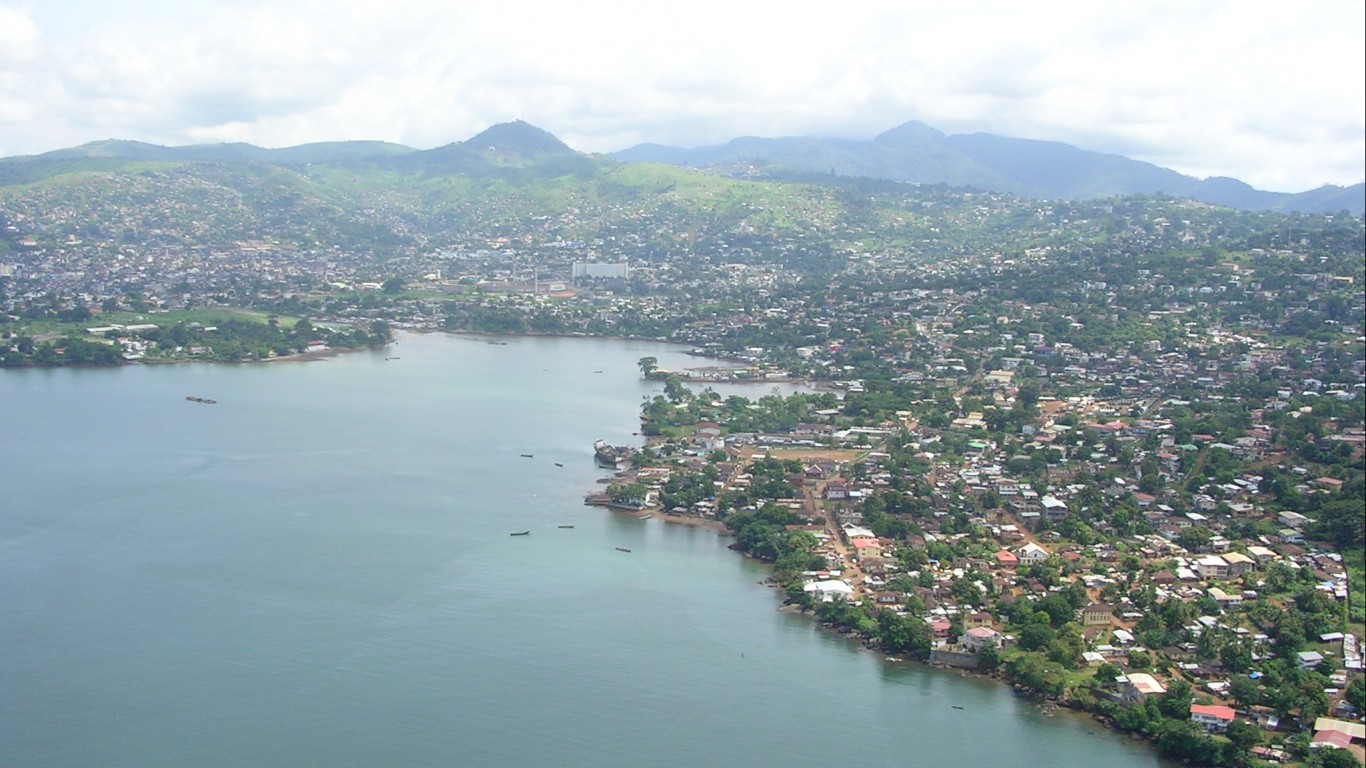
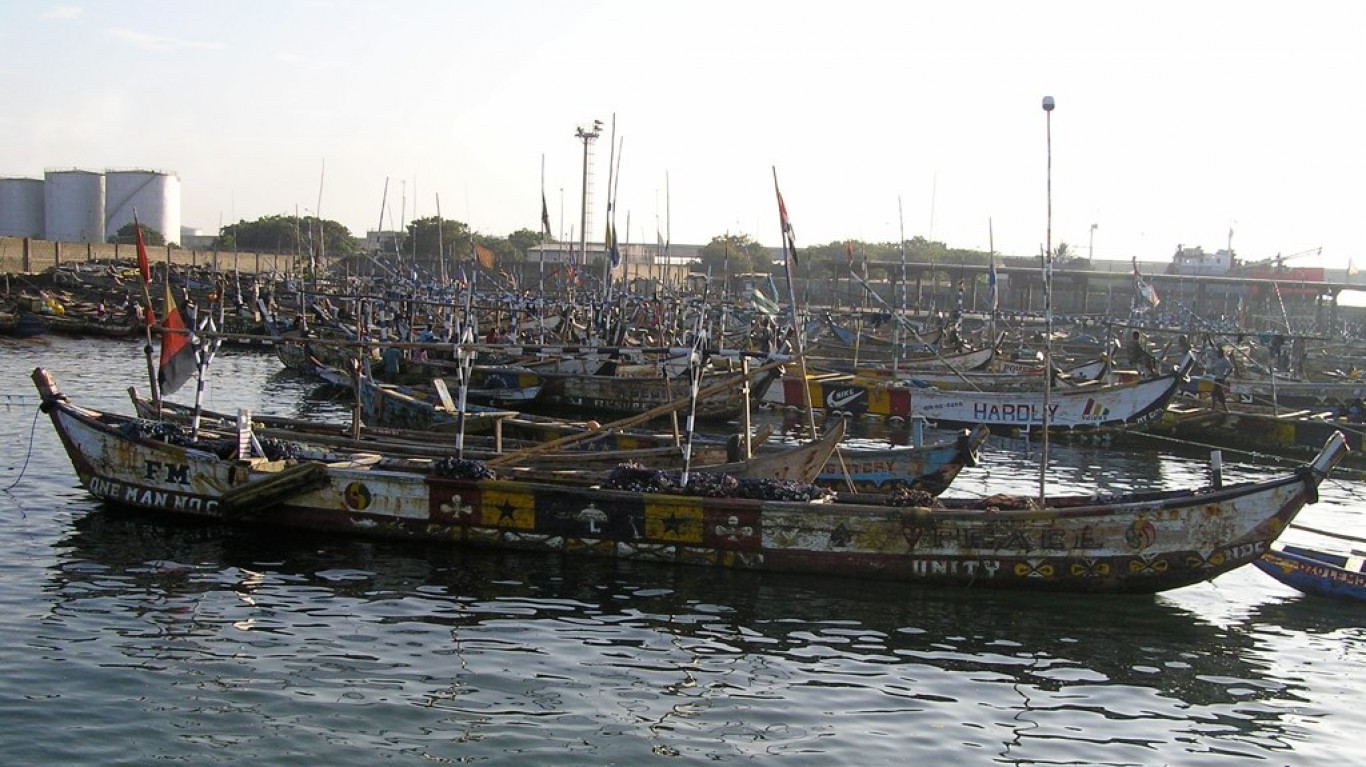
19. Sierra Leone
> Population in 2017: 7,557,000
> Pop. with at least basic drinking water services: 61.0%
> With limited access (round trip of 30 mins +): 9.0%
> With water unimproved by sanitation processes: 16.0%
> Relying on surface water: 14.0%
> Pct. urban pop. in 2017: 42.0%
> GDP per capita: $1,421
[in-text-ad]
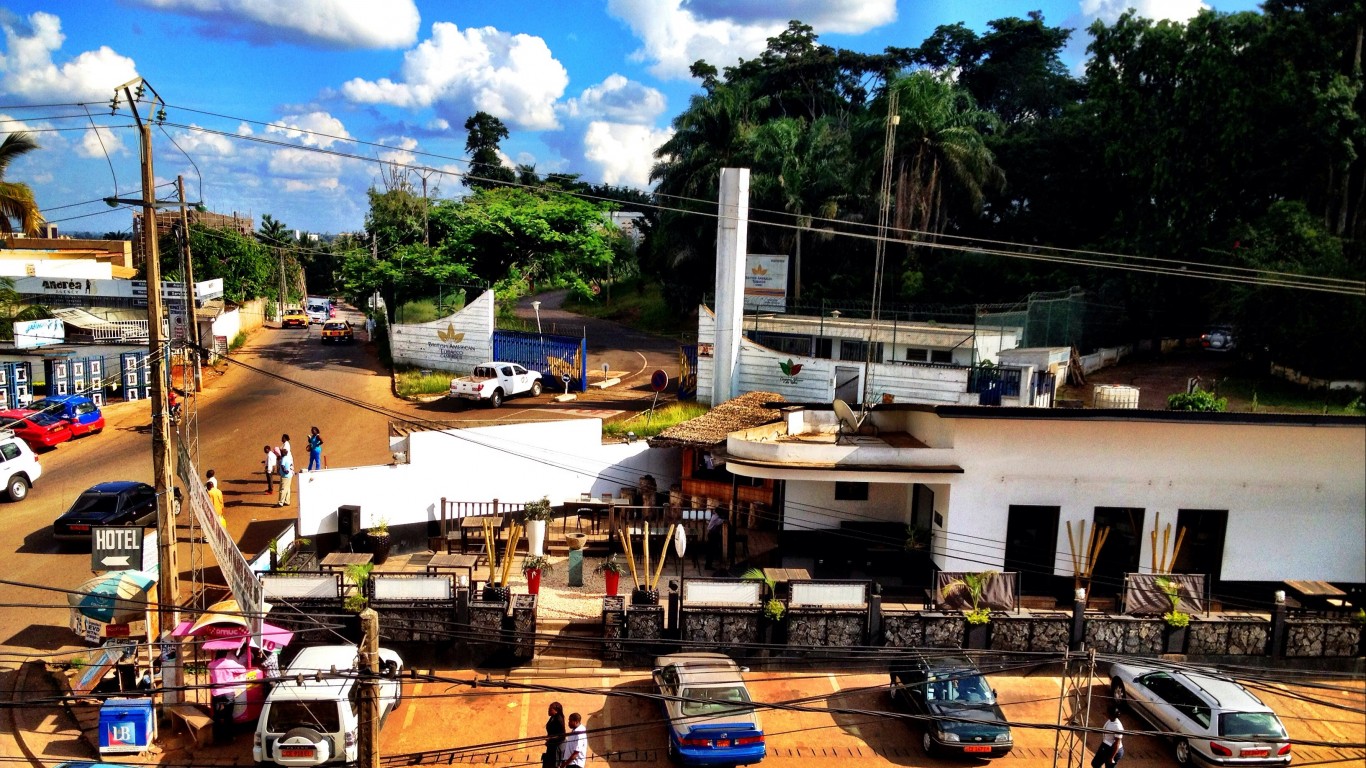
18. Cameroon
> Population in 2017: 24,054,000
> Pop. with at least basic drinking water services: 60.0%
> With limited access (round trip of 30 mins +): 16.0%
> With water unimproved by sanitation processes: 16.0%
> Relying on surface water: 7.0%
> Pct. urban pop. in 2017: 56.0%
> GDP per capita: $3,359
[recirclink id=551105]
17. Zambia
> Population in 2017: 17,094,000
> Pop. with at least basic drinking water services: 60.0%
> With limited access (round trip of 30 mins +): 8.0%
> With water unimproved by sanitation processes: 24.0%
> Relying on surface water: 9.0%
> Pct. urban pop. in 2017: 43.0%
> GDP per capita: $3,748
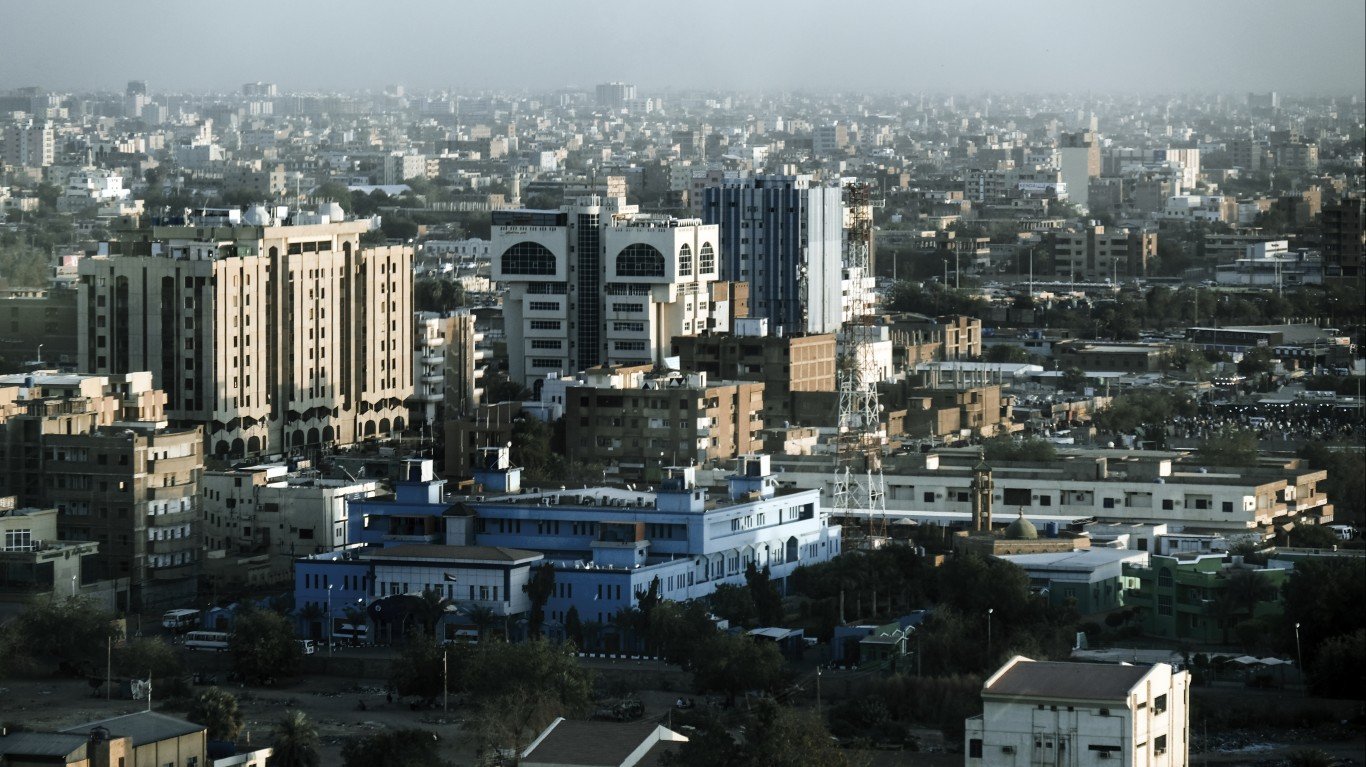
16. Sudan
> Population in 2017: 40,533,000
> Pop. with at least basic drinking water services: 60.0%
> With limited access (round trip of 30 mins +): 27.0%
> With water unimproved by sanitation processes: 4.0%
> Relying on surface water: 9.0%
> Pct. urban pop. in 2017: 34.0%
> GDP per capita: $4,436
[in-text-ad-2]
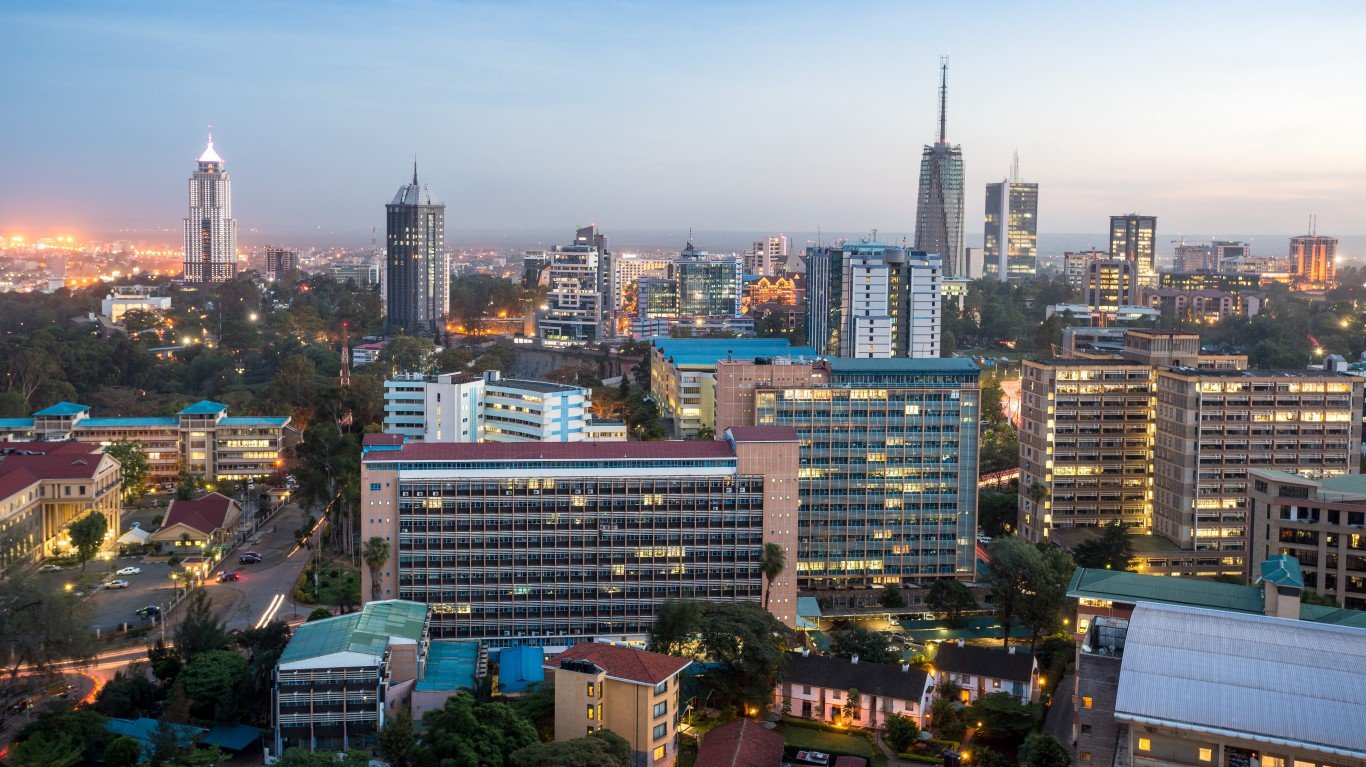
15. Kenya
> Population in 2017: 49,700,000
> Pop. with at least basic drinking water services: 59.0%
> With limited access (round trip of 30 mins +): 9.0%
> With water unimproved by sanitation processes: 12.0%
> Relying on surface water: 20.0%
> Pct. urban pop. in 2017: 27.0%
> GDP per capita: $3,077
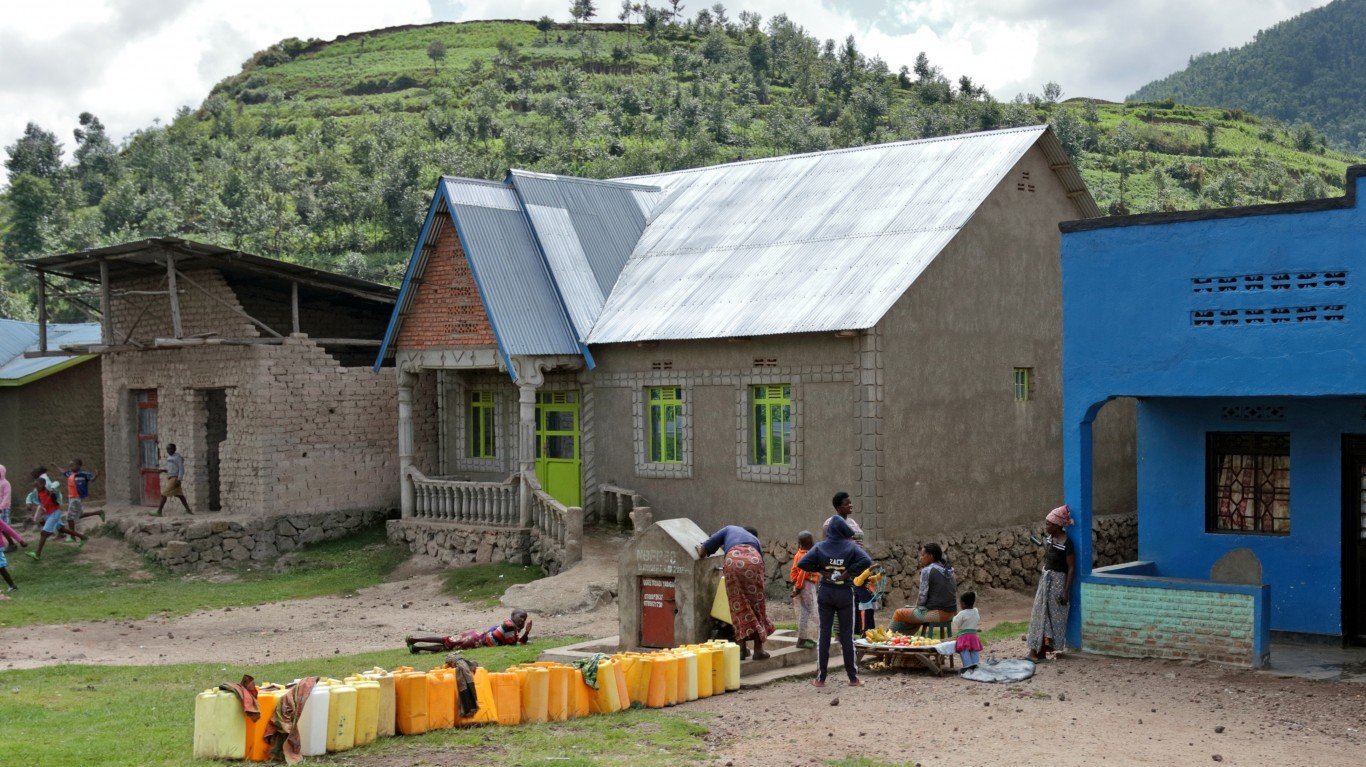
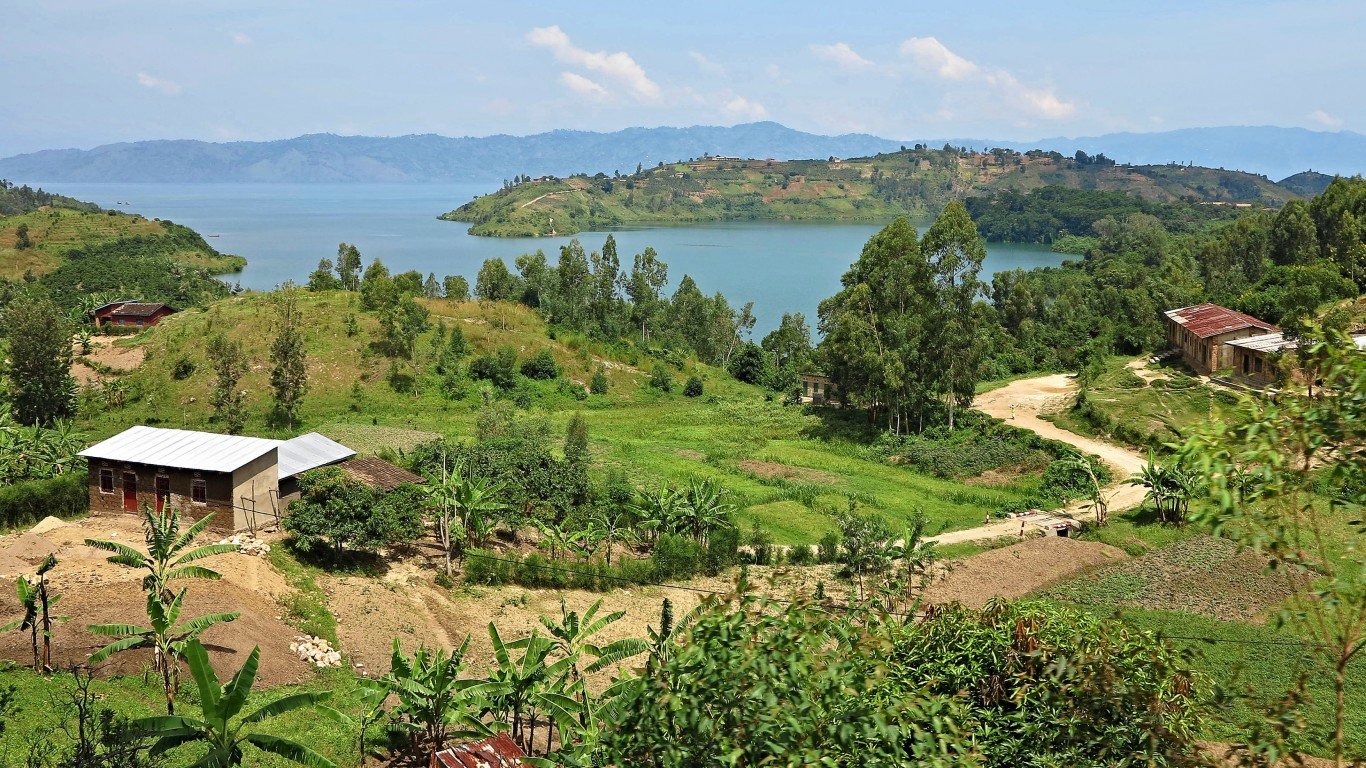
14. Rwanda
> Population in 2017: 12,208,000
> Pop. with at least basic drinking water services: 58.0%
> With limited access (round trip of 30 mins +): 22.0%
> With water unimproved by sanitation processes: 14.0%
> Relying on surface water: 6.0%
> Pct. urban pop. in 2017: 17.0%
> GDP per capita: $1,998
[in-text-ad]
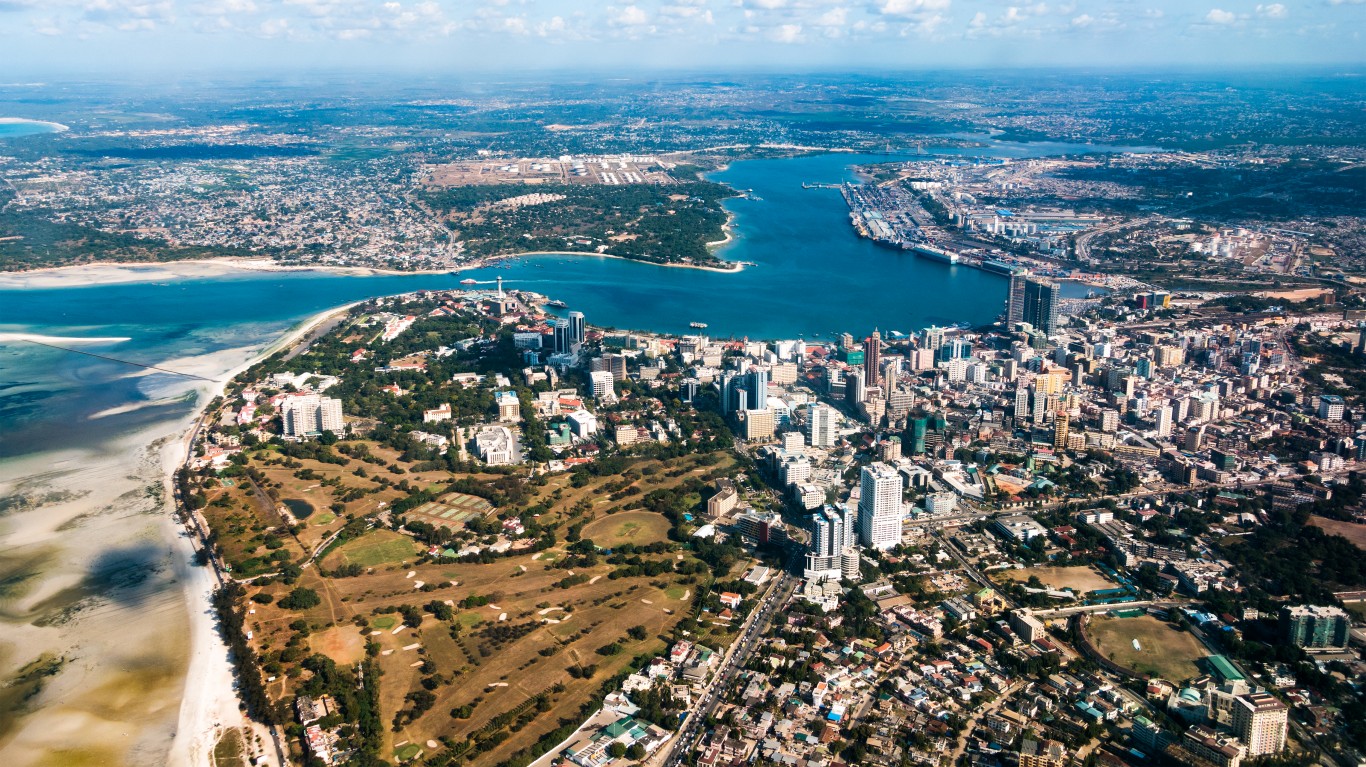
13. Tanzania
> Population in 2017: 57,310,000
> Pop. with at least basic drinking water services: 57.0%
> With limited access (round trip of 30 mins +): 11.0%
> With water unimproved by sanitation processes: 18.0%
> Relying on surface water: 14.0%
> Pct. urban pop. in 2017: 33.0%
> GDP per capita: $2,809
[recirclink id=585426]
12. Mozambique
> Population in 2017: 29,669,000
> Pop. with at least basic drinking water services: 56.0%
> With limited access (round trip of 30 mins +): 15.0%
> With water unimproved by sanitation processes: 16.0%
> Relying on surface water: 13.0%
> Pct. urban pop. in 2017: 35.0%
> GDP per capita: $1,295
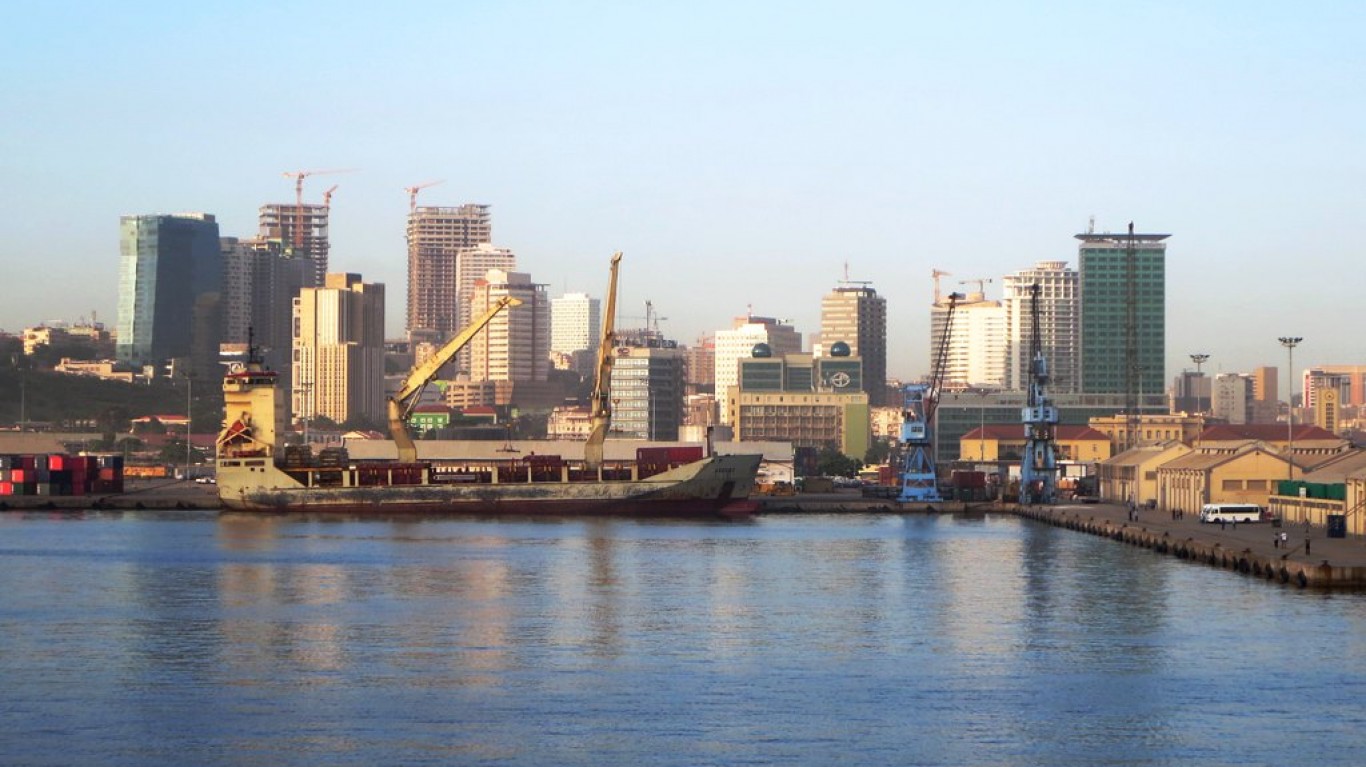
11. Angola
> Population in 2017: 29,784,000
> Pop. with at least basic drinking water services: 56.0%
> With limited access (round trip of 30 mins +): 10.0%
> With water unimproved by sanitation processes: 19.0%
> Relying on surface water: 15.0%
> Pct. urban pop. in 2017: 65.0%
> GDP per capita: $5,725
[in-text-ad-2]
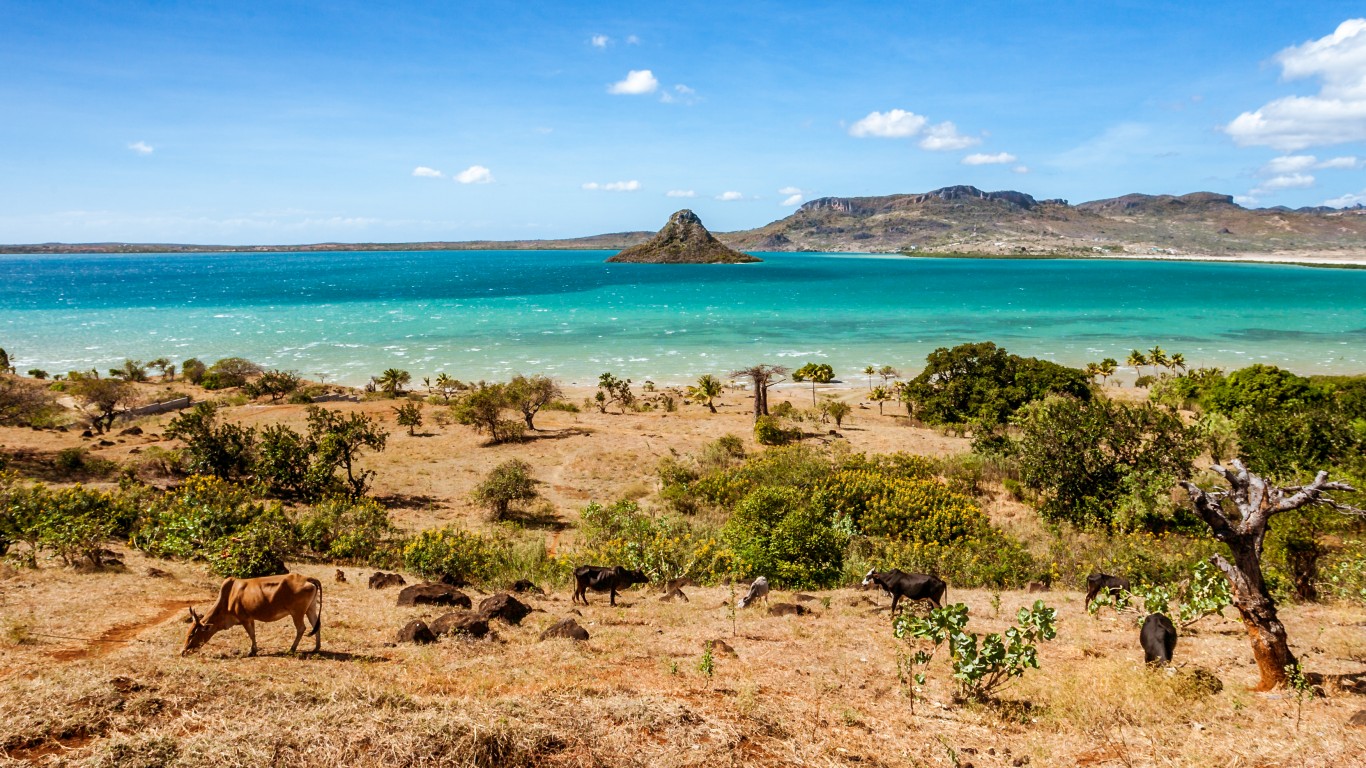
10. Madagascar
> Population in 2017: 25,571,000
> Pop. with at least basic drinking water services: 54.0%
> With limited access (round trip of 30 mins +): 1.0%
> With water unimproved by sanitation processes: 32.0%
> Relying on surface water: 13.0%
> Pct. urban pop. in 2017: 37.0%
> GDP per capita: $1,678
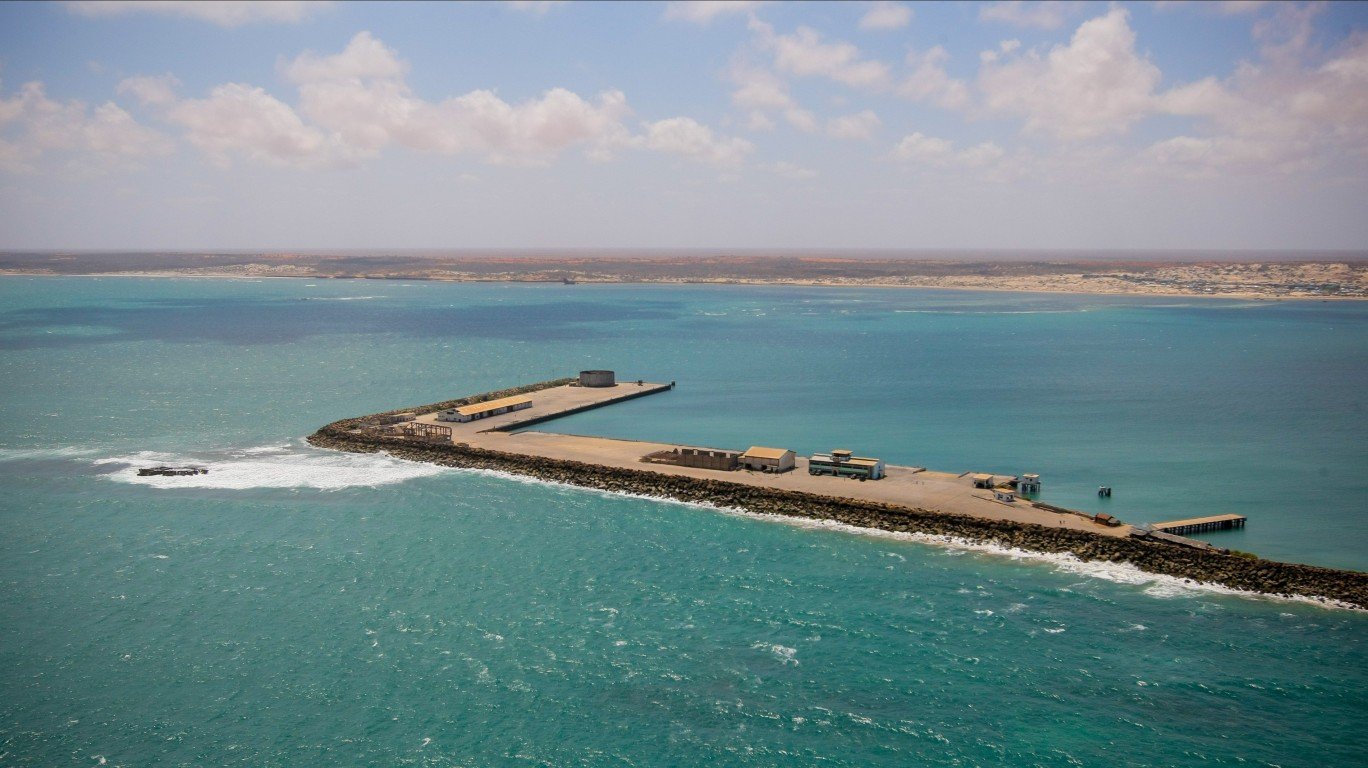
9. Somalia
> Population in 2017: 14,743,000
> Pop. with at least basic drinking water services: 52.0%
> With limited access (round trip of 30 mins +): 31.0%
> With water unimproved by sanitation processes: 14.0%
> Relying on surface water: 3.0%
> Pct. urban pop. in 2017: 44.0%
> GDP per capita: Not available
[in-text-ad]
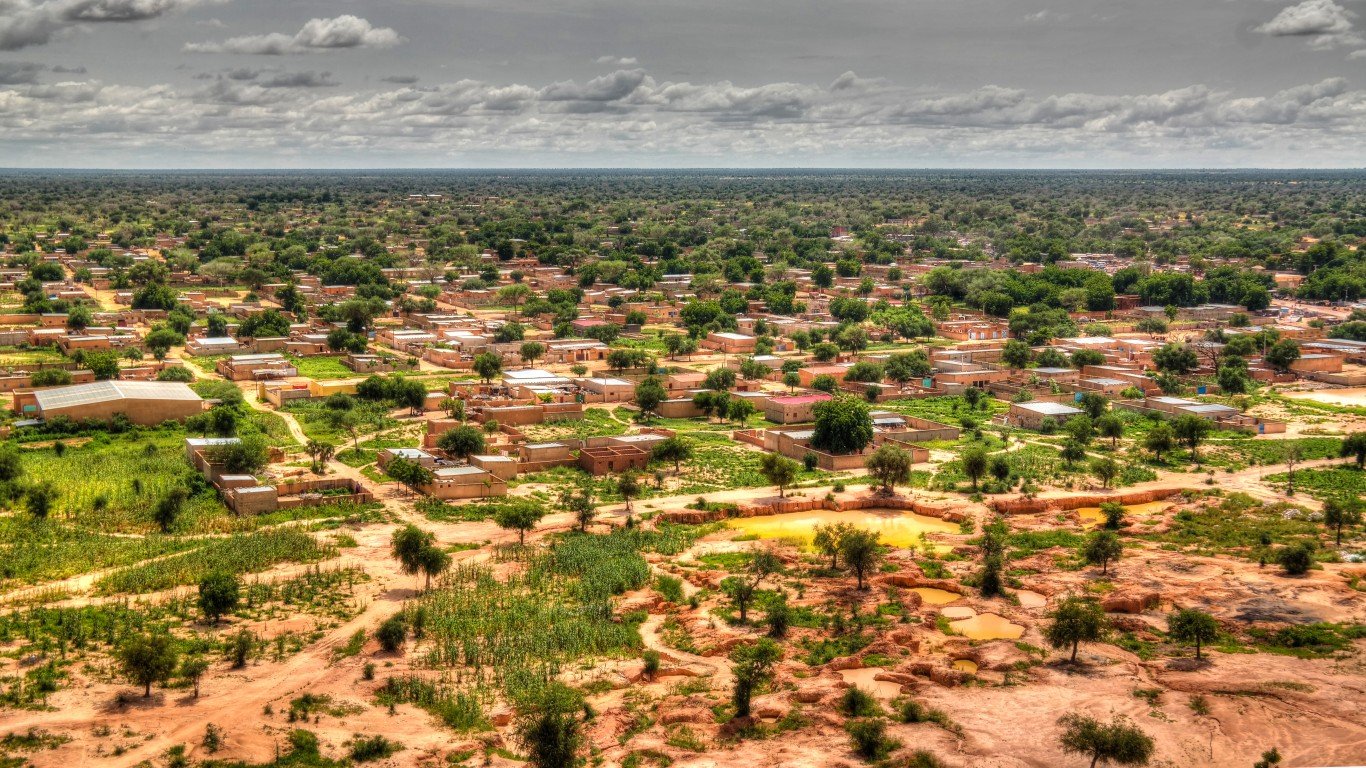
8. Niger
> Population in 2017: 21,477,000
> Pop. with at least basic drinking water services: 50.0%
> With limited access (round trip of 30 mins +): 15.0%
> With water unimproved by sanitation processes: 31.0%
> Relying on surface water: 4.0%
> Pct. urban pop. in 2017: 16.0%
> GDP per capita: $944
[recirclink id=556906]
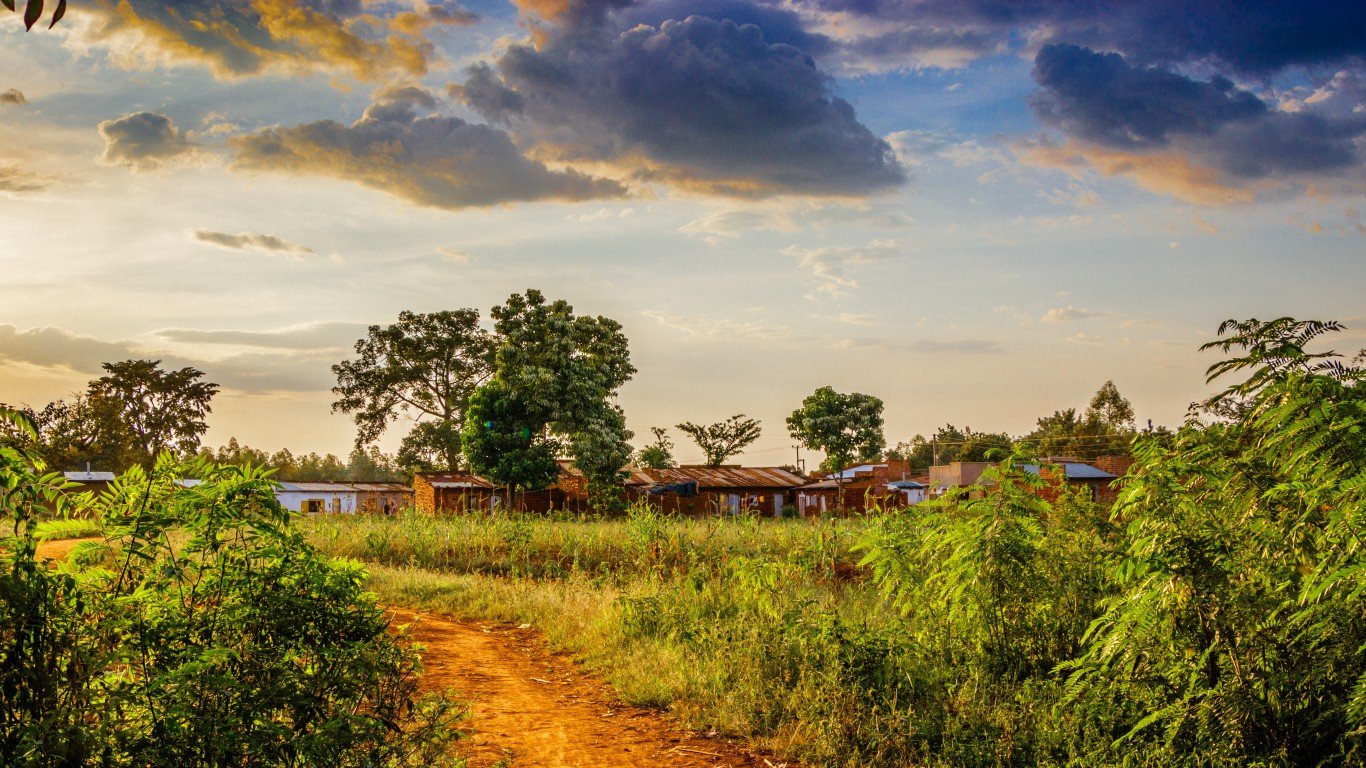
7. Uganda
> Population in 2017: 42,863,000
> Pop. with at least basic drinking water services: 49.0%
> With limited access (round trip of 30 mins +): 32.0%
> With water unimproved by sanitation processes: 12.0%
> Relying on surface water: 7.0%
> Pct. urban pop. in 2017: 23.0%
> GDP per capita: $1,808
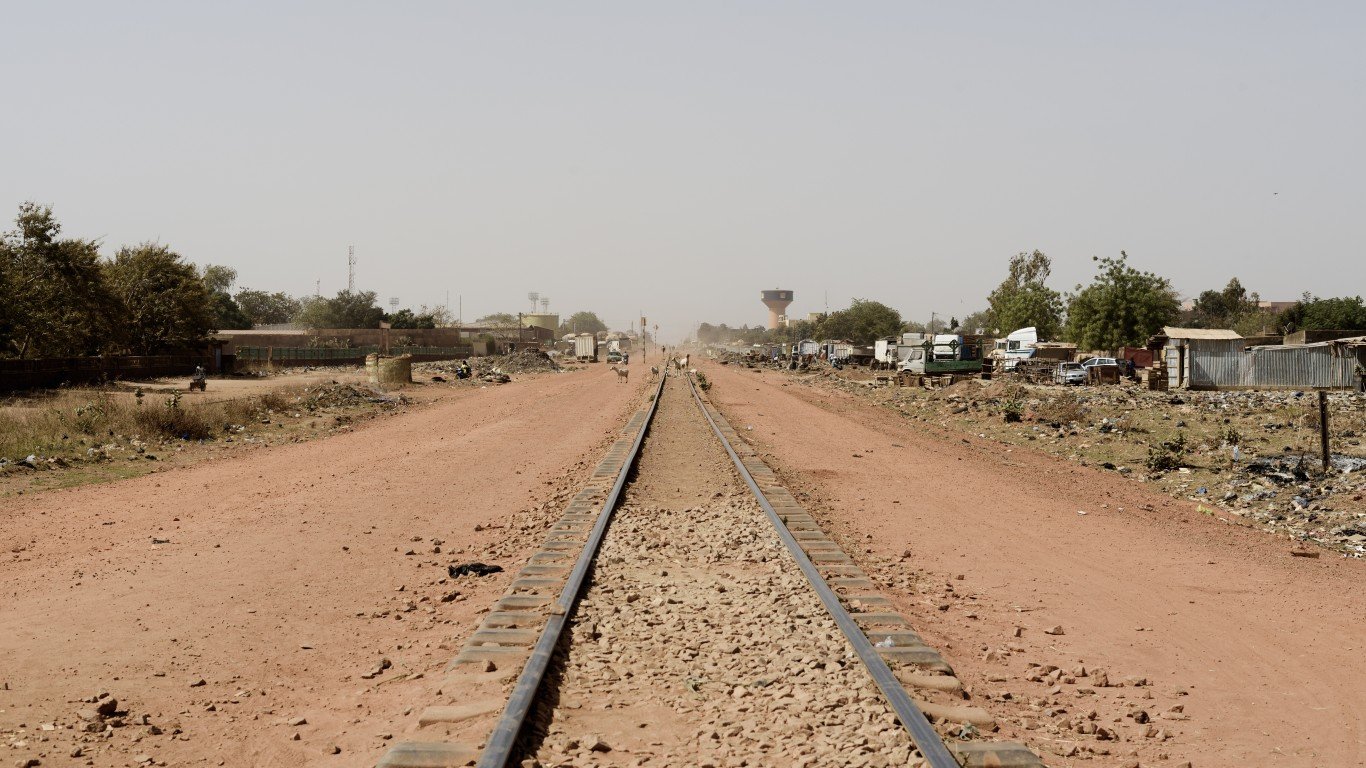
6. Burkina Faso
> Population in 2017: 19,193,000
> Pop. with at least basic drinking water services: 48.0%
> With limited access (round trip of 30 mins +): 28.0%
> With water unimproved by sanitation processes: 23.0%
> Relying on surface water: 1.0%
> Pct. urban pop. in 2017: 29.0%
> GDP per capita: $1,761
[in-text-ad-2]
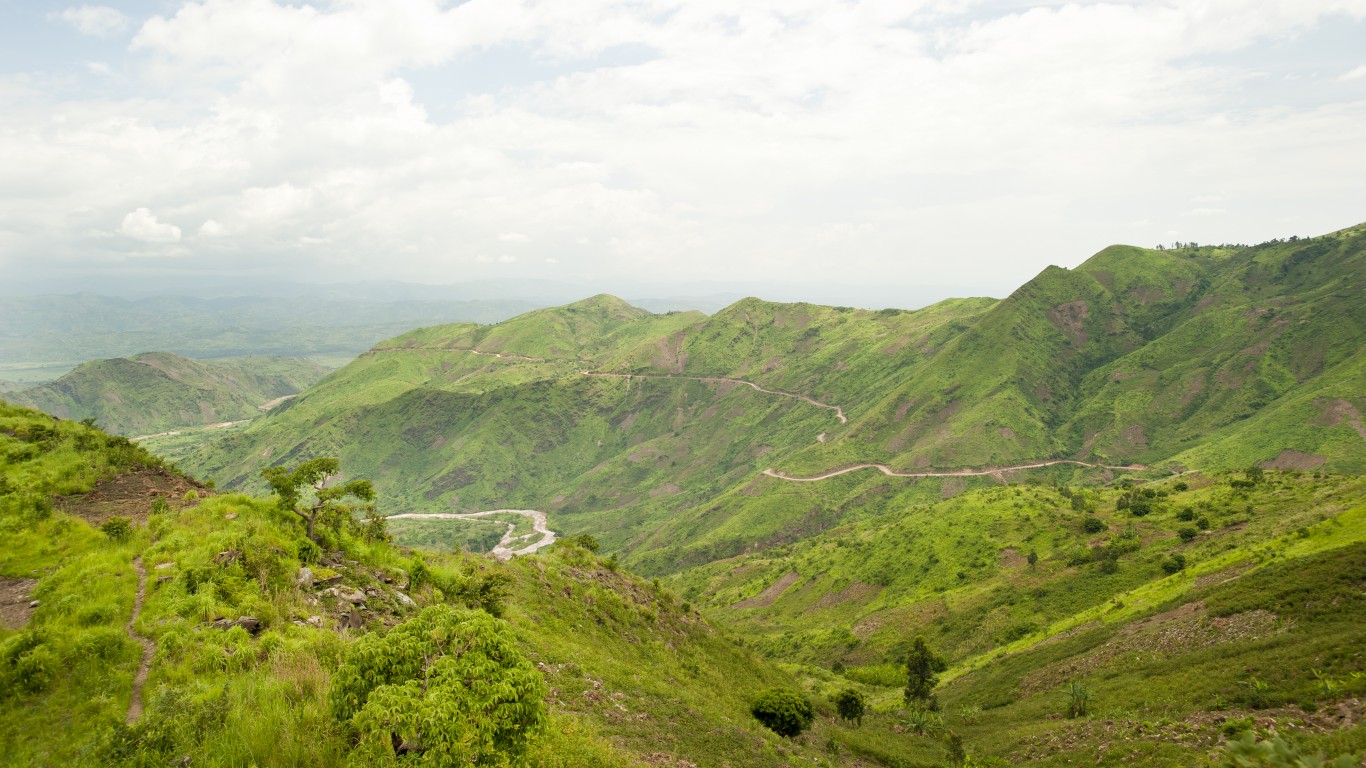
5. Congo, Dem. Rep.
> Population in 2017: 81,340,000
> Pop. with at least basic drinking water services: 43.0%
> With limited access (round trip of 30 mins +): 12.0%
> With water unimproved by sanitation processes: 36.0%
> Relying on surface water: 9.0%
> Pct. urban pop. in 2017: 44.0%
> GDP per capita: $827
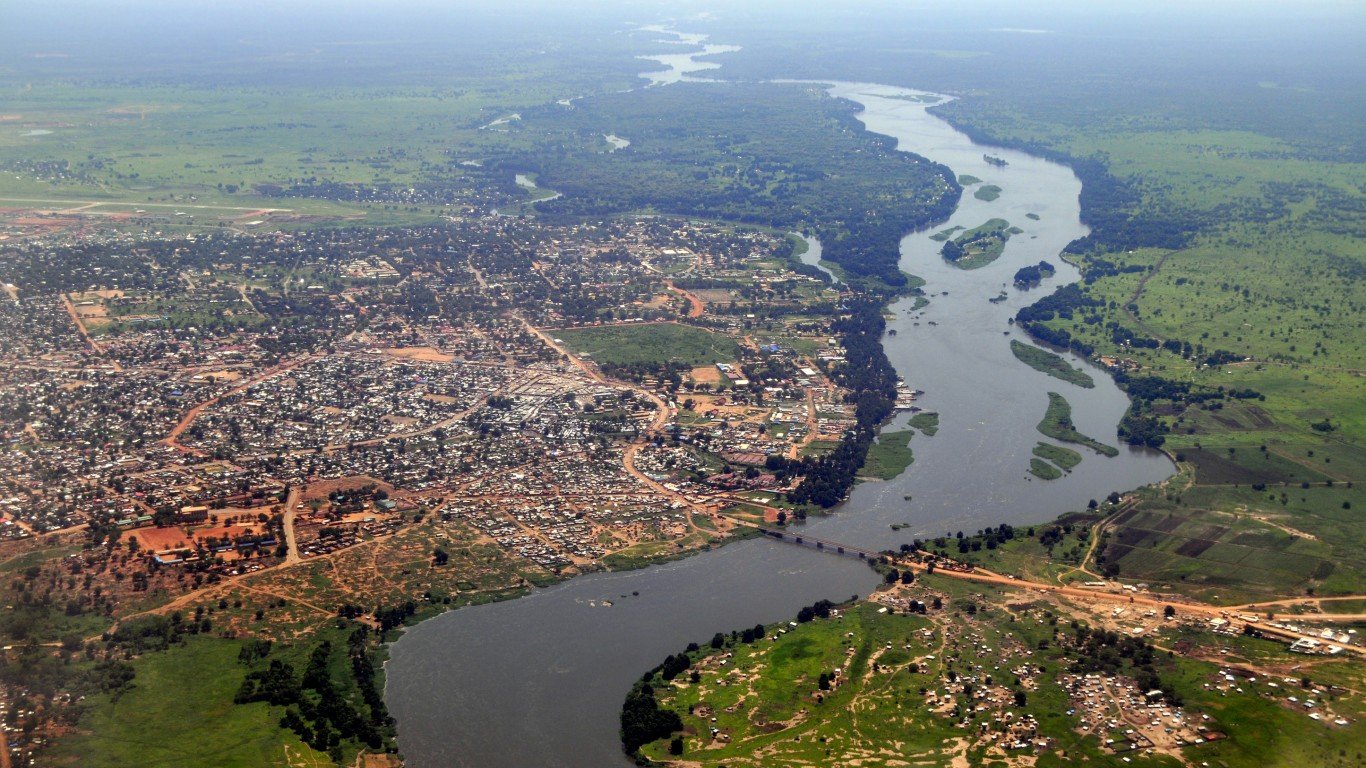
4. South Sudan
> Population in 2017: 12,576,000
> Pop. with at least basic drinking water services: 41.0%
> With limited access (round trip of 30 mins +): 34.0%
> With water unimproved by sanitation processes: 17.0%
> Relying on surface water: 9.0%
> Pct. urban pop. in 2017: 19.0%
> GDP per capita: $1,597
[in-text-ad]
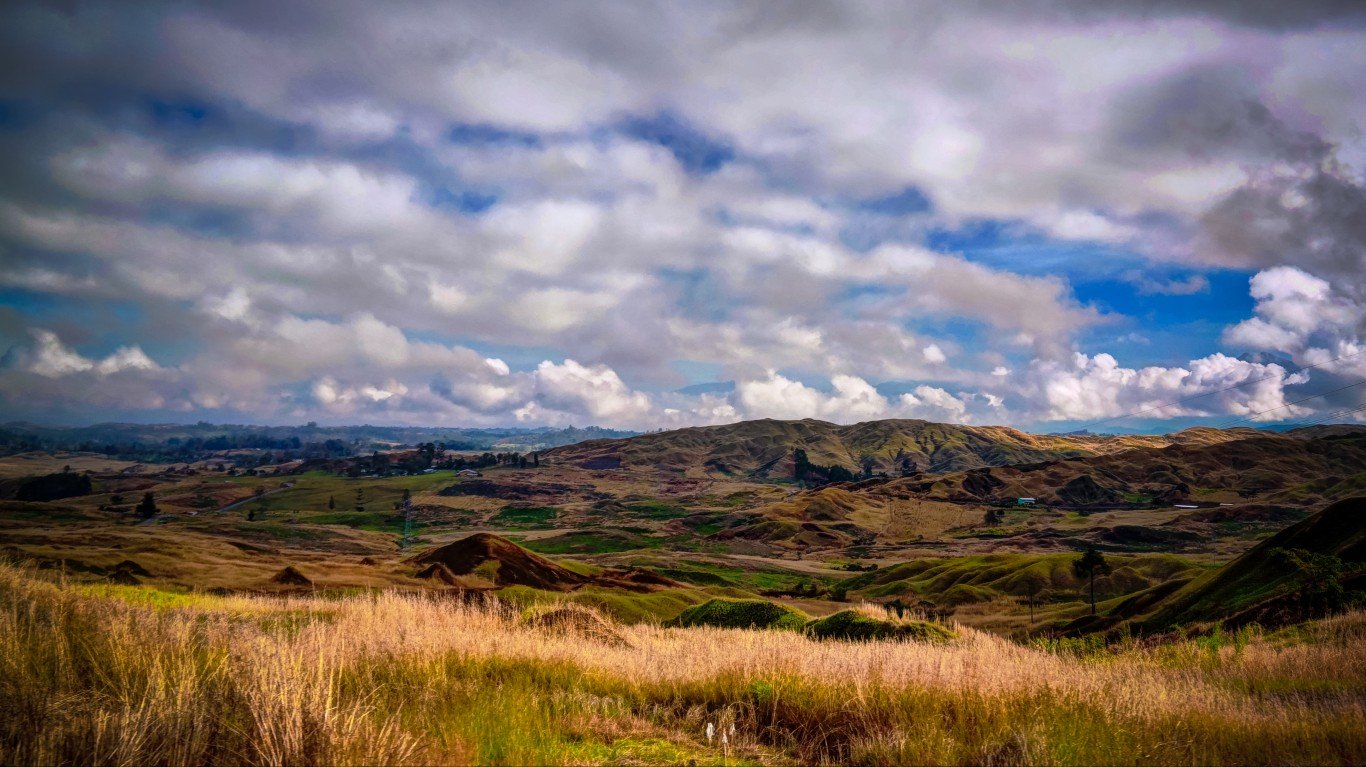
3. Papua New Guinea
> Population in 2017: 8,251,000
> Pop. with at least basic drinking water services: 41.0%
> With limited access (round trip of 30 mins +): 2.0%
> With water unimproved by sanitation processes: 6.0%
> Relying on surface water: 51.0%
> Pct. urban pop. in 2017: 13.0%
> GDP per capita: $3,848
[recirclink id=591594]
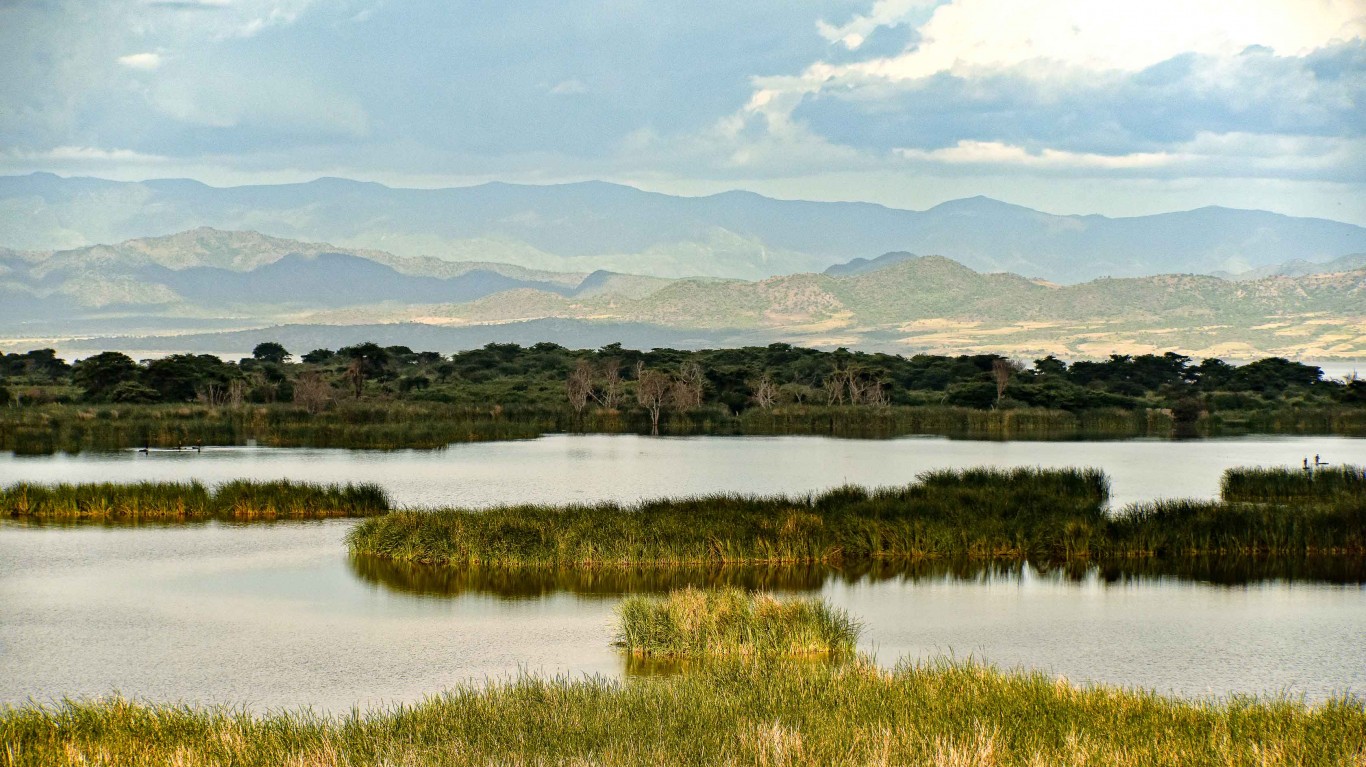
2. Ethiopia
> Population in 2017: 104,957,000
> Pop. with at least basic drinking water services: 41.0%
> With limited access (round trip of 30 mins +): 28.0%
> With water unimproved by sanitation processes: 22.0%
> Relying on surface water: 9.0%
> Pct. urban pop. in 2017: 20.0%
> GDP per capita: $1,794
1. Chad
> Population in 2017: 14,900,000
> Pop. with at least basic drinking water services: 39.0%
> With limited access (round trip of 30 mins +): 17.0%
> With water unimproved by sanitation processes: 39.0%
> Relying on surface water: 6.0%
> Pct. urban pop. in 2017: 23.0%
> GDP per capita: $1,746
Detailed Findings
Water access in many of these countries can also be a function of wealth. In 24 of the 90 countries with such data, basic water coverage among the wealthiest 20% of people was at least twice as high as coverage among the poorest segment of the population.
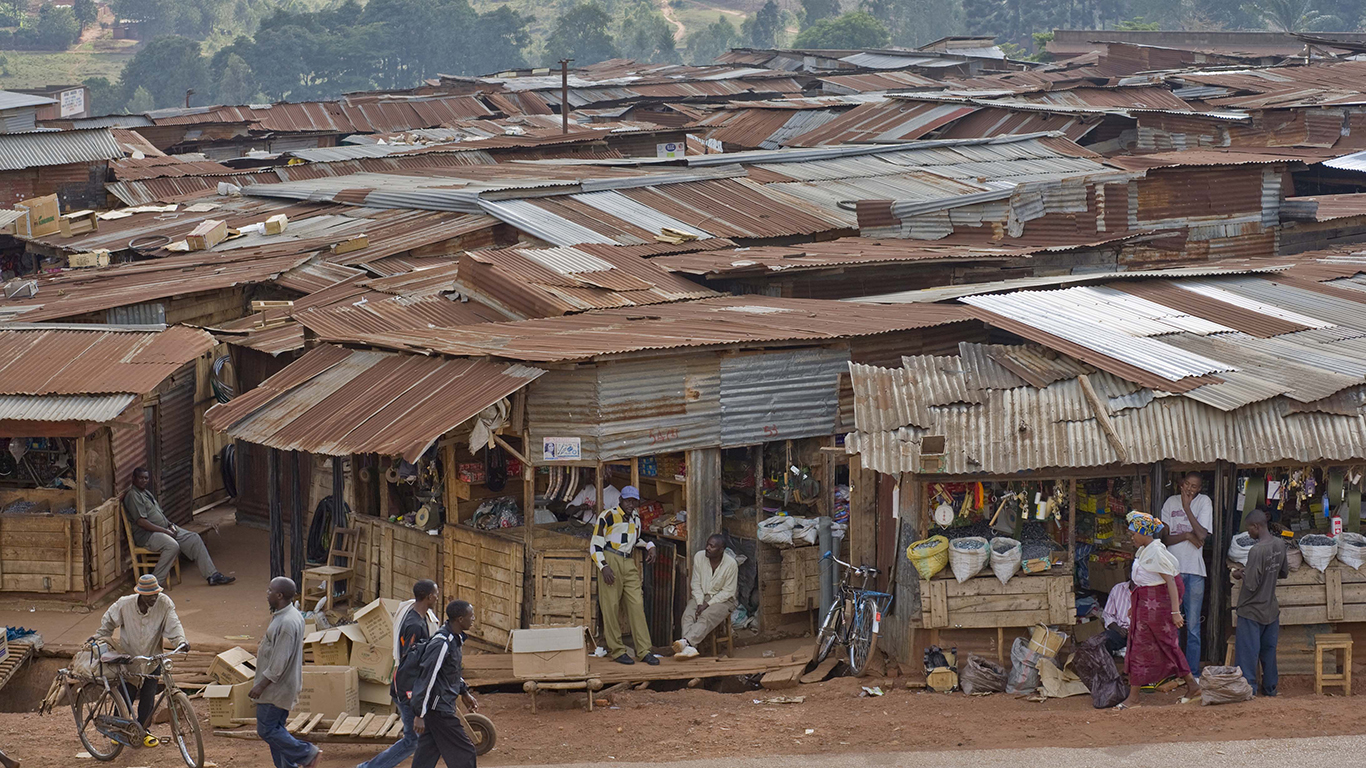
The least developed countries and in particular landlocked developing countries are the most likely regions to have less access to drinking water. In these regions the population relies more heavily on unimproved or surface water sources. A relatively large portion may also have limited access to water (round trip for water collection exceeding 30 minutes).
Countries with the lowest percentages of people with at least access to basic drinking water services also tended to have relatively high population growth between the years assessed by the WHO — 2000 and 2017. All of the 29 countries had large population growths, and 23 had growth of 50% or more.
There have been large gains in drinking water access between 2000 and 2017. Over that period, the world population with access to safely managed drinking water services increased from 61% to 71%.
While not exceeding the global improvements by large enough strides to offset the relatively poor access, significant improvements in water access were reported in 24 of the 29 countries with the worst access to drinking water.
Methodology
To identify the countries with the worst access to drinking water, 24/7 Wall St. reviewed household survey data in “Progress on household drinking water, sanitation and hygiene 2000-2017,” a report produced jointly by UNICEF and the World Health Organization (WHO). Our ranking is based on the percentage of a country’s population with access to at least basic drinking water services. We only included the 29 countries for which this proportion was two-thirds or less.
The percentage of each country’s population with at least basic drinking water services, limited access (a round trip to a primary water source of 30 minutes or more), access to water that has not been treated by sanitation processes (“unimproved”), and who rely on surface water also came from the WHO report. The percentage of each country’s population in 2017 living in urban areas also came from the WHO.
GDP per capita in purchasing power parity (ppp) for each country in 2017 was obtained from the World Bank.
Contact [email protected] for any questions or corrections.