In mid-February 2020, the Dow Jones Industrial Average reached nearly 30,000 points, the highest level in its more than 100 year history. And then, the severity and scale of the COVID-19 pandemic came into sharper focus.
Within a week of hitting an all-time high, the DJIA began to tank. So far, the index has lost over 35% of its value, wiping out years of growth in only about a month’s time.
So far, over a quarter million cases of coronavirus have been confirmed worldwide, resulting in over 10,000 deaths. In the United States, there were 15,219 total cases and 201 deaths as of March 20 — with health experts projecting a sharp rise in cases in the coming days and weeks. To halt the virus’s spread, non-essential businesses and services have been shut down across the country, and government officials have been urging Americans to stay home, effectively halting economic activity. Here is a look at the U.S. industries being devastated by the coronavirus.
The current sell-off on Wall Street is the worst many Americans have seen — or will see — in their lifetimes. Still, it is hardly the first time investors have scrambled to pull their money out of the stock market. For context on how the current market collapse compares with others throughout history, 24/7 Wall St. reviewed the largest declines in the history of the Dow Jones Industrial Average. Some of the sell-offs that rank on this list spanned just a few days. In other cases, they lasted for weeks and even months.
It is important to note that market conditions are not static, and the prevailing opinion of government officials and health experts is that the effects of the coronavirus will worsen before they improve. Though lawmakers are scrambling to put together a comprehensive economic stimulus package, markets remain volatile, and the full economic impact of the pandemic remains to be seen.
Click here to see how the current stock market collapse compares with others in history.
1. Panic of 1901
> DJIA decline: -10.8% from 5/6/1901 to 5/9/1901
> Largest single-day decline: -6.1% (5/9/1901)
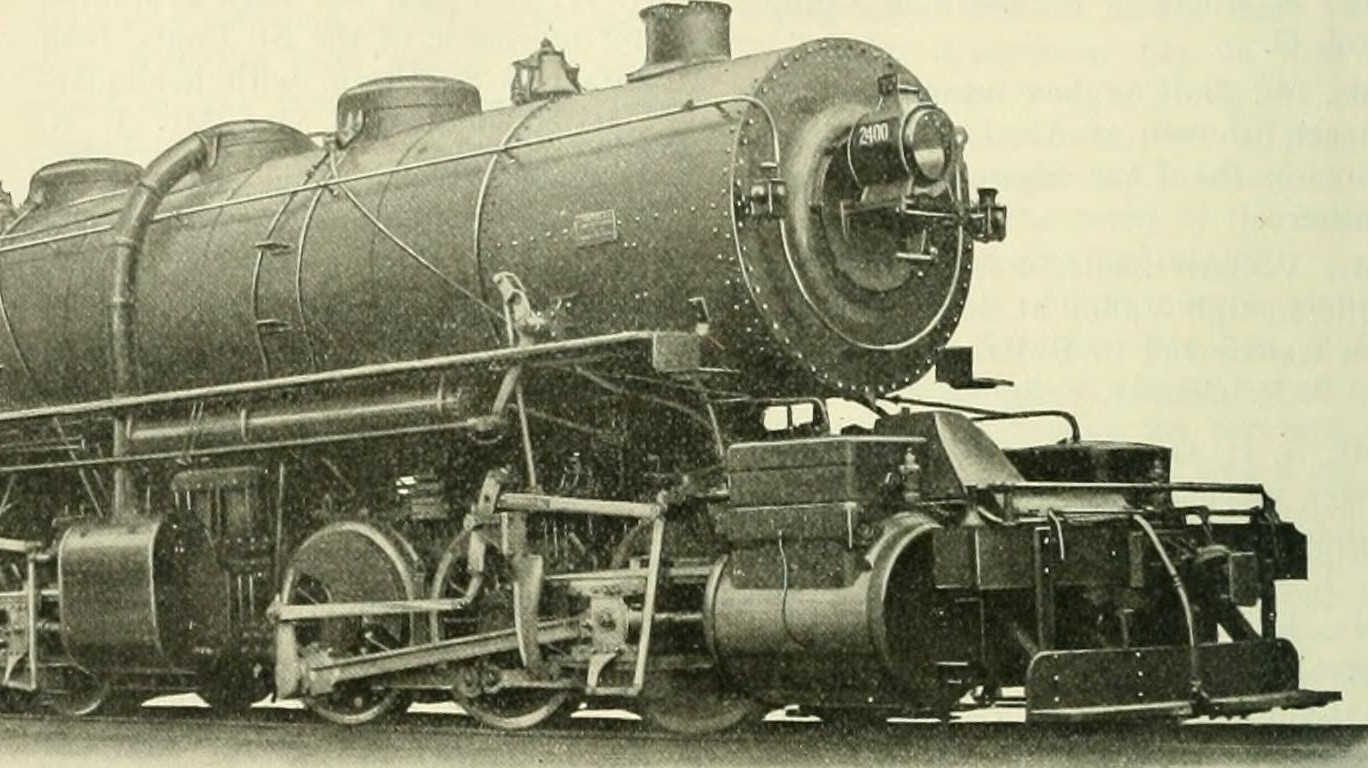
The first major panic after the Dow Jones Industrial Average was introduced in the stock market in 1896 occurred just half a decade later, in May 1901. The panic came after several major American businessmen, including famous banker J.P. Morgan, sought to gain ownership of the Northern Pacific Railway. They began purchasing millions in shares of the company, driving the company’s stock price above $1,000 and sending the rest of the market into a panic. On May 9, the worst day of the panic, share prices of a number of companies fell between 10% to 25%. On that day, shares of U.S. Steel, at the time one of the largest companies in America, plummeted by 45%.
The selloff was relatively short-lived, and stocks rebounded on May 10th, with the Dow Jones increasing by 6.4% in value.
[in-text-ad]
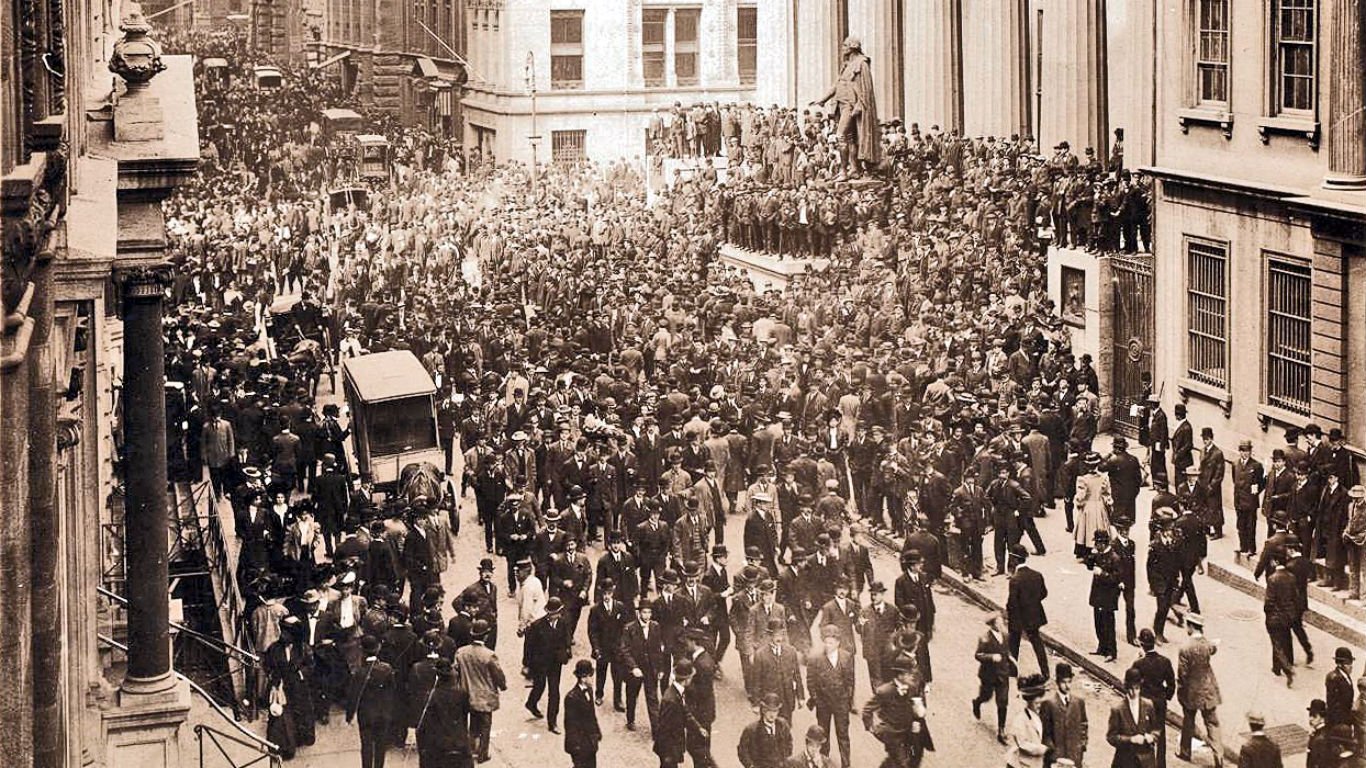
2. Panic of 1907
> DJIA decline: -45.0% from 1/07/1907 to 11/15/1907
> Largest single-day decline: -8.3% (3/14/1907)
Though it was preceded by the Panic of 1901, the Panic of 1907 is recognized as the first global financial crisis of the 20th century. Before the Panic actually began, the stock market began selling off during the first half of 1907, including a staggering 8.3% decline on March 14, which at the time was the second largest single-day decline in the history of the index.
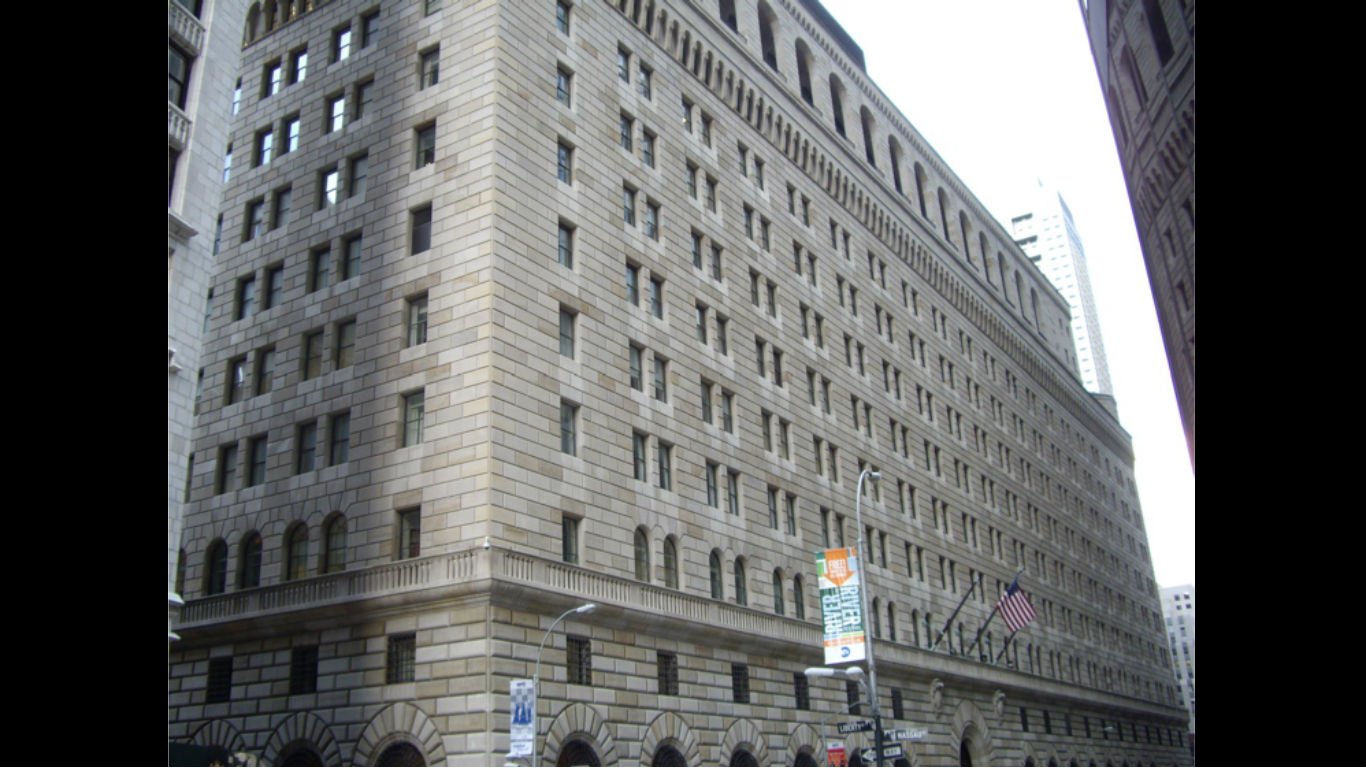
A broader panic began on Oct. 15, when both the Knickerbocker Trust and the Westinghouse Electric Company failed. The failure lead to a chain reaction of stock panic due to limited liquidity and waning confidence in banks. The federal government and private financiers, including J.P. Morgan and John D. Rockefeller, helped stabilize the markets through bailouts and other means, but not before the DJIA lost 15% of its value in a month. The event gave way to monetary reforms that eventually led to the formation of the U.S. Federal Reserve System.
[recirclink id=600332]
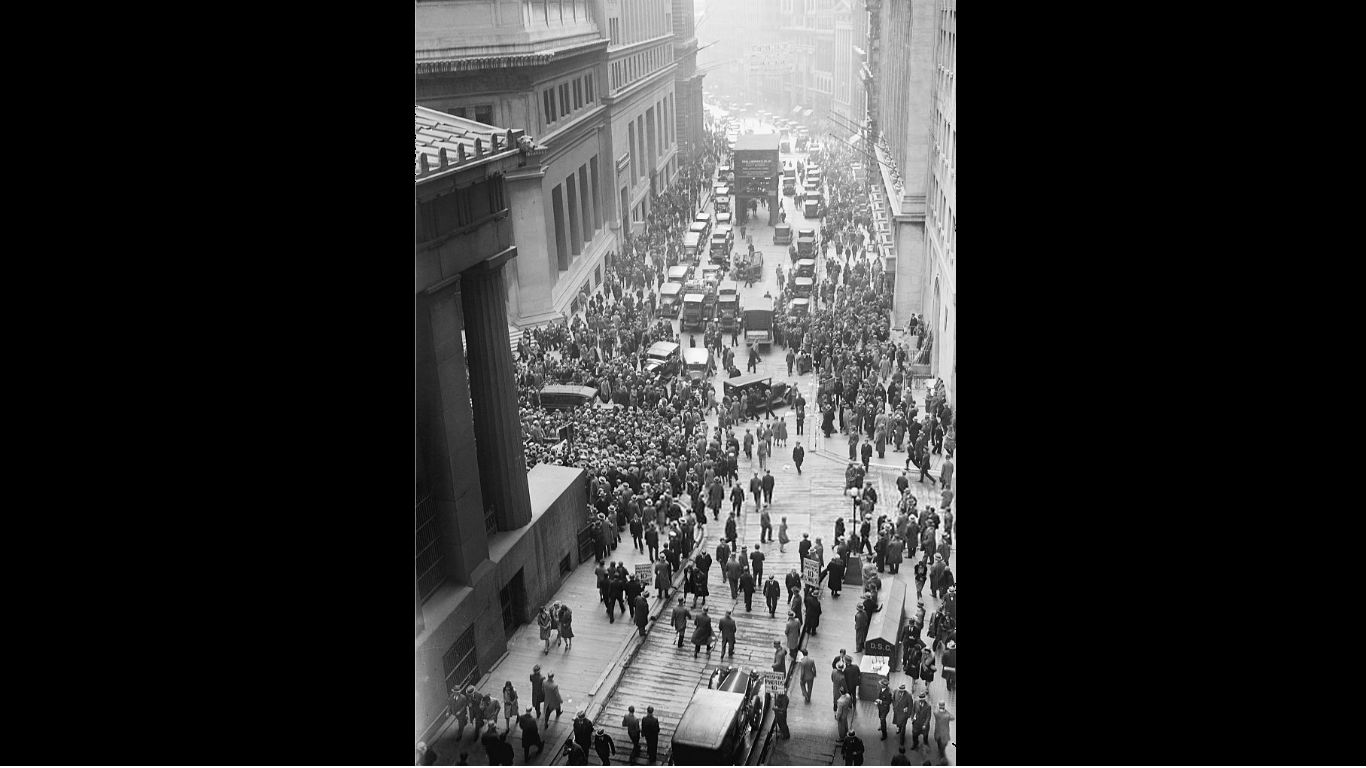
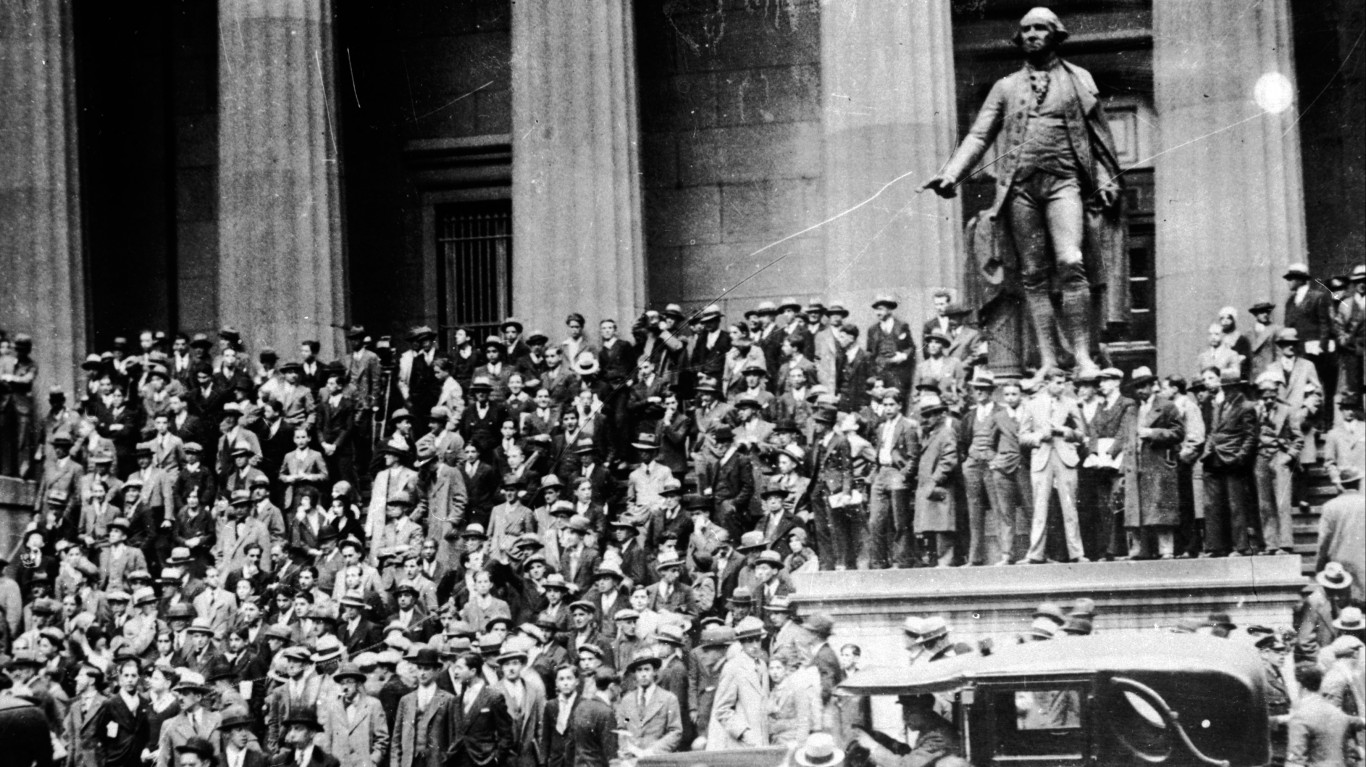
3. Wall Street Crash of 1929
> DJIA decline: -46.6% from 9/16/1929 to 11/13/1929
> Largest single-day decline: -12.8% (10/28/1929)
The Wall Street Crash of 1929 was the worst event in the history of the Dow Jones Industrial Average. On October 29th that year, on what is now known as Black Tuesday, investors lost billions of dollars on the New York Stock Exchange, as the Dow Jones fell by roughly 12% for the second day in a row, accelerating the economic collapse that would give way to the Great Depression. Over the period of about two months starting in mid-September, the Dow shed a staggering 46.6% of its value.
The historic crash was precipitated by wild speculation and reckless investing throughout the 1920s. When unemployment began to climb and production fell at the end of the decade, stocks were trading at prices well in excess of their true value.

4. Recession of 1937-38
> DJIA decline: -42.6% from 9/4/1937 to 3/31/1938
> Largest single-day decline: -5.9% (11/19/1937)
On Sept. 4, 1937, the Dow closed at 172.55. The following day, the index fell nearly 5%, in the first of many major dips over the coming months. On March 31, the DJIA closed below 100 points for the first time in years, capping off the worst of the decline when the Dow lost more than 20% of its value in a two week period.
That decline of approximately 43% over 200 days came during the Recession of 1937-38, a period in which real GDP fell 10% and U.S. unemployment reached 20%. The recession, which officially lasted from May 1937 through June 1938, came as the United States was in the midst of a recovery from the Great Depression and the beginning of World War II.
[in-text-ad-2]

5. Germany invades France
> DJIA decline: -24.5% from 5/10/1940 to 6/10/1940
> Largest single-day decline: -6.8% (5/14/1940)
Though World War II had started in 1939 with Germany’s invasion of Poland, U.S. stocks did not react much until the German army invaded France in 1940. In a matter of weeks, Hitler forced one of Europe’s great military powers into submission, and U.S. stocks cratered. The fall of France began in early May, and over the month that followed, the DJIA fell by 24.5%. The largest single-day drop occurred early on May 14, with the index falling by nearly 7% in a single day.

6. End of World War II
> DJIA decline: -23.2% from 5/29/1946 to 10/9/1946
> Largest single-day decline: -5.6% (9/3/1946)
Though the end of WWII marked the beginning of an era of historic prosperity in the United States, at the time, the end of the war marked an era of economic uncertainty and anxiety. Many investors assumed that the end of wartime spending would lead to an economic downturn. The sell-off started as the war began to wind down and continued for a while after its end. Between late May and early October 1946, the Dow Jones shed 23.2% of its value.
[in-text-ad]
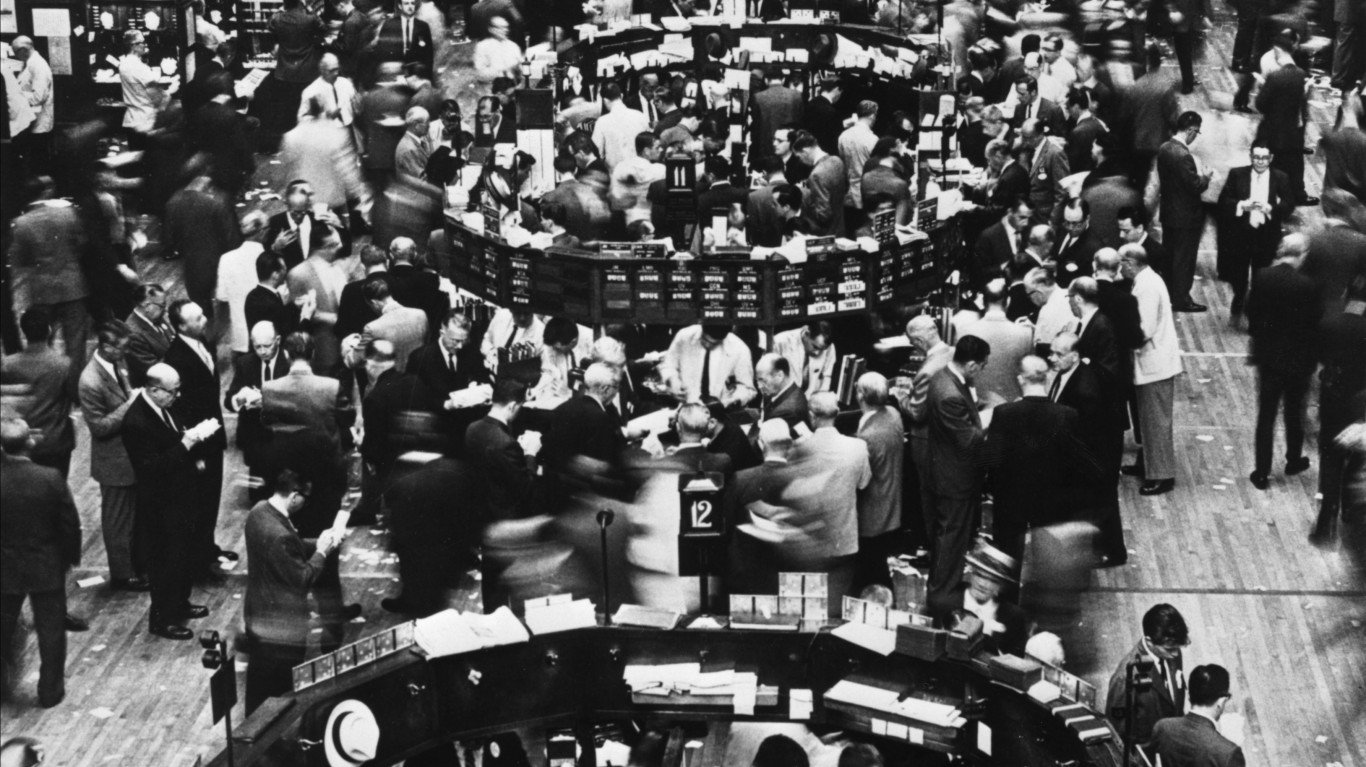
7. Kennedy Slide of 1962
> DJIA decline: -26.8% from 12/28/1961 to 6/26/1962
> Largest single-day decline: -5.7% (5/28/1962)
The Kennedy Slide of 1962 occurred in the first months of 1962. On Dec. 28, 1961, the Dow closed at 731.51. It closed at 535.76 about six months later, on June 26. The sell-off came after a long period of growth, and some have explained it as a correction of inflated stock values. The biggest single-day decline during the slide occurred on May 28, when the Dow lost 5.7% of its value.
[recirclink id=648470]
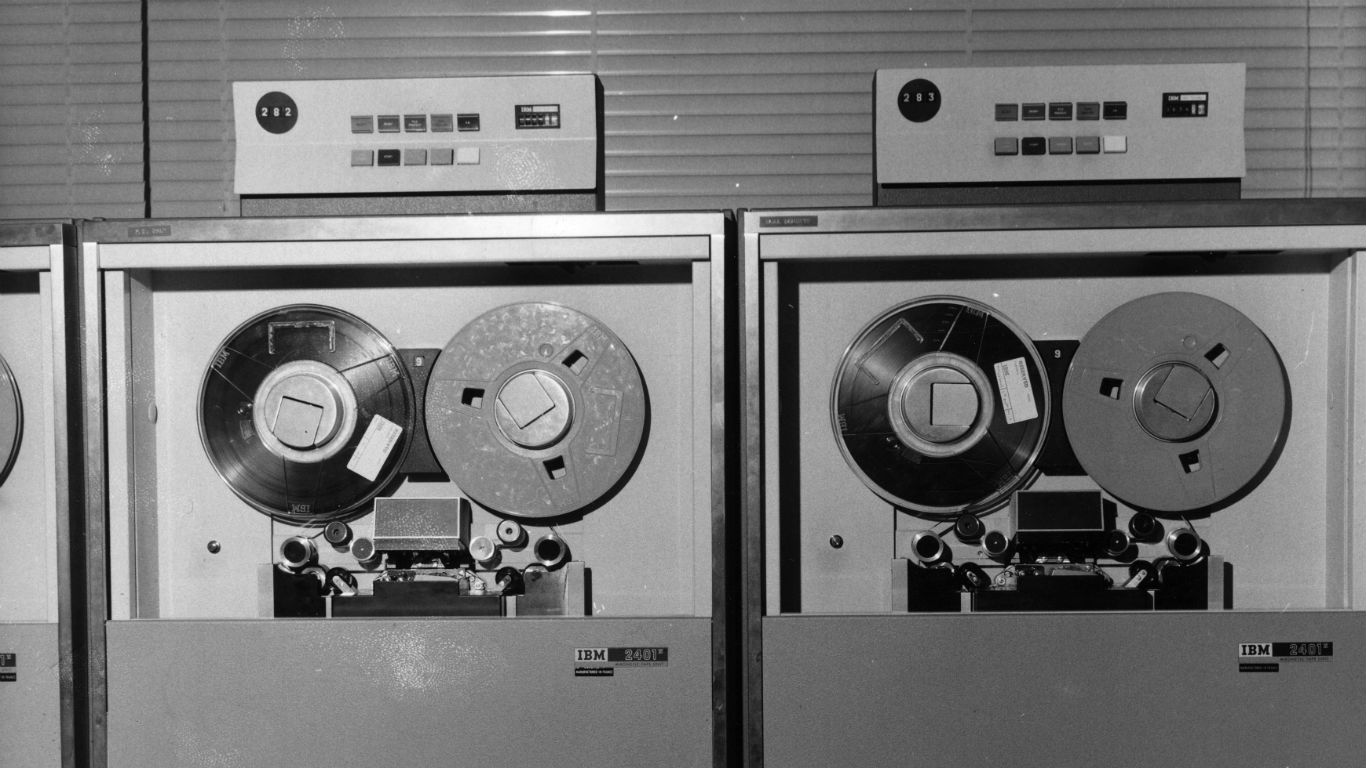
8. Tech Stock Crash of 1970
> DJIA decline: -18.7% from 4/20/1970 to 5/26/1970
> Largest single-day decline: -3.1% (5/25/1970)
During the second quarter of 1970, the U.S. stock market fell sharply, led by tech stocks like Ross Perot’s Electronic Data Systems, which lost 85% of its value, as well as companies like supercomputer and mainframe maker Control Data and data entry system maker Mohawk Data, which fell in value by more than 80%.
The start of the crash was catalyzed by computer manufacturer IBM’s legal battle with the Justice Department about its strategy of bundling its software with hardware, as well as its apparent inability to produce enough of its new System 370 computers to match demand. Analysts have attributed the decline to an overconfidence in the plausibility that compound growth rates could continue at a high rate for an unsustainable amount of time as well as low to no earnings of many tech stocks.

9. 1973-74 Stock Market Crash
> DJIA decline: -45.1% from 1/11/1973 to 12/6/1974
> Largest single-day decline: -3.5% (11/18/1974)
Due in part to a series of economic policies implemented by the Nixon administration, inflation began climbing out of control in early 1973. The unforeseen decline in purchasing power led President Richard Nixon to order a wage and price freeze. With the Watergate scandal gaining momentum around the same time, the Dow lost over 20% of its value in the first eight months of 1973. The market fell further that October in the wake of an OPEC oil embargo to the United States. Inflation, long lines at the pump, and Nixon’s resignation wreaked havoc on Wall Street for much of the following year.
[in-text-ad-2]
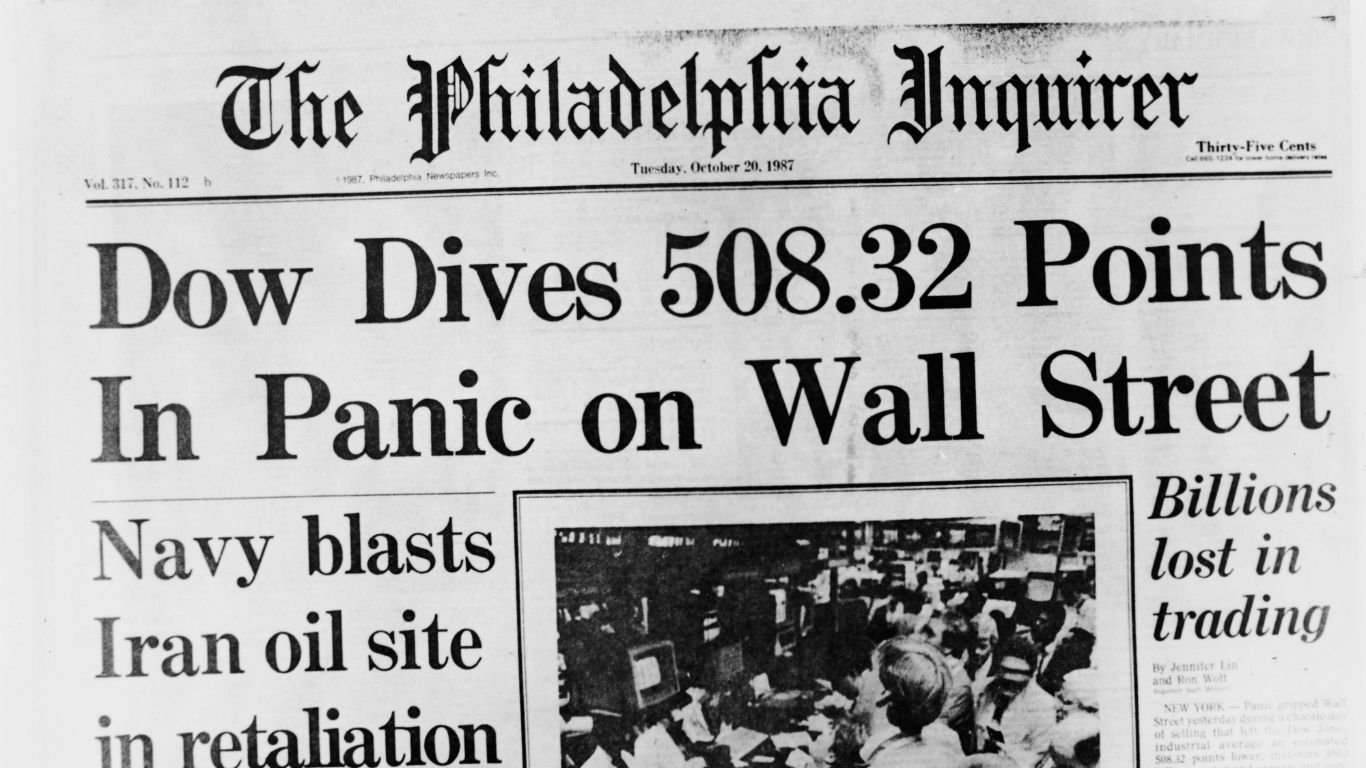
10. Black Monday
> DJIA decline: -22.6% on 10/19/1987
> Largest single-day decline: -22.6% (10/19/1987)
On Oct. 19, 1987 — a date known as Black Monday — the DJIA lost over one-fifth of its total value, the largest single-day decline in trading history up to that point. The record point plunge was not broken until the recent pandemic-driven sell-offs, although terms of a percentage decline, Black Monday still holds the record.
Unlike most other massive single-day sell-offs, Black Monday was not triggered by a major news event. Rather, several factors lead to anxiety and panic among investors. These included the growing U.S. trade deficit, the growing use of computerized trading, and a simmering conflict between Iran and Kuwait that threatened U.S. oil supplies — all factors that were hyped by the media.

11. Invasion of Kuwait
> DJIA decline: -18.4% from 8/2/1990 to 10/11/1990
> Largest single-day decline: -3.3% (8/6/1990)
While most of the 1990s can be characterized by a dramatic rise in stock prices, a recession at the beginning of the decade caused temporary panic and drove the markets down. The Federal Reserve continued to worry that the government deficits that helped contribute to Black Monday just a few years prior would persist, and so it sought to preempt those issues by maintaining a highly restrictive monetary policy.
When Sadaam Hussein’s Iraq invaded Kuwait on Aug. 2, 1990, oil prices jumped sharply, resulting in a nearly 20% decline in the Dow Jones over two months. The decline came during a broader economic recession, which lasted from July 1990 through March 1991.
[in-text-ad]
12. Long-Term Capital Management Fails
> DJIA decline: -19.2% from 7/19/1998 to 8/31/1998
> Largest single-day decline: -6.4% (8/31/1998)
Long-Term Capital Management, or LTCM, was a Connecticut based hedge fund that managed over $100 billion at its height. Managed by Nobel Prize winning economist and Wall Street veterans, the fund, founded in 1994, was initially highly successful — but it nearly destroyed the global financial system when it failed after just four years. The firm’s strategy of arbitrage trading in securities prices proved flawed when Russia defaulted on its debt in the summer of 1998. When LTCM losses were amounting to billions of dollars, sell-offs followed. In a single day that summer, the Dow lost 6.4% of its value. Ultimately, a global financial crisis was averted by a government bailout that allowed LTCM to survive long enough to liquidate.
[recirclink id=648583]

13. Dot-com Bubble
> DJIA decline: -31.4% from 5/19/2002 to 10/9/2002
> Largest single-day decline: -4.6% (7/19/2002)
The turn of the 21st century saw rapid growth in the U.S. tech sector, fuelled by massive capital investment in tech companies capitalizing on the seemingly limitless growth opportunities in the world wide web. However, it would eventually become clear to investors that many of these companies were highly overvalued, and between the close on March 19 and the close on Oct. 9, 2002, the Dow Jones recorded a decline of over 30%. The tech-heavy NASDAQ index dropped even more, with the overall index losing over three-quarters of its total value, with major companies like Cisco, Oracle, and Intel each losing more than 80% of their value. Meanwhile, dozens of large internet-based tech companies went bankrupt.
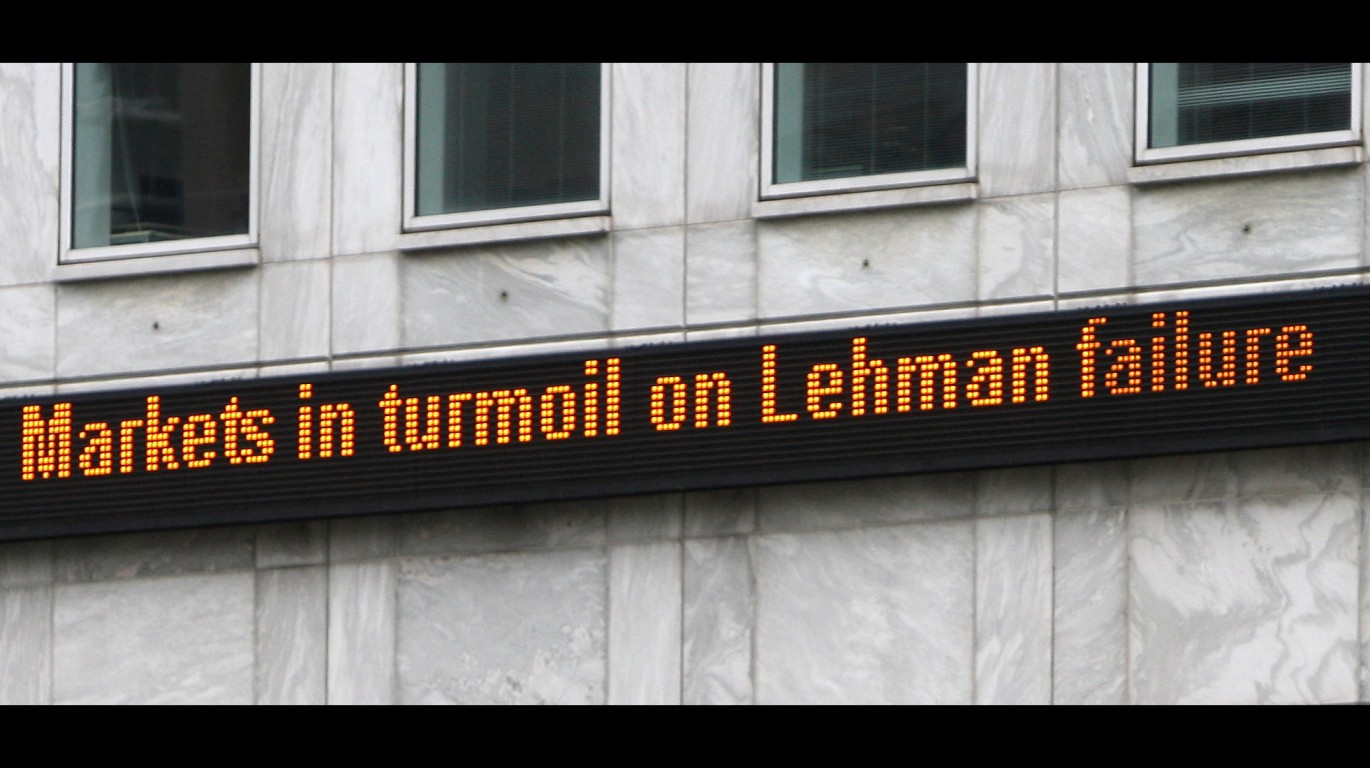
14. Lehman Brothers Collapse and the Great Financial Crisis
> DJIA decline: -53.7% from 10/9/2007 to 3/9/2009
> Largest single-day decline: -4.6% (10/15/2008)
Years of risky policies on Wall Street ultimately led to the subprime mortgage crisis and set off a series of events that would culminate in the Great Financial Crisis. Lehman Brothers, the fourth largest investment bank in the world at the time, was the largest bank to fold as a result. The Dow fell precipitously, with only a few minor periods of gain, from over 14,000 points in Oct. 2007 to barely 6,500 Feb. 2009. Over nearly that entire period, the U.S. slid into a recession, as did most nations worldwide. In a considerable effort to avert global catastrophe — in a combined effort of government bailouts and expansionary monetary policy — the global recession and stock markets began to recover. It took until October 2013 for the Dow to regain the value it had lost.
[in-text-ad-2]

15. US Debt Downgrade
> DJIA decline: -11.7% from 8/1/2011 to 8/10/2011
> Largest single-day decline: -5.5% (8/8/2011)
In the first eight months of 2011, a brewing crisis over the U.S. debt ceiling came to a head, and there were fears that a continued impasse would cause the government to run out of money. In late June, 2011, ratings agency Standard & Poor’s managing director John Chambers told Reuters that if the United States failed to make a scheduled debt payment on Aug. 4, it would cut the country’s long-touted perfect AAA credit rating down to a D. On Aug. 2, President Barack Obama signed a compromise plan into law, avoiding a national default, but the agency downgraded the U.S. rating anyway a few days later, to AA+. The stock market responded, with the Dow plunging by more than 11% over roughly a week, including a 5.5% drop on Aug. 8.

16. Chinese Stock Market Turbulence
> DJIA decline: -13.6% from 6/24/2015 to 8/25/2015
> Largest single-day decline: -3.6% (8/24/2015)
After posting extraordinary gains of around 150% between June 2014 and June 2015, China’s Shanghai Composite index plummeted, losing nearly one-third of its value in less than a month. There were numerous factors at play in the Chinese economy that caused the boom-bust cycle, and the effects were felt throughout global markets as commodities prices fell, and Wall Street was not spared. The Dow dropped from about 18,100 points in June 2015 to about 15,600 by September. The effects did not last, however, as the index regained its losses by October.
[in-text-ad]

17. COVID-19 Outbreak
> DJIA decline: -35% from 2/12/2020 to 3/20/2020
> Largest single-day decline: -12.9% (3/16/2020)
When the first cases of a disease caused by a novel coronavirus appeared in Wuhan, China, in December 2019, officials speculated that it was an unknown form of pneumonia. In mid-January, there were over 100 new cases of the illness in China, and the first case was identified in the United States. In the weeks and months since, the virus has spread across the globe, and the World Health Organization declared the outbreak a pandemic on March 11, 2020. Confirmed cases today total a quarter million and over 10,000 people have died. To combat the spread of the virus, countries have taken extraordinary measures, including closing the borders and implementing lockdowns of entire populations. This has, in effect, led to life grinding to a halt throughout the world.
U.S. investors have remained largely unconcerned at the beginning of the outbreak, with the Dow reaching an all-time high of nearly 30,000 in mid-February. However, as the disease spread across Europe and began to affect the U.S., the outbreak’s devastating economic impact became increasingly clear. Despite economic stimulus packages of unprecedented size and scope moving rapidly through Congress and in other countries worldwide, between Feb. 19 and March 19, the Dow shed over 9,000 points, losing over 35% of its value. As many businesses remain closed and Americans are urged to stay in their homes to contain the spread of the virus, the full breadth and depth of the economic toll of the pandemic remains to be seen.
Contact [email protected] for any questions or corrections.