
[cnxvideo id=”722238″ placement=”ros”]
Property crimes — a category that includes burglary, motor vehicle theft, and larceny — are the most commonly reported crimes nationwide, according to the FBI. There were about 7.2 million property crimes reported in the United States in 2018, or about 2,199.5 for every 100,000 Americans.
While property crime rates have been falling for years nationwide, in nearly every state there is at least one city where property crime is far more common than it is nationwide. 24/7 Wall St. reviewed property crime data from the FBI’s 2018 Uniform Crime Report to identify the American cities with the most property crime in every state. We considered all cities, towns, villages, and Census designated places home to at least 20,000 people in our analysis. Up-to-date crime data is not available at the municipality level in Iowa.
Distinct from violent crimes, property crimes do not involve violence or coercion and are typically perpetrated to gain money or some other benefit. Many property crimes are also committed out of financial desperation. Indeed, most of the cities and towns on this list have higher poverty rates than the 14.1% national rate, according to five-year estimates from the U.S. Census Bureau’s 2018 American Community Survey. Here is a look at the poorest city in every state.
While a high property crime rate does not necessarily mean other types of violent offenses — such as rape, robbery, or homicide — are also more common, many of the cities on this list have high reported rates of violent crime as well. Here is a complete list of America’s most dangerous cities.
Click here to see American cities with the most property crime in every state
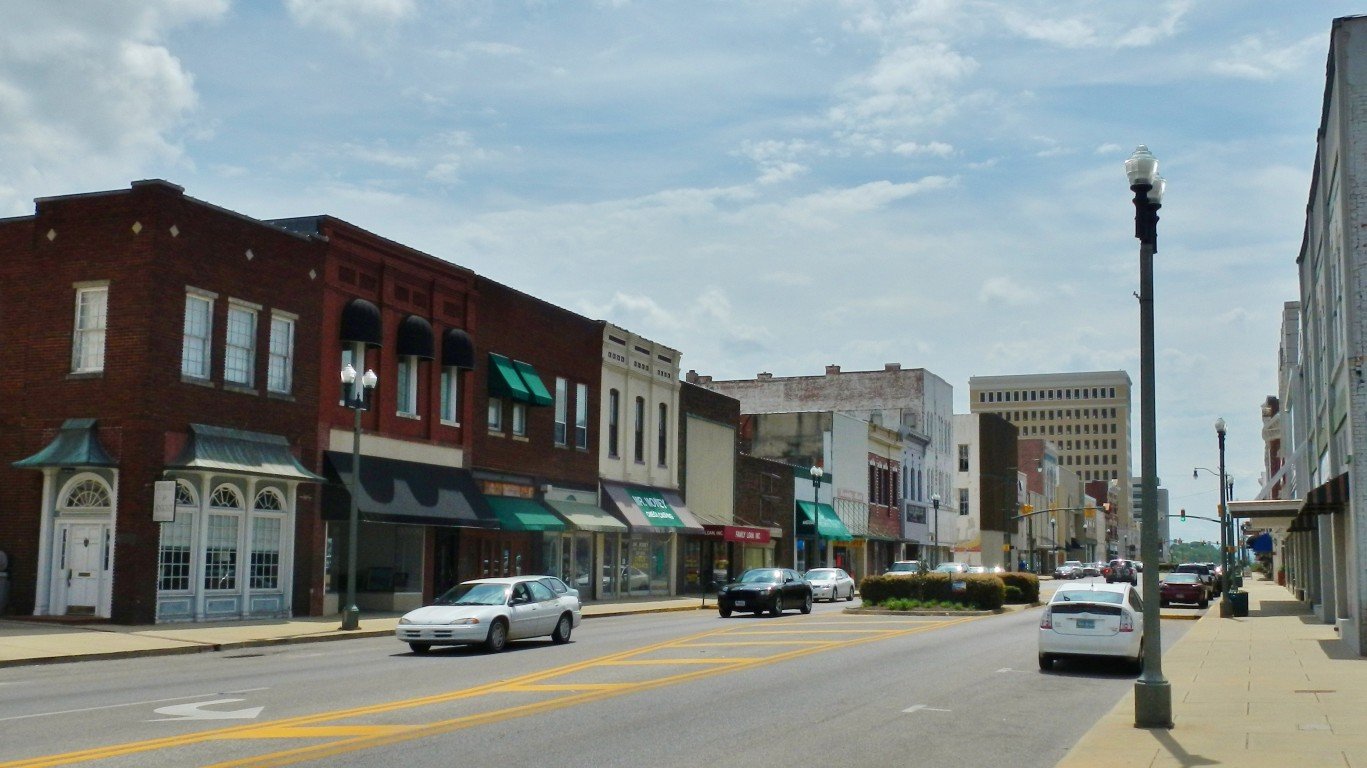
1. Alabama: Anniston
> 2018 property crimes per 100,000 people: 7,854.8 (state: 2,817.2)
> Number of property crimes in 2018: 1,696 (1.2% of state total)
> Burglaries in 2018: 413 (1.4% of state total)
> Vehicle thefts in 2018: 152 (1.2% of state total)
> Poverty rate: 29.1%
[in-text-ad]

2. Alaska: Anchorage
> 2018 property crimes per 100,000 people: 4,927.9 (state: 3,300.5)
> Number of property crimes in 2018: 14,389 (59.1% of state total)
> Burglaries in 2018: 2,068 (52.0% of state total)
> Vehicle thefts in 2018: 2,823 (70.6% of state total)
> Poverty rate: 9.2%
[recirclink id=543188]

3. Arizona: Tucson
> 2018 property crimes per 100,000 people: 4,954.1 (state: 2,676.8)
> Number of property crimes in 2018: 26,623 (13.9% of state total)
> Burglaries in 2018: 3,257 (10.3% of state total)
> Vehicle thefts in 2018: 2,568 (13.4% of state total)
> Poverty rate: 23.4%

4. Arkansas: Hot Springs
> 2018 property crimes per 100,000 people: 7,004.3 (state: 2,913.0)
> Number of property crimes in 2018: 2,592 (3.0% of state total)
> Burglaries in 2018: 740 (3.9% of state total)
> Vehicle thefts in 2018: 201 (2.8% of state total)
> Poverty rate: 25.8%
[in-text-ad-2]

5. California: West Hollywood
> 2018 property crimes per 100,000 people: 5,603.3 (state: 2,380.4)
> Number of property crimes in 2018: 2,100 (0.2% of state total)
> Burglaries in 2018: 240 (0.1% of state total)
> Vehicle thefts in 2018: 98 (0.1% of state total)
> Poverty rate: 13.0%

6. Colorado: Englewood
> 2018 property crimes per 100,000 people: 6,106.4 (state: 2,671.6)
> Number of property crimes in 2018: 2,139 (1.4% of state total)
> Burglaries in 2018: 173 (0.8% of state total)
> Vehicle thefts in 2018: 326 (1.5% of state total)
> Poverty rate: 15.1%
[in-text-ad]

7. Connecticut: Waterbury
> 2018 property crimes per 100,000 people: 3,923.3 (state: 1,681.0)
> Number of property crimes in 2018: 4,252 (7.1% of state total)
> Burglaries in 2018: 546 (6.9% of state total)
> Vehicle thefts in 2018: 838 (11.4% of state total)
> Poverty rate: 23.0%
[recirclink id=541510]

8. Delaware: Wilmington
> 2018 property crimes per 100,000 people: 4,921.5 (state: 2,324.4)
> Number of property crimes in 2018: 3,502 (15.6% of state total)
> Burglaries in 2018: 567 (18.0% of state total)
> Vehicle thefts in 2018: 452 (30.6% of state total)
> Poverty rate: 25.1%

9. Florida: Miami Beach
> 2018 property crimes per 100,000 people: 7,475.7 (state: 2,281.8)
> Number of property crimes in 2018: 6,947 (1.4% of state total)
> Burglaries in 2018: 646 (0.9% of state total)
> Vehicle thefts in 2018: 399 (1.0% of state total)
> Poverty rate: 14.9%
[in-text-ad-2]
10. Georgia: East Point
> 2018 property crimes per 100,000 people: 12,004.7 (state: 2,573.7)
> Number of property crimes in 2018: 4,260 (1.6% of state total)
> Burglaries in 2018: 531 (1.2% of state total)
> Vehicle thefts in 2018: 584 (2.4% of state total)
> Poverty rate: 22.4%

11. Hawaii: Honolulu
> 2018 property crimes per 100,000 people: 2,941.5 (state: 2,870.3)
> Number of property crimes in 2018: 28,886 (70.8% of state total)
> Burglaries in 2018: 3,577 (63.5% of state total)
> Vehicle thefts in 2018: 4,191 (74.2% of state total)
> Poverty rate: 11.3%
[in-text-ad]

12. Idaho: Lewiston
> 2018 property crimes per 100,000 people: 3,056.2 (state: 1,461.4)
> Number of property crimes in 2018: 1,007 (3.9% of state total)
> Burglaries in 2018: 140 (2.8% of state total)
> Vehicle thefts in 2018: 63 (3.2% of state total)
> Poverty rate: 14.5%
[recirclink id=531749]

13. Illinois: Lansing
> 2018 property crimes per 100,000 people: 5,465.2 (state: 1,932.8)
> Number of property crimes in 2018: 1,525 (0.6% of state total)
> Burglaries in 2018: 116 (0.3% of state total)
> Vehicle thefts in 2018: 108 (0.6% of state total)
> Poverty rate: 14.6%

14. Indiana: Mishawaka
> 2018 property crimes per 100,000 people: 5,120.7 (state: 2,179.3)
> Number of property crimes in 2018: 2,525 (1.7% of state total)
> Burglaries in 2018: 248 (1.0% of state total)
> Vehicle thefts in 2018: 245 (1.6% of state total)
> Poverty rate: 16.2%
[in-text-ad-2]

15. Iowa: No city data available
> 2018 state property crime rate: 1,691.5 incidents per 100,000 people
> Number of property crimes statewide in 2018: 53,385
> Burglaries statewide in 2018: 11,127
> Vehicle thefts statewide in 2018: 4,687
> Iowa poverty rate: 11.7%
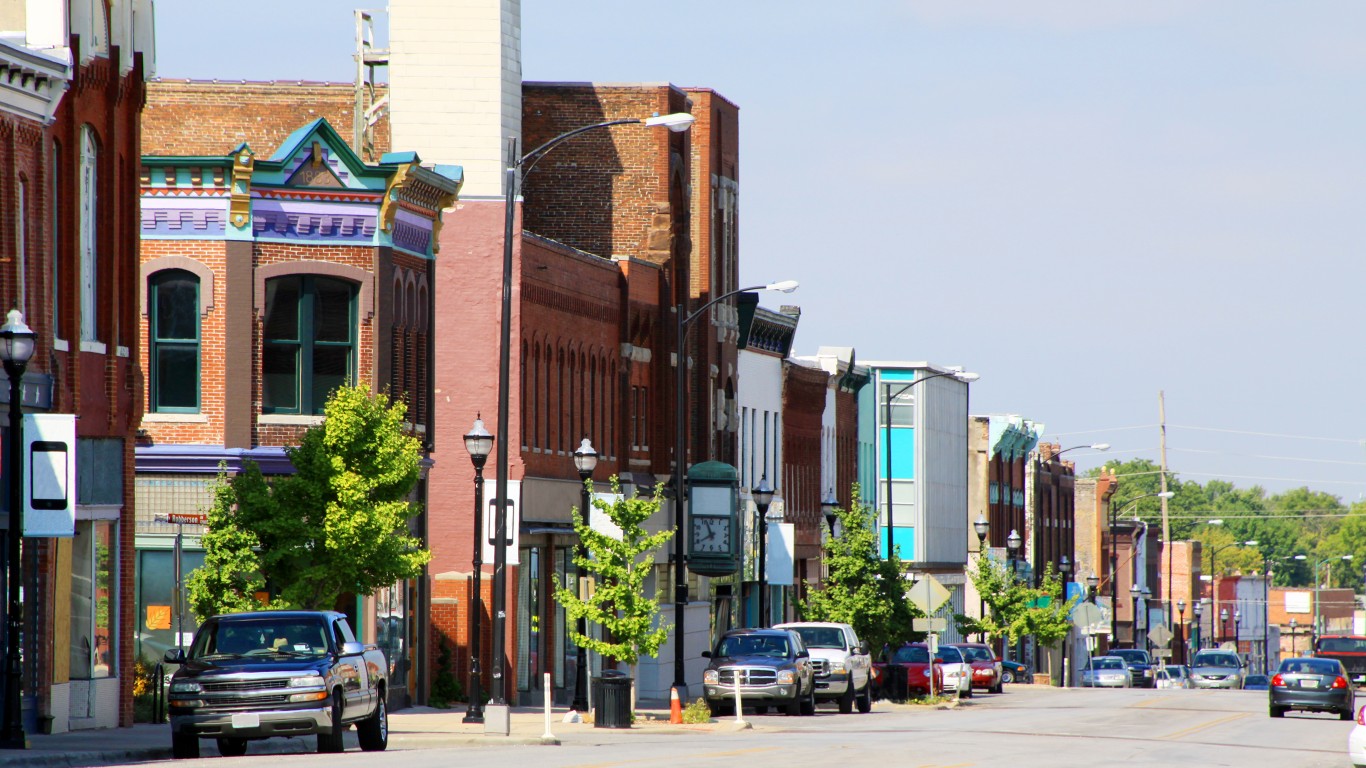
16. Kansas: Wichita
> 2018 property crimes per 100,000 people: 5,619.0 (state: 2,633.9)
> Number of property crimes in 2018: 22,011 (28.7% of state total)
> Burglaries in 2018: 3,412 (27.2% of state total)
> Vehicle thefts in 2018: 2,773 (35.4% of state total)
> Poverty rate: 16.2%
[in-text-ad]
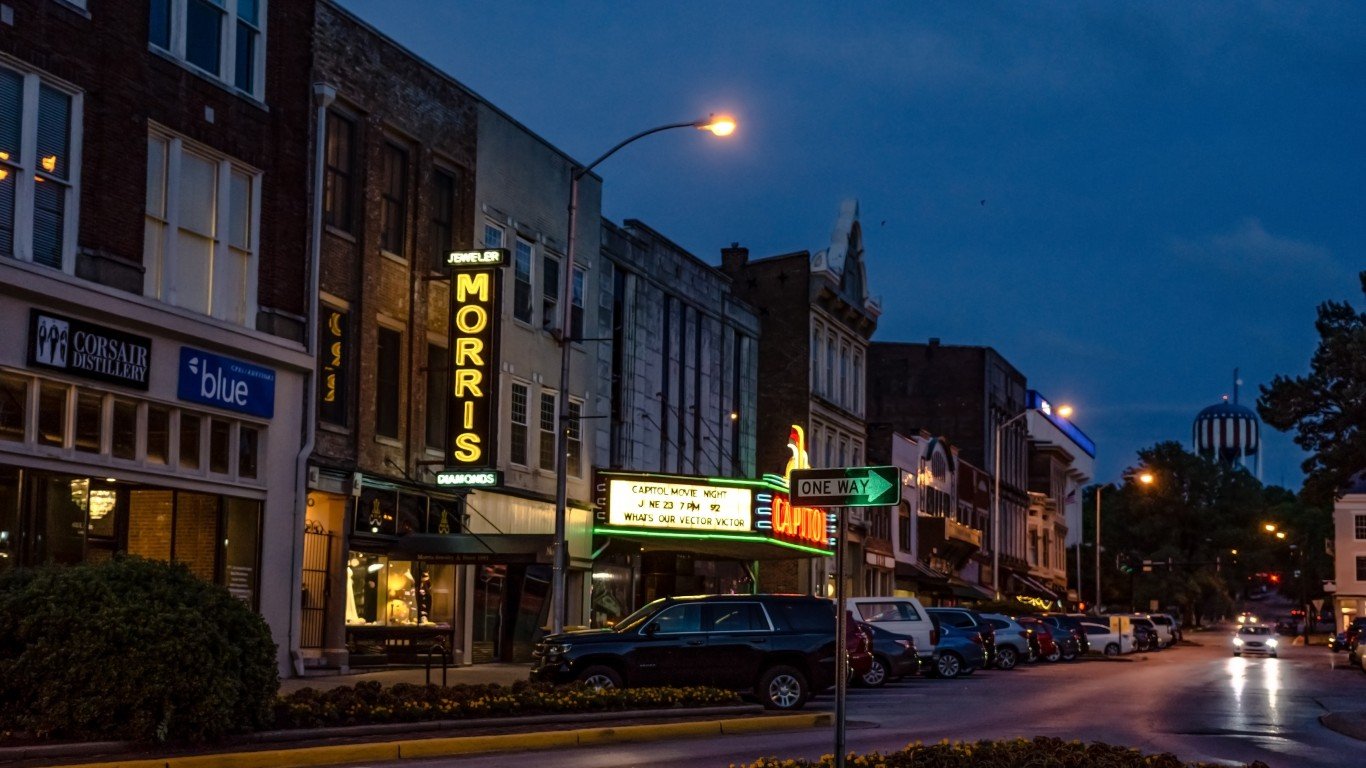
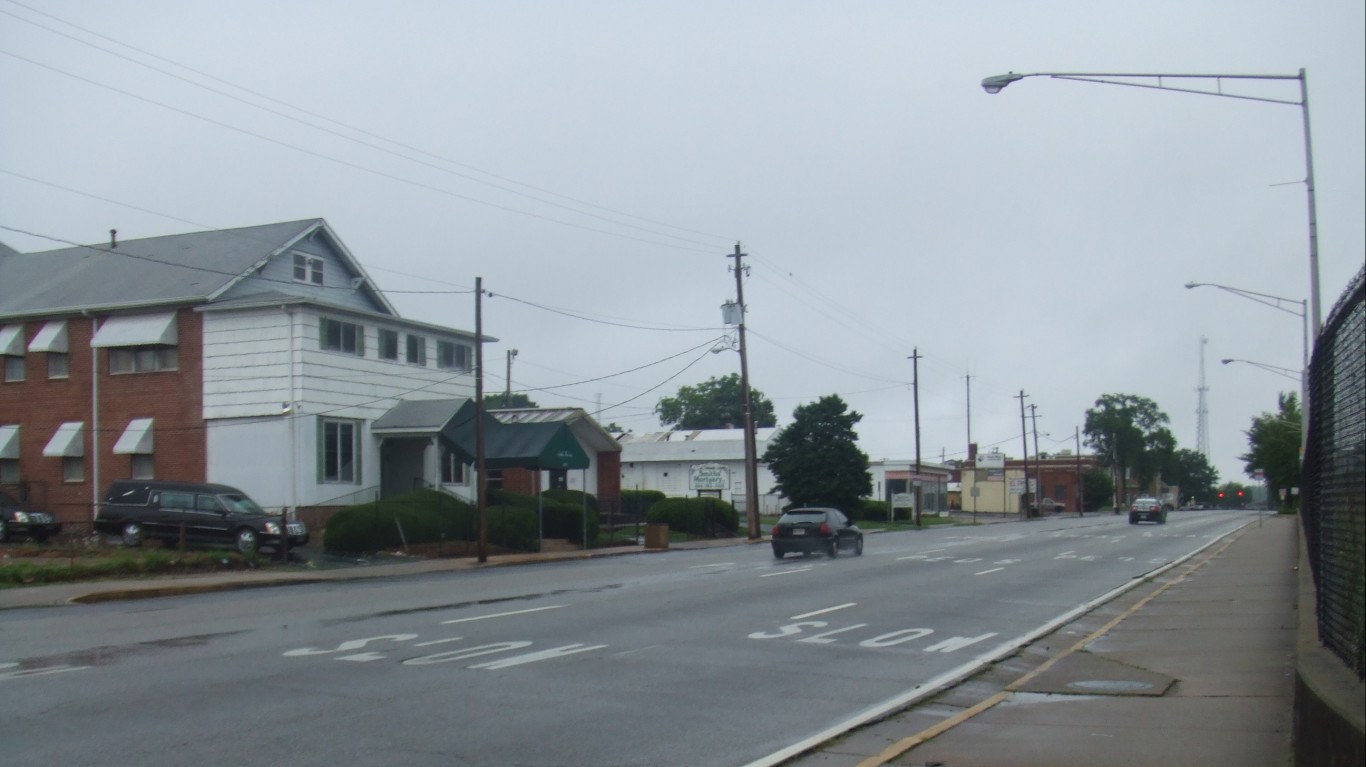
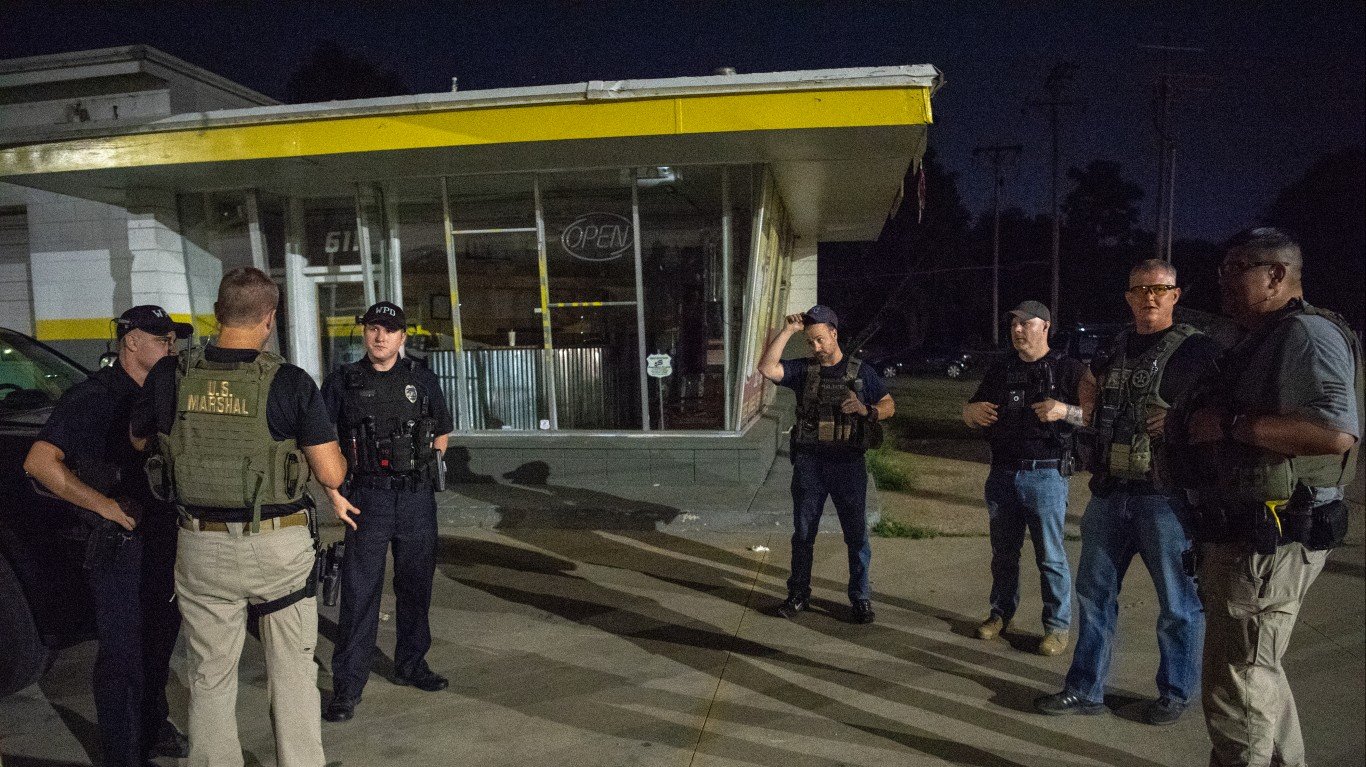
17. Kentucky: Bowling Green
> 2018 property crimes per 100,000 people: 4,851.5 (state: 1,962.6)
> Number of property crimes in 2018: 3,312 (3.8% of state total)
> Burglaries in 2018: 414 (2.4% of state total)
> Vehicle thefts in 2018: 217 (2.1% of state total)
> Poverty rate: 25.2%
[recirclink id=525423]
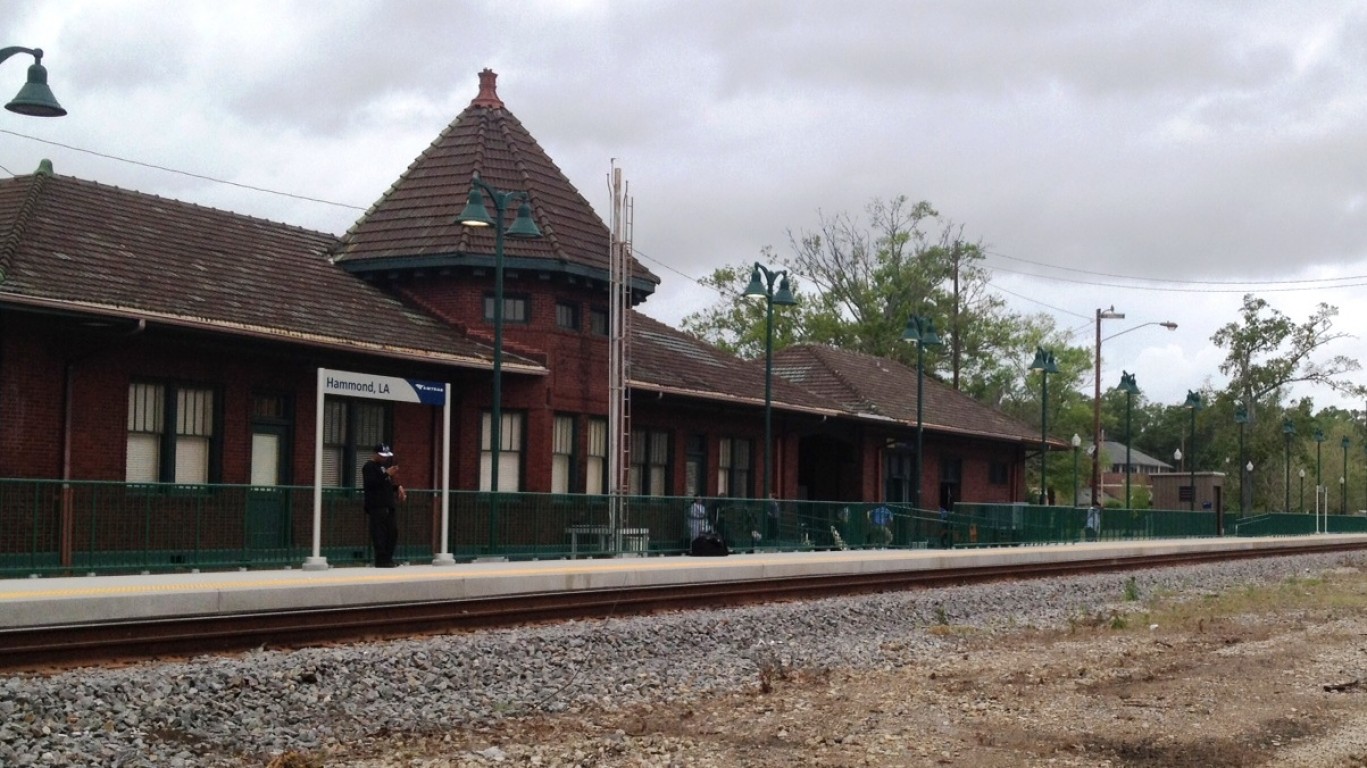
18. Louisiana: Hammond
> 2018 property crimes per 100,000 people: 10,335.8 (state: 3,276.0)
> Number of property crimes in 2018: 2,124 (1.4% of state total)
> Burglaries in 2018: 622 (2.0% of state total)
> Vehicle thefts in 2018: 117 (1.0% of state total)
> Poverty rate: 31.6%

19. Maine: Bangor
> 2018 property crimes per 100,000 people: 4,095.0 (state: 1,357.8)
> Number of property crimes in 2018: 1,300 (7.2% of state total)
> Burglaries in 2018: 89 (3.3% of state total)
> Vehicle thefts in 2018: 60 (7.7% of state total)
> Poverty rate: 22.5%
[in-text-ad-2]

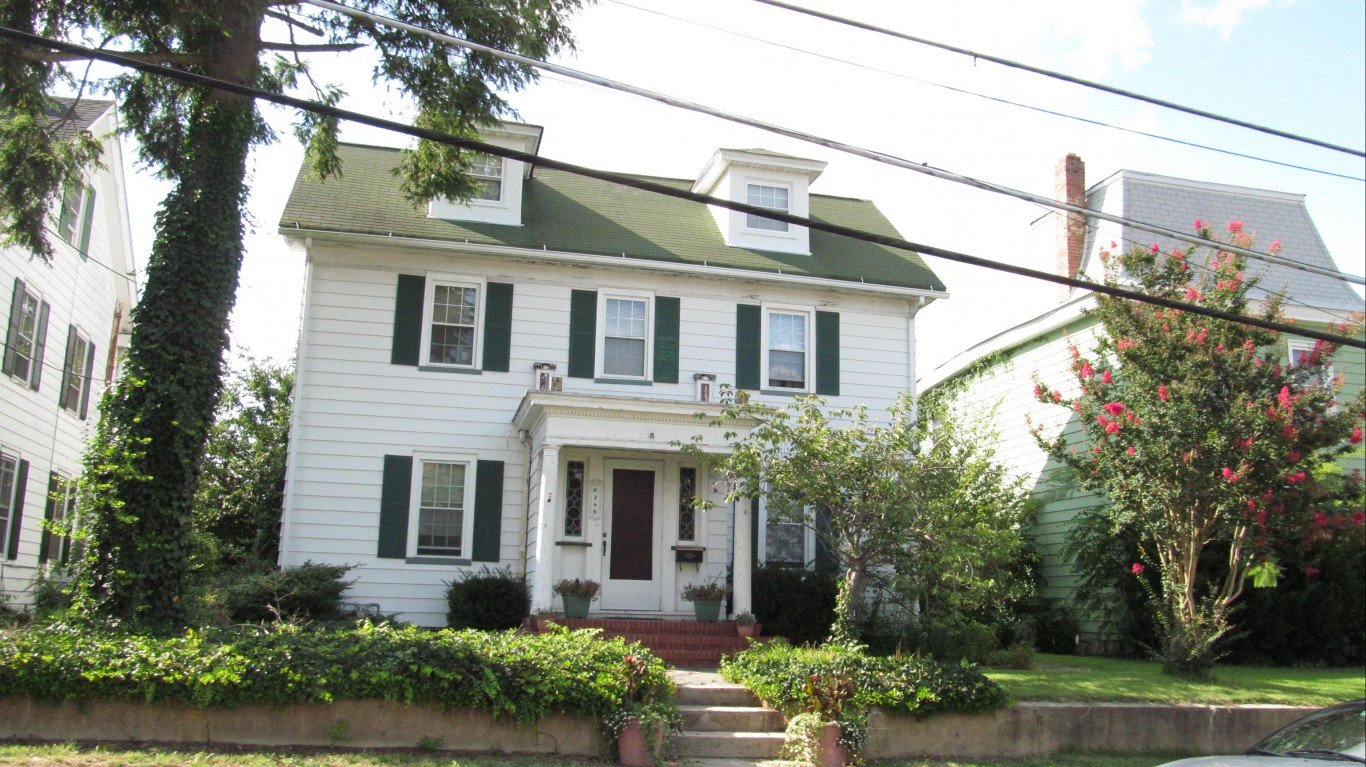
20. Maryland: Salisbury
> 2018 property crimes per 100,000 people: 4,665.0 (state: 2,033.3)
> Number of property crimes in 2018: 1,548 (1.3% of state total)
> Burglaries in 2018: 195 (1.0% of state total)
> Vehicle thefts in 2018: 41 (0.3% of state total)
> Poverty rate: 25.1%

21. Massachusetts: Holyoke
> 2018 property crimes per 100,000 people: 4,052.4 (state: 1,263.3)
> Number of property crimes in 2018: 1,640 (1.9% of state total)
> Burglaries in 2018: 246 (1.8% of state total)
> Vehicle thefts in 2018: 119 (1.8% of state total)
> Poverty rate: 29.7%
[in-text-ad]
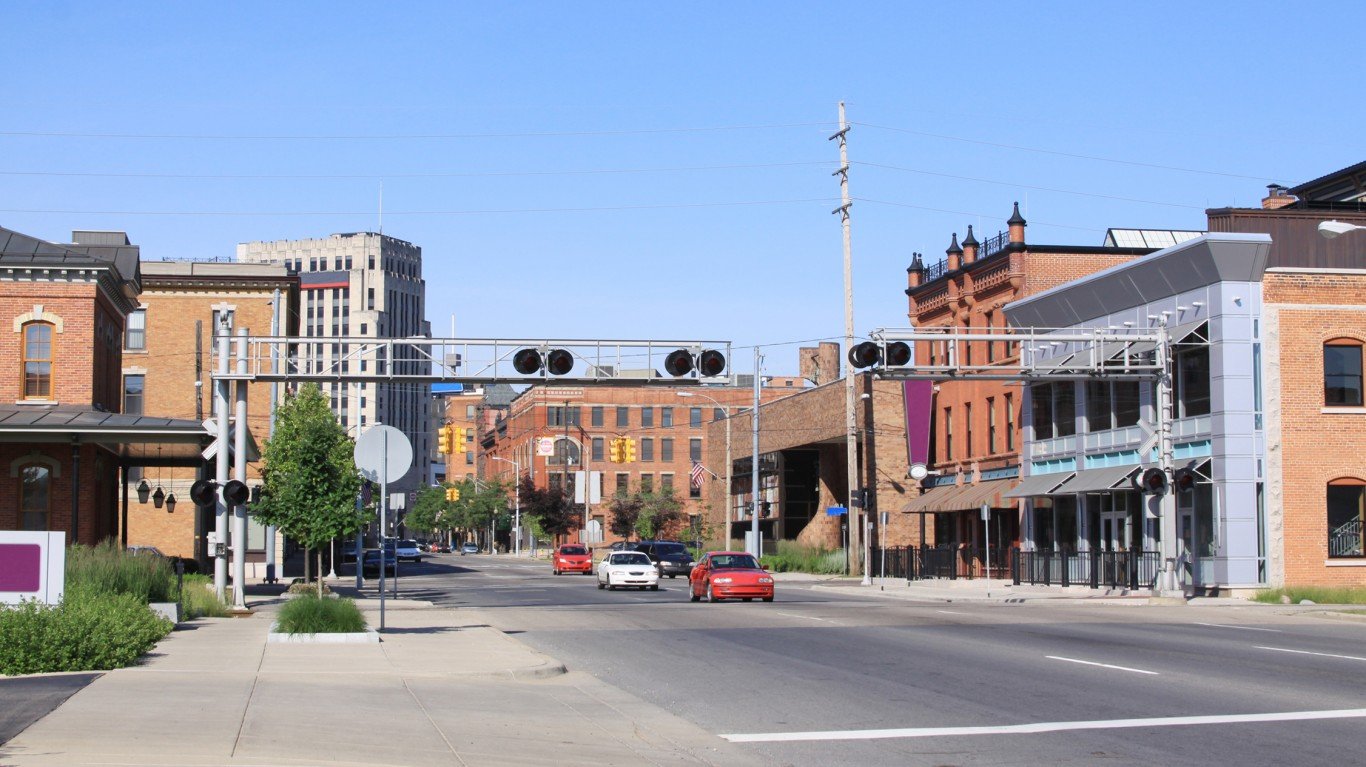
22. Michigan: Kalamazoo
> 2018 property crimes per 100,000 people: 5,031.6 (state: 1,653.5)
> Number of property crimes in 2018: 3,825 (2.3% of state total)
> Burglaries in 2018: 842 (2.7% of state total)
> Vehicle thefts in 2018: 337 (1.9% of state total)
> Poverty rate: 30.4%
[recirclink id=543188]
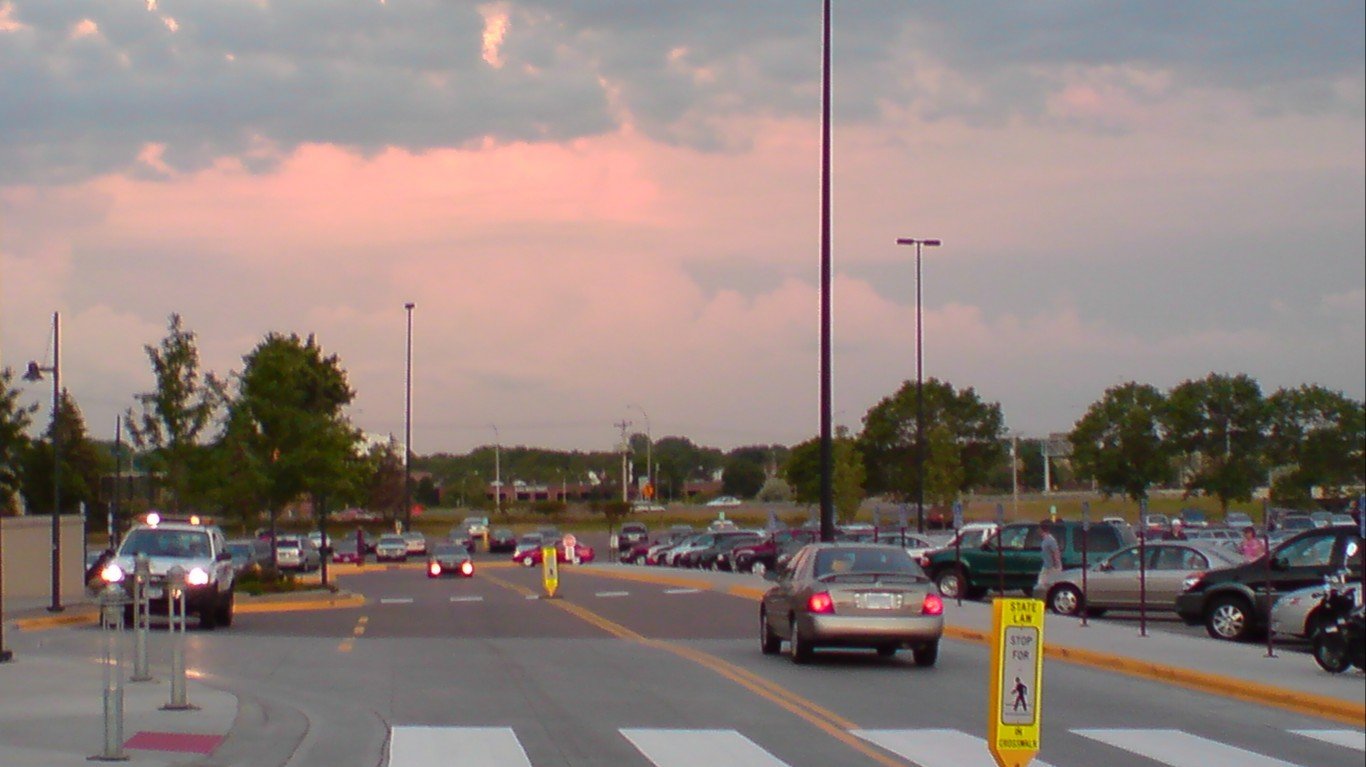
23. Minnesota: Roseville
> 2018 property crimes per 100,000 people: 4,983.5 (state: 1,993.8)
> Number of property crimes in 2018: 1,829 (1.6% of state total)
> Burglaries in 2018: 176 (1.1% of state total)
> Vehicle thefts in 2018: 86 (0.8% of state total)
> Poverty rate: 9.7%

24. Mississippi: Pascagoula
> 2018 property crimes per 100,000 people: 6,119.0 (state: 2,403.0)
> Number of property crimes in 2018: 1,325 (1.8% of state total)
> Burglaries in 2018: 187 (0.9% of state total)
> Vehicle thefts in 2018: 62 (1.4% of state total)
> Poverty rate: 24.0%
[in-text-ad-2]
25. Missouri: Springfield
> 2018 property crimes per 100,000 people: 7,019.2 (state: 2,647.1)
> Number of property crimes in 2018: 11,830 (7.3% of state total)
> Burglaries in 2018: 1,975 (7.2% of state total)
> Vehicle thefts in 2018: 1,470 (7.4% of state total)
> Poverty rate: 24.8%

26. Montana: Helena
> 2018 property crimes per 100,000 people: 5,310.7 (state: 2,496.3)
> Number of property crimes in 2018: 1,694 (6.4% of state total)
> Burglaries in 2018: 184 (5.6% of state total)
> Vehicle thefts in 2018: 136 (4.9% of state total)
> Poverty rate: 15.7%
[in-text-ad]
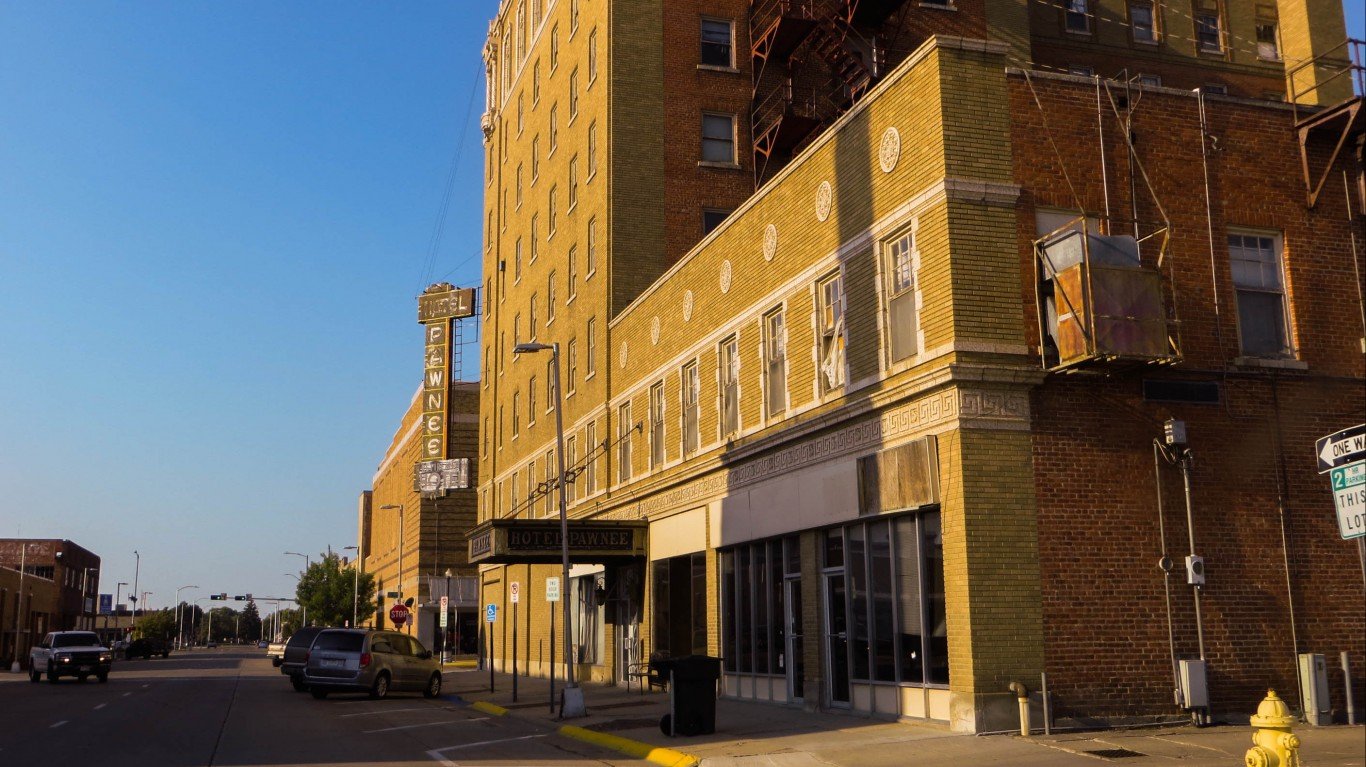
27. Nebraska: North Platte
> 2018 property crimes per 100,000 people: 4,231.5 (state: 2,079.9)
> Number of property crimes in 2018: 1,006 (2.5% of state total)
> Burglaries in 2018: 193 (3.7% of state total)
> Vehicle thefts in 2018: 71 (1.5% of state total)
> Poverty rate: 15.3%
[recirclink id=541510]

28. Nevada: Las Vegas Metropolitan Police Department
> 2018 property crimes per 100,000 people: 2,838.3 (state: 2,438.2)
> Number of property crimes in 2018: 46,673 (63.1% of state total)
> Burglaries in 2018: 11,968 (67.5% of state total)
> Vehicle thefts in 2018: 7,949 (66.8% of state total)
> Poverty rate: 15.8%
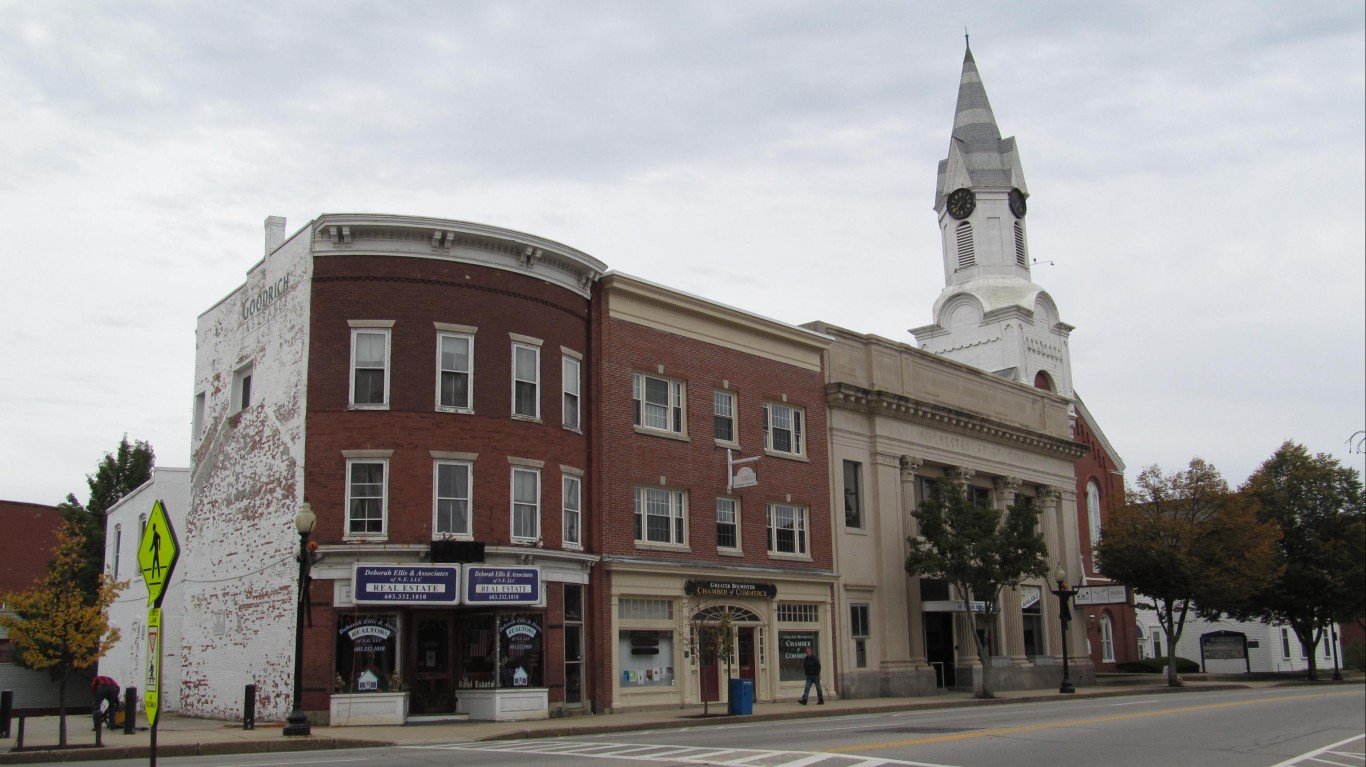
29. New Hampshire: Rochester
> 2018 property crimes per 100,000 people: 2,914.7 (state: 1,248.5)
> Number of property crimes in 2018: 902 (5.3% of state total)
> Burglaries in 2018: 82 (4.4% of state total)
> Vehicle thefts in 2018: 45 (5.2% of state total)
> Poverty rate: 12.0%
[in-text-ad-2]
30. New Jersey: Millville
> 2018 property crimes per 100,000 people: 4,371.9 (state: 1,404.9)
> Number of property crimes in 2018: 1,217 (1.0% of state total)
> Burglaries in 2018: 149 (0.8% of state total)
> Vehicle thefts in 2018: 27 (0.2% of state total)
> Poverty rate: 19.2%
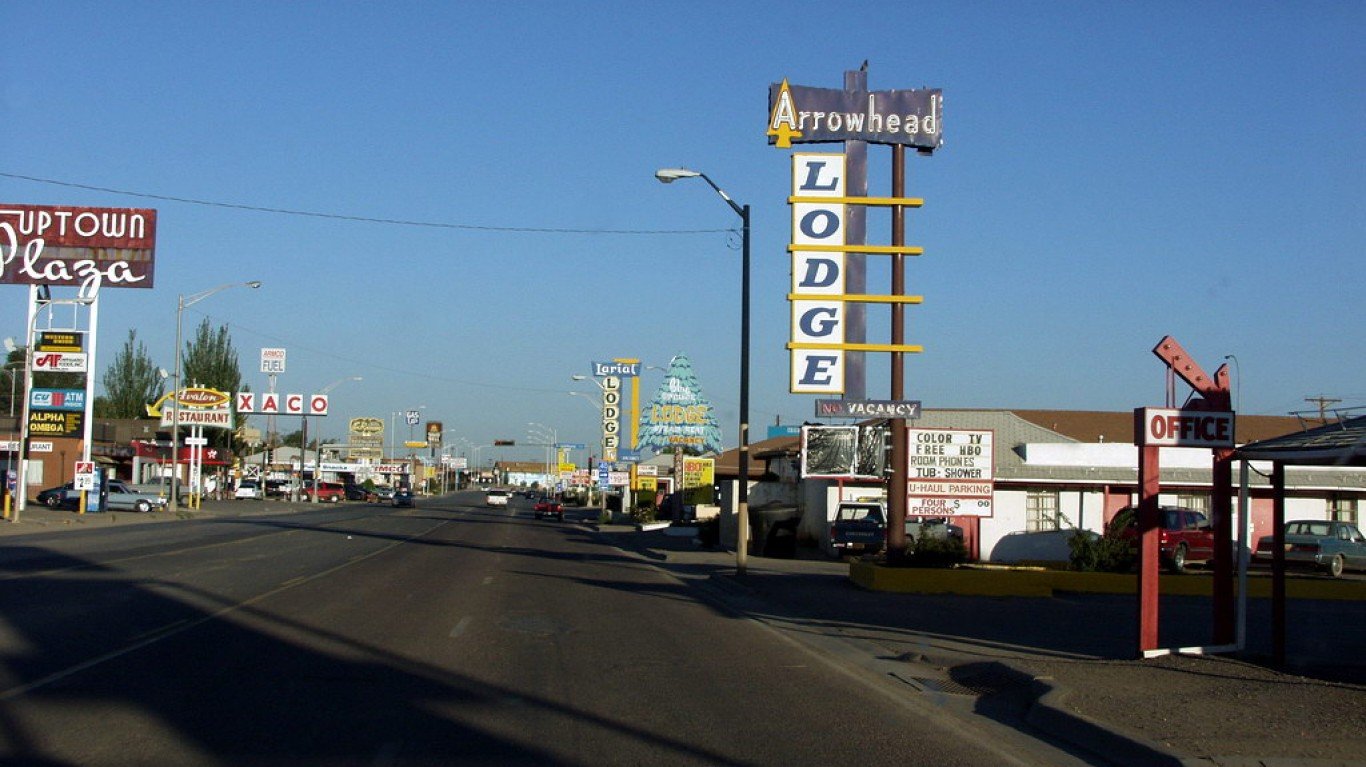
31. New Mexico: Gallup
> 2018 property crimes per 100,000 people: 6,892.6 (state: 3,419.7)
> Number of property crimes in 2018: 1,515 (2.1% of state total)
> Burglaries in 2018: 351 (2.2% of state total)
> Vehicle thefts in 2018: 164 (1.6% of state total)
> Poverty rate: 29.2%
[in-text-ad]
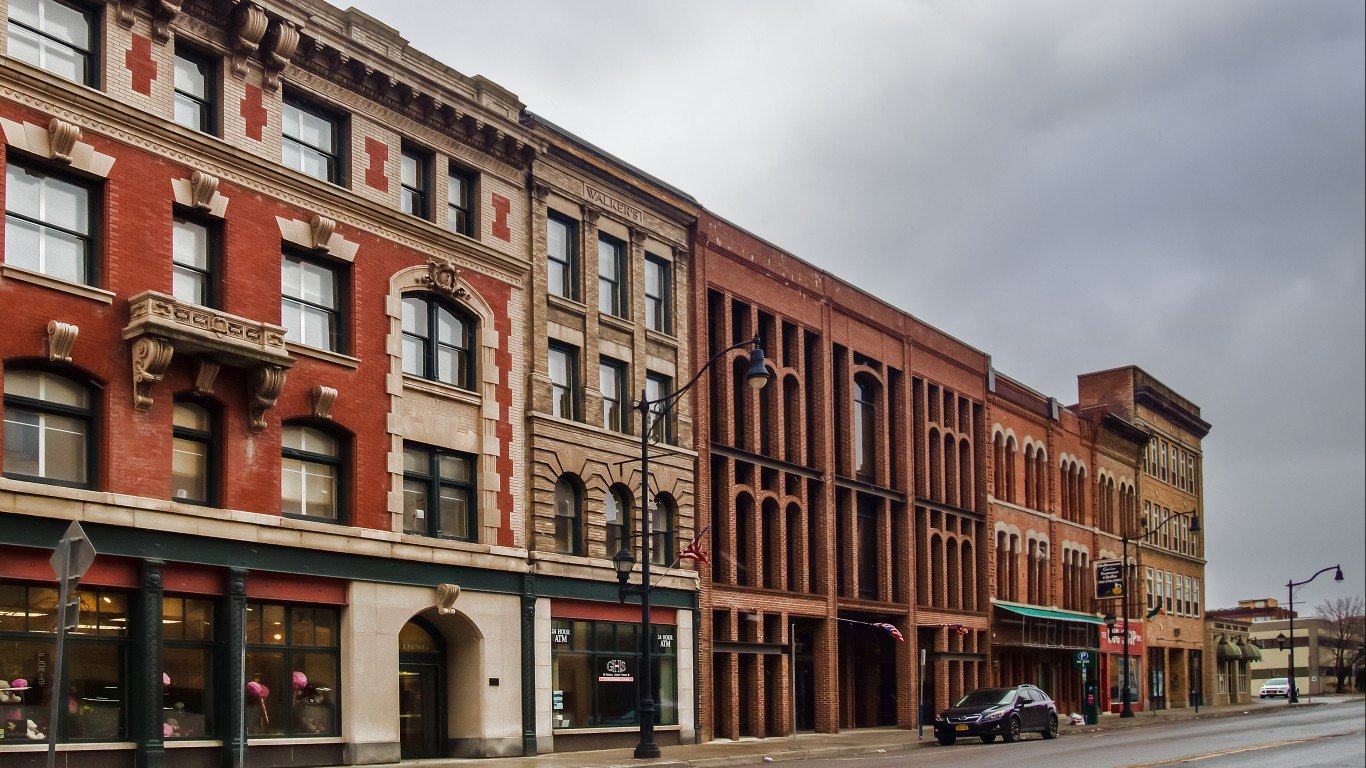
32. New York: Binghamton
> 2018 property crimes per 100,000 people: 4,218.3 (state: 1,440.5)
> Number of property crimes in 2018: 1,893 (0.7% of state total)
> Burglaries in 2018: 427 (1.4% of state total)
> Vehicle thefts in 2018: 59 (0.4% of state total)
> Poverty rate: 33.2%
[recirclink id=531749]

33. North Carolina: Kinston
> 2018 property crimes per 100,000 people: 6,415.6 (state: 2,494.1)
> Number of property crimes in 2018: 1,305 (0.5% of state total)
> Burglaries in 2018: 313 (0.5% of state total)
> Vehicle thefts in 2018: 49 (0.3% of state total)
> Poverty rate: 29.4%
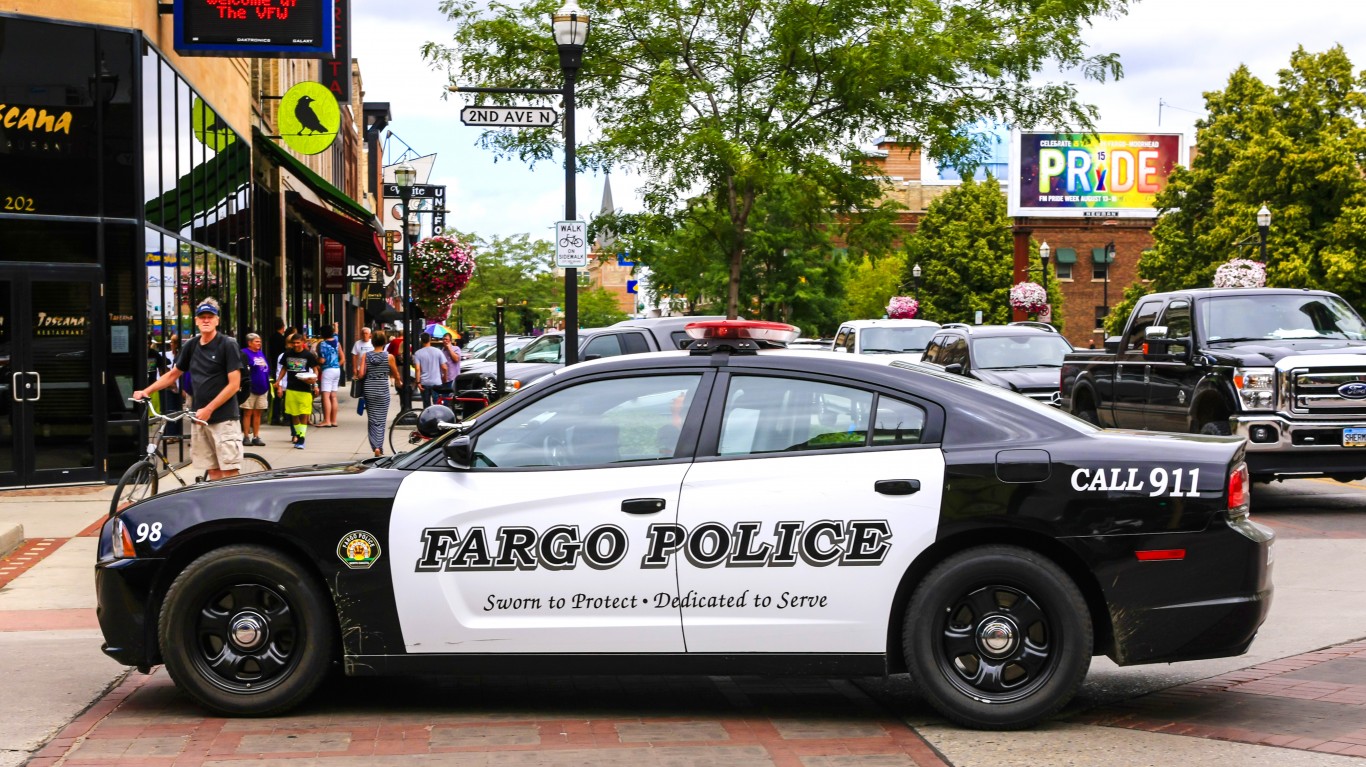
34. North Dakota: Fargo
> 2018 property crimes per 100,000 people: 3,147.2 (state: 2,040.2)
> Number of property crimes in 2018: 3,931 (25.3% of state total)
> Burglaries in 2018: 695 (25.5% of state total)
> Vehicle thefts in 2018: 309 (17.4% of state total)
> Poverty rate: 13.0%
[in-text-ad-2]

35. Ohio: Chillicothe
> 2018 property crimes per 100,000 people: 7,564.9 (state: 2,177.1)
> Number of property crimes in 2018: 1,622 (0.6% of state total)
> Burglaries in 2018: 220 (0.5% of state total)
> Vehicle thefts in 2018: 57 (0.3% of state total)
> Poverty rate: 18.6%

36. Oklahoma: Tulsa
> 2018 property crimes per 100,000 people: 5,430.5 (state: 2,875.0)
> Number of property crimes in 2018: 21,893 (19.3% of state total)
> Burglaries in 2018: 4,800 (17.9% of state total)
> Vehicle thefts in 2018: 3,259 (24.5% of state total)
> Poverty rate: 19.7%
[in-text-ad]

37. Oregon: Roseburg
> 2018 property crimes per 100,000 people: 5,982.3 (state: 2,894.0)
> Number of property crimes in 2018: 1,338 (1.1% of state total)
> Burglaries in 2018: 157 (1.0% of state total)
> Vehicle thefts in 2018: 84 (0.5% of state total)
> Poverty rate: 15.1%
[recirclink id=525423]
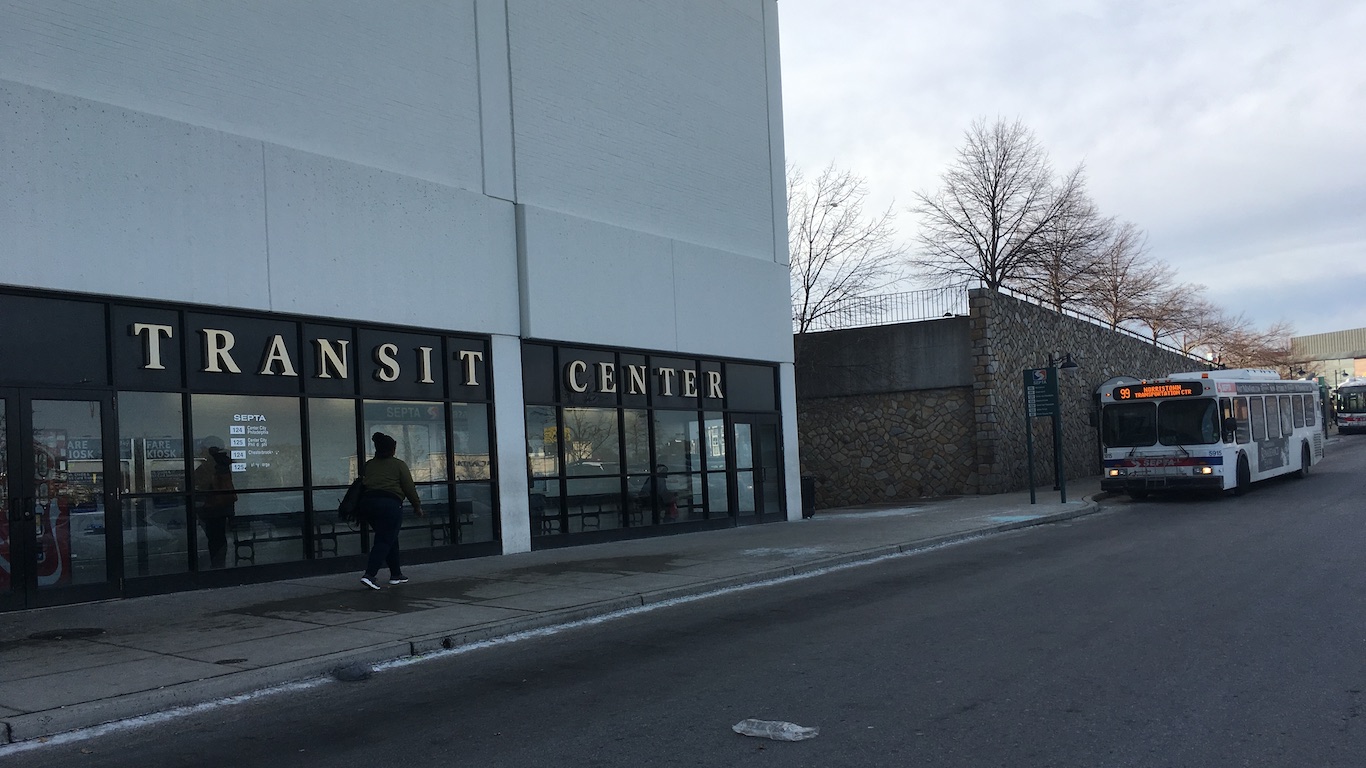
38. Pennsylvania: Upper Merion Township
> 2018 property crimes per 100,000 people: 3,602.5 (state: 1,489.9)
> Number of property crimes in 2018: 1,105 (0.6% of state total)
> Burglaries in 2018: 30 (0.1% of state total)
> Vehicle thefts in 2018: 19 (0.1% of state total)
> Poverty rate: .

39. Rhode Island: Providence
> 2018 property crimes per 100,000 people: 3,152.0 (state: 1,660.9)
> Number of property crimes in 2018: 5,679 (32.3% of state total)
> Burglaries in 2018: 931 (33.1% of state total)
> Vehicle thefts in 2018: 552 (36.1% of state total)
> Poverty rate: 26.0%
[in-text-ad-2]

40. South Carolina: Myrtle Beach
> 2018 property crimes per 100,000 people: 10,547.1 (state: 3,017.6)
> Number of property crimes in 2018: 3,553 (2.3% of state total)
> Burglaries in 2018: 410 (1.4% of state total)
> Vehicle thefts in 2018: 260 (1.8% of state total)
> Poverty rate: 22.4%

41. South Dakota: Sioux Falls
> 2018 property crimes per 100,000 people: 2,932.3 (state: 1,728.7)
> Number of property crimes in 2018: 5,288 (34.7% of state total)
> Burglaries in 2018: 652 (25.4% of state total)
> Vehicle thefts in 2018: 544 (35.7% of state total)
> Poverty rate: 11.3%
[in-text-ad]

42. Tennessee: Memphis
> 2018 property crimes per 100,000 people: 6,405.6 (state: 2,825.4)
> Number of property crimes in 2018: 41,779 (21.8% of state total)
> Burglaries in 2018: 8,494 (25.6% of state total)
> Vehicle thefts in 2018: 4,450 (21.8% of state total)
> Poverty rate: 26.8%
[recirclink id=543188]
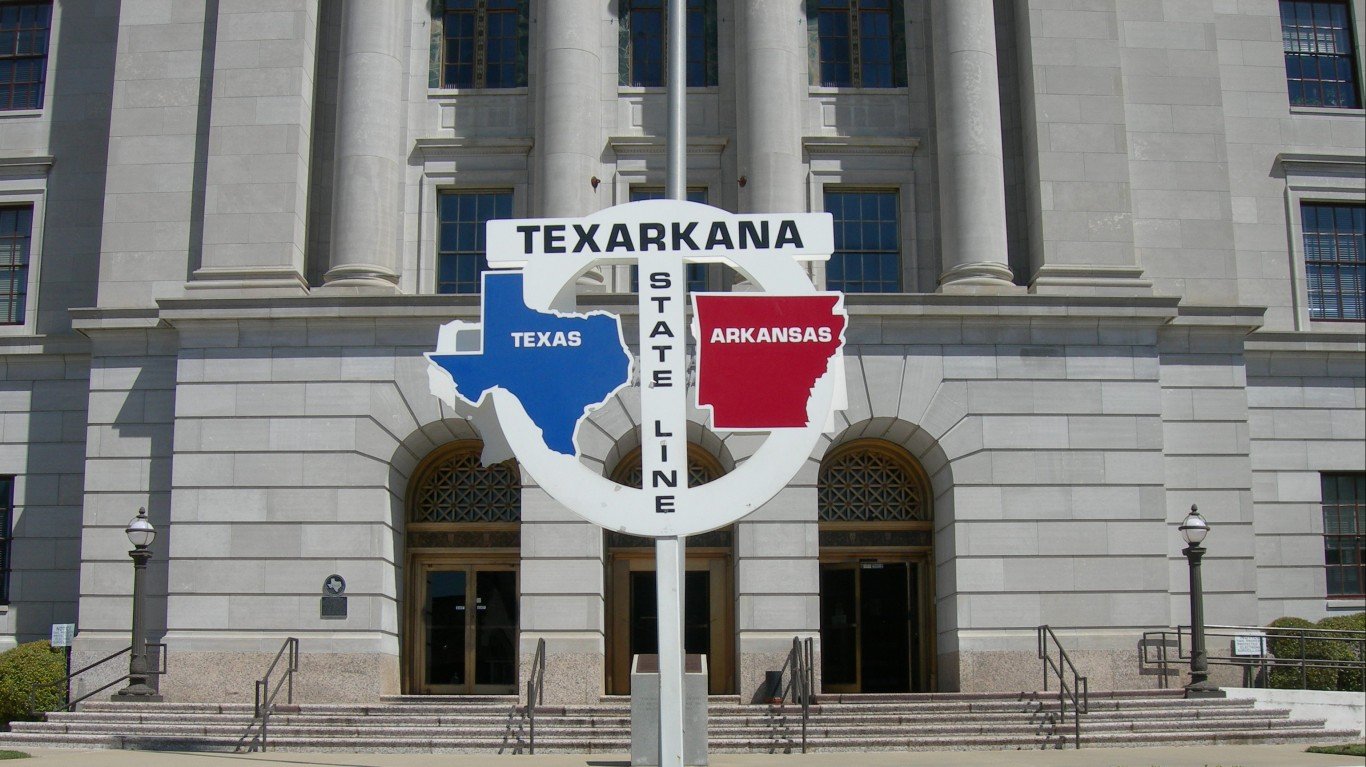
43. Texas: Texarkana
> 2018 property crimes per 100,000 people: 5,109.5 (state: 2,367.2)
> Number of property crimes in 2018: 1,914 (0.3% of state total)
> Burglaries in 2018: 348 (0.3% of state total)
> Vehicle thefts in 2018: 139 (0.2% of state total)
> Poverty rate: 23.0%
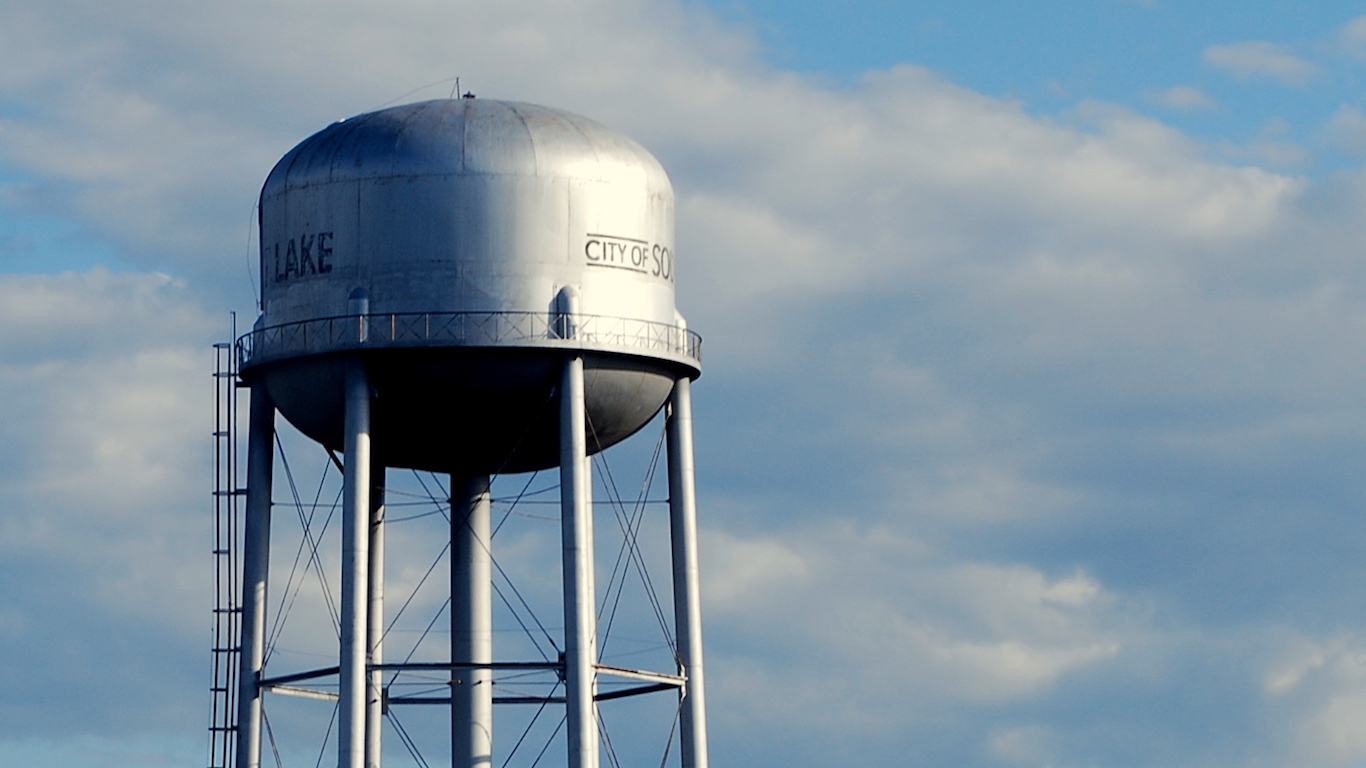
44. Utah: South Salt Lake
> 2018 property crimes per 100,000 people: 7,138.3 (state: 2,377.5)
> Number of property crimes in 2018: 1,796 (2.4% of state total)
> Burglaries in 2018: 237 (2.4% of state total)
> Vehicle thefts in 2018: 313 (4.1% of state total)
> Poverty rate: 21.8%
[in-text-ad-2]

45. Vermont: Burlington
> 2018 property crimes per 100,000 people: 1,982.8 (state: 1,283.1)
> Number of property crimes in 2018: 837 (10.4% of state total)
> Burglaries in 2018: 120 (8.2% of state total)
> Vehicle thefts in 2018: 13 (5.1% of state total)
> Poverty rate: 24.7%

46. Virginia: Portsmouth
> 2018 property crimes per 100,000 people: 5,282.4 (state: 1,665.8)
> Number of property crimes in 2018: 4,977 (3.5% of state total)
> Burglaries in 2018: 958 (6.2% of state total)
> Vehicle thefts in 2018: 368 (3.4% of state total)
> Poverty rate: 17.2%
[in-text-ad]
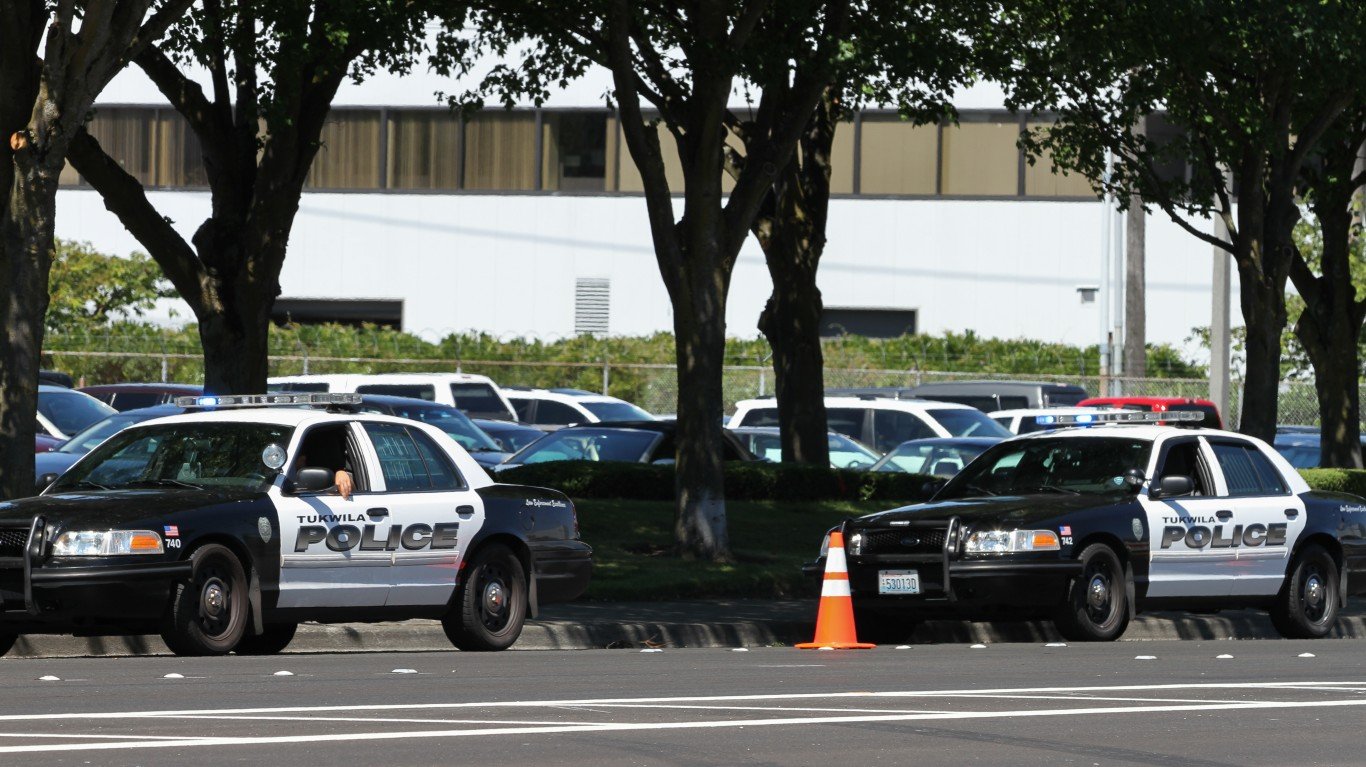
47. Washington: Tukwila
> 2018 property crimes per 100,000 people: 16,763.6 (state: 2,946.2)
> Number of property crimes in 2018: 3,401 (1.5% of state total)
> Burglaries in 2018: 273 (0.7% of state total)
> Vehicle thefts in 2018: 572 (2.1% of state total)
> Poverty rate: 19.1%
[recirclink id=541510]

48. West Virginia: Charleston
> 2018 property crimes per 100,000 people: 6,010.1 (state: 1,485.6)
> Number of property crimes in 2018: 2,853 (10.6% of state total)
> Burglaries in 2018: 660 (12.3% of state total)
> Vehicle thefts in 2018: 246 (9.8% of state total)
> Poverty rate: 20.6%

49. Wisconsin: Superior
> 2018 property crimes per 100,000 people: 4,275.7 (state: 1,559.9)
> Number of property crimes in 2018: 1,114 (1.2% of state total)
> Burglaries in 2018: 150 (1.1% of state total)
> Vehicle thefts in 2018: 82 (0.9% of state total)
> Poverty rate: 15.0%
[in-text-ad-2]
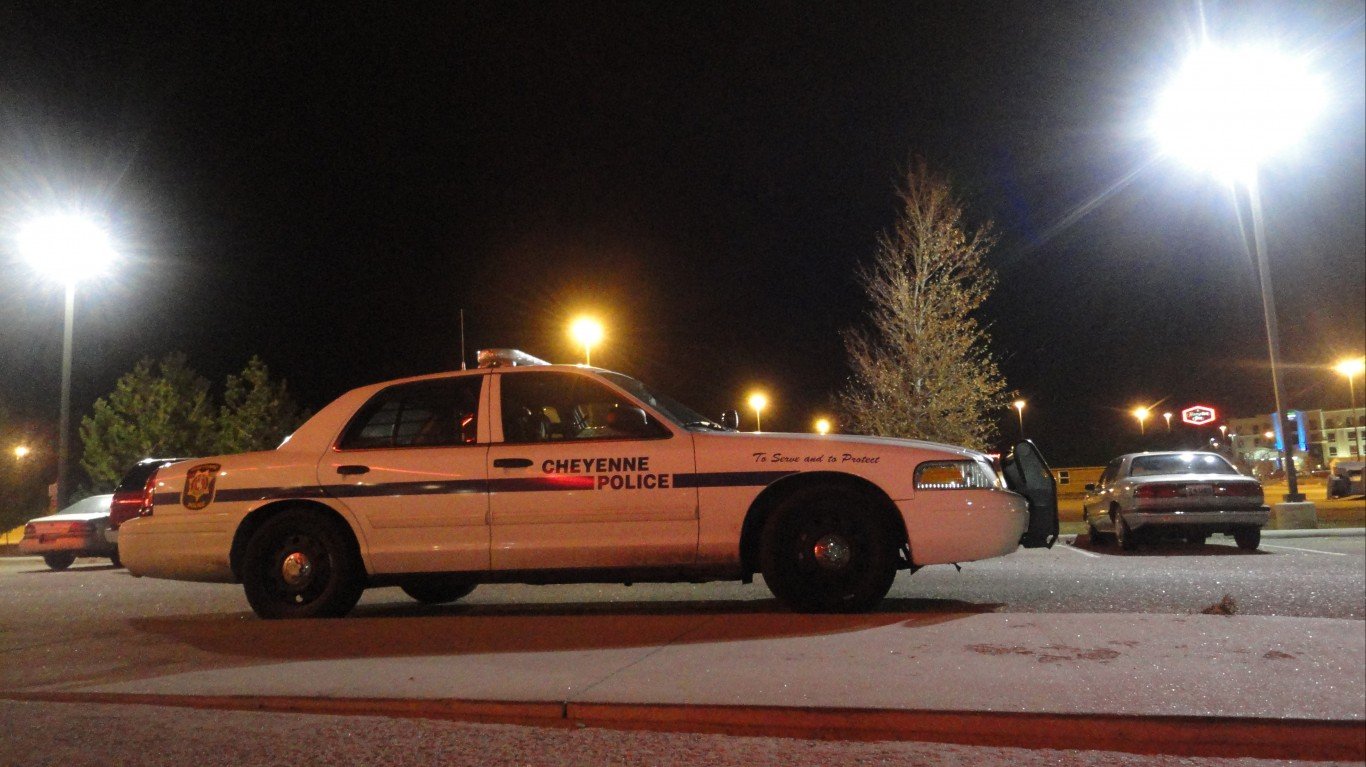
50. Wyoming: Cheyenne
> 2018 property crimes per 100,000 people: 3,987.3 (state: 1,785.1)
> Number of property crimes in 2018: 2,559 (24.8% of state total)
> Burglaries in 2018: 280 (18.4% of state total)
> Vehicle thefts in 2018: 216 (25.7% of state total)
> Poverty rate: 10.7%
Contact [email protected] for any questions or corrections.