[cnxvideo id=”940102″ placement=”ros”]
There were an estimated 748,841 vehicle thefts in the United States in 2018, or about 229 per 100,000 Americans. The vehicles stolen were worth, according to the FBI, an estimated total of over $6 billion. Compared to 2017, the vehicles stolen last year represent a 3.1% decrease from the previous year, but a 9.0% increase compared to 2014.
Of course, where you live can greatly increase or decrease the chances of your car getting stolen. The National Insurance Crime Bureau, a not-for-profit anti-fraud organization for insurance companies, produced 2018 vehicle theft rates at the metropolitan level per 100,000 people, using data from the U.S. Census Bureau and the FBI’s National Crime Information Center. These are the 40 U.S. metropolitan areas with vehicle theft rates greater than 400 per 100,000 people.
The 40 metropolitan areas on this list are highly concentrated in just a few states. By far, the most highly represented state is California, which has 15 metro areas on this list. Almost all 40 metro areas are in the South or the West. None are in the Northeast, which tends to have relatively low property and violent crime rates. These are America’s most violent and peaceful states.
Not surprisingly, most of the cities on this list have higher rates not just of auto theft, but of property crimes in general. The national property crime rate in 2018 was 2,200 per 100,000 people. All but two of the metro areas with available data have higher property crime rates, with several exceeding 4,000 incidents per 100,000 people. These are the cities where crime is soaring in every state.
Click here to see which cities your car is most likely to be stolen in
Click here to read our methodology

40. Sacramento–Roseville–Arden-Arcade, CA
> Vehicle theft rate (2018): 400.0 per 100,000 residents
> Total vehicles stolen (2018): 9,381
> Property crime rate (2018): 2,161.4 per 100,000 residents
[in-text-ad]
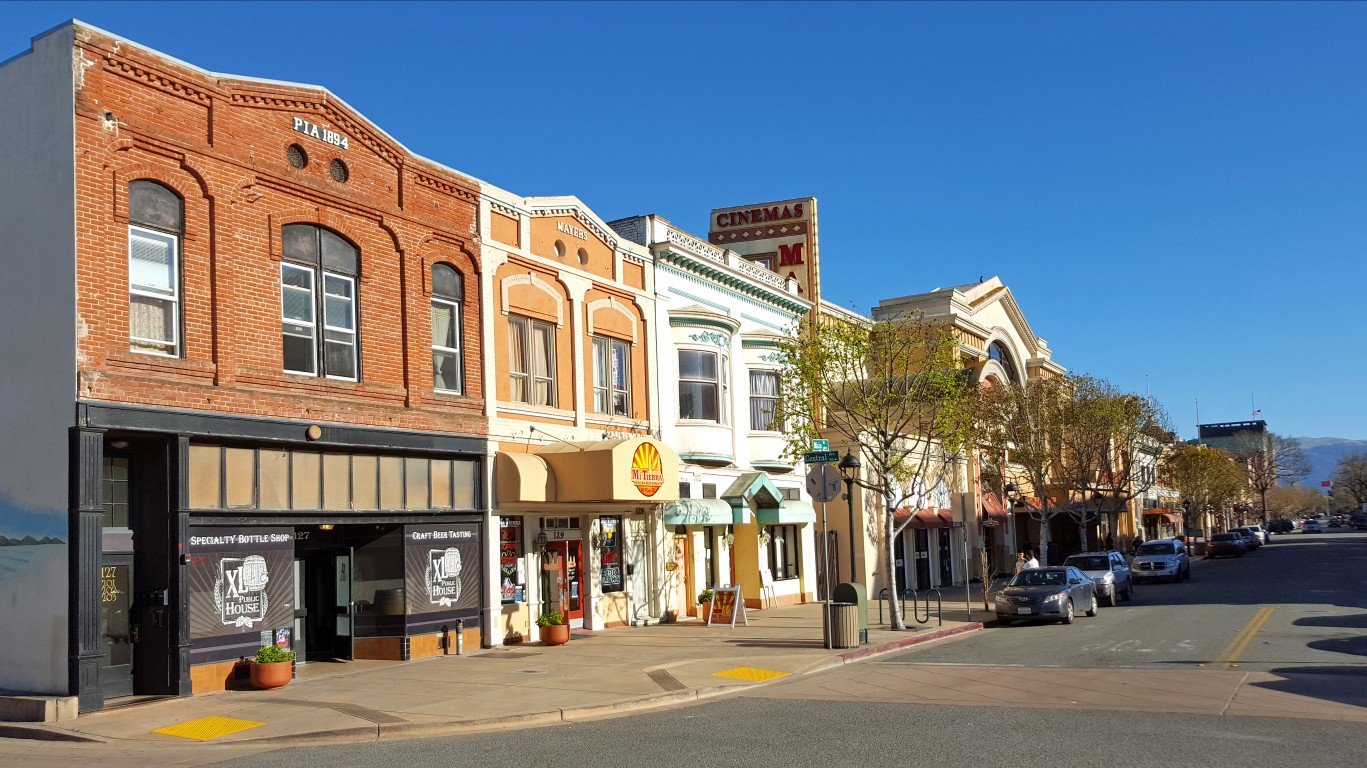
39. Salinas, CA
> Vehicle theft rate (2018): 400.4 per 100,000 residents
> Total vehicles stolen (2018): 1,744
> Property crime rate (2018): 2,063.3 per 100,000 residents
[recirclink id=582958]

38. Los Angeles-Long Beach-Anaheim, CA
> Vehicle theft rate (2018): 405.7 per 100,000 residents
> Total vehicles stolen (2018): 53,928
> Property crime rate (2018): 2,246.9 per 100,000 residents
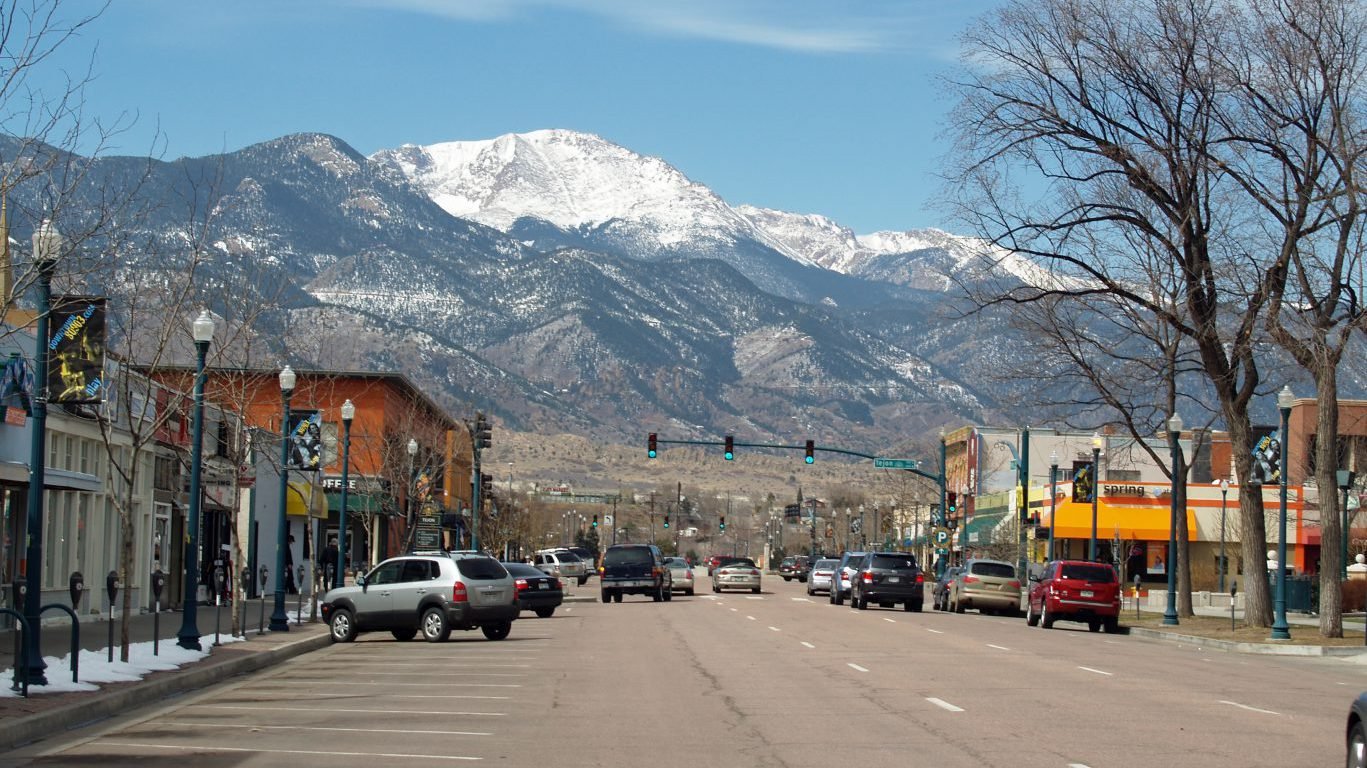
37. Colorado Springs, CO
> Vehicle theft rate (2018): 411.3 per 100,000 residents
> Total vehicles stolen (2018): 3,039
> Property crime rate (2018): 2,649.7 per 100,000 residents
[in-text-ad-2]
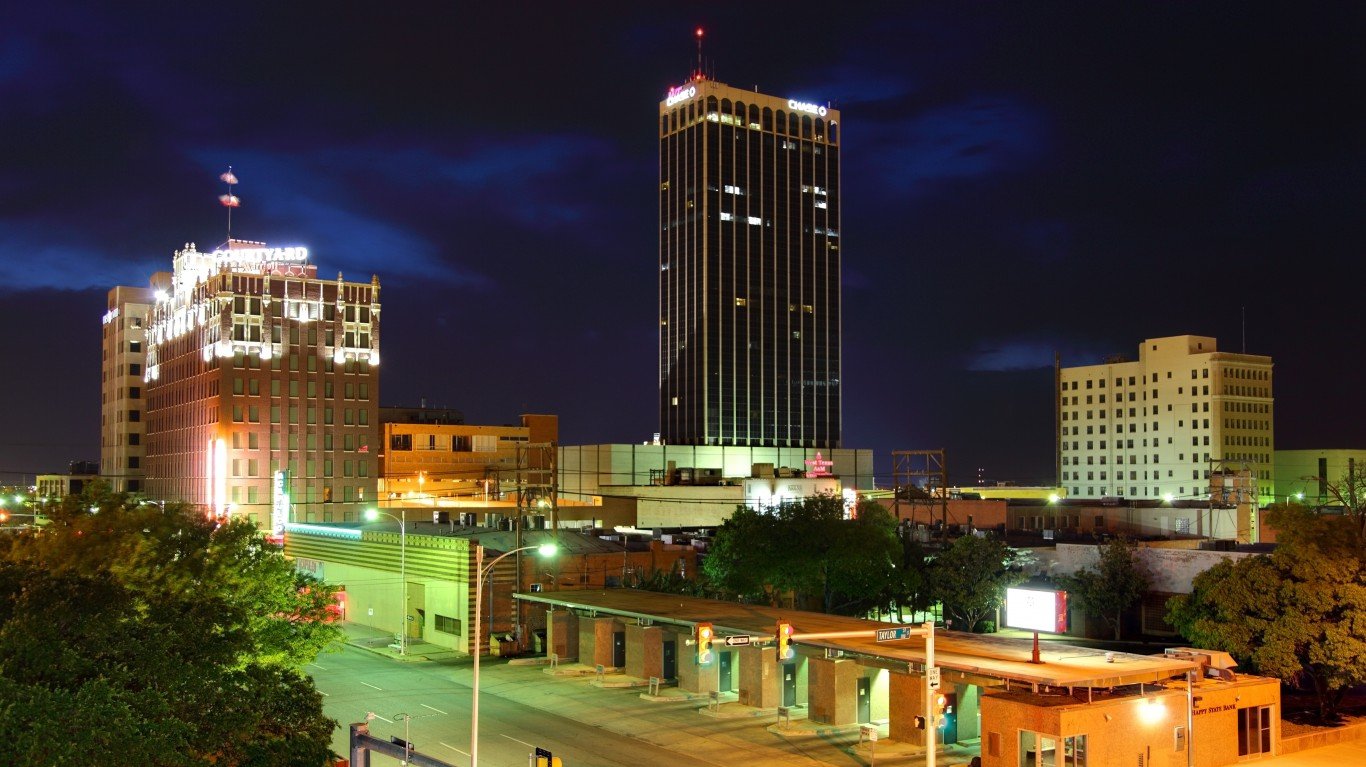
36. Amarillo, TX
> Vehicle theft rate (2018): 434.7 per 100,000 residents
> Total vehicles stolen (2018): 1,156
> Property crime rate (2018): 3,426.5 per 100,000 residents

35. Mobile, AL
> Vehicle theft rate (2018): 435.8 per 100,000 residents
> Total vehicles stolen (2018): 1,803
> Property crime rate (2018): 3,890.9 per 100,000 residents
[in-text-ad]

34. Memphis, TN-MS-AR
> Vehicle theft rate (2018): 440.5 per 100,000 residents
> Total vehicles stolen (2018): 5,950
> Property crime rate (2018): 4,271.1 per 100,000 residents
[recirclink id=580172]

33. Salt Lake City, UT
> Vehicle theft rate (2018): 446.5 per 100,000 residents
> Total vehicles stolen (2018): 5,458
> Property crime rate (2018): 3,661.4 per 100,000 residents

32. Columbia, SC
> Vehicle theft rate (2018): 447.7 per 100,000 residents
> Total vehicles stolen (2018): 3,728
> Property crime rate (2018): 3,506.0 per 100,000 residents
[in-text-ad-2]
31. Odessa, TX
> Vehicle theft rate (2018): 447.8 per 100,000 residents
> Total vehicles stolen (2018): 726
> Property crime rate (2018): 2,863.2 per 100,000 residents
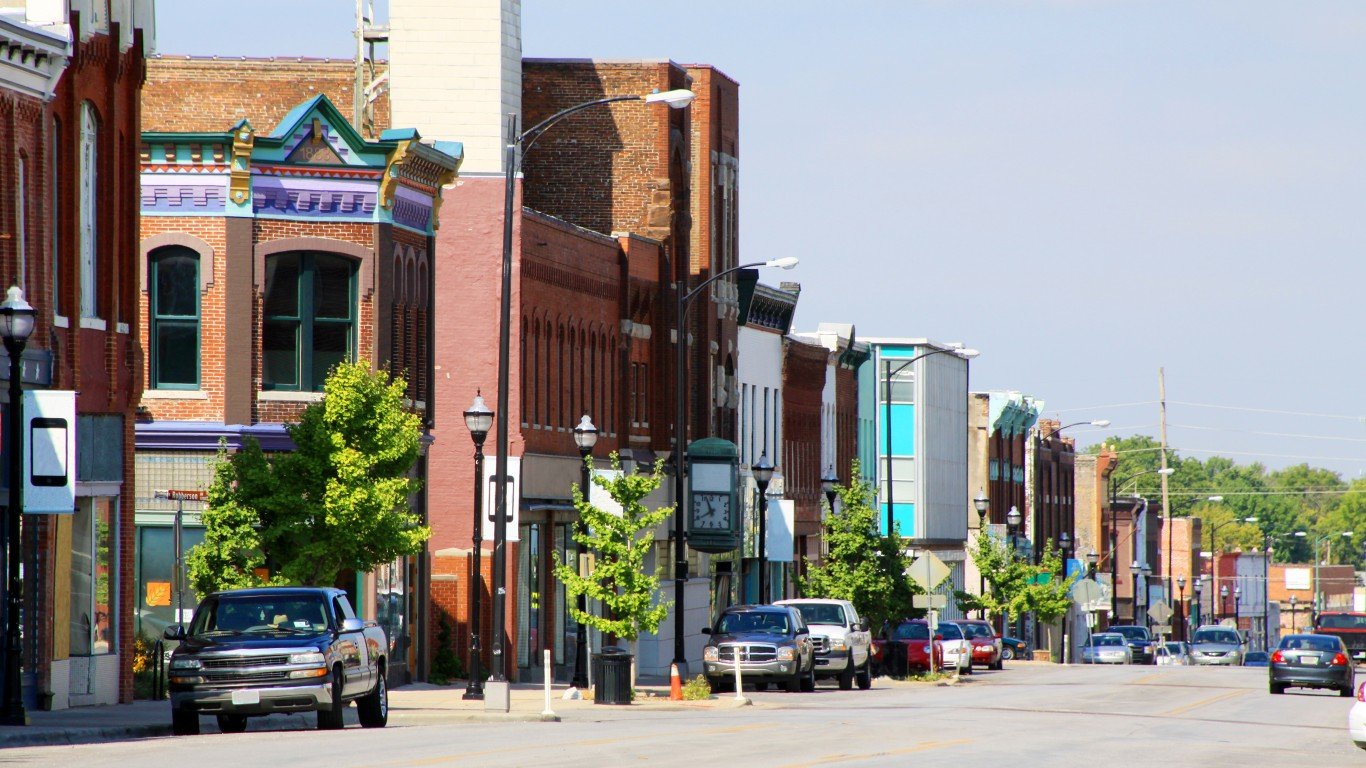
30. Springfield, MO
> Vehicle theft rate (2018): 450.8 per 100,000 residents
> Total vehicles stolen (2018): 2,105
> Property crime rate (2018): 3,415.2 per 100,000 residents
[in-text-ad]

29. Kansas City, MO-KS
> Vehicle theft rate (2018): 453.1 per 100,000 residents
> Total vehicles stolen (2018): 9,712
> Property crime rate (2018): N/A
[recirclink id=584214]
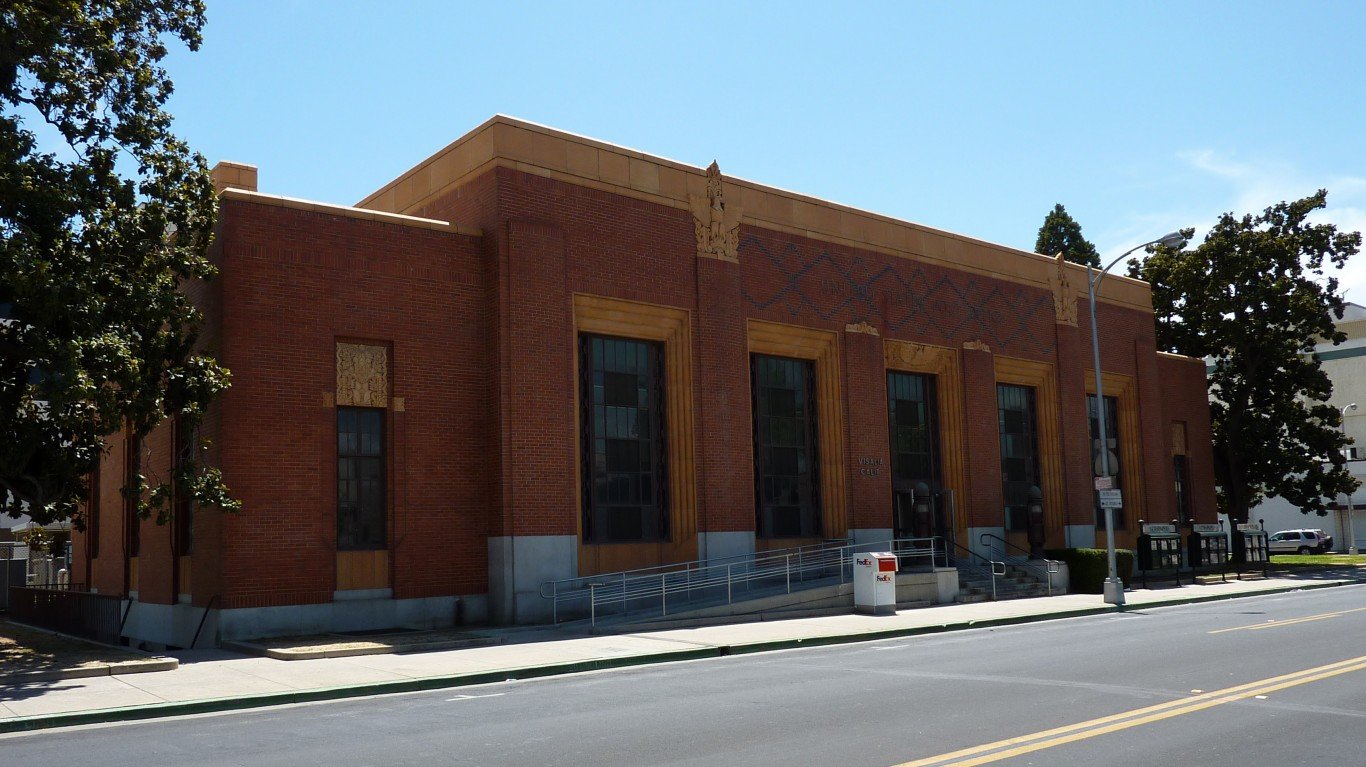
28. Visalia-Porterville, CA
> Vehicle theft rate (2018): 454.2 per 100,000 residents
> Total vehicles stolen (2018): 2,116
> Property crime rate (2018): 2,517.5 per 100,000 residents

27. Charleston, WV
> Vehicle theft rate (2018): 454.4 per 100,000 residents
> Total vehicles stolen (2018): 959
> Property crime rate (2018): 2,669.3 per 100,000 residents
[in-text-ad-2]
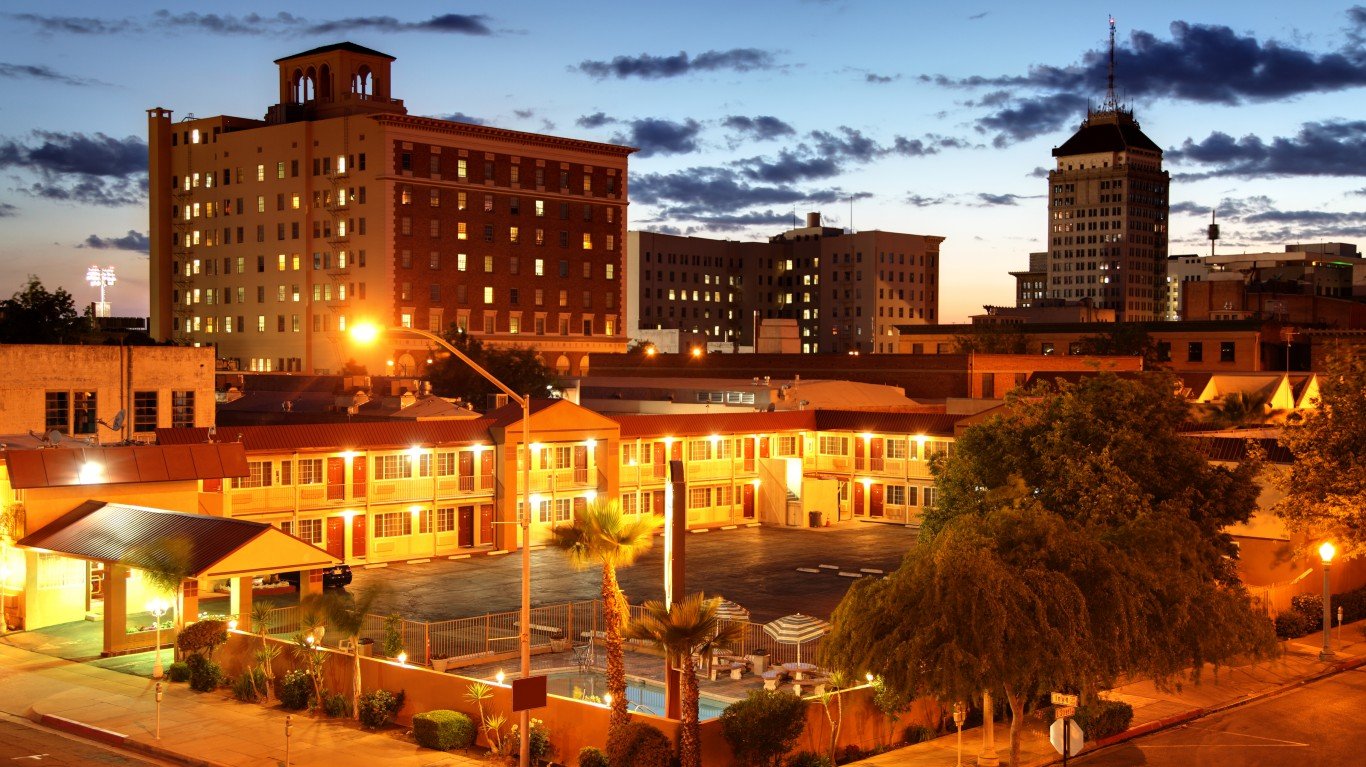
26. Fresno, CA
> Vehicle theft rate (2018): 456.3 per 100,000 residents
> Total vehicles stolen (2018): 4,537
> Property crime rate (2018): 2,770.4 per 100,000 residents
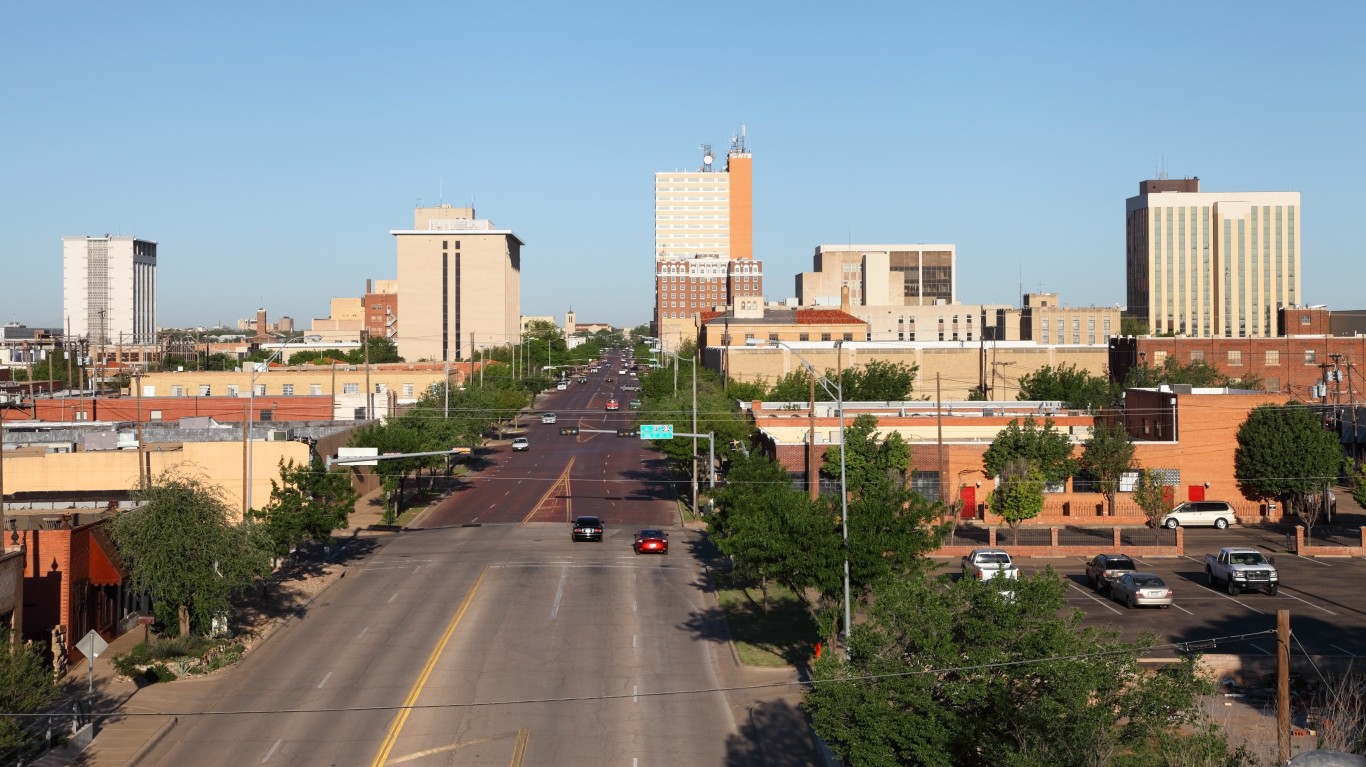
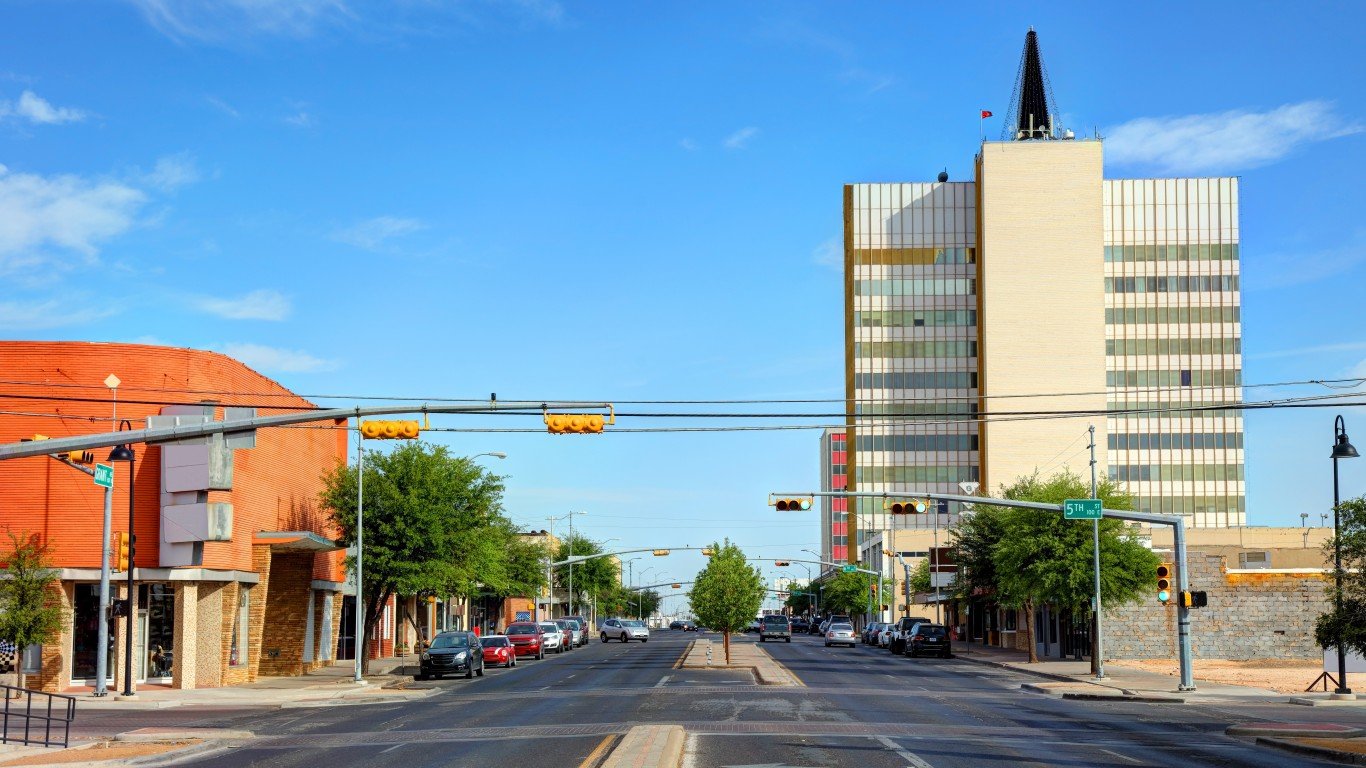
25. Lubbock, TX
> Vehicle theft rate (2018): 462.9 per 100,000 residents
> Total vehicles stolen (2018): 1,477
> Property crime rate (2018): 3,963.5 per 100,000 residents
[in-text-ad]

24. Las Vegas-Henderson-Paradise, NV
> Vehicle theft rate (2018): 464.4 per 100,000 residents
> Total vehicles stolen (2018): 10,364
> Property crime rate (2018): 2,670.8 per 100,000 residents
[recirclink id=584514]

23. Yakima, WA
> Vehicle theft rate (2018): 466.1 per 100,000 residents
> Total vehicles stolen (2018): 1,172
> Property crime rate (2018): 2,833.9 per 100,000 residents

22. Seattle-Tacoma-Bellevue, WA
> Vehicle theft rate (2018): 466.3 per 100,000 residents
> Total vehicles stolen (2018): 18,371
> Property crime rate (2018): 3,345.2 per 100,000 residents
[in-text-ad-2]
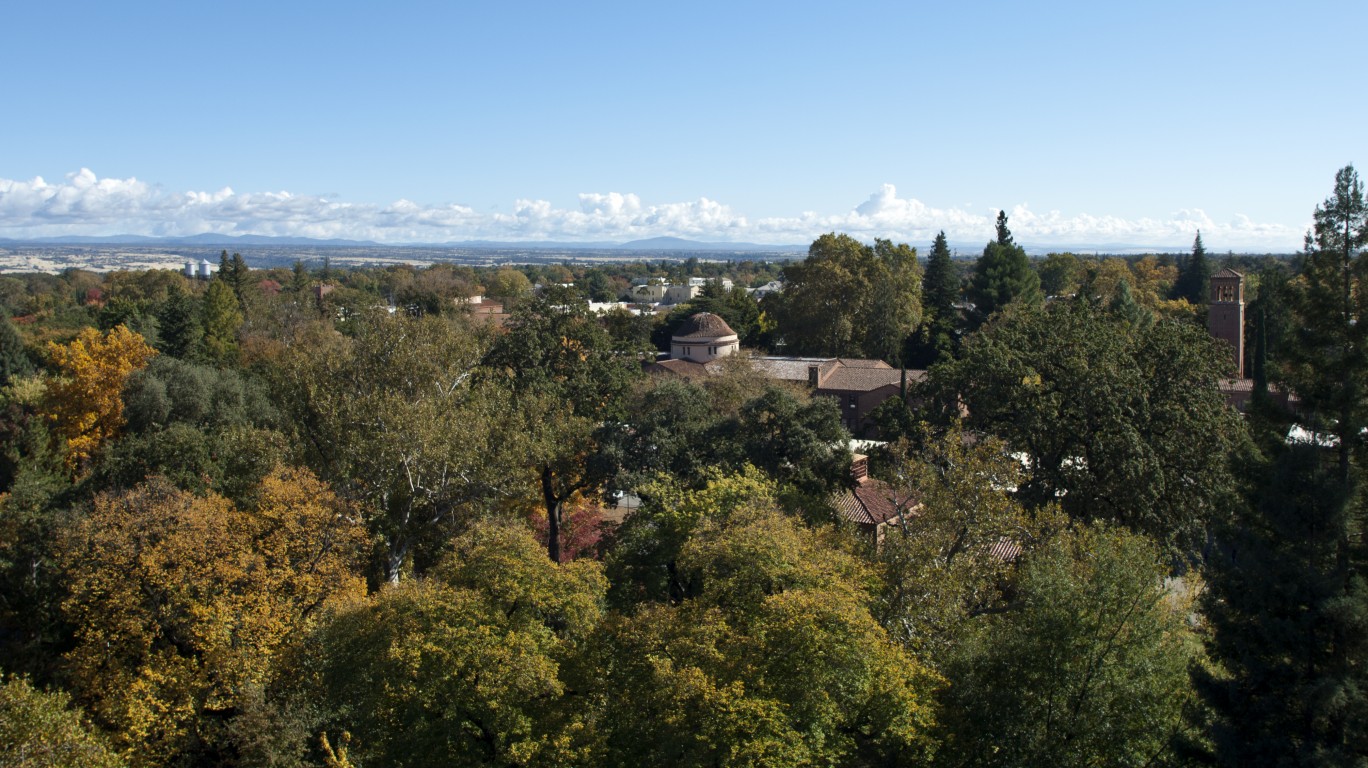
21. Chico, CA
> Vehicle theft rate (2018): 468.3 per 100,000 residents
> Total vehicles stolen (2018): 1,083
> Property crime rate (2018): 2,544.6 per 100,000 residents
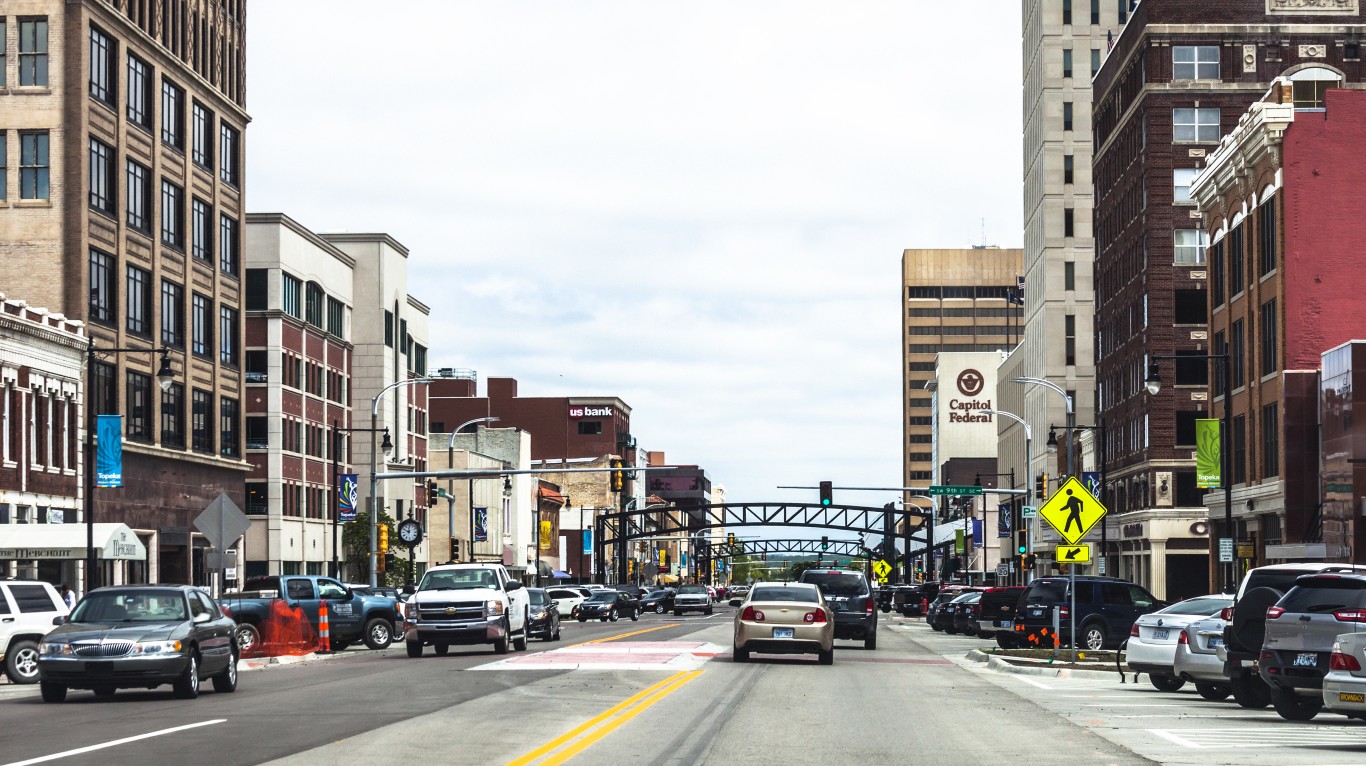
20. Topeka, KS
> Vehicle theft rate (2018): 468.6 per 100,000 residents
> Total vehicles stolen (2018): 1,090
> Property crime rate (2018): 3,606.2 per 100,000 residents
[in-text-ad]
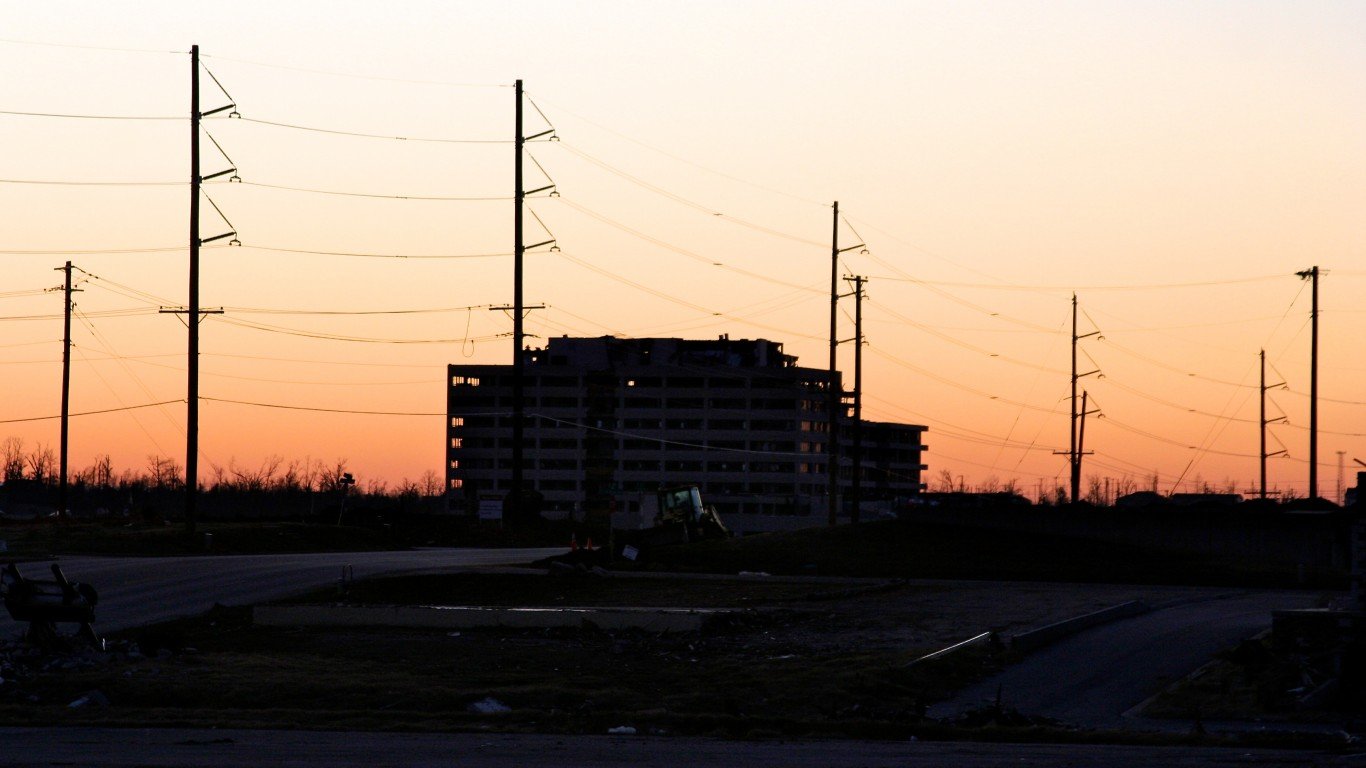
19. Joplin, MO
> Vehicle theft rate (2018): 473.4 per 100,000 residents
> Total vehicles stolen (2018): 847
> Property crime rate (2018): N/A
[recirclink id=573238]
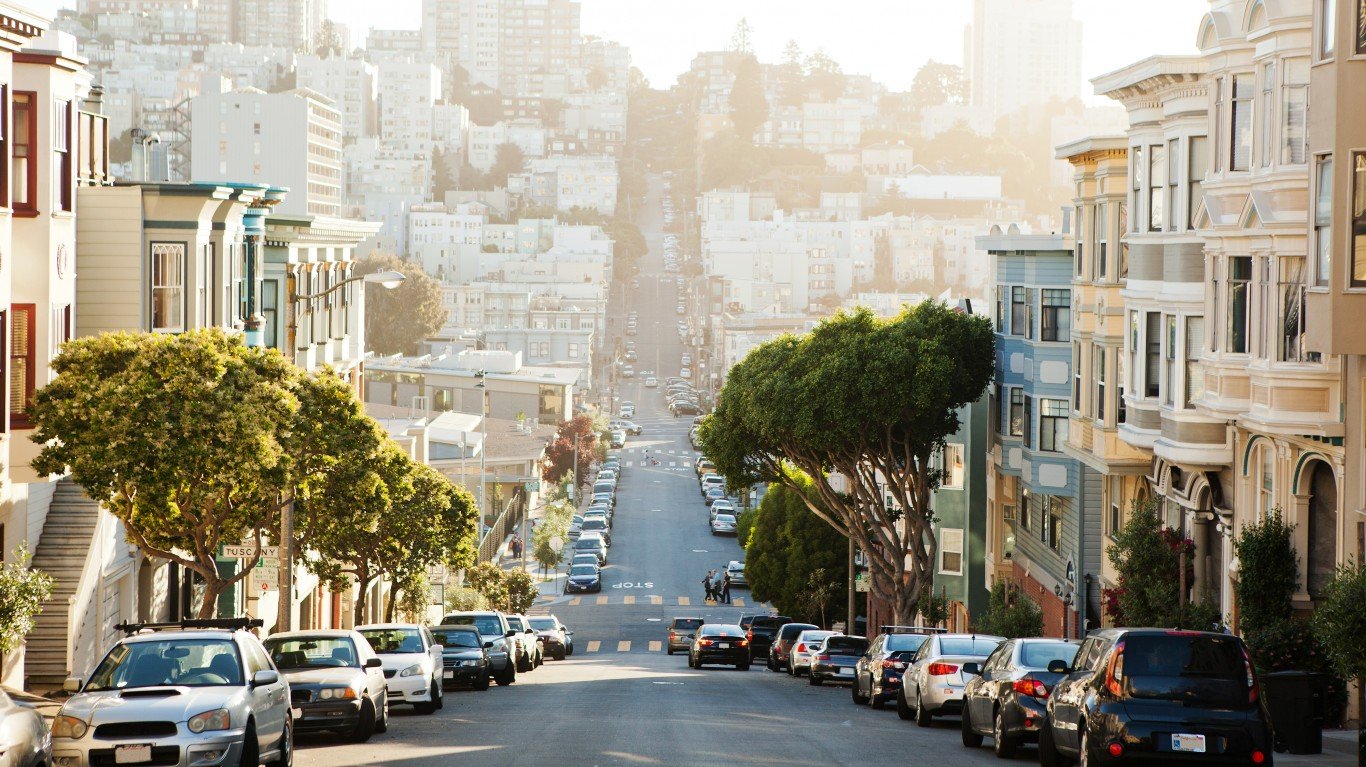
18. San Francisco-Oakland-Hayward, CA
> Vehicle theft rate (2018): 487.7 per 100,000 residents
> Total vehicles stolen (2018): 23,064
> Property crime rate (2018): 3,897.8 per 100,000 residents

17. Yuba City, CA
> Vehicle theft rate (2018): 495.9 per 100,000 residents
> Total vehicles stolen (2018): 867
> Property crime rate (2018): 2,510.7 per 100,000 residents
[in-text-ad-2]
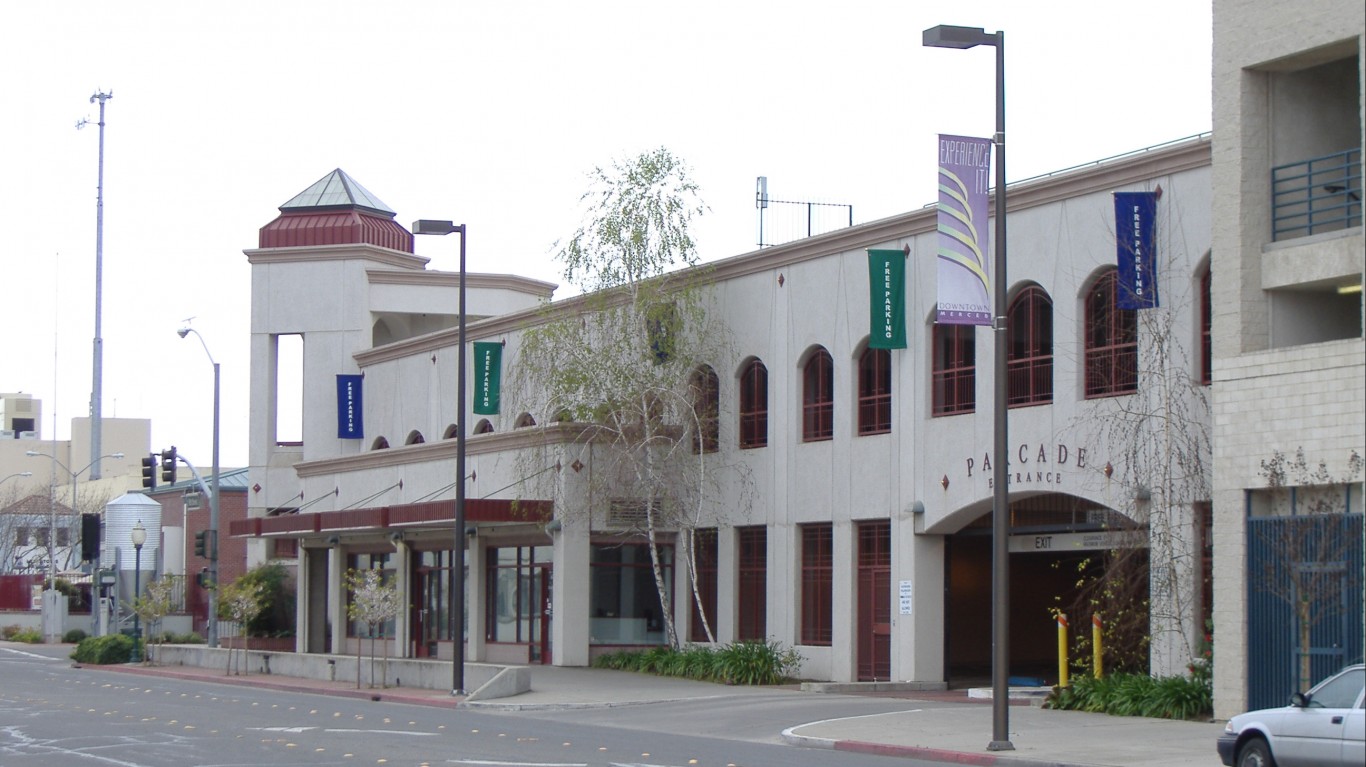
16. Merced, CA
> Vehicle theft rate (2018): 498.2 per 100,000 residents
> Total vehicles stolen (2018): 1,369
> Property crime rate (2018): 2,477.5 per 100,000 residents

15. Portland-Vancouver-Hillsboro, OR-WA
> Vehicle theft rate (2018): 503.1 per 100,000 residents
> Total vehicles stolen (2018): 12,470
> Property crime rate (2018): 2,870.0 per 100,000 residents
[in-text-ad]

14. Tulsa, OK
> Vehicle theft rate (2018): 505.0 per 100,000 residents
> Total vehicles stolen (2018): 5,019
> Property crime rate (2018): 3,319.8 per 100,000 residents
[recirclink id=560017]

13. Denver-Aurora-Lakewood, CO
> Vehicle theft rate (2018): 506.2 per 100,000 residents
> Total vehicles stolen (2018): 14,845
> Property crime rate (2018): N/A
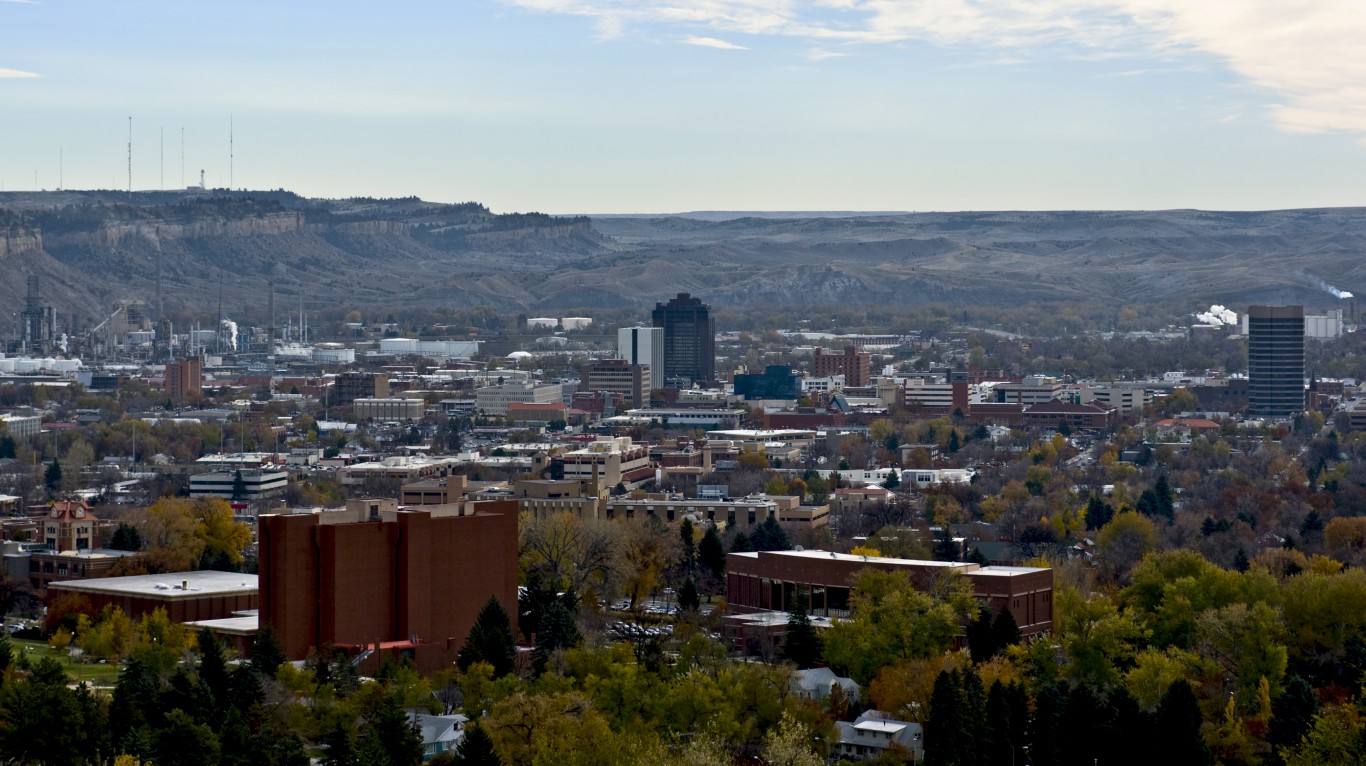
12. Billings, MT
> Vehicle theft rate (2018): 520.8 per 100,000 residents
> Total vehicles stolen (2018): 894
> Property crime rate (2018): 3,508.7 per 100,000 residents
[in-text-ad-2]
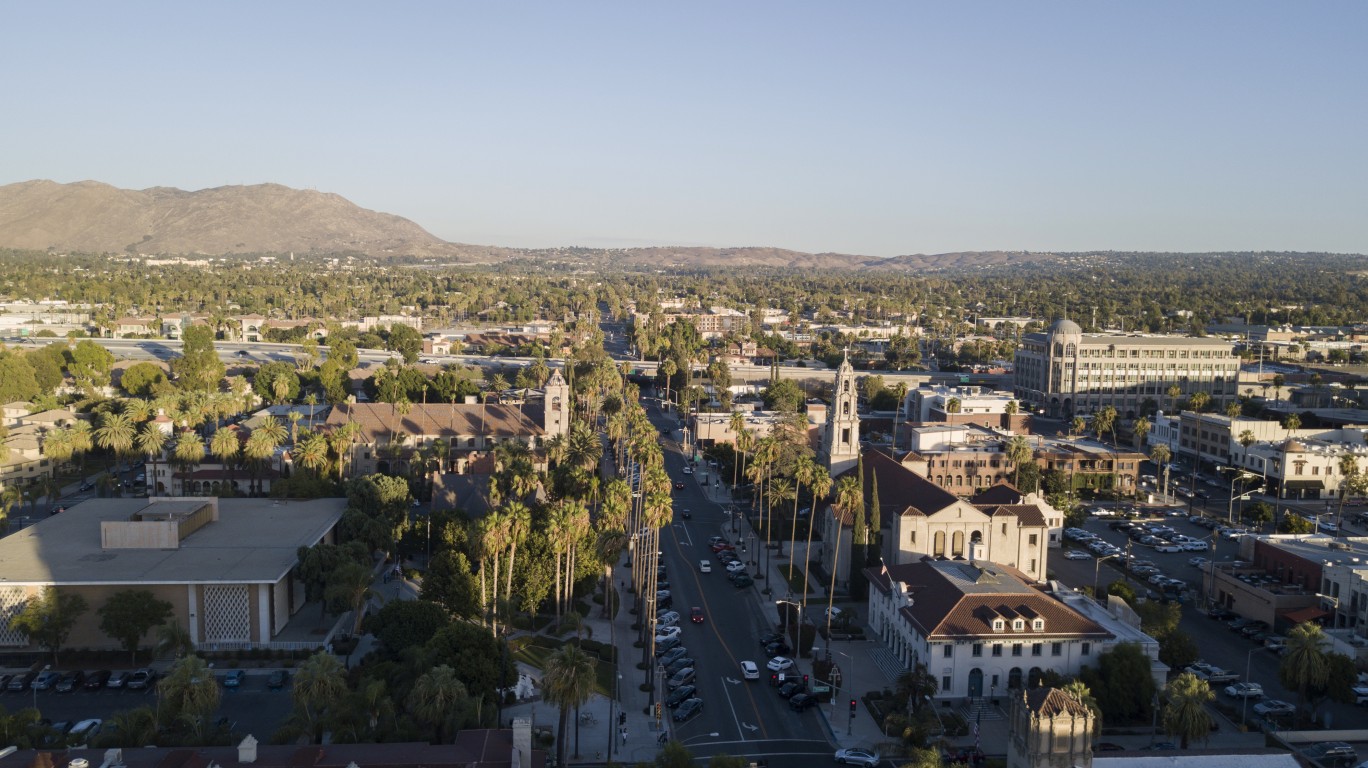
11. Riverside-San Bernardino-Ontario, CA
> Vehicle theft rate (2018): 521.7 per 100,000 residents
> Total vehicles stolen (2018): 24,113
> Property crime rate (2018): 2,445.4 per 100,000 residents

10. St. Joseph, MO-KS
> Vehicle theft rate (2018): 532.9 per 100,000 residents
> Total vehicles stolen (2018): 674
> Property crime rate (2018): 3,459.9 per 100,000 residents
[in-text-ad]

9. Vallejo-Fairfield, CA
> Vehicle theft rate (2018): 538.3 per 100,000 residents
> Total vehicles stolen (2018): 2,404
> Property crime rate (2018): 2,662.9 per 100,000 residents
[recirclink id=531551]

8. Wichita, KS
> Vehicle theft rate (2018): 550.0 per 100,000 residents
> Total vehicles stolen (2018): 3,547
> Property crime rate (2018): 4,232.0 per 100,000 residents

7. Stockton-Lodi, CA
> Vehicle theft rate (2018): 569.6 per 100,000 residents
> Total vehicles stolen (2018): 4,287
> Property crime rate (2018): 2,956.4 per 100,000 residents
[in-text-ad-2]

6. Redding, CA
> Vehicle theft rate (2018): 576.0 per 100,000 residents
> Total vehicles stolen (2018): 1,037
> Property crime rate (2018): 2,867.9 per 100,000 residents
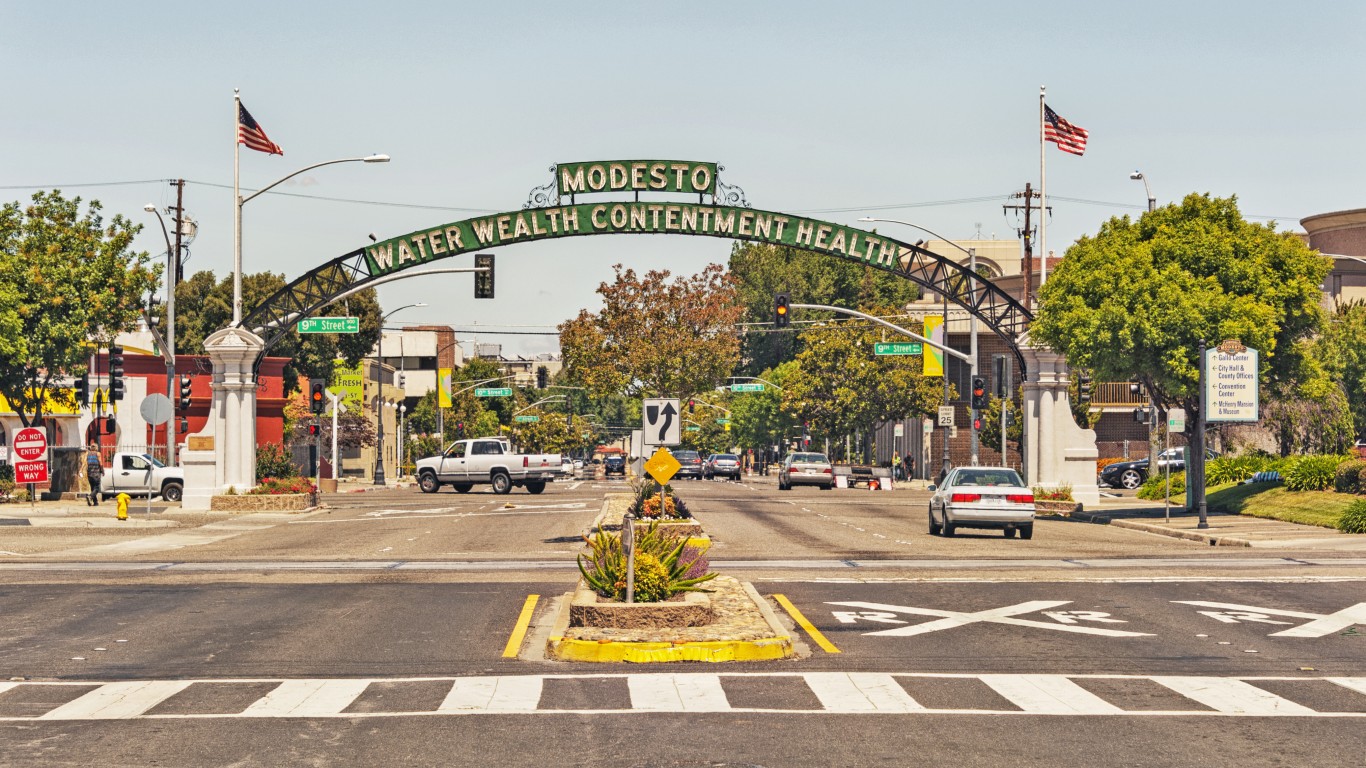
5. Modesto, CA
> Vehicle theft rate (2018): 623.5 per 100,000 residents
> Total vehicles stolen (2018): 3,428
> Property crime rate (2018): 2,789.6 per 100,000 residents
[in-text-ad]

4. Pueblo, CO
> Vehicle theft rate (2018): 701.4 per 100,000 residents
> Total vehicles stolen (2018): 1,175
> Property crime rate (2018): 4,387.3 per 100,000 residents
[recirclink id=582958]
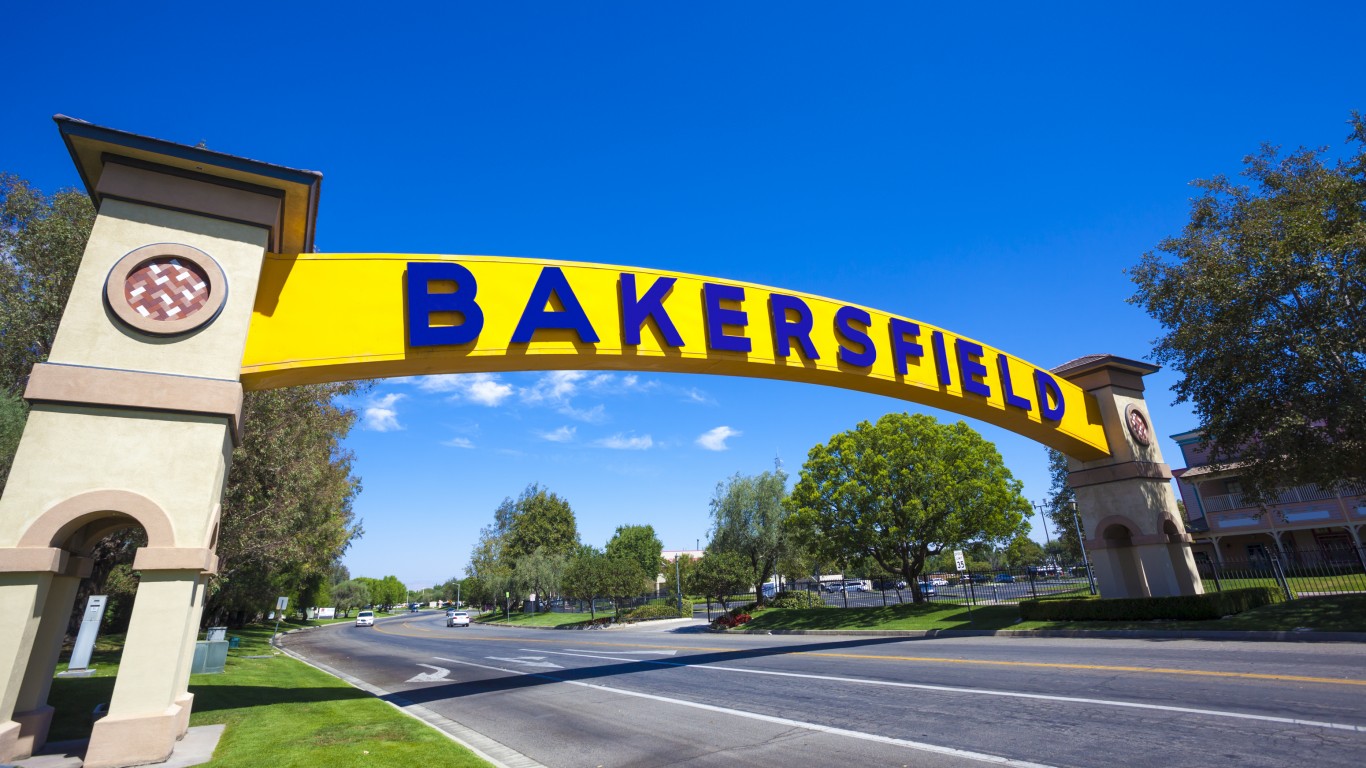
3. Bakersfield, CA
> Vehicle theft rate (2018): 752.5 per 100,000 residents
> Total vehicles stolen (2018): 6,748
> Property crime rate (2018): 3,386.2 per 100,000 residents

2. Anchorage, AK
> Vehicle theft rate (2018): 773.4 per 100,000 residents
> Total vehicles stolen (2018): 3,087
> Property crime rate (2018): 5,016.8 per 100,000 residents
[in-text-ad-2]
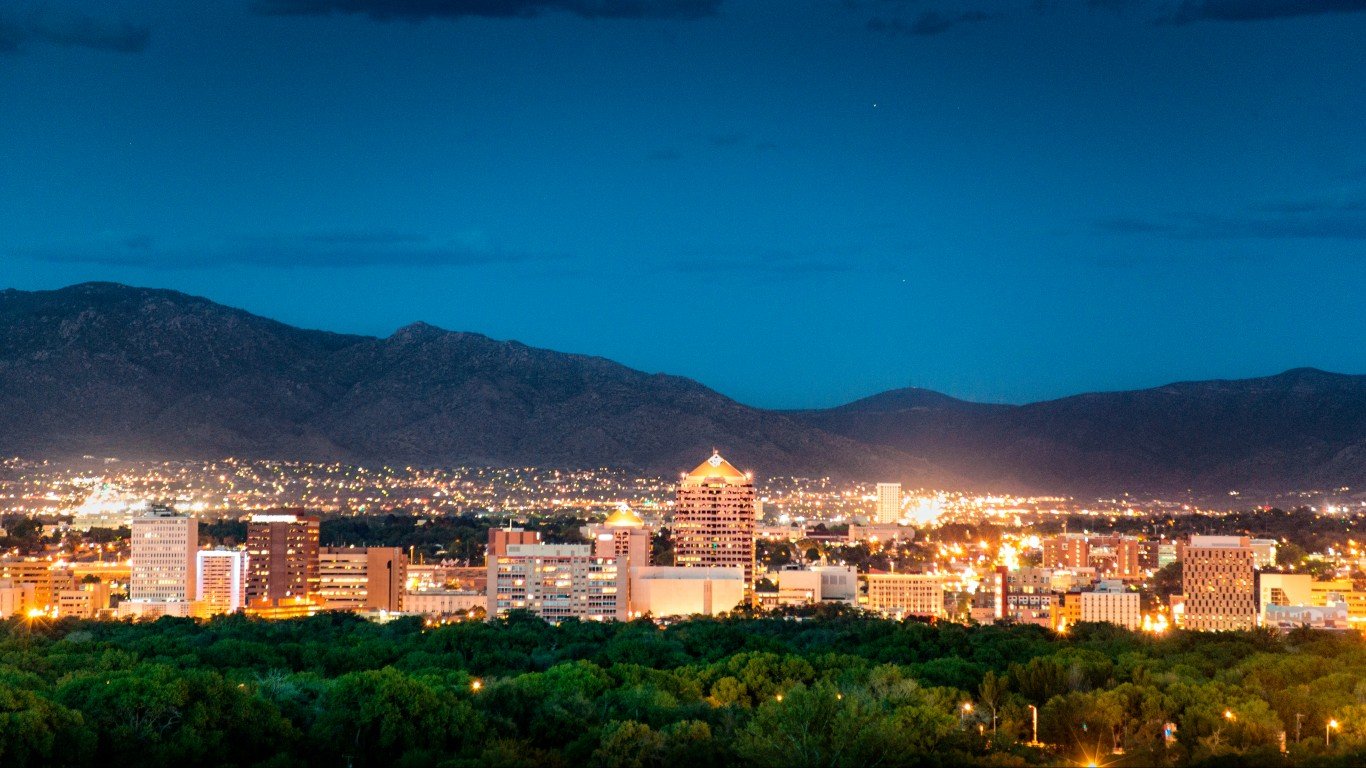
1. Albuquerque, NM
> Vehicle theft rate (2018): 780.2 per 100,000 residents
> Total vehicles stolen (2018): 7,146
> Property crime rate (2018): 4,526.6 per 100,000 residents
Methodology
To determine the cities where your car is most likely to be stolen, 24/7 Wall St. reviewed the vehicle theft rate in each metropolitan statistical area from the National Insurance Crime Bureau’s “2019 Hot Spots Vehicle Theft” report. Total vehicles reported stolen in 2018 in each city also came from the report. The NICB derives its vehicle theft rate using the FBI’s National Crime Information Center data set. Property crime figures listed are from the FBI’s 2018 Uniform Crime Report, and for this reason are not directly comparable to the vehicle theft and vehicle theft rates from the NICB.
Contact [email protected] for any questions or corrections.