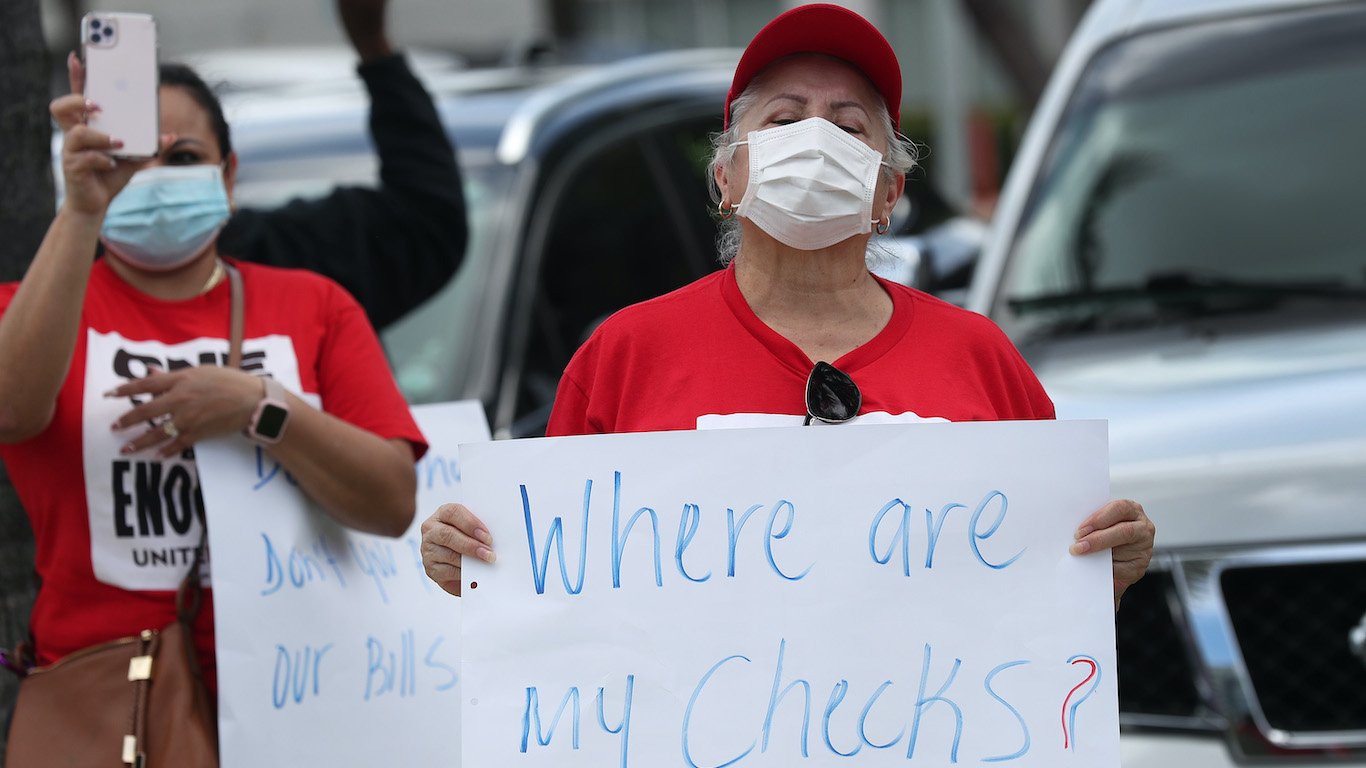
Mid-March marked a turning point in the coronavirus outbreak in the United States. President Donald Trump officially declared a national emergency on March 13, 2020. Two days later, the Centers for Disease Control and Prevention advised Americans to avoid gatherings of 50 people. Over the next three weeks, restrictions tightened, the numbers of infections and deaths from the disease soared, and more than 15 million Americans lost their jobs.
In the lead up to the historic surge in jobless claims, the United States appeared to be in a period of historic prosperity. As recently as February, the unemployment rate stood at a multi-decade low of 3.5%. Now, according to estimates released by Economic Policy Institute, a nonpartisan think tank, the unemployment rate may hit nearly 16% by July — higher than at any point since the Great Depression.
As unemployment claims spike with each passing week, 24/7 Wall St. compiled a state-by-state review of jobless claims. Nearly every state has shed tens or hundreds of thousands of jobs over the three weeks beginning on March 15 — equal to anywhere from 4% to 17% of each state’s total labor force. Over the most recent week of data, March 29 to April 4, unemployment claims were anywhere from 13 to 84 times higher than they were the same week last year, depending on the state.
The current economic downturn is largely attributable to efforts to contain the spread of the coronavirus as millions of Americans are urged or ordered to stay home, and nonessential businesses have shuttered across the country. Here is a look at iconic businesses that have closed because of coronavirus.
The states where unemployment rates are projected to be the highest in the coming months tend to be those that rely on industries that will likely bear the brunt of the economic downturn. These industries include leisure and hospitality, travel services, transportation and warehousing, and oil and gas extraction. Here is an in-depth look at the U.S. industries being devastated by the coronavirus.
Click here to see every state’s unemployment claims since COVID-19 shut the economy down:
Click here to see our methodology:

Alabama
> Unemployment claims since mid-March: 197,483 (8.8% of labor force)
> Most recent week’s unemployment claims (March 29 – April 4): 105,607 (21st most)
> Increase in weekly claims from one year ago: 102,716 (3,553.0%)
> Pct. of workers in high-risk industries: 16.8% (21st lowest)
> Projected unemployment rate, July 2020: 14.5% (6th lowest)
[in-text-ad]
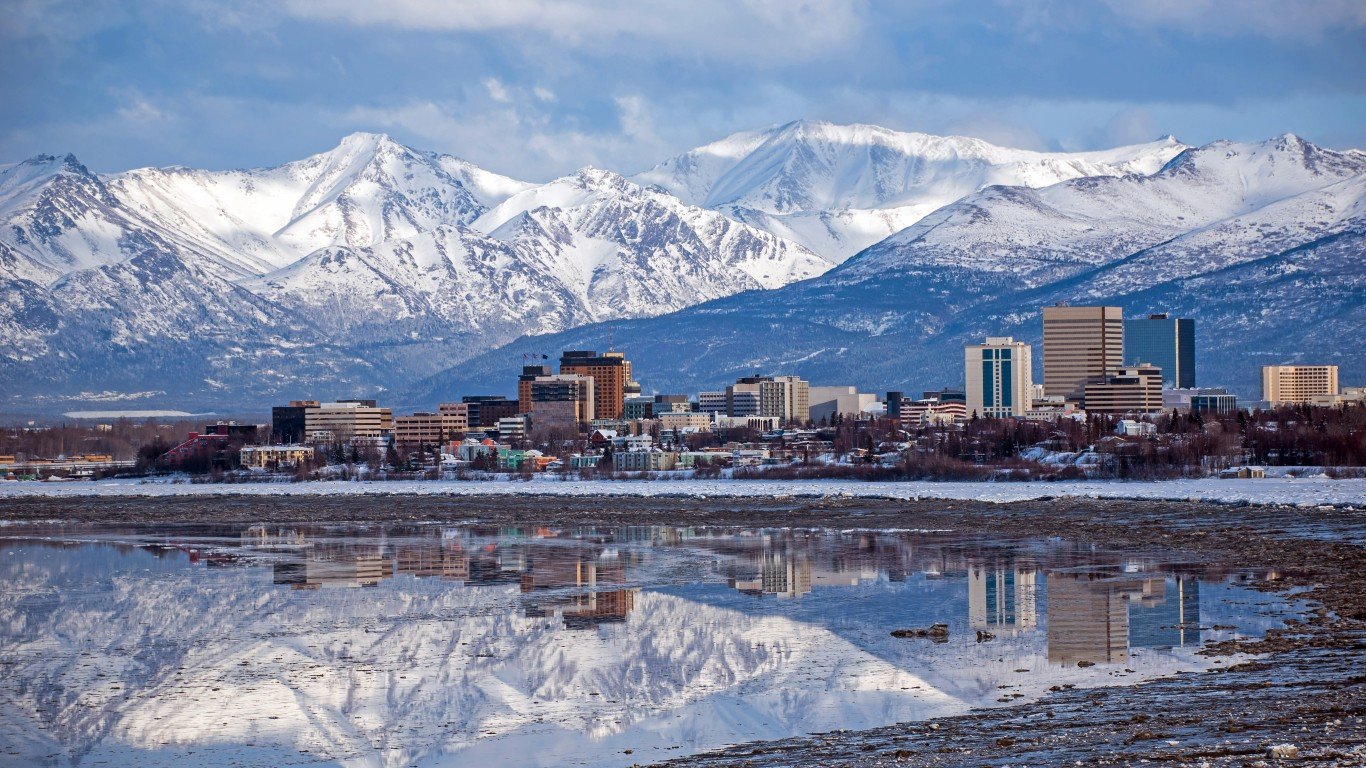
Alaska
> Unemployment claims since mid-March: 36,991 (10.7% of labor force)
> Most recent week’s unemployment claims (March 29 – April 4): 15,370 (4th fewest)
> Increase in weekly claims from one year ago: 14,479 (1,625.0%)
> Pct. of workers in high-risk industries: 21.8% (4th highest)
> Projected unemployment rate, July 2020: 17.8% (3rd highest)
[recirclink id=661276]

Arizona
> Unemployment claims since mid-March: 250,477 (7.1% of labor force)
> Most recent week’s unemployment claims (March 29 – April 4): 132,189 (16th most)
> Increase in weekly claims from one year ago: 127,160 (2,528.5%)
> Pct. of workers in high-risk industries: 19.3% (15th highest)
> Projected unemployment rate, July 2020: 15.4% (24th lowest)
Arkansas
> Unemployment claims since mid-March: 98,023 (7.2% of labor force)
> Most recent week’s unemployment claims (March 29 – April 4): 60,992 (23rd fewest)
> Increase in weekly claims from one year ago: 58,742 (2,610.8%)
> Pct. of workers in high-risk industries: 17.0% (23rd lowest)
> Projected unemployment rate, July 2020: 15.3% (22nd lowest)
[in-text-ad-2]

California
> Unemployment claims since mid-March: 2,170,108 (11.2% of labor force)
> Most recent week’s unemployment claims (March 29 – April 4): 925,450 (the most)
> Increase in weekly claims from one year ago: 889,223 (2,454.6%)
> Pct. of workers in high-risk industries: 17.9% (22nd highest)
> Projected unemployment rate, July 2020: 15.6% (19th highest)

Colorado
> Unemployment claims since mid-March: 127,106 (4.1% of labor force)
> Most recent week’s unemployment claims (March 29 – April 4): 45,494 (17th fewest)
> Increase in weekly claims from one year ago: 43,591 (2,290.6%)
> Pct. of workers in high-risk industries: 18.6% (19th highest)
> Projected unemployment rate, July 2020: 14.1% (4th lowest)
[in-text-ad]

Connecticut
> Unemployment claims since mid-March: 91,745 (4.8% of labor force)
> Most recent week’s unemployment claims (March 29 – April 4): 33,418 (15th fewest)
> Increase in weekly claims from one year ago: 31,089 (1,334.9%)
> Pct. of workers in high-risk industries: 14.2% (the lowest)
> Projected unemployment rate, July 2020: 14.8% (10th lowest)
[recirclink id=679566]

Delaware
> Unemployment claims since mid-March: 48,776 (10.1% of labor force)
> Most recent week’s unemployment claims (March 29 – April 4): 18,863 (7th fewest)
> Increase in weekly claims from one year ago: 18,393 (3,913.4%)
> Pct. of workers in high-risk industries: 17.0% (22nd lowest)
> Projected unemployment rate, July 2020: 16.8% (6th highest)

Florida
> Unemployment claims since mid-March: 472,682 (4.6% of labor force)
> Most recent week’s unemployment claims (March 29 – April 4): 169,885 (11th most)
> Increase in weekly claims from one year ago: 163,483 (2,553.6%)
> Pct. of workers in high-risk industries: 20.1% (6th highest)
> Projected unemployment rate, July 2020: 15.5% (24th highest)
[in-text-ad-2]

Georgia
> Unemployment claims since mid-March: 534,135 (10.5% of labor force)
> Most recent week’s unemployment claims (March 29 – April 4): 388,175 (2nd most)
> Increase in weekly claims from one year ago: 383,533 (8,262.2%)
> Pct. of workers in high-risk industries: 19.7% (9th highest)
> Projected unemployment rate, July 2020: 14.9% (11th lowest)

Hawaii
> Unemployment claims since mid-March: 110,495 (16.6% of labor force)
> Most recent week’s unemployment claims (March 29 – April 4): 53,082 (21st fewest)
> Increase in weekly claims from one year ago: 51,797 (4,030.9%)
> Pct. of workers in high-risk industries: 27.1% (2nd highest)
> Projected unemployment rate, July 2020: 17.8% (3rd highest)
[in-text-ad]
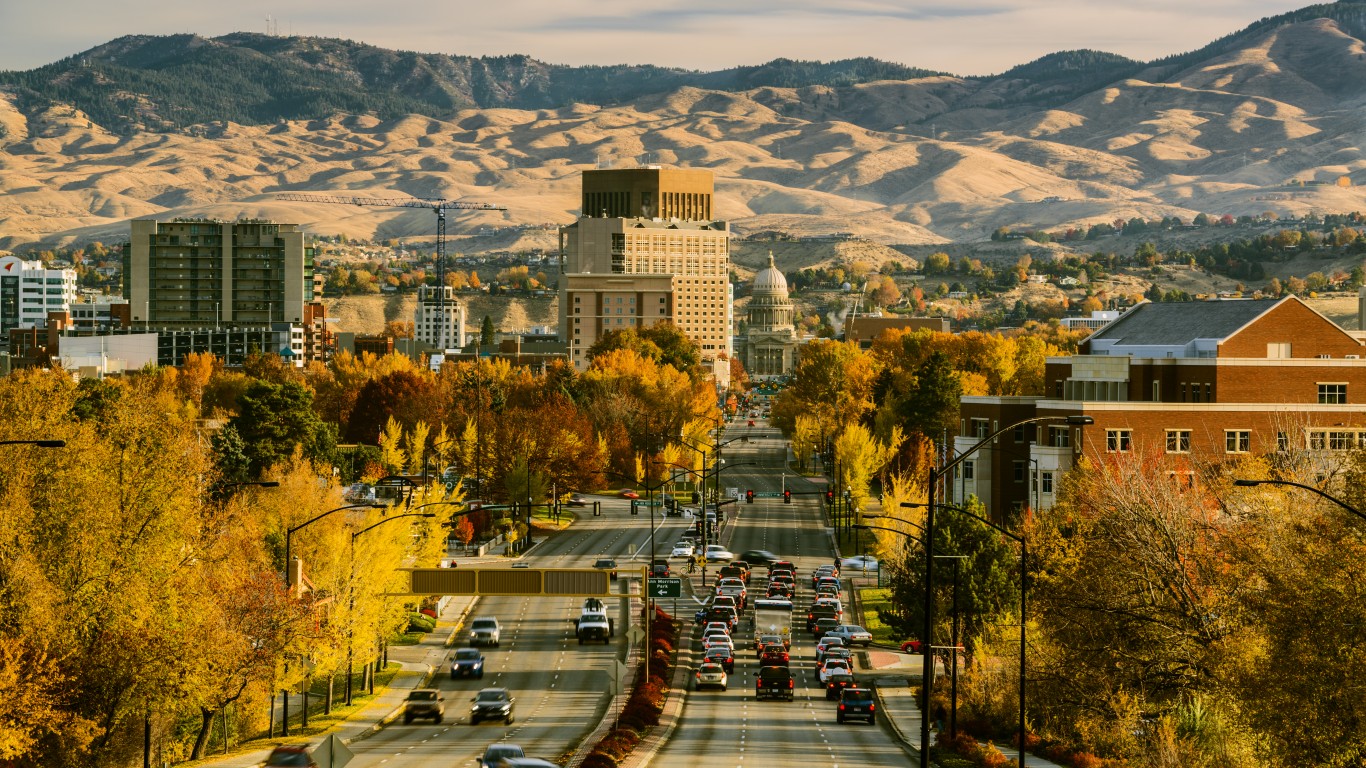
Idaho
> Unemployment claims since mid-March: 76,549 (8.8% of labor force)
> Most recent week’s unemployment claims (March 29 – April 4): 30,022 (12th fewest)
> Increase in weekly claims from one year ago: 29,105 (3,173.9%)
> Pct. of workers in high-risk industries: 16.1% (16th lowest)
> Projected unemployment rate, July 2020: 14.0% (3rd lowest)
[recirclink id=680452]

Illinois
> Unemployment claims since mid-March: 493,475 (7.6% of labor force)
> Most recent week’s unemployment claims (March 29 – April 4): 200,940 (9th most)
> Increase in weekly claims from one year ago: 192,064 (2,163.9%)
> Pct. of workers in high-risk industries: 18.8% (17th highest)
> Projected unemployment rate, July 2020: 15.6% (19th highest)

Indiana
> Unemployment claims since mid-March: 332,568 (9.8% of labor force)
> Most recent week’s unemployment claims (March 29 – April 4): 133,639 (15th most)
> Increase in weekly claims from one year ago: 130,601 (4,298.9%)
> Pct. of workers in high-risk industries: 18.0% (21st highest)
> Projected unemployment rate, July 2020: 15.0% (16th lowest)
[in-text-ad-2]

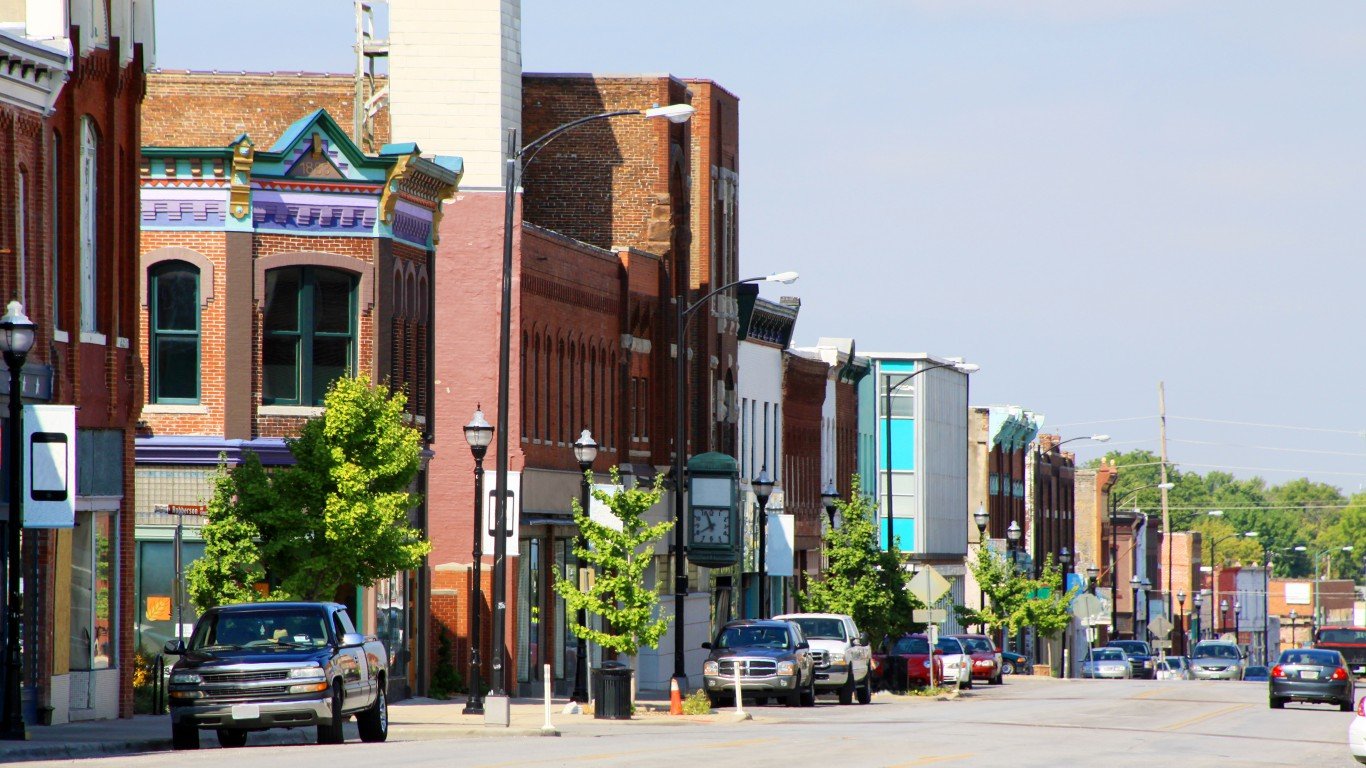
Iowa
> Unemployment claims since mid-March: 164,252 (9.6% of labor force)
> Most recent week’s unemployment claims (March 29 – April 4): 67,334 (24th fewest)
> Increase in weekly claims from one year ago: 65,554 (3,682.8%)
> Pct. of workers in high-risk industries: 14.9% (3rd lowest)
> Projected unemployment rate, July 2020: 14.2% (5th lowest)

Kansas
> Unemployment claims since mid-March: 127,649 (8.6% of labor force)
> Most recent week’s unemployment claims (March 29 – April 4): 49,756 (19th fewest)
> Increase in weekly claims from one year ago: 48,399 (3,566.6%)
> Pct. of workers in high-risk industries: 15.8% (14th lowest)
> Projected unemployment rate, July 2020: 14.7% (8th lowest)
[in-text-ad]

Kentucky
> Unemployment claims since mid-March: 279,307 (13.6% of labor force)
> Most recent week’s unemployment claims (March 29 – April 4): 117,135 (17th most)
> Increase in weekly claims from one year ago: 114,361 (4,122.6%)
> Pct. of workers in high-risk industries: 19.4% (13th highest)
> Projected unemployment rate, July 2020: 16.3% (10th highest)
[recirclink id=680686]
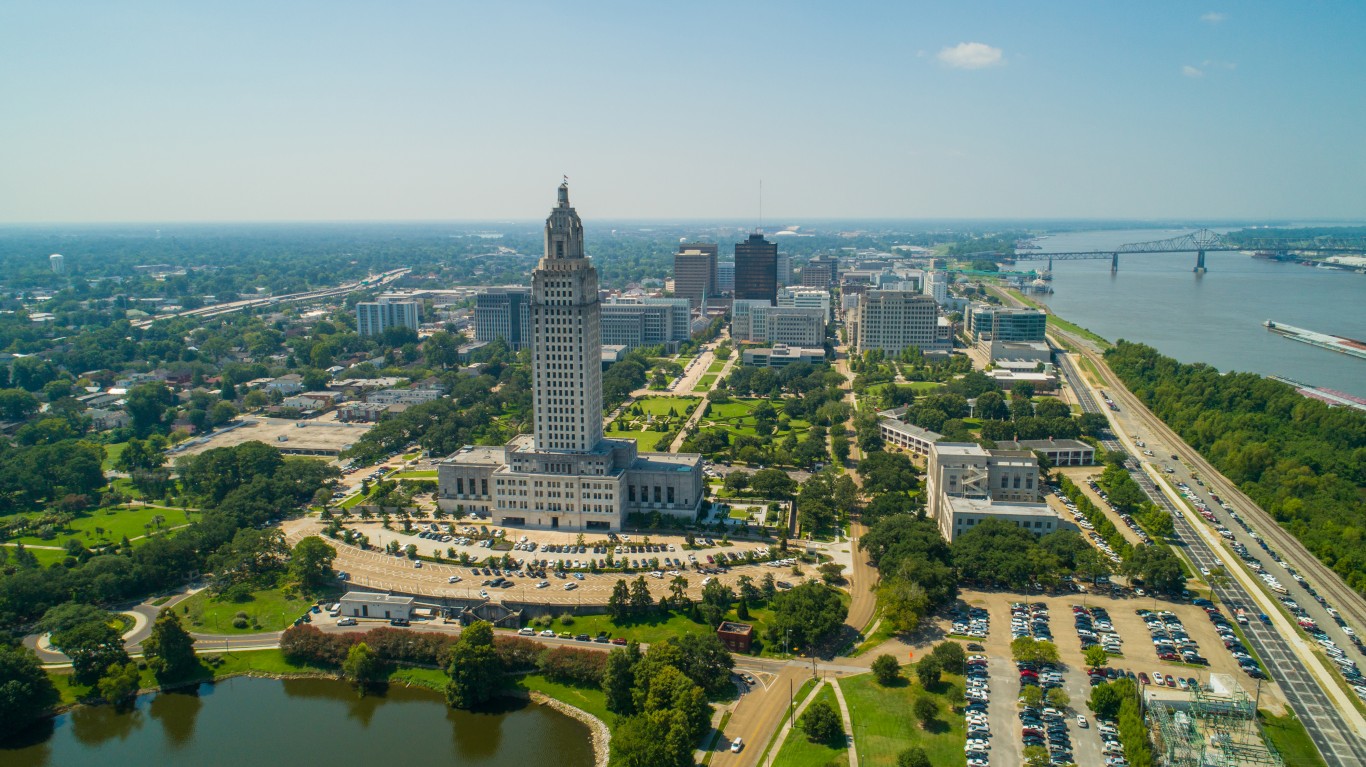
Louisiana
> Unemployment claims since mid-March: 272,823 (13.1% of labor force)
> Most recent week’s unemployment claims (March 29 – April 4): 102,985 (23rd most)
> Increase in weekly claims from one year ago: 101,329 (6,118.9%)
> Pct. of workers in high-risk industries: 19.5% (12th highest)
> Projected unemployment rate, July 2020: 18.0% (2nd highest)
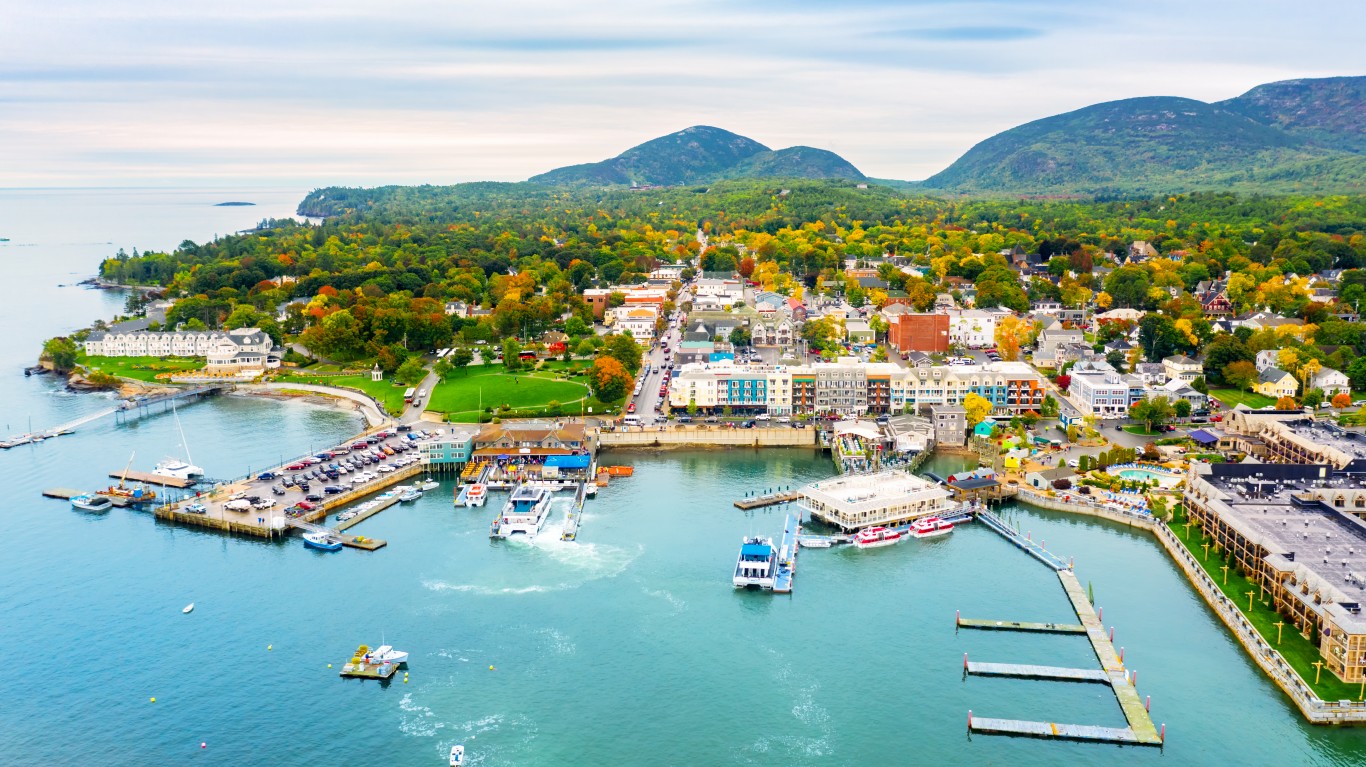
Maine
> Unemployment claims since mid-March: 75,860 (11.1% of labor force)
> Most recent week’s unemployment claims (March 29 – April 4): 30,631 (13th fewest)
> Increase in weekly claims from one year ago: 29,892 (4,044.9%)
> Pct. of workers in high-risk industries: 15.1% (8th lowest)
> Projected unemployment rate, July 2020: 15.7% (17th highest)
[in-text-ad-2]

Maryland
> Unemployment claims since mid-March: 235,706 (7.3% of labor force)
> Most recent week’s unemployment claims (March 29 – April 4): 107,408 (20th most)
> Increase in weekly claims from one year ago: 104,926 (4,227.5%)
> Pct. of workers in high-risk industries: 15.7% (12th lowest)
> Projected unemployment rate, July 2020: 13.9% (the lowest)

Massachusetts
> Unemployment claims since mid-March: 469,457 (12.4% of labor force)
> Most recent week’s unemployment claims (March 29 – April 4): 139,582 (13th most)
> Increase in weekly claims from one year ago: 135,286 (3,149.1%)
> Pct. of workers in high-risk industries: 15.0% (6th lowest)
> Projected unemployment rate, July 2020: 15.1% (18th lowest)
[in-text-ad]

Michigan
> Unemployment claims since mid-March: 817,185 (16.6% of labor force)
> Most recent week’s unemployment claims (March 29 – April 4): 384,844 (3rd most)
> Increase in weekly claims from one year ago: 378,162 (5,659.4%)
> Pct. of workers in high-risk industries: 16.4% (17th lowest)
> Projected unemployment rate, July 2020: 15.2% (21st lowest)
[recirclink id=661276]
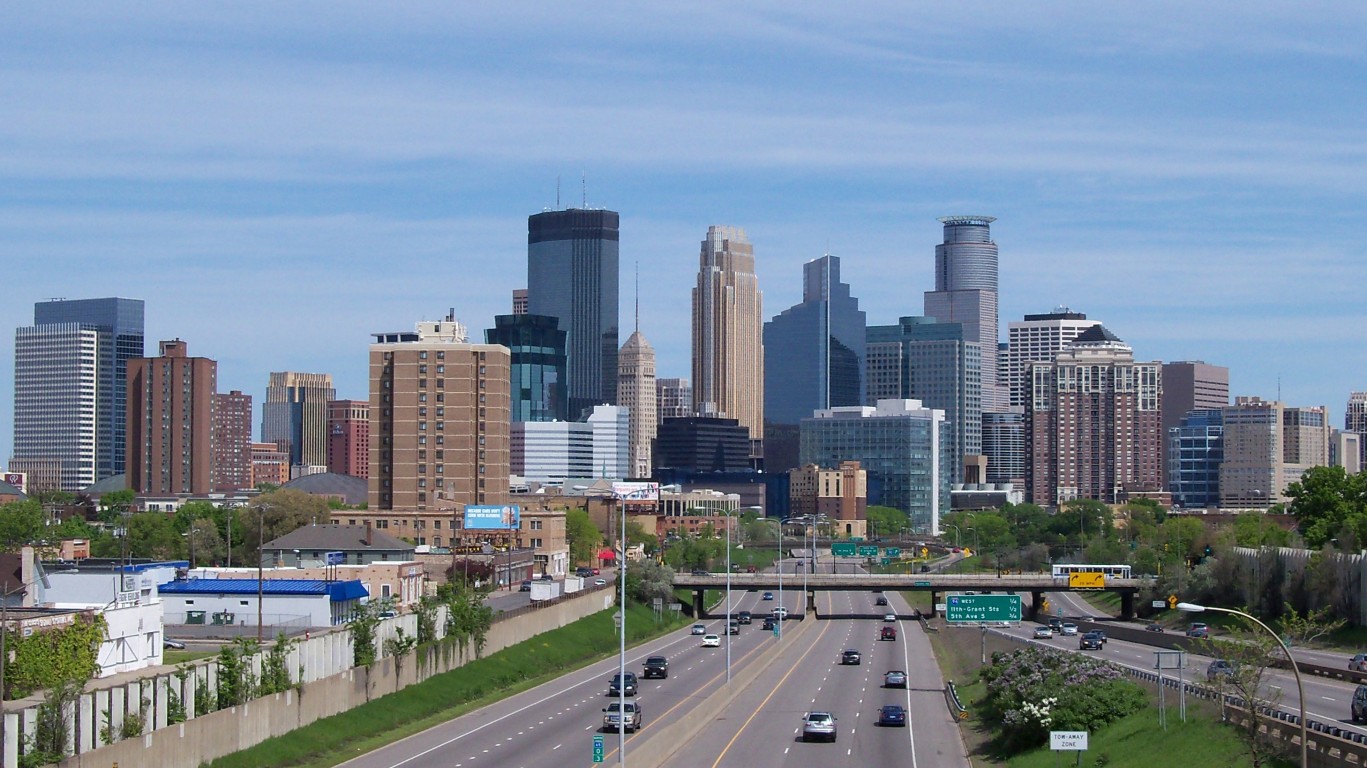
Minnesota
> Unemployment claims since mid-March: 335,987 (10.9% of labor force)
> Most recent week’s unemployment claims (March 29 – April 4): 111,119 (19th most)
> Increase in weekly claims from one year ago: 107,983 (3,443.3%)
> Pct. of workers in high-risk industries: 14.9% (4th lowest)
> Projected unemployment rate, July 2020: 15.0% (16th lowest)

Mississippi
> Unemployment claims since mid-March: 84,038 (6.6% of labor force)
> Most recent week’s unemployment claims (March 29 – April 4): 46,504 (18th fewest)
> Increase in weekly claims from one year ago: 45,555 (4,800.3%)
> Pct. of workers in high-risk industries: 19.1% (16th highest)
> Projected unemployment rate, July 2020: 17.5% (5th highest)
[in-text-ad-2]
Missouri
> Unemployment claims since mid-March: 228,936 (7.5% of labor force)
> Most recent week’s unemployment claims (March 29 – April 4): 82,399 (25th most)
> Increase in weekly claims from one year ago: 79,760 (3,022.4%)
> Pct. of workers in high-risk industries: 16.6% (19th lowest)
> Projected unemployment rate, July 2020: 15.7% (17th highest)

Montana
> Unemployment claims since mid-March: 56,123 (10.7% of labor force)
> Most recent week’s unemployment claims (March 29 – April 4): 20,011 (8th fewest)
> Increase in weekly claims from one year ago: 19,272 (2,607.8%)
> Pct. of workers in high-risk industries: 19.4% (14th highest)
> Projected unemployment rate, July 2020: 16.3% (10th highest)
[in-text-ad]

Nebraska
> Unemployment claims since mid-March: 67,213 (6.6% of labor force)
> Most recent week’s unemployment claims (March 29 – April 4): 26,788 (10th fewest)
> Increase in weekly claims from one year ago: 26,199 (4,448.0%)
> Pct. of workers in high-risk industries: 15.7% (11th lowest)
> Projected unemployment rate, July 2020: 15.1% (18th lowest)
[recirclink id=679566]

Nevada
> Unemployment claims since mid-March: 244,105 (15.9% of labor force)
> Most recent week’s unemployment claims (March 29 – April 4): 79,865 (25th fewest)
> Increase in weekly claims from one year ago: 77,857 (3,877.3%)
> Pct. of workers in high-risk industries: 33.5% (the highest)
> Projected unemployment rate, July 2020: 19.7% (the highest)

New Hampshire
> Unemployment claims since mid-March: 96,971 (12.6% of labor force)
> Most recent week’s unemployment claims (March 29 – April 4): 36,214 (16th fewest)
> Increase in weekly claims from one year ago: 35,717 (7,186.5%)
> Pct. of workers in high-risk industries: 15.1% (9th lowest)
> Projected unemployment rate, July 2020: 15.0% (16th lowest)
[in-text-ad-2]

New Jersey
> Unemployment claims since mid-March: 535,965 (12.0% of labor force)
> Most recent week’s unemployment claims (March 29 – April 4): 213,897 (8th most)
> Increase in weekly claims from one year ago: 206,190 (2,675.4%)
> Pct. of workers in high-risk industries: 17.4% (24th highest)
> Projected unemployment rate, July 2020: 15.6% (19th highest)

New Mexico
> Unemployment claims since mid-March: 72,560 (7.6% of labor force)
> Most recent week’s unemployment claims (March 29 – April 4): 26,606 (9th fewest)
> Increase in weekly claims from one year ago: 25,732 (2,944.2%)
> Pct. of workers in high-risk industries: 18.8% (18th highest)
> Projected unemployment rate, July 2020: 16.2% (14th highest)
[in-text-ad]

New York
> Unemployment claims since mid-March: 791,840 (8.3% of labor force)
> Most recent week’s unemployment claims (March 29 – April 4): 345,246 (4th most)
> Increase in weekly claims from one year ago: 332,643 (2,639.4%)
> Pct. of workers in high-risk industries: 15.1% (7th lowest)
> Projected unemployment rate, July 2020: 16.4% (8th highest)
[recirclink id=680452]

North Carolina
> Unemployment claims since mid-March: 403,801 (8.0% of labor force)
> Most recent week’s unemployment claims (March 29 – April 4): 137,573 (14th most)
> Increase in weekly claims from one year ago: 134,434 (4,282.7%)
> Pct. of workers in high-risk industries: 17.6% (23rd highest)
> Projected unemployment rate, July 2020: 15.5% (24th highest)

North Dakota
> Unemployment claims since mid-March: 33,573 (8.4% of labor force)
> Most recent week’s unemployment claims (March 29 – April 4): 16,093 (5th fewest)
> Increase in weekly claims from one year ago: 15,821 (5,816.5%)
> Pct. of workers in high-risk industries: 19.8% (8th highest)
> Projected unemployment rate, July 2020: 15.6% (19th highest)
[in-text-ad-2]
Ohio
> Unemployment claims since mid-March: 694,779 (12.0% of labor force)
> Most recent week’s unemployment claims (March 29 – April 4): 224,182 (7th most)
> Increase in weekly claims from one year ago: 218,171 (3,629.5%)
> Pct. of workers in high-risk industries: 17.0% (24th lowest)
> Projected unemployment rate, July 2020: 16.4% (8th highest)

Oklahoma
> Unemployment claims since mid-March: 120,794 (6.6% of labor force)
> Most recent week’s unemployment claims (March 29 – April 4): 51,124 (20th fewest)
> Increase in weekly claims from one year ago: 49,100 (2,425.9%)
> Pct. of workers in high-risk industries: 19.9% (7th highest)
> Projected unemployment rate, July 2020: 14.7% (8th lowest)
[in-text-ad]

Oregon
> Unemployment claims since mid-March: 134,198 (6.4% of labor force)
> Most recent week’s unemployment claims (March 29 – April 4): 56,646 (22nd fewest)
> Increase in weekly claims from one year ago: 52,178 (1,167.8%)
> Pct. of workers in high-risk industries: 16.4% (18th lowest)
> Projected unemployment rate, July 2020: 15.5% (24th highest)
[recirclink id=680686]

Pennsylvania
> Unemployment claims since mid-March: 1,065,846 (16.5% of labor force)
> Most recent week’s unemployment claims (March 29 – April 4): 283,718 (6th most)
> Increase in weekly claims from one year ago: 272,591 (2,449.8%)
> Pct. of workers in high-risk industries: 16.7% (20th lowest)
> Projected unemployment rate, July 2020: 16.6% (7th highest)

Rhode Island
> Unemployment claims since mid-March: 91,902 (16.6% of labor force)
> Most recent week’s unemployment claims (March 29 – April 4): 28,255 (11th fewest)
> Increase in weekly claims from one year ago: 27,586 (4,123.5%)
> Pct. of workers in high-risk industries: 17.1% (25th highest)
> Projected unemployment rate, July 2020: 15.4% (24th lowest)
[in-text-ad-2]

South Carolina
> Unemployment claims since mid-March: 183,319 (7.8% of labor force)
> Most recent week’s unemployment claims (March 29 – April 4): 85,018 (24th most)
> Increase in weekly claims from one year ago: 82,909 (3,931.2%)
> Pct. of workers in high-risk industries: 19.6% (10th highest)
> Projected unemployment rate, July 2020: 15.0% (16th lowest)

South Dakota
> Unemployment claims since mid-March: 16,478 (3.6% of labor force)
> Most recent week’s unemployment claims (March 29 – April 4): 7,916 (2nd fewest)
> Increase in weekly claims from one year ago: 7,773 (5,435.7%)
> Pct. of workers in high-risk industries: 14.5% (2nd lowest)
> Projected unemployment rate, July 2020: 15.8% (15th highest)
[in-text-ad]

Tennessee
> Unemployment claims since mid-March: 246,718 (7.4% of labor force)
> Most recent week’s unemployment claims (March 29 – April 4): 116,141 (18th most)
> Increase in weekly claims from one year ago: 111,823 (2,589.7%)
> Pct. of workers in high-risk industries: 20.3% (5th highest)
> Projected unemployment rate, July 2020: 15.8% (15th highest)
[recirclink id=679566]

Texas
> Unemployment claims since mid-March: 745,443 (5.3% of labor force)
> Most recent week’s unemployment claims (March 29 – April 4): 313,832 (5th most)
> Increase in weekly claims from one year ago: 300,739 (2,296.9%)
> Pct. of workers in high-risk industries: 19.6% (11th highest)
> Projected unemployment rate, July 2020: 15.2% (21st lowest)

Utah
> Unemployment claims since mid-March: 81,298 (5.1% of labor force)
> Most recent week’s unemployment claims (March 29 – April 4): 33,076 (14th fewest)
> Increase in weekly claims from one year ago: 32,050 (3,123.8%)
> Pct. of workers in high-risk industries: 17.0% (25th lowest)
> Projected unemployment rate, July 2020: 14.8% (10th lowest)
[in-text-ad-2]

Vermont
> Unemployment claims since mid-March: 34,593 (10.1% of labor force)
> Most recent week’s unemployment claims (March 29 – April 4): 16,176 (6th fewest)
> Increase in weekly claims from one year ago: 15,657 (3,016.8%)
> Pct. of workers in high-risk industries: 15.4% (10th lowest)
> Projected unemployment rate, July 2020: 15.0% (16th lowest)

Virginia
> Unemployment claims since mid-March: 308,532 (7.0% of labor force)
> Most recent week’s unemployment claims (March 29 – April 4): 149,758 (12th most)
> Increase in weekly claims from one year ago: 147,603 (6,849.3%)
> Pct. of workers in high-risk industries: 15.7% (13th lowest)
> Projected unemployment rate, July 2020: 14.0% (3rd lowest)
[in-text-ad]

Washington
> Unemployment claims since mid-March: 489,585 (12.6% of labor force)
> Most recent week’s unemployment claims (March 29 – April 4): 176,827 (10th most)
> Increase in weekly claims from one year ago: 170,528 (2,707.2%)
> Pct. of workers in high-risk industries: 15.0% (5th lowest)
> Projected unemployment rate, July 2020: 15.2% (21st lowest)
[recirclink id=661276]
West Virginia
> Unemployment claims since mid-March: 32,204 (4.1% of labor force)
> Most recent week’s unemployment claims (March 29 – April 4): 14,145 (3rd fewest)
> Increase in weekly claims from one year ago: 13,467 (1,986.3%)
> Pct. of workers in high-risk industries: 18.2% (20th highest)
> Projected unemployment rate, July 2020: 16.3% (10th highest)

Wisconsin
> Unemployment claims since mid-March: 266,741 (8.6% of labor force)
> Most recent week’s unemployment claims (March 29 – April 4): 104,776 (22nd most)
> Increase in weekly claims from one year ago: 99,395 (1,847.1%)
> Pct. of workers in high-risk industries: 15.8% (15th lowest)
> Projected unemployment rate, July 2020: 15.6% (19th highest)
[in-text-ad-2]

Wyoming
> Unemployment claims since mid-March: 14,949 (5.2% of labor force)
> Most recent week’s unemployment claims (March 29 – April 4): 4,900 (the fewest)
> Increase in weekly claims from one year ago: 4,556 (1,324.4%)
> Pct. of workers in high-risk industries: 25.5% (3rd highest)
> Projected unemployment rate, July 2020: 16.3% (10th highest)
Methodology:
To determine the number of unemployment claims in each state, 24/7 Wall St. reviewed the total initial unemployment claims for each week from the week ending March 21, 2020 through the week ending April 4, 2020 — a total of three weeks. Unemployment claims figures are not seasonally adjusted and are from the Department of Labor.
To calculate unemployment claims from March 15 through April 4 as a share of the labor force, we used the raw number of claims over that three week period and the total size of the labor force (not seasonally adjusted) as of February 2020 from the Bureau of Labor Statistics Current Employment Statistics.
The identification of high-risk industries comes from a March 2020 paper, “COVID-19: A Fiscal Stimulus Plan,” published by Moody’s Analytics. Employment data by industry came from the Bureau of Labor Statistics’ Quarterly Census of Employment and Wages and are annual estimates for 2018.
The projected unemployment rate by state for July 2020 came from a report published by the Economic Policy Institute, a nonpartisan, nonprofit think tank.
Contact [email protected] for any questions or corrections.