[cnxvideo id=”1124170″ placement=”ros”]
On April 28, the number of recorded cases of COVID-19 in the United States surpassed 1 million. Even as the exponential spread of the virus has begun to slow somewhat, the virus continues to infect 20,000 to 30,000 people nationwide each day, with possibly many more going undiagnosed because of a shortage of tests.
Reviewing how the coronavirus is spreading in each state reveals a more complicated situation. In some states, new cases appear to be peaking. In Louisiana, one of the hardest hit states, the number of cases per 100,000 residents increased by just 8% in the past seven days. However, in nearly half of all states, the number of new cases per 100,000 rose by at least 25% over that same period, including an 86% increase in one state.
To determine the states where the number of confirmed cases per capita is growing the fastest right now, 24/7 Wall St. compiled and reviewed the numbers of confirmed COVID-19 cases and deaths for the seven days through April 29 from state and local health departments.
Even as case numbers continue to rise in every state, roughly a dozen U.S. states have stay-at-home orders set to expire in the coming week or have explicitly announced plans to reopen parts of the economy in the near future.
More announcements regarding easing measures taken to contain the spread of the coronavirus are likely coming as the long-term economic effects of maintaining social distancing and closing nonessential businesses are expected to be severe and as state lawmakers face pressure from constituents.
In an interview with 24/7 Wall St., Mark Seidner, associate professor of infectious diseases at Harvard University and clinician at Massachusetts General Hospital, explained that while factors such as population density and initial point of infection have been important in determining where outbreaks occurred in states, he noted that there are two main factors in determining how state infection rates will change over time.
“How good is the state doing in testing, and how strictly is a state enforcing social distancing?” He added that he and his colleagues are going to keep a watchful eye on how states are going to relax social distancing measures in the next week or two and how these changes would impact the progression of the outbreak.
Notably, all of the hardest hit states, including New York, New Jersey, and Massachusetts, have plans to keep nonessential businesses closed and to maintain statewide stay-at-home orders at least through the second half of May.
A number of states with the largest increases in COVID-19 cases in the past week have no statewide stay-at-home orders, such as Nebraska and Iowa, which reported a 70% and 86% increase, respectively, in new cases per 100,000 residents over the seven days ending on April 29.
Other states that are actively planning on easing restrictions are also reporting some of the largest increases. In Minnesota, where Governor Tim Walz opted to allow select businesses to resume operations on April 27, the number of new cases per capita rose 53.7% over the past seven days. These are the states with the highest number of COVID-19 cases.
Severe symptoms do not typically begin to develop until the second week of infection. Because of this delay, there will also be a substantial delay between when these states reopen and when it will be possible to assess the effect of these decisions.

50. Vermont
> 7-day increase in confirmed COVID-19 cases through April 29: +1.3%
> Confirmed COVID-19 cases as of April 29: 133 per 100,000 — 22nd fewest (Vermont total: 834)
> Confirmed COVID-19 cases as of April 23: 131 per 100,000 — 20th most (Vermont total: 823)
> COVID-19 related deaths in 7 days ending April 29: 7 (Vermont total: 47)
> COVID-19 tests completed as of April 29: 2,285 per 100,000 people — 14th most (Vermont total tests: 14,310)
> Population density: 65 people per square mile — 21st lowest
> First confirmed case: March 7
[in-text-ad]

49. Montana
> 7-day increase in confirmed COVID-19 cases through April 29: +2.7%
> Confirmed COVID-19 cases as of April 29: 42 per 100,000 — the fewest (Montana total: 451)
> Confirmed COVID-19 cases as of April 23: 41 per 100,000 — the fewest (Montana total: 439)
> COVID-19 related deaths in 7 days ending April 29: 1 (Montana total: 15)
> COVID-19 tests completed as of April 29: 1,242 per 100,000 people — 10th fewest (Montana total tests: 13,191)
> Population density: 7 people per square mile — 3rd lowest
> First confirmed case: March 13
[recirclink id=683447]

48. Hawaii
> 7-day increase in confirmed COVID-19 cases through April 29: +2.9%
> Confirmed COVID-19 cases as of April 29: 43 per 100,000 — 2nd fewest (Hawaii total: 609)
> Confirmed COVID-19 cases as of April 23: 42 per 100,000 — 2nd fewest (Hawaii total: 592)
> COVID-19 related deaths in 7 days ending April 29: 4 (Hawaii total: 16)
> COVID-19 tests completed as of April 29: N/A
> Population density: 130 people per square mile — 20th highest
> First confirmed case: March 6

47. Alaska
> 7-day increase in confirmed COVID-19 cases through April 29: +4.8%
> Confirmed COVID-19 cases as of April 29: 48 per 100,000 — 3rd fewest (Alaska total: 351)
> Confirmed COVID-19 cases as of April 23: 45 per 100,000 — 3rd fewest (Alaska total: 335)
> COVID-19 related deaths in 7 days ending April 29: None (Alaska total: 9)
> COVID-19 tests completed as of April 29: 2,317 per 100,000 people — 12th most (Alaska total tests: 17,089)
> Population density: 1 people per square mile — the lowest
> First confirmed case: March 12
[in-text-ad-2]

46. Louisiana
> 7-day increase in confirmed COVID-19 cases through April 29: +8.0%
> Confirmed COVID-19 cases as of April 29: 586 per 100,000 — 6th most (Louisiana total: 27,286)
> Confirmed COVID-19 cases as of April 23: 542 per 100,000 — 6th most (Louisiana total: 25,258)
> COVID-19 related deaths in 7 days ending April 29: 285 (Louisiana total: 1,758)
> COVID-19 tests completed as of April 29: 3,243 per 100,000 people — 4th most (Louisiana total tests: 151,108)
> Population density: 89 people per square mile — 25th lowest
> First confirmed case: March 9

45. Idaho
> 7-day increase in confirmed COVID-19 cases through April 29: +8.6%
> Confirmed COVID-19 cases as of April 29: 109 per 100,000 — 16th fewest (Idaho total: 1,917)
> Confirmed COVID-19 cases as of April 23: 101 per 100,000 — 22nd fewest (Idaho total: 1,766)
> COVID-19 related deaths in 7 days ending April 29: 7 (Idaho total: 58)
> COVID-19 tests completed as of April 29: 1,143 per 100,000 people — 7th fewest (Idaho total tests: 20,052)
> Population density: 21 people per square mile — 7th lowest
> First confirmed case: March 13
[in-text-ad]

44. Washington
> 7-day increase in confirmed COVID-19 cases through April 29: +10.8%
> Confirmed COVID-19 cases as of April 29: 184 per 100,000 — 18th most (Washington total: 13,842)
> Confirmed COVID-19 cases as of April 23: 166 per 100,000 — 16th most (Washington total: 12,494)
> COVID-19 related deaths in 7 days ending April 29: 104 (Washington total: 786)
> COVID-19 tests completed as of April 29: 2,422 per 100,000 people — 9th most (Washington total tests: 182,515)
> Population density: 106 people per square mile — 23rd highest
> First confirmed case: 1/21
[recirclink id=703814]

43. West Virginia
> 7-day increase in confirmed COVID-19 cases through April 29: +13.7%
> Confirmed COVID-19 cases as of April 29: 61 per 100,000 — 5th fewest (West Virginia total: 1,095)
> Confirmed COVID-19 cases as of April 23: 53 per 100,000 — 6th fewest (West Virginia total: 963)
> COVID-19 related deaths in 7 days ending April 29: 9 (West Virginia total: 38)
> COVID-19 tests completed as of April 29: 2,300 per 100,000 people — 13th most (West Virginia total tests: 41,526)
> Population density: 75 people per square mile — 22nd lowest
> First confirmed case: March 17

42. Maine
> 7-day increase in confirmed COVID-19 cases through April 29: +14.7%
> Confirmed COVID-19 cases as of April 29: 78 per 100,000 — 8th fewest (Maine total: 1,040)
> Confirmed COVID-19 cases as of April 23: 68 per 100,000 — 8th fewest (Maine total: 907)
> COVID-19 related deaths in 7 days ending April 29: 12 (Maine total: 51)
> COVID-19 tests completed as of April 29: N/A
> Population density: 38 people per square mile — 12th lowest
> First confirmed case: March 12
[in-text-ad-2]

41. New York
> 7-day increase in confirmed COVID-19 cases through April 29: +14.7%
> Confirmed COVID-19 cases as of April 29: 1,510 per 100,000 — the most (New York total: 295,106)
> Confirmed COVID-19 cases as of April 23: 1,316 per 100,000 — the most (New York total: 257,216)
> COVID-19 related deaths in 7 days ending April 29: 2,336 (New York total: 17,638)
> COVID-19 tests completed as of April 29: 4,324 per 100,000 people — 2nd most (New York total tests: 844,994)
> Population density: 358 people per square mile — 7th highest
> First confirmed case: March 1

40. Florida
> 7-day increase in confirmed COVID-19 cases through April 29: +14.9%
> Confirmed COVID-19 cases as of April 29: 154 per 100,000 — 22nd most (Florida total: 32,846)
> Confirmed COVID-19 cases as of April 23: 134 per 100,000 — 19th most (Florida total: 28,576)
> COVID-19 related deaths in 7 days ending April 29: 226 (Florida total: 1,171)
> COVID-19 tests completed as of April 29: 1,731 per 100,000 people — 19th fewest (Florida total tests: 368,651)
> Population density: 324 people per square mile — 8th highest
> First confirmed case: March 1
[in-text-ad]

39. Michigan
> 7-day increase in confirmed COVID-19 cases through April 29: +15.6%
> Confirmed COVID-19 cases as of April 29: 393 per 100,000 — 8th most (Michigan total: 39,262)
> Confirmed COVID-19 cases as of April 23: 340 per 100,000 — 7th most (Michigan total: 33,966)
> COVID-19 related deaths in 7 days ending April 29: 754 (Michigan total: 3,567)
> COVID-19 tests completed as of April 29: N/A
> Population density: 103 people per square mile — 24th highest
> First confirmed case: March 10
[recirclink id=703712]

38. Oregon
> 7-day increase in confirmed COVID-19 cases through April 29: +15.8%
> Confirmed COVID-19 cases as of April 29: 57 per 100,000 — 4th fewest (Oregon total: 2,385)
> Confirmed COVID-19 cases as of April 23: 49 per 100,000 — 5th fewest (Oregon total: 2,059)
> COVID-19 related deaths in 7 days ending April 29: 21 (Oregon total: 99)
> COVID-19 tests completed as of April 29: 1,247 per 100,000 people — 11th fewest (Oregon total tests: 52,242)
> Population density: 43 people per square mile — 13th lowest
> First confirmed case: 2/28

37. Connecticut
> 7-day increase in confirmed COVID-19 cases through April 29: +17.1%
> Confirmed COVID-19 cases as of April 29: 736 per 100,000 — 5th most (Connecticut total: 26,312)
> Confirmed COVID-19 cases as of April 23: 629 per 100,000 — 3rd most (Connecticut total: 22,469)
> COVID-19 related deaths in 7 days ending April 29: 545 (Connecticut total: 2,089)
> COVID-19 tests completed as of April 29: 2,596 per 100,000 people — 8th most (Connecticut total tests: 92,745)
> Population density: 645 people per square mile — 4th highest
> First confirmed case: March 8
[in-text-ad-2]

36. Georgia
> 7-day increase in confirmed COVID-19 cases through April 29: +17.8%
> Confirmed COVID-19 cases as of April 29: 236 per 100,000 — 15th most (Georgia total: 24,854)
> Confirmed COVID-19 cases as of April 23: 201 per 100,000 — 13th most (Georgia total: 21,102)
> COVID-19 related deaths in 7 days ending April 29: 190 (Georgia total: 1,036)
> COVID-19 tests completed as of April 29: 1,333 per 100,000 people — 16th fewest (Georgia total tests: 140,223)
> Population density: 177 people per square mile — 16th highest
> First confirmed case: March 2

35. Oklahoma
> 7-day increase in confirmed COVID-19 cases through April 29: +17.8%
> Confirmed COVID-19 cases as of April 29: 86 per 100,000 — 9th fewest (Oklahoma total: 3,410)
> Confirmed COVID-19 cases as of April 23: 73 per 100,000 — 10th fewest (Oklahoma total: 2,894)
> COVID-19 related deaths in 7 days ending April 29: 37 (Oklahoma total: 207)
> COVID-19 tests completed as of April 29: N/A
> Population density: 56 people per square mile — 16th lowest
> First confirmed case: March 6
[in-text-ad]

34. Nevada
> 7-day increase in confirmed COVID-19 cases through April 29: +18.1%
> Confirmed COVID-19 cases as of April 29: 159 per 100,000 — 21st most (Nevada total: 4,821)
> Confirmed COVID-19 cases as of April 23: 134 per 100,000 — 18th most (Nevada total: 4,081)
> COVID-19 related deaths in 7 days ending April 29: 51 (Nevada total: 225)
> COVID-19 tests completed as of April 29: 1,323 per 100,000 people — 15th fewest (Nevada total tests: 40,135)
> Population density: 27 people per square mile — 9th lowest
> First confirmed case: March 5
[recirclink id=684292]

33. New Jersey
> 7-day increase in confirmed COVID-19 cases through April 29: +18.8%
> Confirmed COVID-19 cases as of April 29: 1,278 per 100,000 — 2nd most (New Jersey total: 113,856)
> Confirmed COVID-19 cases as of April 23: 1,076 per 100,000 — 2nd most (New Jersey total: 95,865)
> COVID-19 related deaths in 7 days ending April 29: 1,379 (New Jersey total: 6,442)
> COVID-19 tests completed as of April 29: 2,358 per 100,000 people — 11th most (New Jersey total tests: 210,043)
> Population density: 1,021 people per square mile — the highest
> First confirmed case: March 4

32. Ohio
> 7-day increase in confirmed COVID-19 cases through April 29: +18.8%
> Confirmed COVID-19 cases as of April 29: 143 per 100,000 — 25th most (Ohio total: 16,769)
> Confirmed COVID-19 cases as of April 23: 121 per 100,000 — 21st most (Ohio total: 14,117)
> COVID-19 related deaths in 7 days ending April 29: 189 (Ohio total: 799)
> COVID-19 tests completed as of April 29: N/A
> Population density: 261 people per square mile — 10th highest
> First confirmed case: March 9
[in-text-ad-2]

31. Missouri
> 7-day increase in confirmed COVID-19 cases through April 29: +19.0%
> Confirmed COVID-19 cases as of April 29: 119 per 100,000 — 19th fewest (Missouri total: 7,303)
> Confirmed COVID-19 cases as of April 23: 100 per 100,000 — 21st fewest (Missouri total: 6,137)
> COVID-19 related deaths in 7 days ending April 29: 106 (Missouri total: 314)
> COVID-19 tests completed as of April 29: 1,257 per 100,000 people — 12th fewest (Missouri total tests: 77,037)
> Population density: 88 people per square mile — 23rd lowest
> First confirmed case: March 7
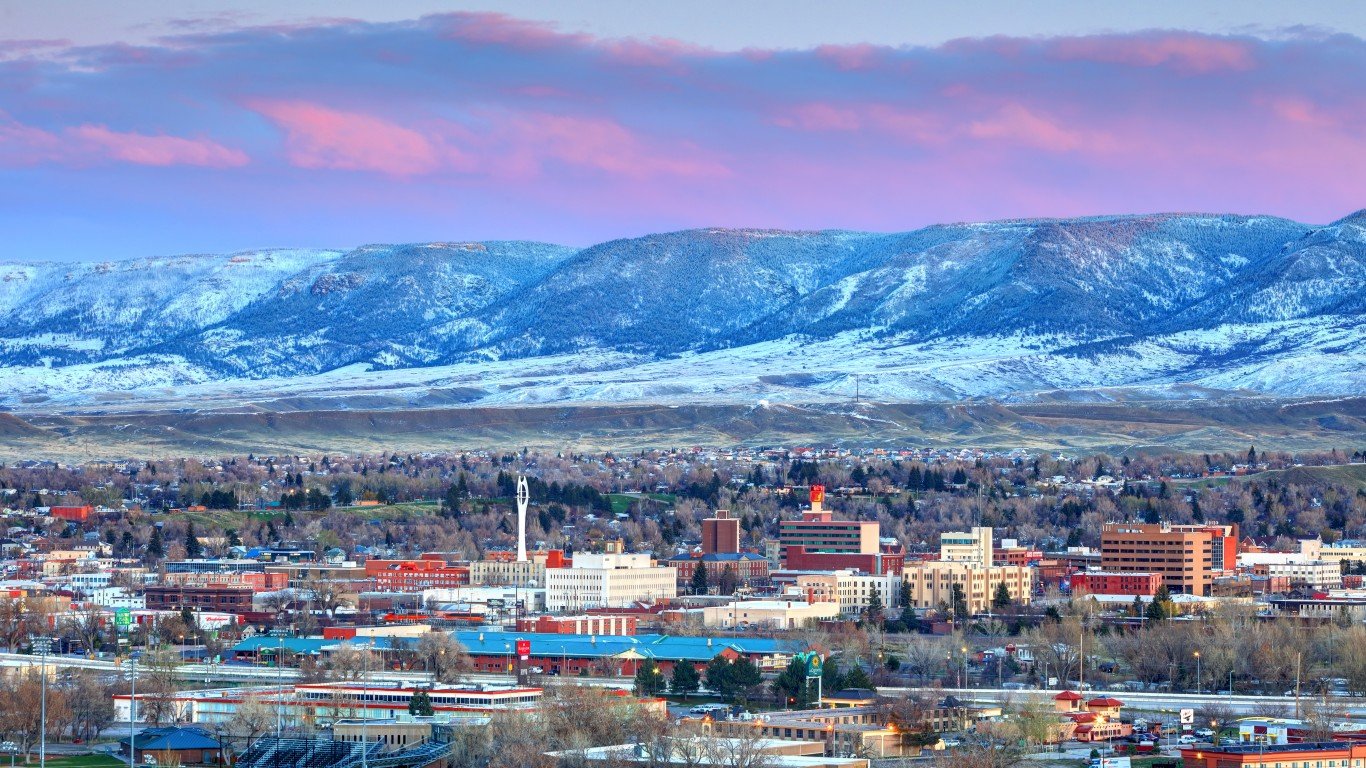
30. Wyoming
> 7-day increase in confirmed COVID-19 cases through April 29: +19.3%
> Confirmed COVID-19 cases as of April 29: 67 per 100,000 — 6th fewest (Wyoming total: 389)
> Confirmed COVID-19 cases as of April 23: 56 per 100,000 — 7th fewest (Wyoming total: 326)
> COVID-19 related deaths in 7 days ending April 29: 1 (Wyoming total: 7)
> COVID-19 tests completed as of April 29: N/A
> Population density: 6 people per square mile — 2nd lowest
> First confirmed case: March 11
[in-text-ad]
29. South Carolina
> 7-day increase in confirmed COVID-19 cases through April 29: +20.5%
> Confirmed COVID-19 cases as of April 29: 113 per 100,000 — 17th fewest (South Carolina total: 5,735)
> Confirmed COVID-19 cases as of April 23: 94 per 100,000 — 18th fewest (South Carolina total: 4,761)
> COVID-19 related deaths in 7 days ending April 29: 52 (South Carolina total: 192)
> COVID-19 tests completed as of April 29: 1,045 per 100,000 people — 3rd fewest (South Carolina total tests: 53,115)
> Population density: 159 people per square mile — 18th highest
> First confirmed case: March 6
[recirclink id=683447]

28. Pennsylvania
> 7-day increase in confirmed COVID-19 cases through April 29: +21.2%
> Confirmed COVID-19 cases as of April 29: 338 per 100,000 — 10th most (Pennsylvania total: 43,264)
> Confirmed COVID-19 cases as of April 23: 279 per 100,000 — 9th most (Pennsylvania total: 35,684)
> COVID-19 related deaths in 7 days ending April 29: 94 (Pennsylvania total: 1,716)
> COVID-19 tests completed as of April 29: N/A
> Population density: 278 people per square mile — 9th highest
> First confirmed case: March 6

27. Alabama
> 7-day increase in confirmed COVID-19 cases through April 29: +21.3%
> Confirmed COVID-19 cases as of April 29: 139 per 100,000 — 24th fewest (Alabama total: 6,779)
> Confirmed COVID-19 cases as of April 23: 114 per 100,000 — 25th fewest (Alabama total: 5,589)
> COVID-19 related deaths in 7 days ending April 29: 46 (Alabama total: 242)
> COVID-19 tests completed as of April 29: 1,567 per 100,000 people — 18th fewest (Alabama total tests: 76,584)
> Population density: 93 people per square mile — 25th highest
> First confirmed case: March 13
[in-text-ad-2]

26. Texas
> 7-day increase in confirmed COVID-19 cases through April 29: +24.2%
> Confirmed COVID-19 cases as of April 29: 91 per 100,000 — 10th fewest (Texas total: 26,171)
> Confirmed COVID-19 cases as of April 23: 73 per 100,000 — 11th fewest (Texas total: 21,069)
> COVID-19 related deaths in 7 days ending April 29: 147 (Texas total: 690)
> COVID-19 tests completed as of April 29: 1,047 per 100,000 people — 4th fewest (Texas total tests: 300,384)
> Population density: 107 people per square mile — 22nd highest
> First confirmed case: 2/12
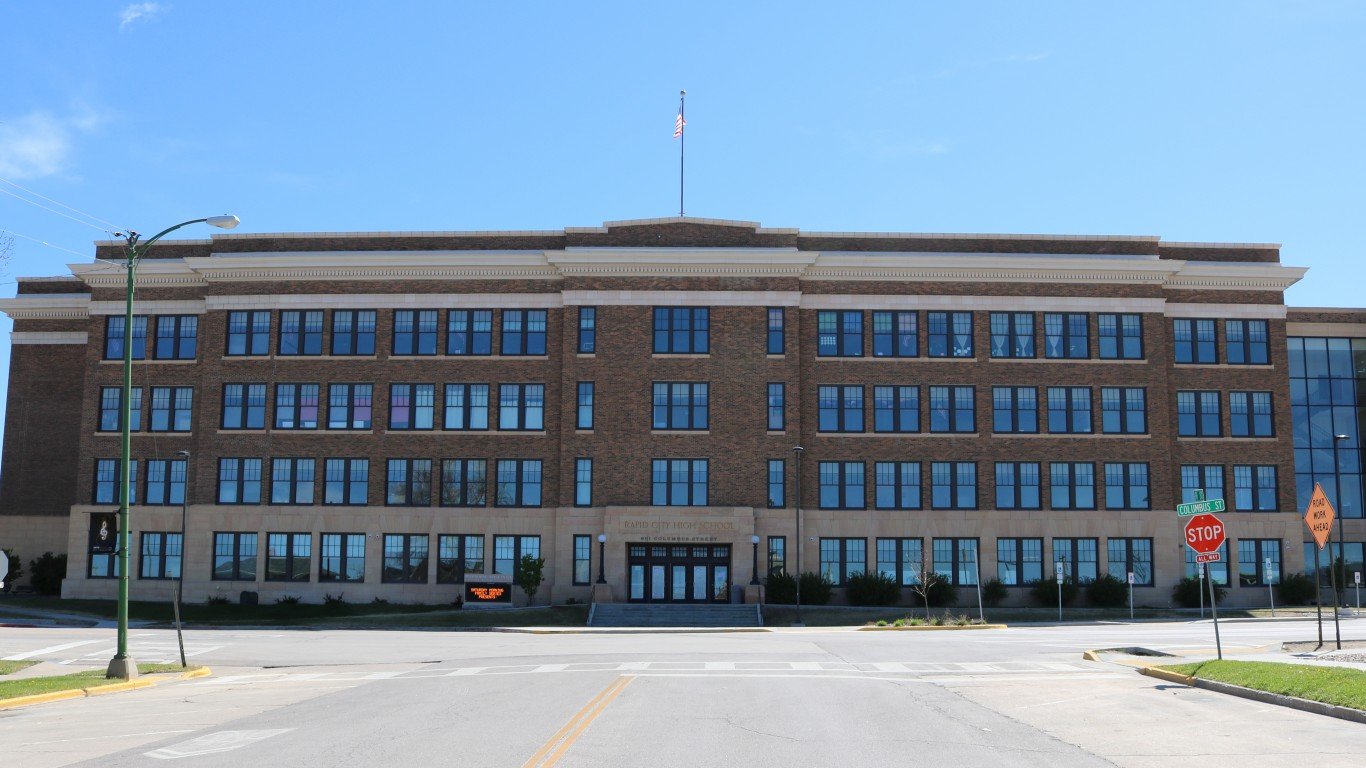
25. South Dakota
> 7-day increase in confirmed COVID-19 cases through April 29: +24.5%
> Confirmed COVID-19 cases as of April 29: 262 per 100,000 — 12th most (South Dakota total: 2,313)
> Confirmed COVID-19 cases as of April 23: 211 per 100,000 — 12th most (South Dakota total: 1,858)
> COVID-19 related deaths in 7 days ending April 29: 2 (South Dakota total: 11)
> COVID-19 tests completed as of April 29: 1,883 per 100,000 people — 20th fewest (South Dakota total tests: 16,612)
> Population density: 11 people per square mile — 5th lowest
> First confirmed case: March 10
[in-text-ad]

24. California
> 7-day increase in confirmed COVID-19 cases through April 29: +24.6%
> Confirmed COVID-19 cases as of April 29: 117 per 100,000 — 18th fewest (California total: 46,445)
> Confirmed COVID-19 cases as of April 23: 94 per 100,000 — 20th fewest (California total: 37,286)
> COVID-19 related deaths in 7 days ending April 29: 466 (California total: 1,873)
> COVID-19 tests completed as of April 29: N/A
> Population density: 242 people per square mile — 11th highest
> First confirmed case: Jan. 25
[recirclink id=703814]

23. Utah
> 7-day increase in confirmed COVID-19 cases through April 29: +26.1%
> Confirmed COVID-19 cases as of April 29: 137 per 100,000 — 23rd fewest (Utah total: 4,343)
> Confirmed COVID-19 cases as of April 23: 109 per 100,000 — 24th fewest (Utah total: 3,445)
> COVID-19 related deaths in 7 days ending April 29: 11 (Utah total: 45)
> COVID-19 tests completed as of April 29: 3,241 per 100,000 people — 5th most (Utah total tests: 102,439)
> Population density: 37 people per square mile — 11th lowest
> First confirmed case: 2/25

22. New Hampshire
> 7-day increase in confirmed COVID-19 cases through April 29: +26.6%
> Confirmed COVID-19 cases as of April 29: 148 per 100,000 — 24th most (New Hampshire total: 2,010)
> Confirmed COVID-19 cases as of April 23: 117 per 100,000 — 24th most (New Hampshire total: 1,588)
> COVID-19 related deaths in 7 days ending April 29: 12 (New Hampshire total: 60)
> COVID-19 tests completed as of April 29: N/A
> Population density: 145 people per square mile — 19th highest
> First confirmed case: March 2
[in-text-ad-2]

21. Arizona
> 7-day increase in confirmed COVID-19 cases through April 29: +27.3%
> Confirmed COVID-19 cases as of April 29: 97 per 100,000 — 12th fewest (Arizona total: 6,948)
> Confirmed COVID-19 cases as of April 23: 76 per 100,000 — 15th fewest (Arizona total: 5,459)
> COVID-19 related deaths in 7 days ending April 29: 64 (Arizona total: 293)
> COVID-19 tests completed as of April 29: 940 per 100,000 people — the fewest (Arizona total tests: 67,438)
> Population density: 63 people per square mile — 19th lowest
> First confirmed case: Jan. 26

20. Tennessee
> 7-day increase in confirmed COVID-19 cases through April 29: +28.2%
> Confirmed COVID-19 cases as of April 29: 148 per 100,000 — 23rd most (Tennessee total: 10,052)
> Confirmed COVID-19 cases as of April 23: 116 per 100,000 — 25th most (Tennessee total: 7,842)
> COVID-19 related deaths in 7 days ending April 29: 22 (Tennessee total: 188)
> COVID-19 tests completed as of April 29: 2,392 per 100,000 people — 10th most (Tennessee total tests: 161,926)
> Population density: 161 people per square mile — 17th highest
> First confirmed case: March 5
[in-text-ad]

19. Mississippi
> 7-day increase in confirmed COVID-19 cases through April 29: +29.6%
> Confirmed COVID-19 cases as of April 29: 212 per 100,000 — 16th most (Mississippi total: 6,342)
> Confirmed COVID-19 cases as of April 23: 164 per 100,000 — 17th most (Mississippi total: 4,894)
> COVID-19 related deaths in 7 days ending April 29: 46 (Mississippi total: 239)
> COVID-19 tests completed as of April 29: 2,157 per 100,000 people — 15th most (Mississippi total tests: 64,412)
> Population density: 62 people per square mile — 18th lowest
> First confirmed case: March 11
[recirclink id=703712]

18. Kentucky
> 7-day increase in confirmed COVID-19 cases through April 29: +29.7%
> Confirmed COVID-19 cases as of April 29: 98 per 100,000 — 13th fewest (Kentucky total: 4,375)
> Confirmed COVID-19 cases as of April 23: 75 per 100,000 — 12th fewest (Kentucky total: 3,373)
> COVID-19 related deaths in 7 days ending April 29: 40 (Kentucky total: 225)
> COVID-19 tests completed as of April 29: N/A
> Population density: 111 people per square mile — 21st highest
> First confirmed case: March 6

17. Wisconsin
> 7-day increase in confirmed COVID-19 cases through April 29: +29.8%
> Confirmed COVID-19 cases as of April 29: 108 per 100,000 — 15th fewest (Wisconsin total: 6,289)
> Confirmed COVID-19 cases as of April 23: 83 per 100,000 — 16th fewest (Wisconsin total: 4,845)
> COVID-19 related deaths in 7 days ending April 29: 54 (Wisconsin total: 300)
> COVID-19 tests completed as of April 29: N/A
> Population density: 89 people per square mile — 24th lowest
> First confirmed case: Feb. 5
[in-text-ad-2]

16. Colorado
> 7-day increase in confirmed COVID-19 cases through April 29: +31.6%
> Confirmed COVID-19 cases as of April 29: 251 per 100,000 — 13th most (Colorado total: 14,316)
> Confirmed COVID-19 cases as of April 23: 191 per 100,000 — 14th most (Colorado total: 10,878)
> COVID-19 related deaths in 7 days ending April 29: 228 (Colorado total: 736)
> COVID-19 tests completed as of April 29: 1,178 per 100,000 people — 8th fewest (Colorado total tests: 67,094)
> Population density: 55 people per square mile — 14th lowest
> First confirmed case: March 5

15. North Carolina
> 7-day increase in confirmed COVID-19 cases through April 29: +32.5%
> Confirmed COVID-19 cases as of April 29: 92 per 100,000 — 11th fewest (North Carolina total: 9,568)
> Confirmed COVID-19 cases as of April 23: 70 per 100,000 — 9th fewest (North Carolina total: 7,220)
> COVID-19 related deaths in 7 days ending April 29: 100 (North Carolina total: 342)
> COVID-19 tests completed as of April 29: 1,086 per 100,000 people — 5th fewest (North Carolina total tests: 112,752)
> Population density: 193 people per square mile — 14th highest
> First confirmed case: March 3
[in-text-ad]

14. Indiana
> 7-day increase in confirmed COVID-19 cases through April 29: +33.4%
> Confirmed COVID-19 cases as of April 29: 248 per 100,000 — 14th most (Indiana total: 16,588)
> Confirmed COVID-19 cases as of April 23: 186 per 100,000 — 15th most (Indiana total: 12,438)
> COVID-19 related deaths in 7 days ending April 29: 240 (Indiana total: 901)
> COVID-19 tests completed as of April 29: 1,303 per 100,000 people — 14th fewest (Indiana total tests: 87,181)
> Population density: 184 people per square mile — 15th highest
> First confirmed case: March 6
[recirclink id=684292]
13. New Mexico
> 7-day increase in confirmed COVID-19 cases through April 29: +34.6%
> Confirmed COVID-19 cases as of April 29: 142 per 100,000 — 25th fewest (New Mexico total: 2,974)
> Confirmed COVID-19 cases as of April 23: 105 per 100,000 — 23rd fewest (New Mexico total: 2,210)
> COVID-19 related deaths in 7 days ending April 29: 39 (New Mexico total: 110)
> COVID-19 tests completed as of April 29: 2,947 per 100,000 people — 7th most (New Mexico total tests: 61,745)
> Population density: 17 people per square mile — 6th lowest
> First confirmed case: March 11

12. Rhode Island
> 7-day increase in confirmed COVID-19 cases through April 29: +35.7%
> Confirmed COVID-19 cases as of April 29: 750 per 100,000 — 4th most (Rhode Island total: 7,926)
> Confirmed COVID-19 cases as of April 23: 552 per 100,000 — 5th most (Rhode Island total: 5,841)
> COVID-19 related deaths in 7 days ending April 29: 58 (Rhode Island total: 239)
> COVID-19 tests completed as of April 29: 5,457 per 100,000 people — the most (Rhode Island total tests: 57,693)
> Population density: 684 people per square mile — 2nd highest
> First confirmed case: March 1
[in-text-ad-2]

11. Massachusetts
> 7-day increase in confirmed COVID-19 cases through April 29: +35.8%
> Confirmed COVID-19 cases as of April 29: 845 per 100,000 — 3rd most (Massachusetts total: 58,302)
> Confirmed COVID-19 cases as of April 23: 622 per 100,000 — 4th most (Massachusetts total: 42,944)
> COVID-19 related deaths in 7 days ending April 29: 971 (Massachusetts total: 3,153)
> COVID-19 tests completed as of April 29: 3,687 per 100,000 people — 3rd most (Massachusetts total tests: 254,500)
> Population density: 654 people per square mile — 3rd highest
> First confirmed case: Feb. 1

10. Maryland
> 7-day increase in confirmed COVID-19 cases through April 29: +36.1%
> Confirmed COVID-19 cases as of April 29: 333 per 100,000 — 11th most (Maryland total: 20,113)
> Confirmed COVID-19 cases as of April 23: 245 per 100,000 — 11th most (Maryland total: 14,775)
> COVID-19 related deaths in 7 days ending April 29: 298 (Maryland total: 929)
> COVID-19 tests completed as of April 29: N/A
> Population density: 487 people per square mile — 5th highest
> First confirmed case: March 5
[in-text-ad]

9. Illinois
> 7-day increase in confirmed COVID-19 cases through April 29: +37.0%
> Confirmed COVID-19 cases as of April 29: 378 per 100,000 — 9th most (Illinois total: 48,102)
> Confirmed COVID-19 cases as of April 23: 276 per 100,000 — 10th most (Illinois total: 35,108)
> COVID-19 related deaths in 7 days ending April 29: 560 (Illinois total: 2,125)
> COVID-19 tests completed as of April 29: 1,901 per 100,000 people — 16th most (Illinois total tests: 242,189)
> Population density: 220 people per square mile — 12th highest
> First confirmed case: Jan. 24
[recirclink id=683447]

8. Arkansas
> 7-day increase in confirmed COVID-19 cases through April 29: +37.4%
> Confirmed COVID-19 cases as of April 29: 104 per 100,000 — 14th fewest (Arkansas total: 3,127)
> Confirmed COVID-19 cases as of April 23: 76 per 100,000 — 13th fewest (Arkansas total: 2,276)
> COVID-19 related deaths in 7 days ending April 29: 15 (Arkansas total: 57)
> COVID-19 tests completed as of April 29: 1,437 per 100,000 people — 17th fewest (Arkansas total tests: 43,321)
> Population density: 57 people per square mile — 17th lowest
> First confirmed case: March 11
7. Delaware
> 7-day increase in confirmed COVID-19 cases through April 29: +43.0%
> Confirmed COVID-19 cases as of April 29: 473 per 100,000 — 7th most (Delaware total: 4,575)
> Confirmed COVID-19 cases as of April 23: 331 per 100,000 — 8th most (Delaware total: 3,200)
> COVID-19 related deaths in 7 days ending April 29: 48 (Delaware total: 137)
> COVID-19 tests completed as of April 29: N/A
> Population density: 389 people per square mile — 6th highest
> First confirmed case: March 11
[in-text-ad-2]

6. Virginia
> 7-day increase in confirmed COVID-19 cases through April 29: +45.7%
> Confirmed COVID-19 cases as of April 29: 176 per 100,000 — 19th most (Virginia total: 14,961)
> Confirmed COVID-19 cases as of April 23: 121 per 100,000 — 22nd most (Virginia total: 10,266)
> COVID-19 related deaths in 7 days ending April 29: 173 (Virginia total: 522)
> COVID-19 tests completed as of April 29: 1,002 per 100,000 people — 2nd fewest (Virginia total tests: 85,307)
> Population density: 199 people per square mile — 13th highest
> First confirmed case: March 7

5. North Dakota
> 7-day increase in confirmed COVID-19 cases through April 29: +45.9%
> Confirmed COVID-19 cases as of April 29: 130 per 100,000 — 21st fewest (North Dakota total: 991)
> Confirmed COVID-19 cases as of April 23: 89 per 100,000 — 17th fewest (North Dakota total: 679)
> COVID-19 related deaths in 7 days ending April 29: 5 (North Dakota total: 19)
> COVID-19 tests completed as of April 29: 3,121 per 100,000 people — 6th most (North Dakota total tests: 23,723)
> Population density: 11 people per square mile — 4th lowest
> First confirmed case: March 11
[in-text-ad]

4. Minnesota
> 7-day increase in confirmed COVID-19 cases through April 29: +53.7%
> Confirmed COVID-19 cases as of April 29: 75 per 100,000 — 7th fewest (Minnesota total: 4,181)
> Confirmed COVID-19 cases as of April 23: 48 per 100,000 — 4th fewest (Minnesota total: 2,721)
> COVID-19 related deaths in 7 days ending April 29: 122 (Minnesota total: 301)
> COVID-19 tests completed as of April 29: 1,138 per 100,000 people — 6th fewest (Minnesota total tests: 63,829)
> Population density: 65 people per square mile — 20th lowest
> First confirmed case: March 6
[recirclink id=703814]

3. Kansas
> 7-day increase in confirmed COVID-19 cases through April 29: +57.9%
> Confirmed COVID-19 cases as of April 29: 120 per 100,000 — 20th fewest (Kansas total: 3,491)
> Confirmed COVID-19 cases as of April 23: 76 per 100,000 — 14th fewest (Kansas total: 2,211)
> COVID-19 related deaths in 7 days ending April 29: 14 (Kansas total: 124)
> COVID-19 tests completed as of April 29: N/A
> Population density: 35 people per square mile — 10th lowest
> First confirmed case: March 7

2. Iowa
> 7-day increase in confirmed COVID-19 cases through April 29: +70.1%
> Confirmed COVID-19 cases as of April 29: 202 per 100,000 — 17th most (Iowa total: 6,376)
> Confirmed COVID-19 cases as of April 23: 119 per 100,000 — 23rd most (Iowa total: 3,748)
> COVID-19 related deaths in 7 days ending April 29: 46 (Iowa total: 136)
> COVID-19 tests completed as of April 29: 1,262 per 100,000 people — 13th fewest (Iowa total tests: 39,823)
> Population density: 56 people per square mile — 15th lowest
> First confirmed case: March 8
[in-text-ad-2]

1. Nebraska
> 7-day increase in confirmed COVID-19 cases through April 29: +86.1%
> Confirmed COVID-19 cases as of April 29: 175 per 100,000 — 20th most (Nebraska total: 3,374)
> Confirmed COVID-19 cases as of April 23: 94 per 100,000 — 19th fewest (Nebraska total: 1,813)
> COVID-19 related deaths in 7 days ending April 29: 13 (Nebraska total: 55)
> COVID-19 tests completed as of April 29: 1,234 per 100,000 people — 9th fewest (Nebraska total tests: 23,798)
> Population density: 25 people per square mile — 8th lowest
> First confirmed case: 2/17
Contact [email protected] for any questions or corrections.