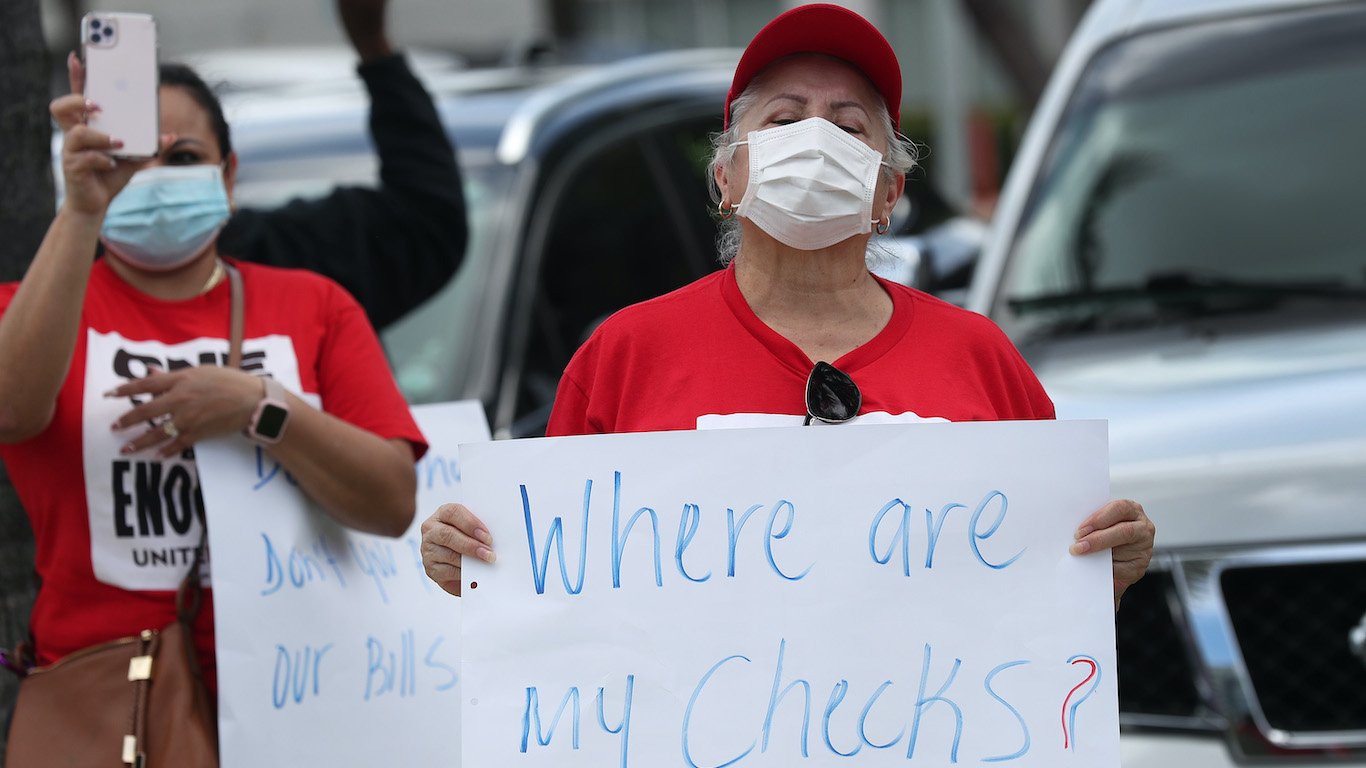
The latest weekly jobless claims figures were released on May 28. For the week ending May 23, just under 2 million Americans filed to receive unemployment benefits. While this marks the first week in over two months that unemployment claims fell below 2 million, it is still a staggering figure on top of a long stream of devastating weeks for U.S. workers. After the last 10 combined weeks of jobless claims, the number of Americans filing for unemployment since the coronavirus crisis began in earnest in mid-March is now approaching 40 million, or about 25% of the U.S. labor force.
As unemployment claims have continued to surge by the millions with each passing week, 24/7 Wall St. has been compiling a state-by-state review of jobless claims. Job losses by state range from the tens of thousands to the millions over the 10 weeks beginning on March 15, amounting to anywhere from 10% to over 40% of each state’s total labor force before the pandemic hit.
According to the Bureau of Labor Statistics, the U.S. unemployment rate reached 14.7% in April, a level not seen since the Great Depression. In a number of states, the April unemployment rate was much higher, with over one-fifth of Hawaii’s labor force and over one-quarter of Nevada’s labor force unemployed. These state rates will only worsen in May, as the jobless ranks continue to swell in every state.
The current economic downturn is largely attributable to efforts to contain the spread of the coronavirus. Officials across the country have heeded advice from health experts and instituted a range of measures to facilitate social distancing, from shelter-in-place orders to closing nonessential businesses. Many of those states are beginning to partially reopen their economies. Here are every state’s rules for staying at home and social distancing.
The places where unemployment rates are projected to be the highest in the coming months tend to be in states that rely on industries that are bearing the brunt of the current economic downturn. These industries include leisure and hospitality, travel services, transportation and warehousing, and oil and gas extraction. These industries also serve as the economic backbone for a number of cities across the country. Here is a look at the places a COVID-19 recession will likely hit hardest.
Click here to see every state’s unemployment since COVID-19 shut the economy down
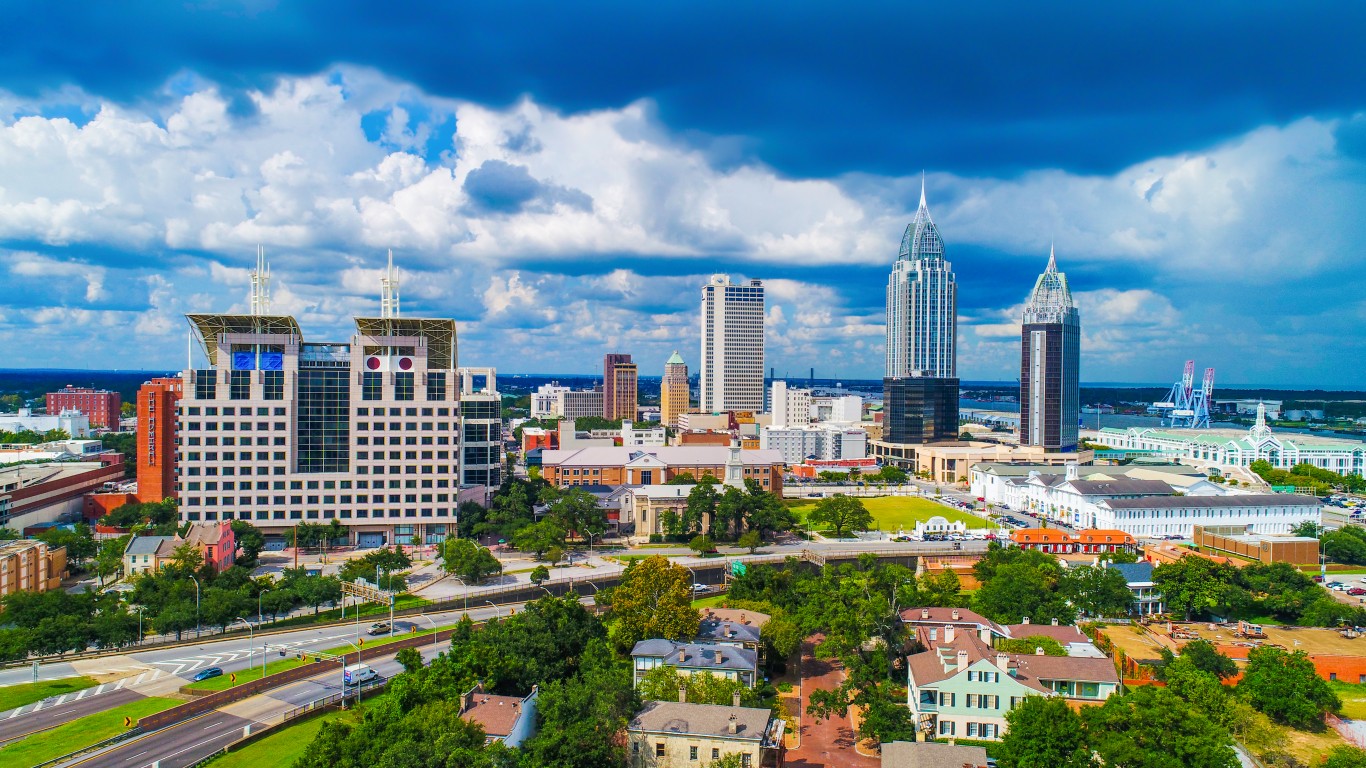
Alabama
> Unemployment claims since mid-March: 524,617 (25th most)
> Unemployment claims relative to workforce: 23.4% of workforce (17th highest)
> Most recent week’s unemployment claims (May 17 – May 23): 27,289 (21st most)
> April unemployment rate: 12.9% (25th highest)
> Change in weekly claims from one year ago: +24,560 (+900.0%)
> Pre-COVID-19 pct. of workers in high-risk industries: 16.8% (21st lowest)
[in-text-ad]

Alaska
> Unemployment claims since mid-March: 104,361 (6th fewest)
> Unemployment claims relative to workforce: 30.2% of workforce (9th highest)
> Most recent week’s unemployment claims (May 17 – May 23): 8,537 (15th fewest)
> April unemployment rate: 12.9% (25th highest)
> Change in weekly claims from one year ago: +7,550 (+764.9%)
> Pre-COVID-19 pct. of workers in high-risk industries: 21.8% (4th highest)
[recirclink id=707807]

Arizona
> Unemployment claims since mid-March: 607,099 (19th most)
> Unemployment claims relative to workforce: 17.3% of workforce (12th lowest)
> Most recent week’s unemployment claims (May 17 – May 23): 26,878 (22nd most)
> April unemployment rate: 12.6% (22nd lowest)
> Change in weekly claims from one year ago: +22,749 (+551.0%)
> Pre-COVID-19 pct. of workers in high-risk industries: 19.3% (15th highest)

Arkansas
> Unemployment claims since mid-March: 225,144 (16th fewest)
> Unemployment claims relative to workforce: 16.6% of workforce (10th lowest)
> Most recent week’s unemployment claims (May 17 – May 23): 10,464 (17th fewest)
> April unemployment rate: 10.2% (11th lowest)
> Change in weekly claims from one year ago: +8,473 (+425.6%)
> Pre-COVID-19 pct. of workers in high-risk industries: 17.0% (23rd lowest)
[in-text-ad-2]

California
> Unemployment claims since mid-March: 4,663,553 (the most)
> Unemployment claims relative to workforce: 24.0% of workforce (15th highest)
> Most recent week’s unemployment claims (May 17 – May 23): 212,343 (the most)
> April unemployment rate: 15.5% (10th highest)
> Change in weekly claims from one year ago: +174,068 (+454.8%)
> Pre-COVID-19 pct. of workers in high-risk industries: 17.9% (22nd highest)
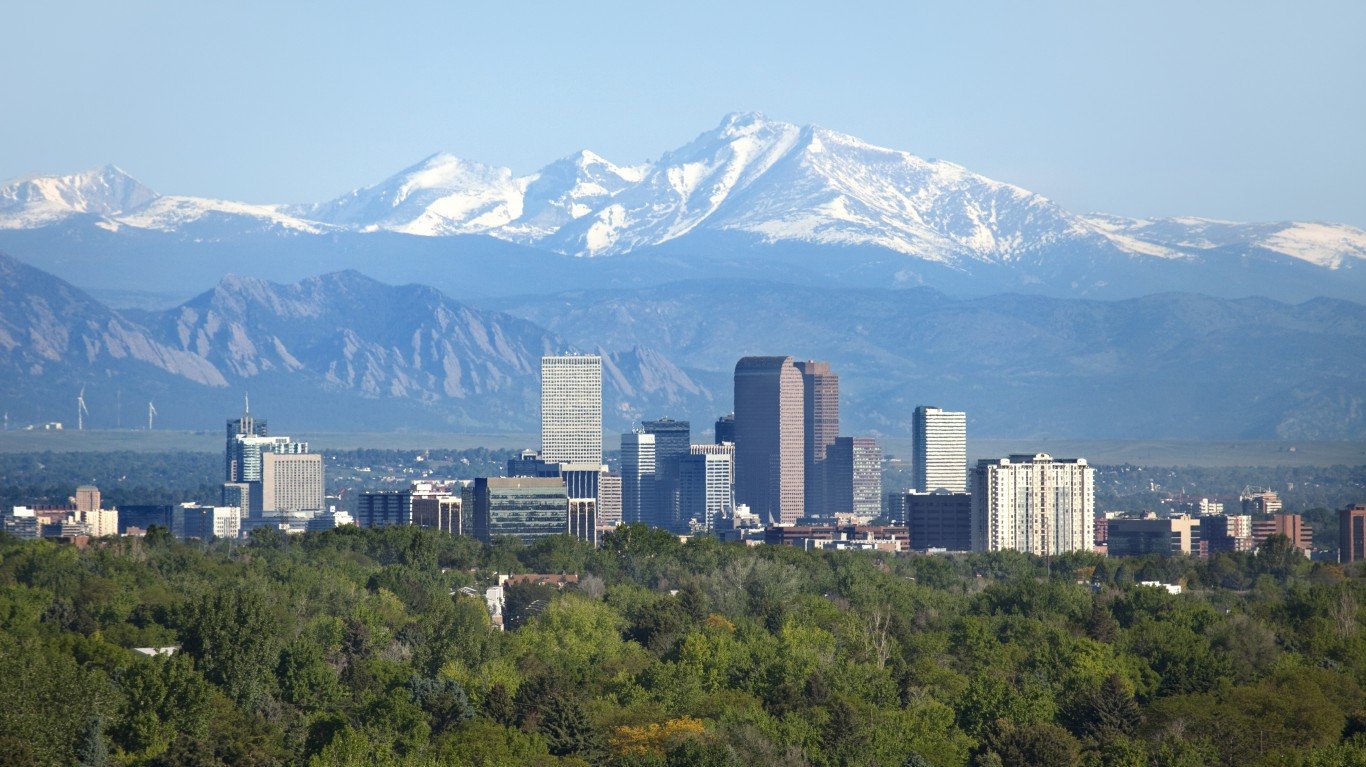
Colorado
> Unemployment claims since mid-March: 424,716 (23rd fewest)
> Unemployment claims relative to workforce: 13.6% of workforce (4th lowest)
> Most recent week’s unemployment claims (May 17 – May 23): 15,731 (20th fewest)
> April unemployment rate: 11.3% (17th lowest)
> Change in weekly claims from one year ago: +13,851 (+736.8%)
> Pre-COVID-19 pct. of workers in high-risk industries: 18.6% (19th highest)
[in-text-ad]

Connecticut
> Unemployment claims since mid-March: 370,367 (21st fewest)
> Unemployment claims relative to workforce: 19.6% of workforce (23rd lowest)
> Most recent week’s unemployment claims (May 17 – May 23): 16,584 (21st fewest)
> April unemployment rate: 7.9% (the lowest)
> Change in weekly claims from one year ago: +13,892 (+516.0%)
> Pre-COVID-19 pct. of workers in high-risk industries: 14.2% (the lowest)
[recirclink id=707752]

Delaware
> Unemployment claims since mid-March: 101,094 (5th fewest)
> Unemployment claims relative to workforce: 20.9% of workforce (24th highest)
> Most recent week’s unemployment claims (May 17 – May 23): 4,783 (10th fewest)
> April unemployment rate: 14.3% (21st highest)
> Change in weekly claims from one year ago: +4,386 (+1,104.8%)
> Pre-COVID-19 pct. of workers in high-risk industries: 17.0% (22nd lowest)

Florida
> Unemployment claims since mid-March: 2,388,418 (3rd most)
> Unemployment claims relative to workforce: 23.2% of workforce (19th highest)
> Most recent week’s unemployment claims (May 17 – May 23): 173,731 (3rd most)
> April unemployment rate: 12.9% (25th highest)
> Change in weekly claims from one year ago: +167,627 (+2,746.2%)
> Pre-COVID-19 pct. of workers in high-risk industries: 20.1% (6th highest)
[in-text-ad-2]

Georgia
> Unemployment claims since mid-March: 2,179,120 (5th most)
> Unemployment claims relative to workforce: 42.7% of workforce (the highest)
> Most recent week’s unemployment claims (May 17 – May 23): 164,350 (4th most)
> April unemployment rate: 11.9% (19th lowest)
> Change in weekly claims from one year ago: +160,159 (+3,821.5%)
> Pre-COVID-19 pct. of workers in high-risk industries: 19.7% (9th highest)

Hawaii
> Unemployment claims since mid-March: 241,260 (17th fewest)
> Unemployment claims relative to workforce: 36.3% of workforce (3rd highest)
> Most recent week’s unemployment claims (May 17 – May 23): 8,683 (16th fewest)
> April unemployment rate: 22.3% (3rd highest)
> Change in weekly claims from one year ago: +7,480 (+621.8%)
> Pre-COVID-19 pct. of workers in high-risk industries: 27.1% (2nd highest)
[in-text-ad]
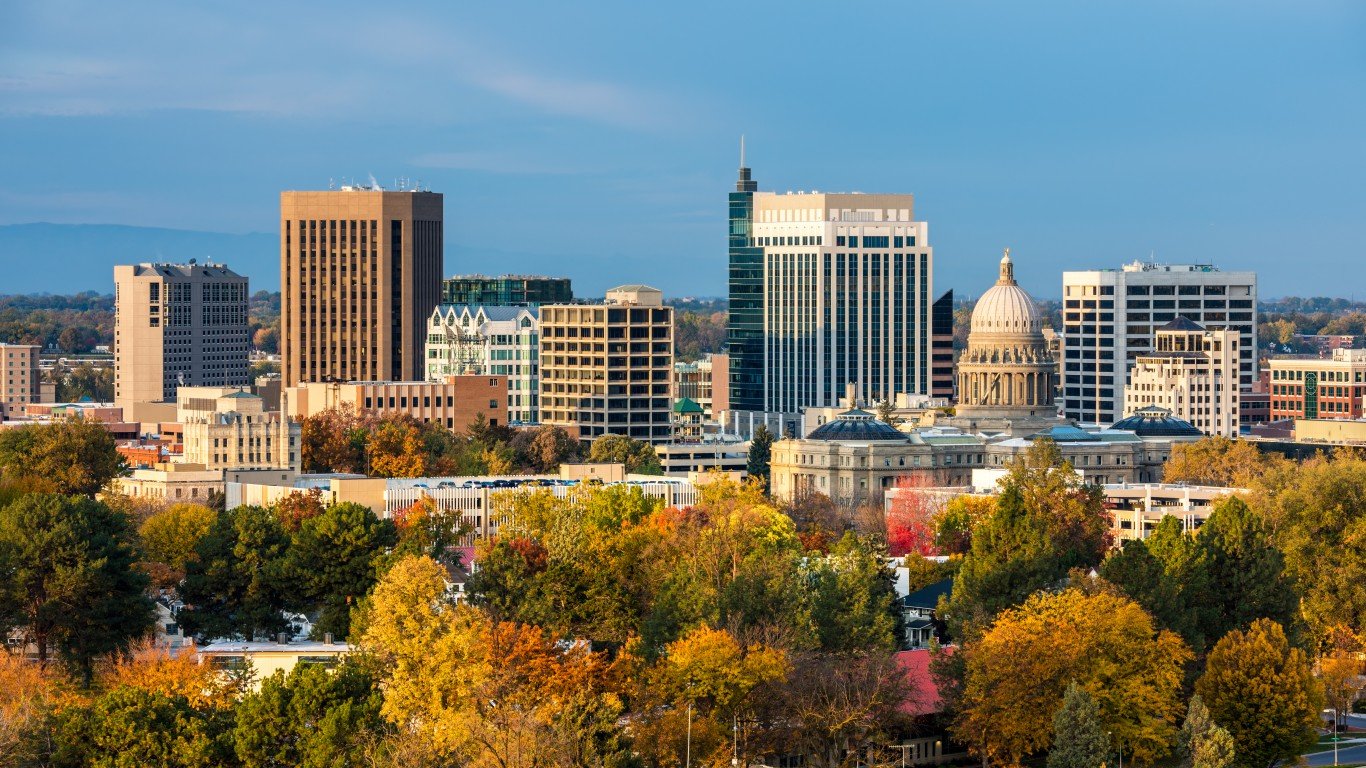
Idaho
> Unemployment claims since mid-March: 140,807 (9th fewest)
> Unemployment claims relative to workforce: 16.2% of workforce (8th lowest)
> Most recent week’s unemployment claims (May 17 – May 23): 4,472 (8th fewest)
> April unemployment rate: 11.5% (18th lowest)
> Change in weekly claims from one year ago: +3,613 (+420.6%)
> Pre-COVID-19 pct. of workers in high-risk industries: 16.1% (16th lowest)
[recirclink id=707007]

Illinois
> Unemployment claims since mid-March: 1,097,354 (11th most)
> Unemployment claims relative to workforce: 17.0% of workforce (11th lowest)
> Most recent week’s unemployment claims (May 17 – May 23): 58,359 (8th most)
> April unemployment rate: 16.4% (7th highest)
> Change in weekly claims from one year ago: +50,693 (+661.3%)
> Pre-COVID-19 pct. of workers in high-risk industries: 18.8% (17th highest)

Indiana
> Unemployment claims since mid-March: 698,623 (16th most)
> Unemployment claims relative to workforce: 20.6% of workforce (25th highest)
> Most recent week’s unemployment claims (May 17 – May 23): 26,278 (23rd most)
> April unemployment rate: 16.9% (5th highest)
> Change in weekly claims from one year ago: +24,373 (+1,279.4%)
> Pre-COVID-19 pct. of workers in high-risk industries: 18.0% (21st highest)
[in-text-ad-2]
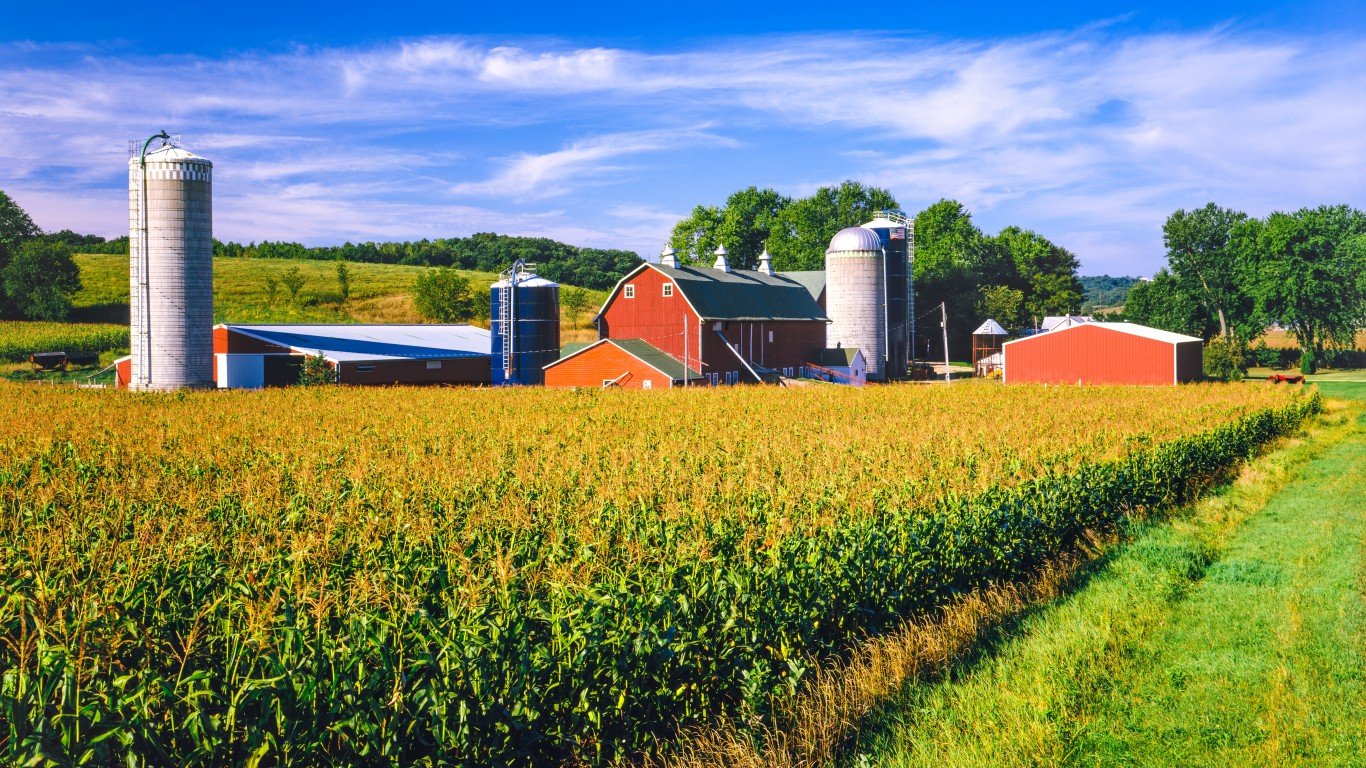
Iowa
> Unemployment claims since mid-March: 325,836 (20th fewest)
> Unemployment claims relative to workforce: 19.0% of workforce (18th lowest)
> Most recent week’s unemployment claims (May 17 – May 23): 14,586 (19th fewest)
> April unemployment rate: 10.2% (11th lowest)
> Change in weekly claims from one year ago: +12,458 (+585.4%)
> Pre-COVID-19 pct. of workers in high-risk industries: 14.9% (3rd lowest)

Kansas
> Unemployment claims since mid-March: 264,520 (18th fewest)
> Unemployment claims relative to workforce: 17.9% of workforce (16th lowest)
> Most recent week’s unemployment claims (May 17 – May 23): 11,614 (18th fewest)
> April unemployment rate: 11.2% (14th lowest)
> Change in weekly claims from one year ago: +9,590 (+473.8%)
> Pre-COVID-19 pct. of workers in high-risk industries: 15.8% (14th lowest)
[in-text-ad]

Kentucky
> Unemployment claims since mid-March: 843,661 (14th most)
> Unemployment claims relative to workforce: 41.0% of workforce (2nd highest)
> Most recent week’s unemployment claims (May 17 – May 23): 53,738 (10th most)
> April unemployment rate: 15.4% (11th highest)
> Change in weekly claims from one year ago: +51,100 (+1,937.1%)
> Pre-COVID-19 pct. of workers in high-risk industries: 19.4% (13th highest)
[recirclink id=706926]

Louisiana
> Unemployment claims since mid-March: 651,756 (18th most)
> Unemployment claims relative to workforce: 31.3% of workforce (5th highest)
> Most recent week’s unemployment claims (May 17 – May 23): 23,853 (23rd fewest)
> April unemployment rate: 14.5% (19th highest)
> Change in weekly claims from one year ago: +21,111 (+769.9%)
> Pre-COVID-19 pct. of workers in high-risk industries: 19.5% (12th highest)

Maine
> Unemployment claims since mid-March: 144,075 (10th fewest)
> Unemployment claims relative to workforce: 21.1% of workforce (23rd highest)
> Most recent week’s unemployment claims (May 17 – May 23): 4,116 (7th fewest)
> April unemployment rate: 10.6% (13th lowest)
> Change in weekly claims from one year ago: +3,640 (+764.7%)
> Pre-COVID-19 pct. of workers in high-risk industries: 15.1% (8th lowest)
[in-text-ad-2]

Maryland
> Unemployment claims since mid-March: 562,381 (22nd most)
> Unemployment claims relative to workforce: 17.4% of workforce (13th lowest)
> Most recent week’s unemployment claims (May 17 – May 23): 33,240 (16th most)
> April unemployment rate: 9.9% (8th lowest)
> Change in weekly claims from one year ago: +30,066 (+947.3%)
> Pre-COVID-19 pct. of workers in high-risk industries: 15.7% (12th lowest)

Massachusetts
> Unemployment claims since mid-March: 902,261 (13th most)
> Unemployment claims relative to workforce: 23.7% of workforce (16th highest)
> Most recent week’s unemployment claims (May 17 – May 23): 37,740 (14th most)
> April unemployment rate: 15.1% (16th highest)
> Change in weekly claims from one year ago: +33,211 (+733.3%)
> Pre-COVID-19 pct. of workers in high-risk industries: 15.0% (6th lowest)
[in-text-ad]

Michigan
> Unemployment claims since mid-March: 1,496,219 (7th most)
> Unemployment claims relative to workforce: 30.3% of workforce (7th highest)
> Most recent week’s unemployment claims (May 17 – May 23): 57,714 (9th most)
> April unemployment rate: 22.7% (2nd highest)
> Change in weekly claims from one year ago: +49,311 (+586.8%)
> Pre-COVID-19 pct. of workers in high-risk industries: 16.4% (17th lowest)
[recirclink id=707807]

Minnesota
> Unemployment claims since mid-March: 688,398 (17th most)
> Unemployment claims relative to workforce: 22.3% of workforce (21st highest)
> Most recent week’s unemployment claims (May 17 – May 23): 28,615 (18th most)
> April unemployment rate: 8.1% (2nd lowest)
> Change in weekly claims from one year ago: +25,923 (+963.0%)
> Pre-COVID-19 pct. of workers in high-risk industries: 14.9% (4th lowest)

Mississippi
> Unemployment claims since mid-March: 292,836 (19th fewest)
> Unemployment claims relative to workforce: 23.1% of workforce (20th highest)
> Most recent week’s unemployment claims (May 17 – May 23): 24,348 (24th fewest)
> April unemployment rate: 15.4% (11th highest)
> Change in weekly claims from one year ago: +22,138 (+1,001.7%)
> Pre-COVID-19 pct. of workers in high-risk industries: 19.1% (16th highest)
[in-text-ad-2]

Missouri
> Unemployment claims since mid-March: 585,931 (20th most)
> Unemployment claims relative to workforce: 19.1% of workforce (19th lowest)
> Most recent week’s unemployment claims (May 17 – May 23): 25,917 (25th most)
> April unemployment rate: 9.7% (7th lowest)
> Change in weekly claims from one year ago: +21,567 (+495.8%)
> Pre-COVID-19 pct. of workers in high-risk industries: 16.6% (19th lowest)

Montana
> Unemployment claims since mid-March: 104,827 (7th fewest)
> Unemployment claims relative to workforce: 19.9% of workforce (25th lowest)
> Most recent week’s unemployment claims (May 17 – May 23): 3,617 (6th fewest)
> April unemployment rate: 11.3% (17th lowest)
> Change in weekly claims from one year ago: +2,838 (+364.3%)
> Pre-COVID-19 pct. of workers in high-risk industries: 19.4% (14th highest)
[in-text-ad]
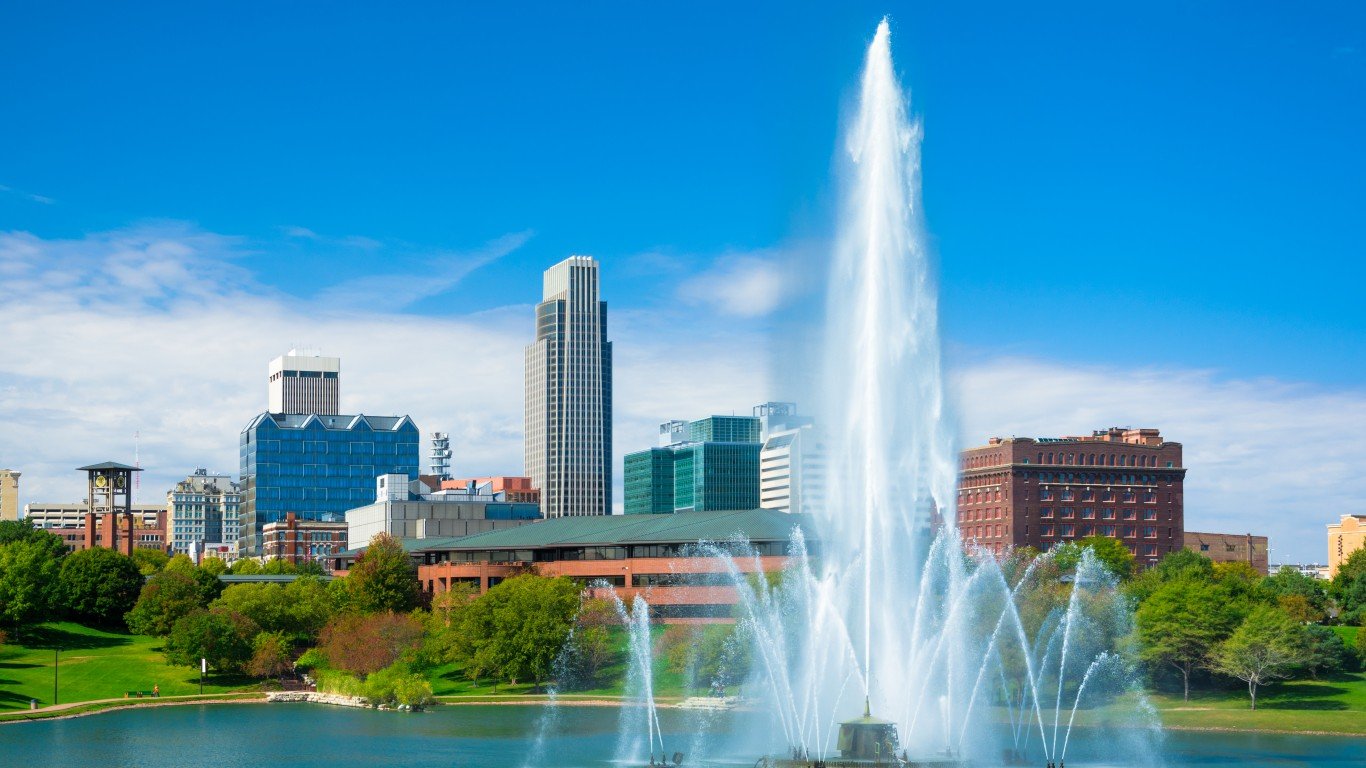
Nebraska
> Unemployment claims since mid-March: 128,821 (8th fewest)
> Unemployment claims relative to workforce: 12.6% of workforce (3rd lowest)
> Most recent week’s unemployment claims (May 17 – May 23): 5,875 (12th fewest)
> April unemployment rate: 8.3% (3rd lowest)
> Change in weekly claims from one year ago: +5,007 (+576.8%)
> Pre-COVID-19 pct. of workers in high-risk industries: 15.7% (11th lowest)
[recirclink id=707752]

Nevada
> Unemployment claims since mid-March: 471,740 (24th fewest)
> Unemployment claims relative to workforce: 30.8% of workforce (6th highest)
> Most recent week’s unemployment claims (May 17 – May 23): 18,102 (22nd fewest)
> April unemployment rate: 28.2% (the highest)
> Change in weekly claims from one year ago: +15,960 (+745.1%)
> Pre-COVID-19 pct. of workers in high-risk industries: 33.5% (the highest)
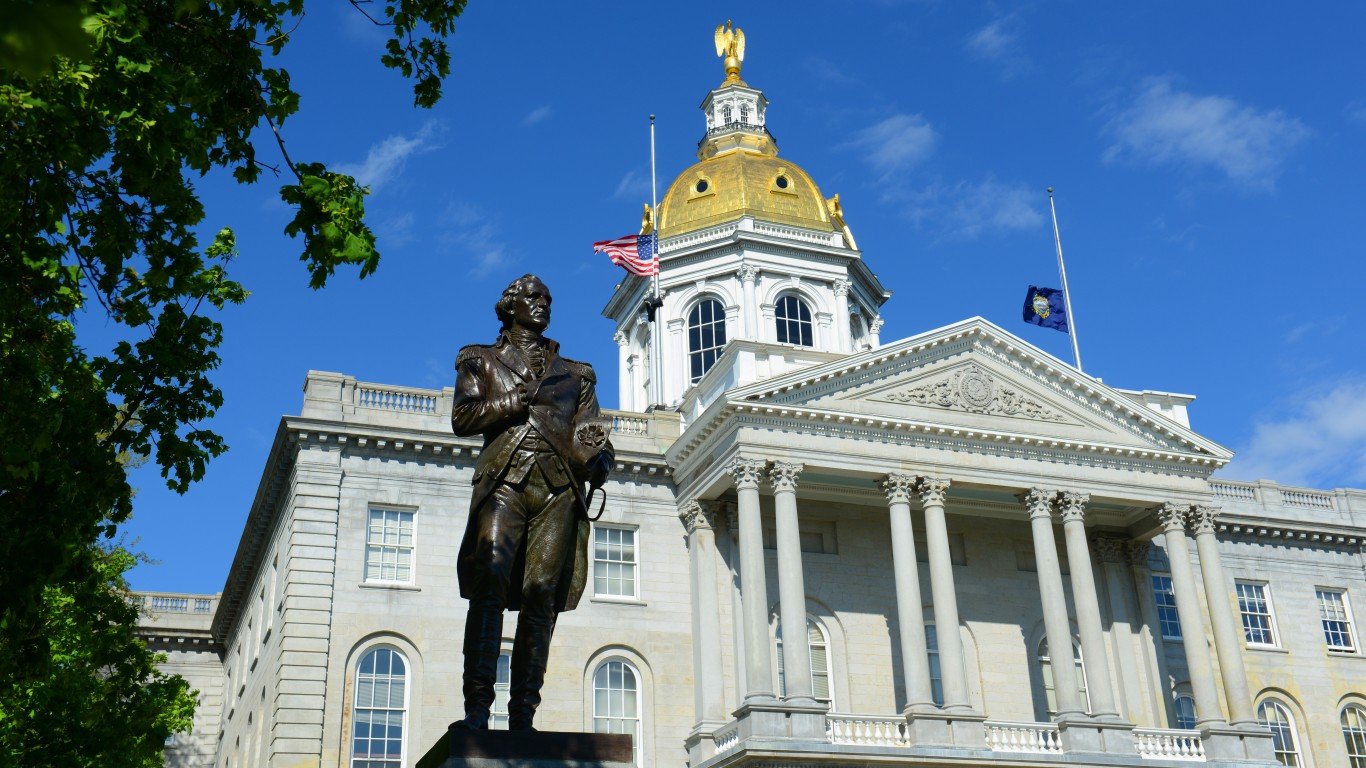
New Hampshire
> Unemployment claims since mid-March: 197,601 (15th fewest)
> Unemployment claims relative to workforce: 25.7% of workforce (12th highest)
> Most recent week’s unemployment claims (May 17 – May 23): 6,973 (13th fewest)
> April unemployment rate: 16.3% (8th highest)
> Change in weekly claims from one year ago: +6,577 (+1,660.9%)
> Pre-COVID-19 pct. of workers in high-risk industries: 15.1% (9th lowest)
[in-text-ad-2]

New Jersey
> Unemployment claims since mid-March: 1,123,237 (10th most)
> Unemployment claims relative to workforce: 25.2% of workforce (14th highest)
> Most recent week’s unemployment claims (May 17 – May 23): 33,290 (15th most)
> April unemployment rate: 15.3% (14th highest)
> Change in weekly claims from one year ago: +25,362 (+319.9%)
> Pre-COVID-19 pct. of workers in high-risk industries: 17.4% (24th highest)

New Mexico
> Unemployment claims since mid-March: 152,962 (12th fewest)
> Unemployment claims relative to workforce: 16.1% of workforce (7th lowest)
> Most recent week’s unemployment claims (May 17 – May 23): 7,347 (14th fewest)
> April unemployment rate: 11.3% (17th lowest)
> Change in weekly claims from one year ago: +6,316 (+612.6%)
> Pre-COVID-19 pct. of workers in high-risk industries: 18.8% (18th highest)
[in-text-ad]

New York
> Unemployment claims since mid-March: 2,420,559 (2nd most)
> Unemployment claims relative to workforce: 25.4% of workforce (13th highest)
> Most recent week’s unemployment claims (May 17 – May 23): 192,193 (2nd most)
> April unemployment rate: 14.5% (19th highest)
> Change in weekly claims from one year ago: +179,444 (+1,407.5%)
> Pre-COVID-19 pct. of workers in high-risk industries: 15.1% (7th lowest)
[recirclink id=707007]

North Carolina
> Unemployment claims since mid-March: 980,705 (12th most)
> Unemployment claims relative to workforce: 19.4% of workforce (21st lowest)
> Most recent week’s unemployment claims (May 17 – May 23): 43,221 (12th most)
> April unemployment rate: 12.2% (21st lowest)
> Change in weekly claims from one year ago: +39,812 (+1,167.8%)
> Pre-COVID-19 pct. of workers in high-risk industries: 17.6% (23rd highest)

North Dakota
> Unemployment claims since mid-March: 70,116 (4th fewest)
> Unemployment claims relative to workforce: 17.6% of workforce (14th lowest)
> Most recent week’s unemployment claims (May 17 – May 23): 3,277 (4th fewest)
> April unemployment rate: 8.5% (4th lowest)
> Change in weekly claims from one year ago: +2,949 (+899.1%)
> Pre-COVID-19 pct. of workers in high-risk industries: 19.8% (8th highest)
[in-text-ad-2]
Ohio
> Unemployment claims since mid-March: 1,261,472 (9th most)
> Unemployment claims relative to workforce: 21.9% of workforce (22nd highest)
> Most recent week’s unemployment claims (May 17 – May 23): 42,363 (13th most)
> April unemployment rate: 16.8% (6th highest)
> Change in weekly claims from one year ago: +35,695 (+535.3%)
> Pre-COVID-19 pct. of workers in high-risk industries: 17.0% (24th lowest)

Oklahoma
> Unemployment claims since mid-March: 476,013 (25th fewest)
> Unemployment claims relative to workforce: 26.0% of workforce (11th highest)
> Most recent week’s unemployment claims (May 17 – May 23): 32,127 (17th most)
> April unemployment rate: 13.7% (24th highest)
> Change in weekly claims from one year ago: +30,405 (+1,765.7%)
> Pre-COVID-19 pct. of workers in high-risk industries: 19.9% (7th highest)
[in-text-ad]

Oregon
> Unemployment claims since mid-March: 412,431 (22nd fewest)
> Unemployment claims relative to workforce: 19.7% of workforce (24th lowest)
> Most recent week’s unemployment claims (May 17 – May 23): 27,514 (20th most)
> April unemployment rate: 14.2% (22nd highest)
> Change in weekly claims from one year ago: +23,863 (+653.6%)
> Pre-COVID-19 pct. of workers in high-risk industries: 16.4% (18th lowest)
[recirclink id=706926]

Pennsylvania
> Unemployment claims since mid-March: 1,920,670 (6th most)
> Unemployment claims relative to workforce: 29.8% of workforce (10th highest)
> Most recent week’s unemployment claims (May 17 – May 23): 69,408 (6th most)
> April unemployment rate: 15.1% (16th highest)
> Change in weekly claims from one year ago: +59,546 (+603.8%)
> Pre-COVID-19 pct. of workers in high-risk industries: 16.7% (20th lowest)

Rhode Island
> Unemployment claims since mid-March: 167,197 (14th fewest)
> Unemployment claims relative to workforce: 30.3% of workforce (8th highest)
> Most recent week’s unemployment claims (May 17 – May 23): 2,920 (3rd fewest)
> April unemployment rate: 17.0% (4th highest)
> Change in weekly claims from one year ago: +2,236 (+326.9%)
> Pre-COVID-19 pct. of workers in high-risk industries: 17.1% (25th highest)
[in-text-ad-2]

South Carolina
> Unemployment claims since mid-March: 549,288 (23rd most)
> Unemployment claims relative to workforce: 23.3% of workforce (18th highest)
> Most recent week’s unemployment claims (May 17 – May 23): 24,950 (25th fewest)
> April unemployment rate: 12.1% (20th lowest)
> Change in weekly claims from one year ago: +22,957 (+1,151.9%)
> Pre-COVID-19 pct. of workers in high-risk industries: 19.6% (10th highest)
South Dakota
> Unemployment claims since mid-March: 50,221 (2nd fewest)
> Unemployment claims relative to workforce: 11.0% of workforce (2nd lowest)
> Most recent week’s unemployment claims (May 17 – May 23): 3,410 (5th fewest)
> April unemployment rate: 10.2% (11th lowest)
> Change in weekly claims from one year ago: +3,130 (+1,117.9%)
> Pre-COVID-19 pct. of workers in high-risk industries: 14.5% (2nd lowest)
[in-text-ad]

Tennessee
> Unemployment claims since mid-March: 545,154 (24th most)
> Unemployment claims relative to workforce: 16.4% of workforce (9th lowest)
> Most recent week’s unemployment claims (May 17 – May 23): 26,041 (24th most)
> April unemployment rate: 14.7% (18th highest)
> Change in weekly claims from one year ago: +23,064 (+774.7%)
> Pre-COVID-19 pct. of workers in high-risk industries: 20.3% (5th highest)
[recirclink id=707807]

Texas
> Unemployment claims since mid-March: 2,203,183 (4th most)
> Unemployment claims relative to workforce: 15.7% of workforce (6th lowest)
> Most recent week’s unemployment claims (May 17 – May 23): 128,105 (5th most)
> April unemployment rate: 12.8% (23rd lowest)
> Change in weekly claims from one year ago: +113,750 (+792.4%)
> Pre-COVID-19 pct. of workers in high-risk industries: 19.6% (11th highest)

Utah
> Unemployment claims since mid-March: 164,539 (13th fewest)
> Unemployment claims relative to workforce: 10.4% of workforce (the lowest)
> Most recent week’s unemployment claims (May 17 – May 23): 5,455 (11th fewest)
> April unemployment rate: 9.7% (7th lowest)
> Change in weekly claims from one year ago: +4,402 (+418.0%)
> Pre-COVID-19 pct. of workers in high-risk industries: 17.0% (25th lowest)
[in-text-ad-2]

Vermont
> Unemployment claims since mid-March: 66,571 (3rd fewest)
> Unemployment claims relative to workforce: 19.4% of workforce (22nd lowest)
> Most recent week’s unemployment claims (May 17 – May 23): 1,480 (the fewest)
> April unemployment rate: 15.6% (9th highest)
> Change in weekly claims from one year ago: +1,050 (+244.2%)
> Pre-COVID-19 pct. of workers in high-risk industries: 15.4% (10th lowest)

Virginia
> Unemployment claims since mid-March: 782,697 (15th most)
> Unemployment claims relative to workforce: 17.9% of workforce (15th lowest)
> Most recent week’s unemployment claims (May 17 – May 23): 58,591 (7th most)
> April unemployment rate: 10.6% (13th lowest)
> Change in weekly claims from one year ago: +56,023 (+2,181.6%)
> Pre-COVID-19 pct. of workers in high-risk industries: 15.7% (13th lowest)
[in-text-ad]

Washington
> Unemployment claims since mid-March: 1,263,521 (8th most)
> Unemployment claims relative to workforce: 32.6% of workforce (4th highest)
> Most recent week’s unemployment claims (May 17 – May 23): 53,280 (11th most)
> April unemployment rate: 15.4% (11th highest)
> Change in weekly claims from one year ago: +47,781 (+868.9%)
> Pre-COVID-19 pct. of workers in high-risk industries: 15.0% (5th lowest)
[recirclink id=707752]

West Virginia
> Unemployment claims since mid-March: 152,626 (11th fewest)
> Unemployment claims relative to workforce: 19.3% of workforce (20th lowest)
> Most recent week’s unemployment claims (May 17 – May 23): 4,762 (9th fewest)
> April unemployment rate: 15.2% (15th highest)
> Change in weekly claims from one year ago: +3,927 (+470.3%)
> Pre-COVID-19 pct. of workers in high-risk industries: 18.2% (20th highest)
Wisconsin
> Unemployment claims since mid-March: 578,857 (21st most)
> Unemployment claims relative to workforce: 18.7% of workforce (17th lowest)
> Most recent week’s unemployment claims (May 17 – May 23): 28,308 (19th most)
> April unemployment rate: 14.1% (23rd highest)
> Change in weekly claims from one year ago: +24,794 (+705.6%)
> Pre-COVID-19 pct. of workers in high-risk industries: 15.8% (15th lowest)
[in-text-ad-2]

Wyoming
> Unemployment claims since mid-March: 39,956 (the fewest)
> Unemployment claims relative to workforce: 13.9% of workforce (5th lowest)
> Most recent week’s unemployment claims (May 17 – May 23): 2,298 (2nd fewest)
> April unemployment rate: 9.2% (5th lowest)
> Change in weekly claims from one year ago: +2,081 (+959.0%)
> Pre-COVID-19 pct. of workers in high-risk industries: 25.5% (3rd highest)
Methodology
To determine the number of unemployment claims in each state, 24/7 Wall St. reviewed the total initial unemployment claims for each week from the week ending March 21, 2020, through the week ending May 23, 2020 — a total of 10 weeks. Unemployment claims figures are not seasonally adjusted and are from the Department of Labor.
To calculate unemployment claims from March 15 through May 23 as a share of each state’s labor force, we used the total unadjusted number of claims over that 10-week period and the total size of the labor force (not seasonally adjusted) as of February 2020 from the Bureau of Labor Statistics Current Employment Statistics.
The identification of high-risk industries comes from a March 2020 paper, “COVID-19: A Fiscal Stimulus Plan,” published by Moody’s Analytics, an economic research company. Employment figures by industry come from the Bureau of Labor Statistics’ Quarterly Census of Employment and Wages and are annual estimates for 2018.
Contact [email protected] for any questions or corrections.