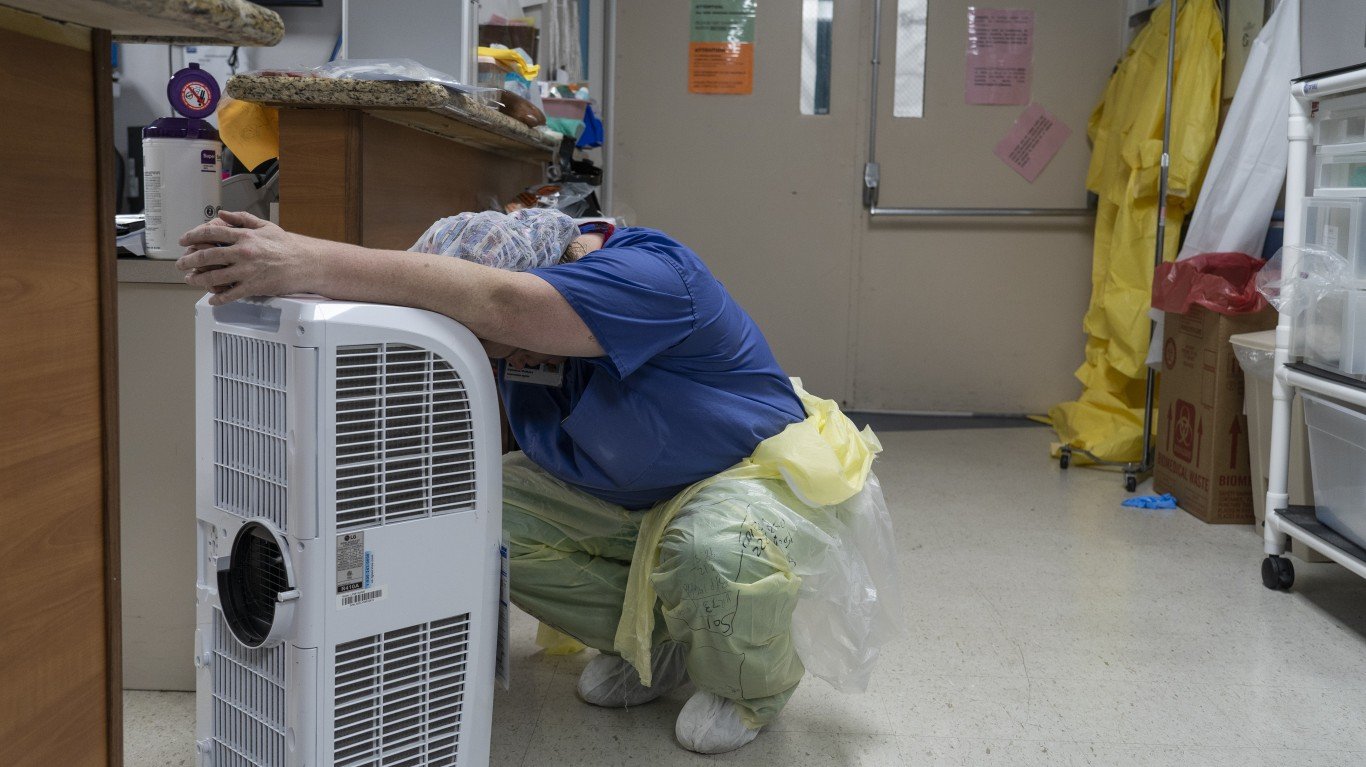
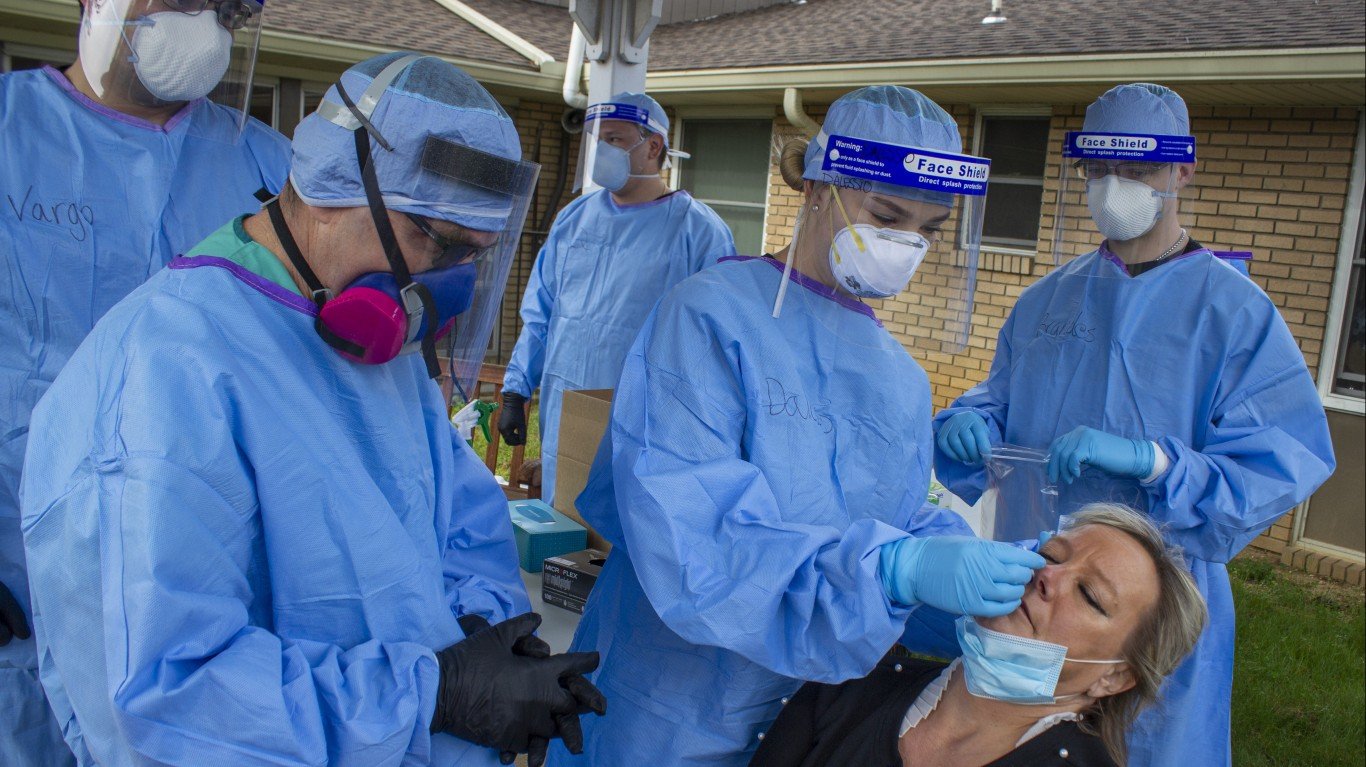
The COVID-19 pandemic has claimed the lives of well over 100,000 Americans. Yet there may be many more deaths from the virus that have gone uncounted. The Centers for Disease Control and Prevention reported that from March 7 to July 4, 151,731 more Americans died than would normally be expected for this time period, based on recent historical mortality data. Of those deaths, 120,300 were confirmed to be related to COVID-19, leaving more than 31,000 excess deaths that are unaccounted for, which may or may not have been related to the coronavirus. This could possibly mean that, in some states, COVID-19 deaths have not been properly classified as COVID-19 deaths.
In 41 states, the number of reported COVID-19 deaths account for more than half of excess deaths since the pandemic. In nine states, the number of COVID-19 deaths comprise less than half of all excess deaths during this time, potentially severely undercounting COVID-19 fatalities.
It is likely that not all unaccounted deaths are directly due to COVID-19, though some may be indirectly related. A Census Bureau survey from June found that 41.5% of U.S. adult respondents said that they had delayed getting medical care because of the COVID-19 pandemic in the last four weeks — whether because they feared contracting the virus or because could not afford treatment after losing their job and employer-based health insurance. In some states, nearly half of all adults postponed care due to COVID-19 concerns. These are the states where the most people delayed getting medical care because of COVID-19 concerns.
Click here to see how COVID-19 deaths continue to be underreported in every state.
Click here for our detailed methodology.

Alabama
> Typical deaths expected, Mar. 1 – Jul. 4, 2020: 18,376
> Observed deaths, Mar. 1 – Jul. 4, 2020: 19,573
> Excess deaths: 1,371 – 23rd most — 7.0% more than expected
> Confirmed COVID-19 deaths: 984 — 71.8% of excess deaths
> Unaccounted for deaths that may be COVID-19 related: 387 — 28.2% of all excess deaths
> Testing rate as of July 15: 11,052 per 100,000 residents – 21st fewest
> Positive test rate as of July 15: 10.8% – 8th highest
> Confirmed COVID-19 cases as of July 15: 1,191 per 100,000 – 15th most
[in-text-ad]

Alaska
> Typical deaths expected, Mar. 1 – Jul. 4, 2020: 1,542
> Observed deaths, Mar. 1 – Jul. 4, 2020: 1,468
> Excess deaths: 43 – 2nd fewest — 2.9% more than expected
> Confirmed COVID-19 deaths: 16 — 37.2% of excess deaths
> Unaccounted for deaths that may be COVID-19 related: 27 — 62.8% of all excess deaths
> Testing rate as of July 15: 21,167 per 100,000 residents – 3rd most
> Positive test rate as of July 15: 1.0% – the lowest
> Confirmed COVID-19 cases as of July 15: 221 per 100,000 – 4th fewest
[recirclink id=723937]

Arizona
> Typical deaths expected, Mar. 1 – Jul. 4, 2020: 21,948
> Observed deaths, Mar. 1 – Jul. 4, 2020: 24,632
> Excess deaths: 2,688 – 17th most — 10.9% more than expected
> Confirmed COVID-19 deaths: 1,788 — 66.5% of excess deaths
> Unaccounted for deaths that may be COVID-19 related: 900 — 33.5% of all excess deaths
> Testing rate as of July 15: 10,251 per 100,000 residents – 16th fewest
> Positive test rate as of July 15: 17.9% – the highest
> Confirmed COVID-19 cases as of July 15: 1,832 per 100,000 – 3rd most

Arkansas
> Typical deaths expected, Mar. 1 – Jul. 4, 2020: 11,034
> Observed deaths, Mar. 1 – Jul. 4, 2020: 11,277
> Excess deaths: 461 – 15th fewest — 4.1% more than expected
> Confirmed COVID-19 deaths: 286 — 62.0% of excess deaths
> Unaccounted for deaths that may be COVID-19 related: 175 — 38.0% of all excess deaths
> Testing rate as of July 15: 13,113 per 100,000 residents – 18th most
> Positive test rate as of July 15: 7.5% – 25th lowest
> Confirmed COVID-19 cases as of July 15: 987 per 100,000 – 19th most
[in-text-ad-2]

California
> Typical deaths expected, Mar. 1 – Jul. 4, 2020: 93,200
> Observed deaths, Mar. 1 – Jul. 4, 2020: 100,081
> Excess deaths: 7,928 – 7th most — 7.9% more than expected
> Confirmed COVID-19 deaths: 6,313 — 79.6% of excess deaths
> Unaccounted for deaths that may be COVID-19 related: 1,615 — 20.4% of all excess deaths
> Testing rate as of July 15: 14,645 per 100,000 residents – 13th most
> Positive test rate as of July 15: 6.0% – 19th lowest
> Confirmed COVID-19 cases as of July 15: 879 per 100,000 – 24th most

Colorado
> Typical deaths expected, Mar. 1 – Jul. 4, 2020: 13,915
> Observed deaths, Mar. 1 – Jul. 4, 2020: 15,877
> Excess deaths: 2,274 – 18th most — 14.3% more than expected
> Confirmed COVID-19 deaths: 1,701 — 74.8% of excess deaths
> Unaccounted for deaths that may be COVID-19 related: 573 — 25.2% of all excess deaths
> Testing rate as of July 15: 7,145 per 100,000 residents – the fewest
> Positive test rate as of July 15: 9.3% – 15th highest
> Confirmed COVID-19 cases as of July 15: 662 per 100,000 – 16th fewest
[in-text-ad]

Connecticut
> Typical deaths expected, Mar. 1 – Jul. 4, 2020: 10,960
> Observed deaths, Mar. 1 – Jul. 4, 2020: 13,173
> Excess deaths: 4,184 – 11th most — 31.8% more than expected
> Confirmed COVID-19 deaths: 4,186 — 100.0% of excess deaths
> Unaccounted for deaths that may be COVID-19 related: 00 — 0.0% of all excess deaths
> Testing rate as of July 15: 16,853 per 100,000 residents – 6th most
> Positive test rate as of July 15: 7.9% – 24th highest
> Confirmed COVID-19 cases as of July 15: 1,333 per 100,000 – 9th most
[recirclink id=723964]

Delaware
> Typical deaths expected, Mar. 1 – Jul. 4, 2020: 3,204
> Observed deaths, Mar. 1 – Jul. 4, 2020: 3,899
> Excess deaths: 778 – 22nd fewest — 20.0% more than expected
> Confirmed COVID-19 deaths: 512 — 65.8% of excess deaths
> Unaccounted for deaths that may be COVID-19 related: 266 — 34.2% of all excess deaths
> Testing rate as of July 15: 14,826 per 100,000 residents – 12th most
> Positive test rate as of July 15: 9.1% – 16th highest
> Confirmed COVID-19 cases as of July 15: 1,349 per 100,000 – 8th most

Florida
> Typical deaths expected, Mar. 1 – Jul. 4, 2020: 73,799
> Observed deaths, Mar. 1 – Jul. 4, 2020: 77,950
> Excess deaths: 4,598 – 9th most — 5.9% more than expected
> Confirmed COVID-19 deaths: 3,702 — 80.5% of excess deaths
> Unaccounted for deaths that may be COVID-19 related: 896 — 19.5% of all excess deaths
> Testing rate as of July 15: 12,860 per 100,000 residents – 19th most
> Positive test rate as of July 15: 11.0% – 6th highest
> Confirmed COVID-19 cases as of July 15: 1,417 per 100,000 – 7th most
[in-text-ad-2]

Georgia
> Typical deaths expected, Mar. 1 – Jul. 4, 2020: 29,837
> Observed deaths, Mar. 1 – Jul. 4, 2020: 32,465
> Excess deaths: 3,130 – 14th most — 9.6% more than expected
> Confirmed COVID-19 deaths: 2,860 — 91.4% of excess deaths
> Unaccounted for deaths that may be COVID-19 related: 270 — 8.6% of all excess deaths
> Testing rate as of July 15: 10,979 per 100,000 residents – 20th fewest
> Positive test rate as of July 15: 11.1% – 4th highest
> Confirmed COVID-19 cases as of July 15: 1,215 per 100,000 – 14th most

Hawaii
> Typical deaths expected, Mar. 1 – Jul. 4, 2020: 4,143
> Observed deaths, Mar. 1 – Jul. 4, 2020: 3,964
> Excess deaths: 30 – the fewest — 0.8% more than expected
> Confirmed COVID-19 deaths: 19 — 63.3% of excess deaths
> Unaccounted for deaths that may be COVID-19 related: 11 — 36.7% of all excess deaths
> Testing rate as of July 15: 8,186 per 100,000 residents – 6th fewest
> Positive test rate as of July 15: 1.1% – 2nd lowest
> Confirmed COVID-19 cases as of July 15: 89 per 100,000 – the fewest
[in-text-ad]

Idaho
> Typical deaths expected, Mar. 1 – Jul. 4, 2020: 5,088
> Observed deaths, Mar. 1 – Jul. 4, 2020: 5,078
> Excess deaths: 153 – 8th fewest — 3.0% more than expected
> Confirmed COVID-19 deaths: 93 — 60.8% of excess deaths
> Unaccounted for deaths that may be COVID-19 related: 60 — 39.2% of all excess deaths
> Testing rate as of July 15: 7,590 per 100,000 residents – 5th fewest
> Positive test rate as of July 15: 8.8% – 18th highest
> Confirmed COVID-19 cases as of July 15: 668 per 100,000 – 18th fewest
[recirclink id=723482]

Illinois
> Typical deaths expected, Mar. 1 – Jul. 4, 2020: 36,083
> Observed deaths, Mar. 1 – Jul. 4, 2020: 45,298
> Excess deaths: 9,223 – 4th most — 20.4% more than expected
> Confirmed COVID-19 deaths: 7,014 — 76.0% of excess deaths
> Unaccounted for deaths that may be COVID-19 related: 2,209 — 24.0% of all excess deaths
> Testing rate as of July 15: 16,322 per 100,000 residents – 9th most
> Positive test rate as of July 15: 7.5% – 25th highest
> Confirmed COVID-19 cases as of July 15: 1,230 per 100,000 – 12th most

Indiana
> Typical deaths expected, Mar. 1 – Jul. 4, 2020: 22,802
> Observed deaths, Mar. 1 – Jul. 4, 2020: 25,694
> Excess deaths: 3,069 – 15th most — 11.9% more than expected
> Confirmed COVID-19 deaths: 2,494 — 81.3% of excess deaths
> Unaccounted for deaths that may be COVID-19 related: 575 — 18.7% of all excess deaths
> Testing rate as of July 15: 8,766 per 100,000 residents – 9th fewest
> Positive test rate as of July 15: 9.1% – 17th highest
> Confirmed COVID-19 cases as of July 15: 798 per 100,000 – 24th fewest
[in-text-ad-2]

Iowa
> Typical deaths expected, Mar. 1 – Jul. 4, 2020: 10,431
> Observed deaths, Mar. 1 – Jul. 4, 2020: 10,810
> Excess deaths: 601 – 19th fewest — 5.6% more than expected
> Confirmed COVID-19 deaths: 721 — 120.0% of excess deaths
> Unaccounted for deaths that may be COVID-19 related: 00 — 0.0% of all excess deaths
> Testing rate as of July 15: 12,191 per 100,000 residents – 23rd most
> Positive test rate as of July 15: 9.4% – 14th highest
> Confirmed COVID-19 cases as of July 15: 1,142 per 100,000 – 16th most

Kansas
> Typical deaths expected, Mar. 1 – Jul. 4, 2020: 9,118
> Observed deaths, Mar. 1 – Jul. 4, 2020: 9,275
> Excess deaths: 315 – 13th fewest — 3.4% more than expected
> Confirmed COVID-19 deaths: 277 — 87.9% of excess deaths
> Unaccounted for deaths that may be COVID-19 related: 38 — 12.1% of all excess deaths
> Testing rate as of July 15: 8,222 per 100,000 residents – 7th fewest
> Positive test rate as of July 15: 8.7% – 19th highest
> Confirmed COVID-19 cases as of July 15: 719 per 100,000 – 19th fewest
[in-text-ad]
Kentucky
> Typical deaths expected, Mar. 1 – Jul. 4, 2020: 16,696
> Observed deaths, Mar. 1 – Jul. 4, 2020: 17,061
> Excess deaths: 713 – 21st fewest — 4.2% more than expected
> Confirmed COVID-19 deaths: 585 — 82.0% of excess deaths
> Unaccounted for deaths that may be COVID-19 related: 128 — 18.0% of all excess deaths
> Testing rate as of July 15: 10,255 per 100,000 residents – 17th fewest
> Positive test rate as of July 15: 4.5% – 11th lowest
> Confirmed COVID-19 cases as of July 15: 463 per 100,000 – 10th fewest
[recirclink id=723425]
Louisiana
> Typical deaths expected, Mar. 1 – Jul. 4, 2020: 15,877
> Observed deaths, Mar. 1 – Jul. 4, 2020: 19,756
> Excess deaths: 3,939 – 12th most — 19.9% more than expected
> Confirmed COVID-19 deaths: 3,170 — 80.5% of excess deaths
> Unaccounted for deaths that may be COVID-19 related: 769 — 19.5% of all excess deaths
> Testing rate as of July 15: 21,485 per 100,000 residents – 2nd most
> Positive test rate as of July 15: 8.4% – 21st highest
> Confirmed COVID-19 cases as of July 15: 1,805 per 100,000 – 4th most

Maine
> Typical deaths expected, Mar. 1 – Jul. 4, 2020: 5,167
> Observed deaths, Mar. 1 – Jul. 4, 2020: 5,146
> Excess deaths: 105 – 5th fewest — 2.0% more than expected
> Confirmed COVID-19 deaths: 105 — 100.0% of excess deaths
> Unaccounted for deaths that may be COVID-19 related: 00 — 0.0% of all excess deaths
> Testing rate as of July 15: 9,516 per 100,000 residents – 12th fewest
> Positive test rate as of July 15: 2.8% – 6th lowest
> Confirmed COVID-19 cases as of July 15: 267 per 100,000 – 6th fewest
[in-text-ad-2]

Maryland
> Typical deaths expected, Mar. 1 – Jul. 4, 2020: 17,297
> Observed deaths, Mar. 1 – Jul. 4, 2020: 21,680
> Excess deaths: 4,538 – 10th most — 20.9% more than expected
> Confirmed COVID-19 deaths: 3,236 — 71.3% of excess deaths
> Unaccounted for deaths that may be COVID-19 related: 1,302 — 28.7% of all excess deaths
> Testing rate as of July 15: 11,255 per 100,000 residents – 22nd fewest
> Positive test rate as of July 15: 11.0% – 5th highest
> Confirmed COVID-19 cases as of July 15: 1,241 per 100,000 – 11th most

Massachusetts
> Typical deaths expected, Mar. 1 – Jul. 4, 2020: 20,493
> Observed deaths, Mar. 1 – Jul. 4, 2020: 28,217
> Excess deaths: 8,080 – 6th most — 28.6% more than expected
> Confirmed COVID-19 deaths: 8,172 — 101.1% of excess deaths
> Unaccounted for deaths that may be COVID-19 related: 00 — 0.0% of all excess deaths
> Testing rate as of July 15: 14,235 per 100,000 residents – 14th most
> Positive test rate as of July 15: 11.4% – 3rd highest
> Confirmed COVID-19 cases as of July 15: 1,628 per 100,000 – 6th most
[in-text-ad]

Michigan
> Typical deaths expected, Mar. 1 – Jul. 4, 2020: 33,733
> Observed deaths, Mar. 1 – Jul. 4, 2020: 42,291
> Excess deaths: 8,626 – 5th most — 20.4% more than expected
> Confirmed COVID-19 deaths: 6,212 — 72.0% of excess deaths
> Unaccounted for deaths that may be COVID-19 related: 2,414 — 28.0% of all excess deaths
> Testing rate as of July 15: 13,881 per 100,000 residents – 16th most
> Positive test rate as of July 15: 5.7% – 16th lowest
> Confirmed COVID-19 cases as of July 15: 789 per 100,000 – 23rd fewest
[recirclink id=723209]

Minnesota
> Typical deaths expected, Mar. 1 – Jul. 4, 2020: 15,490
> Observed deaths, Mar. 1 – Jul. 4, 2020: 16,624
> Excess deaths: 1,557 – 21st most — 9.4% more than expected
> Confirmed COVID-19 deaths: 1,466 — 94.2% of excess deaths
> Unaccounted for deaths that may be COVID-19 related: 91 — 5.8% of all excess deaths
> Testing rate as of July 15: 14,088 per 100,000 residents – 15th most
> Positive test rate as of July 15: 5.5% – 15th lowest
> Confirmed COVID-19 cases as of July 15: 780 per 100,000 – 22nd fewest

Mississippi
> Typical deaths expected, Mar. 1 – Jul. 4, 2020: 10,996
> Observed deaths, Mar. 1 – Jul. 4, 2020: 12,824
> Excess deaths: 1,862 – 19th most — 14.5% more than expected
> Confirmed COVID-19 deaths: 1,107 — 59.5% of excess deaths
> Unaccounted for deaths that may be COVID-19 related: 755 — 40.5% of all excess deaths
> Testing rate as of July 15: 11,937 per 100,000 residents – 24th most
> Positive test rate as of July 15: 10.8% – 7th highest
> Confirmed COVID-19 cases as of July 15: 1,291 per 100,000 – 10th most
[in-text-ad-2]

Missouri
> Typical deaths expected, Mar. 1 – Jul. 4, 2020: 22,357
> Observed deaths, Mar. 1 – Jul. 4, 2020: 23,230
> Excess deaths: 1,277 – 24th most — 5.5% more than expected
> Confirmed COVID-19 deaths: 1,027 — 80.4% of excess deaths
> Unaccounted for deaths that may be COVID-19 related: 250 — 19.6% of all excess deaths
> Testing rate as of July 15: 8,454 per 100,000 residents – 8th fewest
> Positive test rate as of July 15: 5.7% – 17th lowest
> Confirmed COVID-19 cases as of July 15: 485 per 100,000 – 11th fewest
Montana
> Typical deaths expected, Mar. 1 – Jul. 4, 2020: 3,535
> Observed deaths, Mar. 1 – Jul. 4, 2020: 3,533
> Excess deaths: 135 – 7th fewest — 3.8% more than expected
> Confirmed COVID-19 deaths: 23 — 17.0% of excess deaths
> Unaccounted for deaths that may be COVID-19 related: 112 — 83.0% of all excess deaths
> Testing rate as of July 15: 11,650 per 100,000 residents – 24th fewest
> Positive test rate as of July 15: 1.7% – 4th lowest
> Confirmed COVID-19 cases as of July 15: 197 per 100,000 – 2nd fewest
[in-text-ad]

Nebraska
> Typical deaths expected, Mar. 1 – Jul. 4, 2020: 5,887
> Observed deaths, Mar. 1 – Jul. 4, 2020: 6,035
> Excess deaths: 310 – 12th fewest — 5.1% more than expected
> Confirmed COVID-19 deaths: 284 — 91.6% of excess deaths
> Unaccounted for deaths that may be COVID-19 related: 26 — 8.4% of all excess deaths
> Testing rate as of July 15: 11,403 per 100,000 residents – 23rd fewest
> Positive test rate as of July 15: 9.9% – 13th highest
> Confirmed COVID-19 cases as of July 15: 1,126 per 100,000 – 17th most
[recirclink id=723937]

Nevada
> Typical deaths expected, Mar. 1 – Jul. 4, 2020: 9,253
> Observed deaths, Mar. 1 – Jul. 4, 2020: 9,420
> Excess deaths: 463 – 16th fewest — 4.9% more than expected
> Confirmed COVID-19 deaths: 528 — 114.0% of excess deaths
> Unaccounted for deaths that may be COVID-19 related: 00 — 0.0% of all excess deaths
> Testing rate as of July 15: 14,908 per 100,000 residents – 11th most
> Positive test rate as of July 15: 6.5% – 22nd lowest
> Confirmed COVID-19 cases as of July 15: 976 per 100,000 – 22nd most

New Hampshire
> Typical deaths expected, Mar. 1 – Jul. 4, 2020: 4,223
> Observed deaths, Mar. 1 – Jul. 4, 2020: 4,730
> Excess deaths: 522 – 18th fewest — 11.0% more than expected
> Confirmed COVID-19 deaths: 376 — 72.0% of excess deaths
> Unaccounted for deaths that may be COVID-19 related: 146 — 28.0% of all excess deaths
> Testing rate as of July 15: 10,194 per 100,000 residents – 15th fewest
> Positive test rate as of July 15: 4.4% – 10th lowest
> Confirmed COVID-19 cases as of July 15: 451 per 100,000 – 9th fewest
[in-text-ad-2]

New Jersey
> Typical deaths expected, Mar. 1 – Jul. 4, 2020: 25,397
> Observed deaths, Mar. 1 – Jul. 4, 2020: 42,762
> Excess deaths: 17,528 – 2nd most — 41.0% more than expected
> Confirmed COVID-19 deaths: 15,189 — 86.7% of excess deaths
> Unaccounted for deaths that may be COVID-19 related: 2,339 — 13.3% of all excess deaths
> Testing rate as of July 15: 19,558 per 100,000 residents – 5th most
> Positive test rate as of July 15: 10.1% – 10th highest
> Confirmed COVID-19 cases as of July 15: 1,979 per 100,000 – 2nd most

New Mexico
> Typical deaths expected, Mar. 1 – Jul. 4, 2020: 6,684
> Observed deaths, Mar. 1 – Jul. 4, 2020: 7,284
> Excess deaths: 686 – 20th fewest — 9.4% more than expected
> Confirmed COVID-19 deaths: 513 — 74.8% of excess deaths
> Unaccounted for deaths that may be COVID-19 related: 173 — 25.2% of all excess deaths
> Testing rate as of July 15: 20,855 per 100,000 residents – 4th most
> Positive test rate as of July 15: 3.6% – 8th lowest
> Confirmed COVID-19 cases as of July 15: 756 per 100,000 – 20th fewest
[in-text-ad]

New York
> Typical deaths expected, Mar. 1 – Jul. 4, 2020: 134,436
> Observed deaths, Mar. 1 – Jul. 4, 2020: 179,786
> Excess deaths: 63,355 – the most — 35.2% more than expected
> Confirmed COVID-19 deaths: 24,885 — 39.3% of excess deaths
> Unaccounted for deaths that may be COVID-19 related: 38,470 — 60.7% of all excess deaths
> Testing rate as of July 15: 24,811 per 100,000 residents – the most
> Positive test rate as of July 15: 8.3% – 22nd highest
> Confirmed COVID-19 cases as of July 15: 2,067 per 100,000 – the most
[recirclink id=723964]

North Carolina
> Typical deaths expected, Mar. 1 – Jul. 4, 2020: 31,824
> Observed deaths, Mar. 1 – Jul. 4, 2020: 25,592
> Excess deaths: 1,455 – 22nd most — 5.7% more than expected
> Confirmed COVID-19 deaths: 877 — 60.3% of excess deaths
> Unaccounted for deaths that may be COVID-19 related: 578 — 39.7% of all excess deaths
> Testing rate as of July 15: 12,372 per 100,000 residents – 22nd most
> Positive test rate as of July 15: 7.1% – 23rd lowest
> Confirmed COVID-19 cases as of July 15: 879 per 100,000 – 23rd most
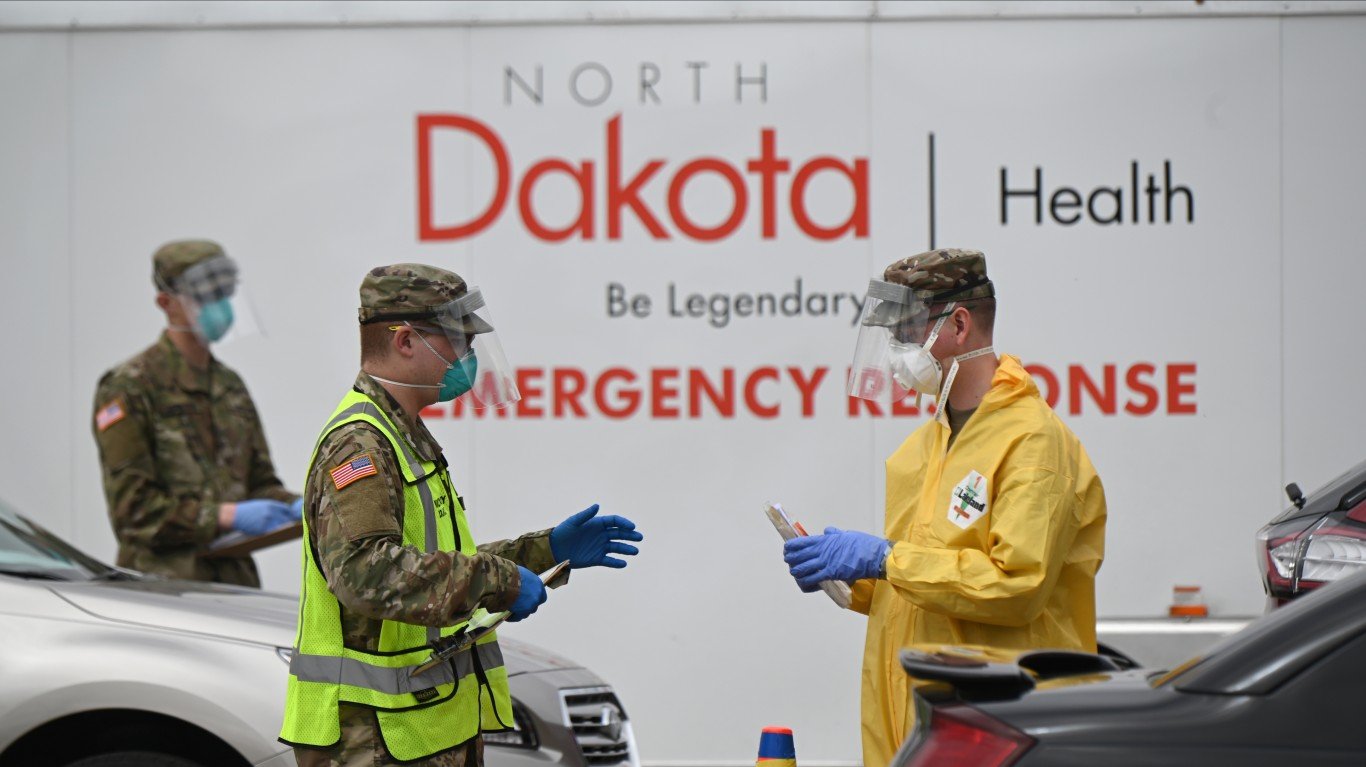
North Dakota
> Typical deaths expected, Mar. 1 – Jul. 4, 2020: 2,559
> Observed deaths, Mar. 1 – Jul. 4, 2020: 2,477
> Excess deaths: 93 – 4th fewest — 3.8% more than expected
> Confirmed COVID-19 deaths: 80 — 86.0% of excess deaths
> Unaccounted for deaths that may be COVID-19 related: 13 — 14.0% of all excess deaths
> Testing rate as of July 15: 16,651 per 100,000 residents – 7th most
> Positive test rate as of July 15: 3.6% – 7th lowest
> Confirmed COVID-19 cases as of July 15: 601 per 100,000 – 15th fewest
[in-text-ad-2]

Ohio
> Typical deaths expected, Mar. 1 – Jul. 4, 2020: 42,703
> Observed deaths, Mar. 1 – Jul. 4, 2020: 45,785
> Excess deaths: 3,201 – 13th most — 7.0% more than expected
> Confirmed COVID-19 deaths: 2,907 — 90.8% of excess deaths
> Unaccounted for deaths that may be COVID-19 related: 294 — 9.2% of all excess deaths
> Testing rate as of July 15: 9,280 per 100,000 residents – 11th fewest
> Positive test rate as of July 15: 6.4% – 21st lowest
> Confirmed COVID-19 cases as of July 15: 593 per 100,000 – 14th fewest

Oklahoma
> Typical deaths expected, Mar. 1 – Jul. 4, 2020: 13,617
> Observed deaths, Mar. 1 – Jul. 4, 2020: 13,552
> Excess deaths: 369 – 14th fewest — 2.7% more than expected
> Confirmed COVID-19 deaths: 398 — 107.9% of excess deaths
> Unaccounted for deaths that may be COVID-19 related: 00 — 0.0% of all excess deaths
> Testing rate as of July 15: 11,672 per 100,000 residents – 25th fewest
> Positive test rate as of July 15: 5.0% – 13th lowest
> Confirmed COVID-19 cases as of July 15: 579 per 100,000 – 13th fewest
[in-text-ad]

Oregon
> Typical deaths expected, Mar. 1 – Jul. 4, 2020: 12,811
> Observed deaths, Mar. 1 – Jul. 4, 2020: 12,769
> Excess deaths: 475 – 17th fewest — 3.7% more than expected
> Confirmed COVID-19 deaths: 00 — 0.0% of excess deaths
> Unaccounted for deaths that may be COVID-19 related: 475 — 100.0% of all excess deaths
> Testing rate as of July 15: 7,424 per 100,000 residents – 3rd fewest
> Positive test rate as of July 15: 4.2% – 9th lowest
> Confirmed COVID-19 cases as of July 15: 312 per 100,000 – 7th fewest
[recirclink id=723482]
Pennsylvania
> Typical deaths expected, Mar. 1 – Jul. 4, 2020: 45,877
> Observed deaths, Mar. 1 – Jul. 4, 2020: 55,887
> Excess deaths: 11,862 – 3rd most — 21.2% more than expected
> Confirmed COVID-19 deaths: 6,749 — 56.9% of excess deaths
> Unaccounted for deaths that may be COVID-19 related: 5,113 — 43.1% of all excess deaths
> Testing rate as of July 15: 7,563 per 100,000 residents – 4th fewest
> Positive test rate as of July 15: 10.1% – 11th highest
> Confirmed COVID-19 cases as of July 15: 763 per 100,000 – 21st fewest
Rhode Island
> Typical deaths expected, Mar. 1 – Jul. 4, 2020: 3,695
> Observed deaths, Mar. 1 – Jul. 4, 2020: 4,273
> Excess deaths: 851 – 23rd fewest — 19.9% more than expected
> Confirmed COVID-19 deaths: 950 — 111.6% of excess deaths
> Unaccounted for deaths that may be COVID-19 related: 00 — 0.0% of all excess deaths
> Testing rate as of July 15: 16,634 per 100,000 residents – 8th most
> Positive test rate as of July 15: 10.0% – 12th highest
> Confirmed COVID-19 cases as of July 15: 1,668 per 100,000 – 5th most
[in-text-ad-2]

South Carolina
> Typical deaths expected, Mar. 1 – Jul. 4, 2020: 17,407
> Observed deaths, Mar. 1 – Jul. 4, 2020: 19,033
> Excess deaths: 1,635 – 20th most — 8.6% more than expected
> Confirmed COVID-19 deaths: 813 — 49.7% of excess deaths
> Unaccounted for deaths that may be COVID-19 related: 822 — 50.3% of all excess deaths
> Testing rate as of July 15: 10,346 per 100,000 residents – 18th fewest
> Positive test rate as of July 15: 11.8% – 2nd highest
> Confirmed COVID-19 cases as of July 15: 1,224 per 100,000 – 13th most

South Dakota
> Typical deaths expected, Mar. 1 – Jul. 4, 2020: 2,871
> Observed deaths, Mar. 1 – Jul. 4, 2020: 2,830
> Excess deaths: 92 – 3rd fewest — 3.3% more than expected
> Confirmed COVID-19 deaths: 97 — 105.4% of excess deaths
> Unaccounted for deaths that may be COVID-19 related: 00 — 0.0% of all excess deaths
> Testing rate as of July 15: 10,603 per 100,000 residents – 19th fewest
> Positive test rate as of July 15: 8.2% – 23rd highest
> Confirmed COVID-19 cases as of July 15: 867 per 100,000 – 25th most
[in-text-ad]

Tennessee
> Typical deaths expected, Mar. 1 – Jul. 4, 2020: 26,261
> Observed deaths, Mar. 1 – Jul. 4, 2020: 26,873
> Excess deaths: 974 – 24th fewest — 3.6% more than expected
> Confirmed COVID-19 deaths: 633 — 65.0% of excess deaths
> Unaccounted for deaths that may be COVID-19 related: 341 — 35.0% of all excess deaths
> Testing rate as of July 15: 16,205 per 100,000 residents – 10th most
> Positive test rate as of July 15: 6.3% – 20th lowest
> Confirmed COVID-19 cases as of July 15: 1,020 per 100,000 – 18th most
[recirclink id=723425]

Texas
> Typical deaths expected, Mar. 1 – Jul. 4, 2020: 71,058
> Observed deaths, Mar. 1 – Jul. 4, 2020: 76,155
> Excess deaths: 5,288 – 8th most — 6.9% more than expected
> Confirmed COVID-19 deaths: 2,608 — 49.3% of excess deaths
> Unaccounted for deaths that may be COVID-19 related: 2,680 — 50.7% of all excess deaths
> Testing rate as of July 15: 9,206 per 100,000 residents – 10th fewest
> Positive test rate as of July 15: 10.7% – 9th highest
> Confirmed COVID-19 cases as of July 15: 984 per 100,000 – 20th most

Utah
> Typical deaths expected, Mar. 1 – Jul. 4, 2020: 6,821
> Observed deaths, Mar. 1 – Jul. 4, 2020: 7,086
> Excess deaths: 292 – 10th fewest — 4.1% more than expected
> Confirmed COVID-19 deaths: 181 — 62.0% of excess deaths
> Unaccounted for deaths that may be COVID-19 related: 111 — 38.0% of all excess deaths
> Testing rate as of July 15: 13,669 per 100,000 residents – 17th most
> Positive test rate as of July 15: 7.1% – 24th lowest
> Confirmed COVID-19 cases as of July 15: 977 per 100,000 – 21st most
[in-text-ad-2]

Vermont
> Typical deaths expected, Mar. 1 – Jul. 4, 2020: 1,937
> Observed deaths, Mar. 1 – Jul. 4, 2020: 2,223
> Excess deaths: 304 – 11th fewest — 13.7% more than expected
> Confirmed COVID-19 deaths: 56 — 18.4% of excess deaths
> Unaccounted for deaths that may be COVID-19 related: 248 — 81.6% of all excess deaths
> Testing rate as of July 15: 12,511 per 100,000 residents – 20th most
> Positive test rate as of July 15: 1.7% – 3rd lowest
> Confirmed COVID-19 cases as of July 15: 210 per 100,000 – 3rd fewest

Virginia
> Typical deaths expected, Mar. 1 – Jul. 4, 2020: 24,165
> Observed deaths, Mar. 1 – Jul. 4, 2020: 26,612
> Excess deaths: 2,706 – 16th most — 10.2% more than expected
> Confirmed COVID-19 deaths: 1,849 — 68.3% of excess deaths
> Unaccounted for deaths that may be COVID-19 related: 857 — 31.7% of all excess deaths
> Testing rate as of July 15: 9,887 per 100,000 residents – 14th fewest
> Positive test rate as of July 15: 8.7% – 20th highest
> Confirmed COVID-19 cases as of July 15: 863 per 100,000 – 25th fewest
[in-text-ad]

Washington
> Typical deaths expected, Mar. 1 – Jul. 4, 2020: 20,276
> Observed deaths, Mar. 1 – Jul. 4, 2020: 20,968
> Excess deaths: 1,008 – 25th fewest — 4.8% more than expected
> Confirmed COVID-19 deaths: 1,349 — 133.8% of excess deaths
> Unaccounted for deaths that may be COVID-19 related: 00 — 0.0% of all excess deaths
> Testing rate as of July 15: 9,531 per 100,000 residents – 13th fewest
> Positive test rate as of July 15: 5.9% – 18th lowest
> Confirmed COVID-19 cases as of July 15: 561 per 100,000 – 12th fewest
[recirclink id=723209]

West Virginia
> Typical deaths expected, Mar. 1 – Jul. 4, 2020: 7,935
> Observed deaths, Mar. 1 – Jul. 4, 2020: 6,630
> Excess deaths: 226 – 9th fewest — 3.4% more than expected
> Confirmed COVID-19 deaths: 93 — 41.2% of excess deaths
> Unaccounted for deaths that may be COVID-19 related: 133 — 58.8% of all excess deaths
> Testing rate as of July 15: 11,931 per 100,000 residents – 25th most
> Positive test rate as of July 15: 2.1% – 5th lowest
> Confirmed COVID-19 cases as of July 15: 247 per 100,000 – 5th fewest

Wisconsin
> Typical deaths expected, Mar. 1 – Jul. 4, 2020: 18,687
> Observed deaths, Mar. 1 – Jul. 4, 2020: 19,519
> Excess deaths: 1,061 – 25th most — 5.4% more than expected
> Confirmed COVID-19 deaths: 796 — 75.0% of excess deaths
> Unaccounted for deaths that may be COVID-19 related: 265 — 25.0% of all excess deaths
> Testing rate as of July 15: 12,471 per 100,000 residents – 21st most
> Positive test rate as of July 15: 5.3% – 14th lowest
> Confirmed COVID-19 cases as of July 15: 666 per 100,000 – 17th fewest
[in-text-ad-2]

Wyoming
> Typical deaths expected, Mar. 1 – Jul. 4, 2020: 1,662
> Observed deaths, Mar. 1 – Jul. 4, 2020: 1,686
> Excess deaths: 114 – 6th fewest — 6.8% more than expected
> Confirmed COVID-19 deaths: 20 — 17.5% of excess deaths
> Unaccounted for deaths that may be COVID-19 related: 94 — 82.5% of all excess deaths
> Testing rate as of July 15: 7,362 per 100,000 residents – 2nd fewest
> Positive test rate as of July 15: 4.6% – 12th lowest
> Confirmed COVID-19 cases as of July 15: 338 per 100,000 – 8th fewest
Methodology
To determine how COVID-19 is being underreported in every state, 24/7 Wall St. calculated the total number of reported COVID-19 deaths as a percentage of excess deaths from all causes using data from the Centers for Disease Control and Prevention. The CDC uses historical data from 2013 to the present to estimate excess deaths, which represent the difference between the observed number of deaths in a given week and the expected number of deaths for that week based on CDC projections. The CDC weighs data on observed deaths to account for reporting lags and potential underreporting of deaths from all causes by jurisdiction.
24/7 Wall St. reviewed the number of excess deaths that occurred from March 1 to July 4, 2020, in each state and compared it to the state’s reported number of COVID-19 deaths over the same period. Assuming that every COVID-19 death in 2020 is an unexpected excess death, we considered the difference between excess deaths and reported COVID-19 deaths to be unaccounted for deaths and the potential result of underreporting of COVID-19-related deaths. Due to data limitations, we looked at the period March 1, 2020, to May 30, 2020, for North Carolina; March 1, 2020, to June 13, 2020, for Connecticut; and March 1, 2020, to June 27, 2020, for Rhode Island.
Data on reported COVID-19 deaths, as well as positive, negative, and total test counts as of July 15, 2020, came from various state and local health departments and were adjusted for population using data from the Census Bureau’s 2018 American Community Survey. Data on land area by state used to calculate population density also came from the Census Bureau.
Contact [email protected] for any questions or corrections.