
The U.S. reported a record 500,000 new cases in a single week in late October, and now a number of European countries have started to reintroduce lockdowns or other restrictions. Over 8.3 million COVID-19 infections have been reported in the United States so far, equivalent to more than one in every 50 Americans. And with the majority of U.S. states reporting record highs in new cases in October, all signs point to the coronavirus pandemic continuing to disrupt American way of life for some time to come.
While cases are rising in most parts of the country, the extent of the spread of the novel coronavirus continues to vary considerably from state to state, and even from county to county.
Using data from state and local health departments, 24/7 Wall St. compiled and reviewed the average of daily new confirmed COVID-19 cases for the week ending Oct. 26 and compared it to the previous week to determine the county in each state where the virus is spreading the fastest, adjusted for the population. Every state has at least one county or county equivalent in which cases have been reported at a growing rate. We excluded counties with populations of fewer than 5,000 people, as well as those with fewer than 20 reported new cases in the past 14 days.
While all counties on the list are those where the virus is spreading the fastest in their respective states, the virus is spreading much faster in some of them compared to others. Fifteen states reported an increase of over 50 average daily new cases per 100,000 residents in the week ending Oct. 26 as compared to the week ending Oct. 19. Meanwhile, in a dozen states, the county with the fastest spread reported a week-over-week increase of 10 or fewer new daily cases, on average. Nationwide, for comparison, the average daily new cases increased by about 3 per 100,000. These are the states where the spread of the virus is slowing, and where it is getting worse.
As has been the case throughout the pandemic, some of the worst hotspots are tied to residential facilities such as prisons and assisted living facilities. For instance, in Norton County, Kansas, an outbreak at a nursing home in October resulted in infections among the majority of the staff as well as all of the dozens of residents there. Norton County reported the highest seven-day average of new weekly cases per capita as well as the second highest increase of any country.
Click here to see places in every state where COVID-19 is growing the fastest right now.
Alabama: Washington County
> Change in daily avg. new COVID-19 cases, week over week: +50 per 100,000 people
> Avg. new daily cases in Washington County in 7 days ending Oct. 26: 68 per 100,000
> Avg. new daily cases in Washington County in 7 days ending Oct. 19: 18 per 100,000
> Avg. new daily cases in Alabama in 7 days ending Oct. 26: 29 per 100,000 (18th most)
> Cumulative confirmed COVID-19 cases in Washington County as of Oct. 26: 4,500 per 100,000 people (total: 749)
> Population: 16,643
> Largest place in Washington County: Chatom
[in-text-ad]

Alaska: Bethel Census Area
> Change in daily avg. new COVID-19 cases, week over week: +33 per 100,000 people
> Avg. new daily cases in Bethel Census Area in 7 days ending Oct. 26: 84 per 100,000
> Avg. new daily cases in Bethel Census Area in 7 days ending Oct. 19: 50 per 100,000
> Avg. new daily cases in Alaska in 7 days ending Oct. 26: 33 per 100,000 (11th most)
> Cumulative confirmed COVID-19 cases in Bethel Census Area as of Oct. 26: 2,162 per 100,000 people (total: 390)
> Population: 18,040
> Largest place in Bethel Census Area: Bethel
[recirclink id=803449]

Arizona: Greenlee County
> Change in daily avg. new COVID-19 cases, week over week: +24 per 100,000 people
> Avg. new daily cases in Greenlee County in 7 days ending Oct. 26: 36 per 100,000
> Avg. new daily cases in Greenlee County in 7 days ending Oct. 19: 12 per 100,000
> Avg. new daily cases in Arizona in 7 days ending Oct. 26: 13 per 100,000 (15th fewest)
> Cumulative confirmed COVID-19 cases in Greenlee County as of Oct. 26: 1,073 per 100,000 people (total: 102)
> Population: 9,504
> Largest place in Greenlee County: Clifton

Arkansas: Izard County
> Change in daily avg. new COVID-19 cases, week over week: +96 per 100,000 people
> Avg. new daily cases in Izard County in 7 days ending Oct. 26: 169 per 100,000
> Avg. new daily cases in Izard County in 7 days ending Oct. 19: 73 per 100,000
> Avg. new daily cases in Arkansas in 7 days ending Oct. 26: 32 per 100,000 (15th most)
> Cumulative confirmed COVID-19 cases in Izard County as of Oct. 26: 4,373 per 100,000 people (total: 593)
> Population: 13,559
> Largest place in Izard County: Horseshoe Bend
[in-text-ad-2]
California: Tehama County
> Change in daily avg. new COVID-19 cases, week over week: +10 per 100,000 people
> Avg. new daily cases in Tehama County in 7 days ending Oct. 26: 23 per 100,000
> Avg. new daily cases in Tehama County in 7 days ending Oct. 19: 14 per 100,000
> Avg. new daily cases in California in 7 days ending Oct. 26: 9 per 100,000 (8th fewest)
> Cumulative confirmed COVID-19 cases in Tehama County as of Oct. 26: 1,389 per 100,000 people (total: 880)
> Population: 63,373
> Largest place in Tehama County: Red Bluff
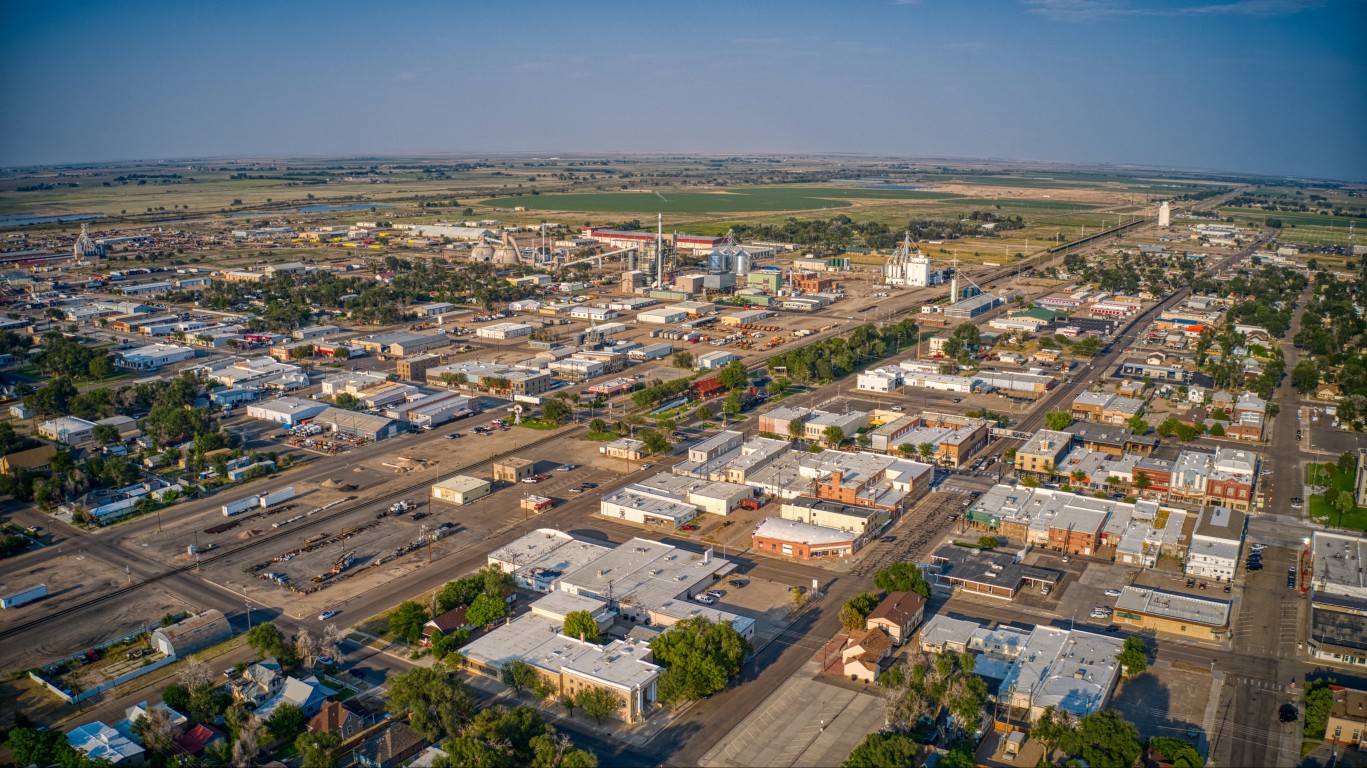
Colorado: Prowers County
> Change in daily avg. new COVID-19 cases, week over week: +39 per 100,000 people
> Avg. new daily cases in Prowers County in 7 days ending Oct. 26: 52 per 100,000
> Avg. new daily cases in Prowers County in 7 days ending Oct. 19: 13 per 100,000
> Avg. new daily cases in Colorado in 7 days ending Oct. 26: 23 per 100,000 (25th most)
> Cumulative confirmed COVID-19 cases in Prowers County as of Oct. 26: 1,427 per 100,000 people (total: 172)
> Population: 12,052
> Largest place in Prowers County: Lamar
[in-text-ad]

Connecticut: Fairfield County
> Change in daily avg. new COVID-19 cases, week over week: +5 per 100,000 people
> Avg. new daily cases in Fairfield County in 7 days ending Oct. 26: 14 per 100,000
> Avg. new daily cases in Fairfield County in 7 days ending Oct. 19: 9 per 100,000
> Avg. new daily cases in Connecticut in 7 days ending Oct. 26: 13 per 100,000 (16th fewest)
> Cumulative confirmed COVID-19 cases in Fairfield County as of Oct. 26: 2,424 per 100,000 people (total: 22,893)
> Population: 944,348
> Largest place in Fairfield County: Bridgeport
[recirclink id=803343]

Delaware: Sussex County
> Change in daily avg. new COVID-19 cases, week over week: +2 per 100,000 people
> Avg. new daily cases in Sussex County in 7 days ending Oct. 26: 19 per 100,000
> Avg. new daily cases in Sussex County in 7 days ending Oct. 19: 18 per 100,000
> Avg. new daily cases in Delaware in 7 days ending Oct. 26: 14 per 100,000 (18th fewest)
> Cumulative confirmed COVID-19 cases in Sussex County as of Oct. 26: 3,577 per 100,000 people (total: 7,854)
> Population: 219,540
> Largest place in Sussex County: Seaford

Florida: Gilchrist County
> Change in daily avg. new COVID-19 cases, week over week: +39 per 100,000 people
> Avg. new daily cases in Gilchrist County in 7 days ending Oct. 26: 50 per 100,000
> Avg. new daily cases in Gilchrist County in 7 days ending Oct. 19: 11 per 100,000
> Avg. new daily cases in Florida in 7 days ending Oct. 26: 15 per 100,000 (20th fewest)
> Cumulative confirmed COVID-19 cases in Gilchrist County as of Oct. 26: 3,429 per 100,000 people (total: 604)
> Population: 17,615
> Largest place in Gilchrist County: Trenton
[in-text-ad-2]

Georgia: Walton County
> Change in daily avg. new COVID-19 cases, week over week: +19 per 100,000 people
> Avg. new daily cases in Walton County in 7 days ending Oct. 26: 33 per 100,000
> Avg. new daily cases in Walton County in 7 days ending Oct. 19: 14 per 100,000
> Avg. new daily cases in Georgia in 7 days ending Oct. 26: 13 per 100,000 (17th fewest)
> Cumulative confirmed COVID-19 cases in Walton County as of Oct. 26: 2,582 per 100,000 people (total: 2,327)
> Population: 90,132
> Largest place in Walton County: Monroe

Hawaii: Maui County
> Change in daily avg. new COVID-19 cases, week over week: +3 per 100,000 people
> Avg. new daily cases in Maui County in 7 days ending Oct. 26: 4 per 100,000
> Avg. new daily cases in Maui County in 7 days ending Oct. 19: 1 per 100,000
> Avg. new daily cases in Hawaii in 7 days ending Oct. 26: 5 per 100,000 (3rd fewest)
> Cumulative confirmed COVID-19 cases in Maui County as of Oct. 26: 301 per 100,000 people (total: 497)
> Population: 165,281
> Largest place in Maui County: Kahului CDP
[in-text-ad]

Idaho: Caribou County
> Change in daily avg. new COVID-19 cases, week over week: +60 per 100,000 people
> Avg. new daily cases in Caribou County in 7 days ending Oct. 26: 132 per 100,000
> Avg. new daily cases in Caribou County in 7 days ending Oct. 19: 73 per 100,000
> Avg. new daily cases in Idaho in 7 days ending Oct. 26: 49 per 100,000 (5th most)
> Cumulative confirmed COVID-19 cases in Caribou County as of Oct. 26: 3,831 per 100,000 people (total: 265)
> Population: 6,918
> Largest place in Caribou County: Soda Springs
[recirclink id=802822]

Illinois: Douglas County
> Change in daily avg. new COVID-19 cases, week over week: +32 per 100,000 people
> Avg. new daily cases in Douglas County in 7 days ending Oct. 26: 110 per 100,000
> Avg. new daily cases in Douglas County in 7 days ending Oct. 19: 78 per 100,000
> Avg. new daily cases in Illinois in 7 days ending Oct. 26: 32 per 100,000 (12th most)
> Cumulative confirmed COVID-19 cases in Douglas County as of Oct. 26: 3,470 per 100,000 people (total: 684)
> Population: 19,714
> Largest place in Douglas County: Tuscola

Indiana: Fayette County
> Change in daily avg. new COVID-19 cases, week over week: +54 per 100,000 people
> Avg. new daily cases in Fayette County in 7 days ending Oct. 26: 90 per 100,000
> Avg. new daily cases in Fayette County in 7 days ending Oct. 19: 36 per 100,000
> Avg. new daily cases in Indiana in 7 days ending Oct. 26: 30 per 100,000 (17th most)
> Cumulative confirmed COVID-19 cases in Fayette County as of Oct. 26: 3,298 per 100,000 people (total: 767)
> Population: 23,259
> Largest place in Fayette County: Connersville
[in-text-ad-2]
Iowa: Cass County
> Change in daily avg. new COVID-19 cases, week over week: +37 per 100,000 people
> Avg. new daily cases in Cass County in 7 days ending Oct. 26: 97 per 100,000
> Avg. new daily cases in Cass County in 7 days ending Oct. 19: 60 per 100,000
> Avg. new daily cases in Iowa in 7 days ending Oct. 26: 37 per 100,000 (9th most)
> Cumulative confirmed COVID-19 cases in Cass County as of Oct. 26: 2,957 per 100,000 people (total: 390)
> Population: 13,191
> Largest place in Cass County: Atlantic

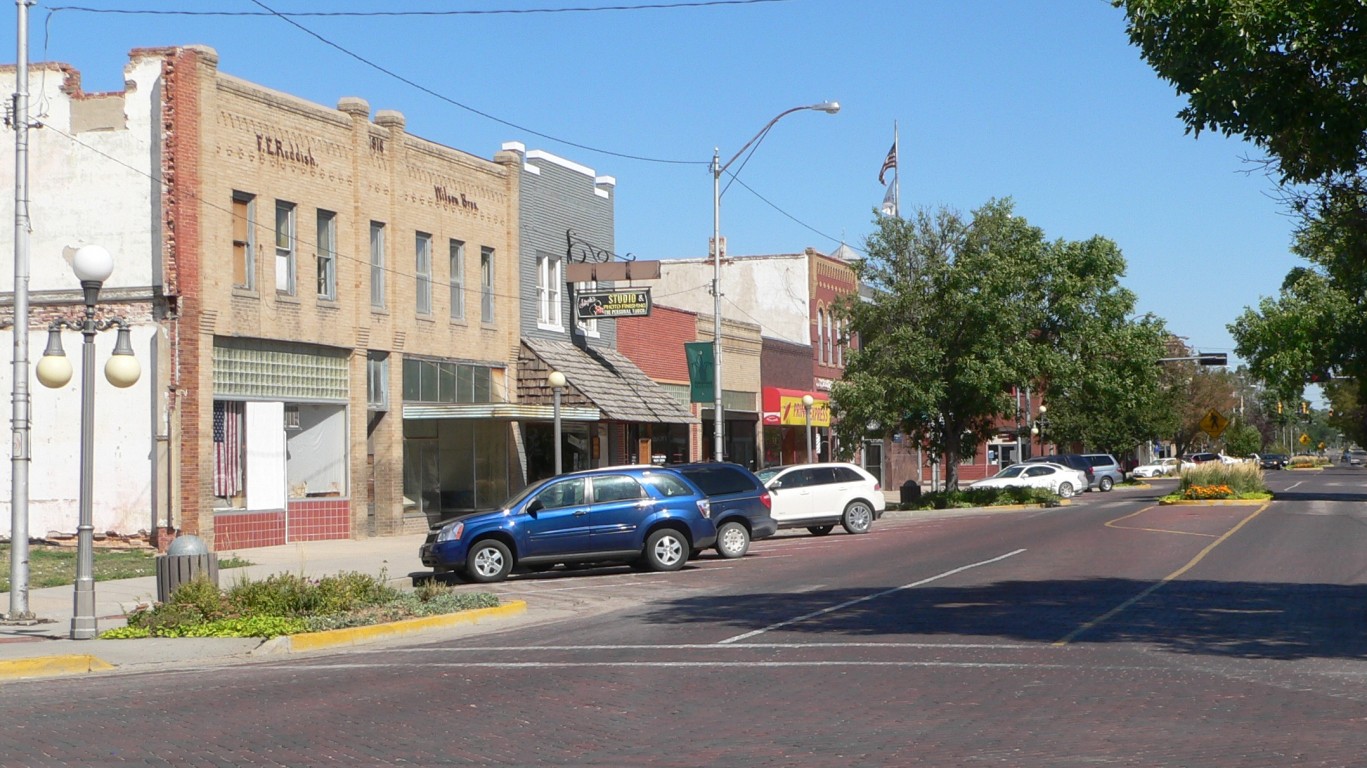
Kansas: Norton County
> Change in daily avg. new COVID-19 cases, week over week: +259 per 100,000 people
> Avg. new daily cases in Norton County in 7 days ending Oct. 26: 529 per 100,000
> Avg. new daily cases in Norton County in 7 days ending Oct. 19: 270 per 100,000
> Avg. new daily cases in Kansas in 7 days ending Oct. 26: 26 per 100,000 (22nd most)
> Cumulative confirmed COVID-19 cases in Norton County as of Oct. 26: 8,440 per 100,000 people (total: 463)
> Population: 5,486
> Largest place in Norton County: Norton
[in-text-ad]

Kentucky: Elliott County
> Change in daily avg. new COVID-19 cases, week over week: +195 per 100,000 people
> Avg. new daily cases in Elliott County in 7 days ending Oct. 26: 212 per 100,000
> Avg. new daily cases in Elliott County in 7 days ending Oct. 19: 17 per 100,000
> Avg. new daily cases in Kentucky in 7 days ending Oct. 26: 27 per 100,000 (21st most)
> Cumulative confirmed COVID-19 cases in Elliott County as of Oct. 26: 4,390 per 100,000 people (total: 330)
> Population: 7,517
> Largest place in Elliott County: Sandy Hook
[recirclink id=802119]

Louisiana: Red River Parish
> Change in daily avg. new COVID-19 cases, week over week: +22 per 100,000 people
> Avg. new daily cases in Red River Parish in 7 days ending Oct. 26: 47 per 100,000
> Avg. new daily cases in Red River Parish in 7 days ending Oct. 19: 26 per 100,000
> Avg. new daily cases in Louisiana in 7 days ending Oct. 26: 13 per 100,000 (14th fewest)
> Cumulative confirmed COVID-19 cases in Red River Parish as of Oct. 26: 4,990 per 100,000 people (total: 430)
> Population: 8,618
> Largest place in Red River Parish: Coushatta

Maine: Waldo County
> Change in daily avg. new COVID-19 cases, week over week: +9 per 100,000 people
> Avg. new daily cases in Waldo County in 7 days ending Oct. 26: 15 per 100,000
> Avg. new daily cases in Waldo County in 7 days ending Oct. 19: 7 per 100,000
> Avg. new daily cases in Maine in 7 days ending Oct. 26: 3 per 100,000 (2nd fewest)
> Cumulative confirmed COVID-19 cases in Waldo County as of Oct. 26: 375 per 100,000 people (total: 148)
> Population: 39,418
> Largest place in Waldo County: Belfast
[in-text-ad-2]

Maryland: Dorchester County
> Change in daily avg. new COVID-19 cases, week over week: +18 per 100,000 people
> Avg. new daily cases in Dorchester County in 7 days ending Oct. 26: 35 per 100,000
> Avg. new daily cases in Dorchester County in 7 days ending Oct. 19: 17 per 100,000
> Avg. new daily cases in Maryland in 7 days ending Oct. 26: 11 per 100,000 (9th fewest)
> Cumulative confirmed COVID-19 cases in Dorchester County as of Oct. 26: 2,402 per 100,000 people (total: 775)
> Population: 32,261
> Largest place in Dorchester County: Cambridge

Massachusetts: Nantucket County
> Change in daily avg. new COVID-19 cases, week over week: +8 per 100,000 people
> Avg. new daily cases in Nantucket County in 7 days ending Oct. 26: 13 per 100,000
> Avg. new daily cases in Nantucket County in 7 days ending Oct. 19: 6 per 100,000
> Avg. new daily cases in Massachusetts in 7 days ending Oct. 26: 12 per 100,000 (10th fewest)
> Cumulative confirmed COVID-19 cases in Nantucket County as of Oct. 26: 1,387 per 100,000 people (total: 154)
> Population: 11,101
> Largest place in Nantucket County: Nantucket CDP
[in-text-ad]

Michigan: Gogebic County
> Change in daily avg. new COVID-19 cases, week over week: +66 per 100,000 people
> Avg. new daily cases in Gogebic County in 7 days ending Oct. 26: 107 per 100,000
> Avg. new daily cases in Gogebic County in 7 days ending Oct. 19: 41 per 100,000
> Avg. new daily cases in Michigan in 7 days ending Oct. 26: 21 per 100,000 (25th fewest)
> Cumulative confirmed COVID-19 cases in Gogebic County as of Oct. 26: 2,556 per 100,000 people (total: 394)
> Population: 15,414
> Largest place in Gogebic County: Ironwood
[recirclink id=801762]
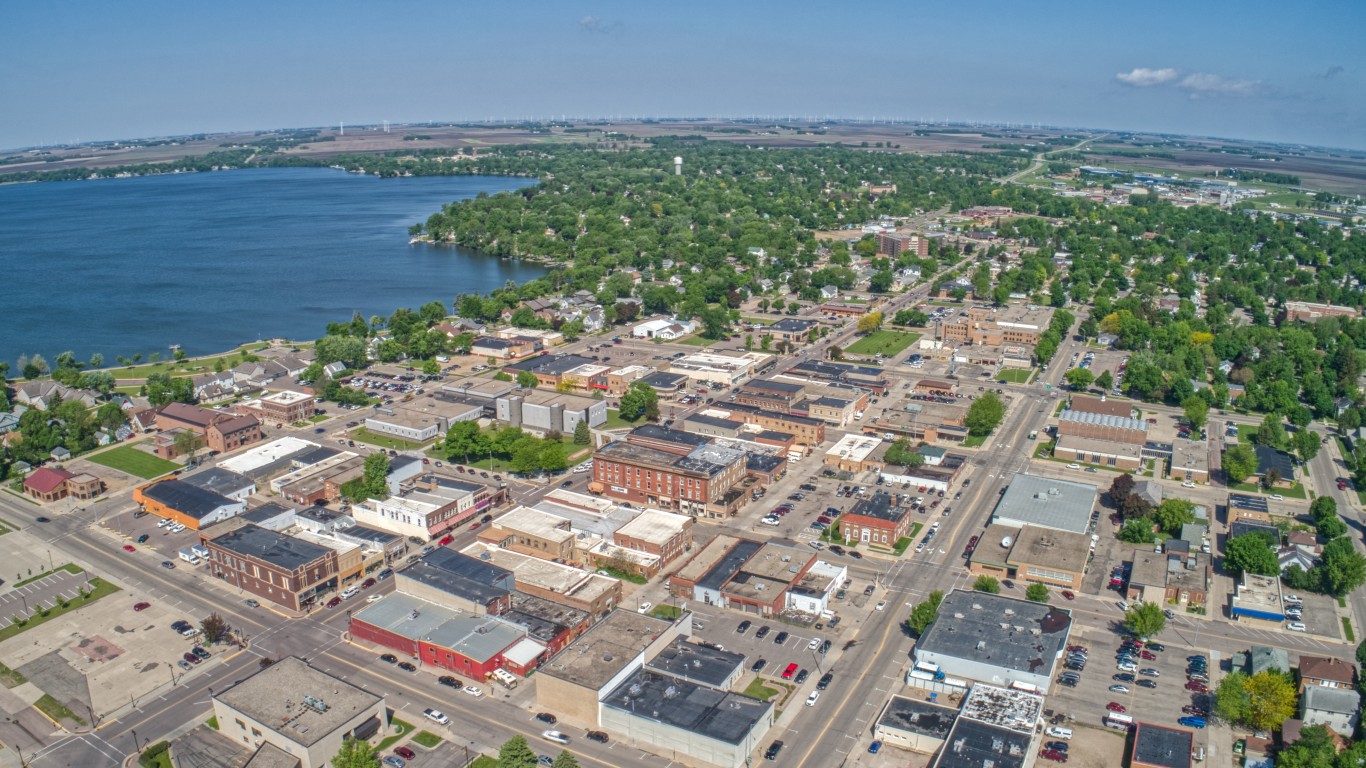
Minnesota: Nobles County
> Change in daily avg. new COVID-19 cases, week over week: +41 per 100,000 people
> Avg. new daily cases in Nobles County in 7 days ending Oct. 26: 82 per 100,000
> Avg. new daily cases in Nobles County in 7 days ending Oct. 19: 41 per 100,000
> Avg. new daily cases in Minnesota in 7 days ending Oct. 26: 27 per 100,000 (20th most)
> Cumulative confirmed COVID-19 cases in Nobles County as of Oct. 26: 10,422 per 100,000 people (total: 2,276)
> Population: 21,839
> Largest place in Nobles County: Worthington

Mississippi: Humphreys County
> Change in daily avg. new COVID-19 cases, week over week: +42 per 100,000 people
> Avg. new daily cases in Humphreys County in 7 days ending Oct. 26: 60 per 100,000
> Avg. new daily cases in Humphreys County in 7 days ending Oct. 19: 18 per 100,000
> Avg. new daily cases in Mississippi in 7 days ending Oct. 26: 24 per 100,000 (23rd most)
> Cumulative confirmed COVID-19 cases in Humphreys County as of Oct. 26: 5,258 per 100,000 people (total: 449)
> Population: 8,539
> Largest place in Humphreys County: Belzoni
[in-text-ad-2]

Missouri: Moniteau County
> Change in daily avg. new COVID-19 cases, week over week: +45 per 100,000 people
> Avg. new daily cases in Moniteau County in 7 days ending Oct. 26: 97 per 100,000
> Avg. new daily cases in Moniteau County in 7 days ending Oct. 19: 52 per 100,000
> Avg. new daily cases in Missouri in 7 days ending Oct. 26: 28 per 100,000 (19th most)
> Cumulative confirmed COVID-19 cases in Moniteau County as of Oct. 26: 3,873 per 100,000 people (total: 618)
> Population: 15,958
> Largest place in Moniteau County: California

Montana: Big Horn County
> Change in daily avg. new COVID-19 cases, week over week: +83 per 100,000 people
> Avg. new daily cases in Big Horn County in 7 days ending Oct. 26: 174 per 100,000
> Avg. new daily cases in Big Horn County in 7 days ending Oct. 19: 91 per 100,000
> Avg. new daily cases in Montana in 7 days ending Oct. 26: 65 per 100,000 (3rd most)
> Cumulative confirmed COVID-19 cases in Big Horn County as of Oct. 26: 10,003 per 100,000 people (total: 1,338)
> Population: 13,376
> Largest place in Big Horn County: Hardin
[in-text-ad]
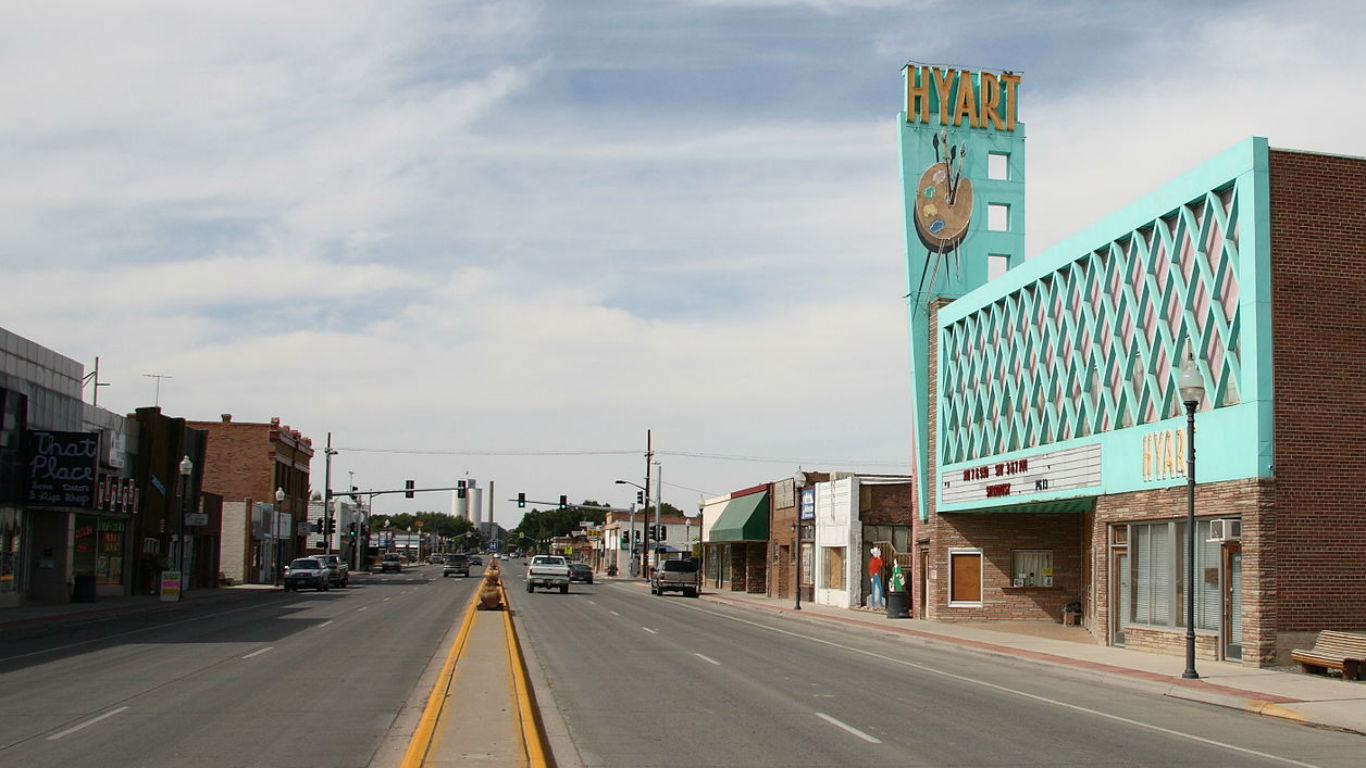
Nebraska: Box Butte County
> Change in daily avg. new COVID-19 cases, week over week: +42 per 100,000 people
> Avg. new daily cases in Box Butte County in 7 days ending Oct. 26: 70 per 100,000
> Avg. new daily cases in Box Butte County in 7 days ending Oct. 19: 28 per 100,000
> Avg. new daily cases in Nebraska in 7 days ending Oct. 26: 43 per 100,000 (7th most)
> Cumulative confirmed COVID-19 cases in Box Butte County as of Oct. 26: 2,038 per 100,000 people (total: 226)
> Population: 11,089
> Largest place in Box Butte County: Alliance
[recirclink id=803449]

Nevada: White Pine County
> Change in daily avg. new COVID-19 cases, week over week: +14 per 100,000 people
> Avg. new daily cases in White Pine County in 7 days ending Oct. 26: 32 per 100,000
> Avg. new daily cases in White Pine County in 7 days ending Oct. 19: 18 per 100,000
> Avg. new daily cases in Nevada in 7 days ending Oct. 26: 24 per 100,000 (24th most)
> Cumulative confirmed COVID-19 cases in White Pine County as of Oct. 26: 1,212 per 100,000 people (total: 118)
> Population: 9,737
> Largest place in White Pine County: Ely

New Hampshire: Belknap County
> Change in daily avg. new COVID-19 cases, week over week: +2 per 100,000 people
> Avg. new daily cases in Belknap County in 7 days ending Oct. 26: 6 per 100,000
> Avg. new daily cases in Belknap County in 7 days ending Oct. 19: 4 per 100,000
> Avg. new daily cases in New Hampshire in 7 days ending Oct. 26: 6 per 100,000 (4th fewest)
> Cumulative confirmed COVID-19 cases in Belknap County as of Oct. 26: 369 per 100,000 people (total: 224)
> Population: 60,640
> Largest place in Belknap County: Laconia
[in-text-ad-2]

New Jersey: Union County
> Change in daily avg. new COVID-19 cases, week over week: +8 per 100,000 people
> Avg. new daily cases in Union County in 7 days ending Oct. 26: 20 per 100,000
> Avg. new daily cases in Union County in 7 days ending Oct. 19: 11 per 100,000
> Avg. new daily cases in New Jersey in 7 days ending Oct. 26: 13 per 100,000 (12th fewest)
> Cumulative confirmed COVID-19 cases in Union County as of Oct. 26: 3,559 per 100,000 people (total: 19,682)
> Population: 553,066
> Largest place in Union County: Elizabeth

New Mexico: Luna County
> Change in daily avg. new COVID-19 cases, week over week: +53 per 100,000 people
> Avg. new daily cases in Luna County in 7 days ending Oct. 26: 102 per 100,000
> Avg. new daily cases in Luna County in 7 days ending Oct. 19: 49 per 100,000
> Avg. new daily cases in New Mexico in 7 days ending Oct. 26: 32 per 100,000 (14th most)
> Cumulative confirmed COVID-19 cases in Luna County as of Oct. 26: 3,561 per 100,000 people (total: 864)
> Population: 24,264
> Largest place in Luna County: Deming
[in-text-ad]

New York: Chemung County
> Change in daily avg. new COVID-19 cases, week over week: +14 per 100,000 people
> Avg. new daily cases in Chemung County in 7 days ending Oct. 26: 58 per 100,000
> Avg. new daily cases in Chemung County in 7 days ending Oct. 19: 44 per 100,000
> Avg. new daily cases in New York in 7 days ending Oct. 26: 8 per 100,000 (5th fewest)
> Cumulative confirmed COVID-19 cases in Chemung County as of Oct. 26: 1,938 per 100,000 people (total: 1,662)
> Population: 85,740
> Largest place in Chemung County: Elmira
[recirclink id=803343]

North Carolina: Madison County
> Change in daily avg. new COVID-19 cases, week over week: +27 per 100,000 people
> Avg. new daily cases in Madison County in 7 days ending Oct. 26: 35 per 100,000
> Avg. new daily cases in Madison County in 7 days ending Oct. 19: 9 per 100,000
> Avg. new daily cases in North Carolina in 7 days ending Oct. 26: 20 per 100,000 (24th fewest)
> Cumulative confirmed COVID-19 cases in Madison County as of Oct. 26: 1,018 per 100,000 people (total: 218)
> Population: 21,405
> Largest place in Madison County: Mars Hill

North Dakota: McLean County
> Change in daily avg. new COVID-19 cases, week over week: +70 per 100,000 people
> Avg. new daily cases in McLean County in 7 days ending Oct. 26: 153 per 100,000
> Avg. new daily cases in McLean County in 7 days ending Oct. 19: 83 per 100,000
> Avg. new daily cases in North Dakota in 7 days ending Oct. 26: 89 per 100,000 (the most)
> Cumulative confirmed COVID-19 cases in McLean County as of Oct. 26: 5,870 per 100,000 people (total: 564)
> Population: 9,608
> Largest place in McLean County: Garrison
[in-text-ad-2]

Ohio: Putnam County
> Change in daily avg. new COVID-19 cases, week over week: +35 per 100,000 people
> Avg. new daily cases in Putnam County in 7 days ending Oct. 26: 80 per 100,000
> Avg. new daily cases in Putnam County in 7 days ending Oct. 19: 45 per 100,000
> Avg. new daily cases in Ohio in 7 days ending Oct. 26: 19 per 100,000 (23rd fewest)
> Cumulative confirmed COVID-19 cases in Putnam County as of Oct. 26: 3,312 per 100,000 people (total: 1,125)
> Population: 33,969
> Largest place in Putnam County: Ottawa
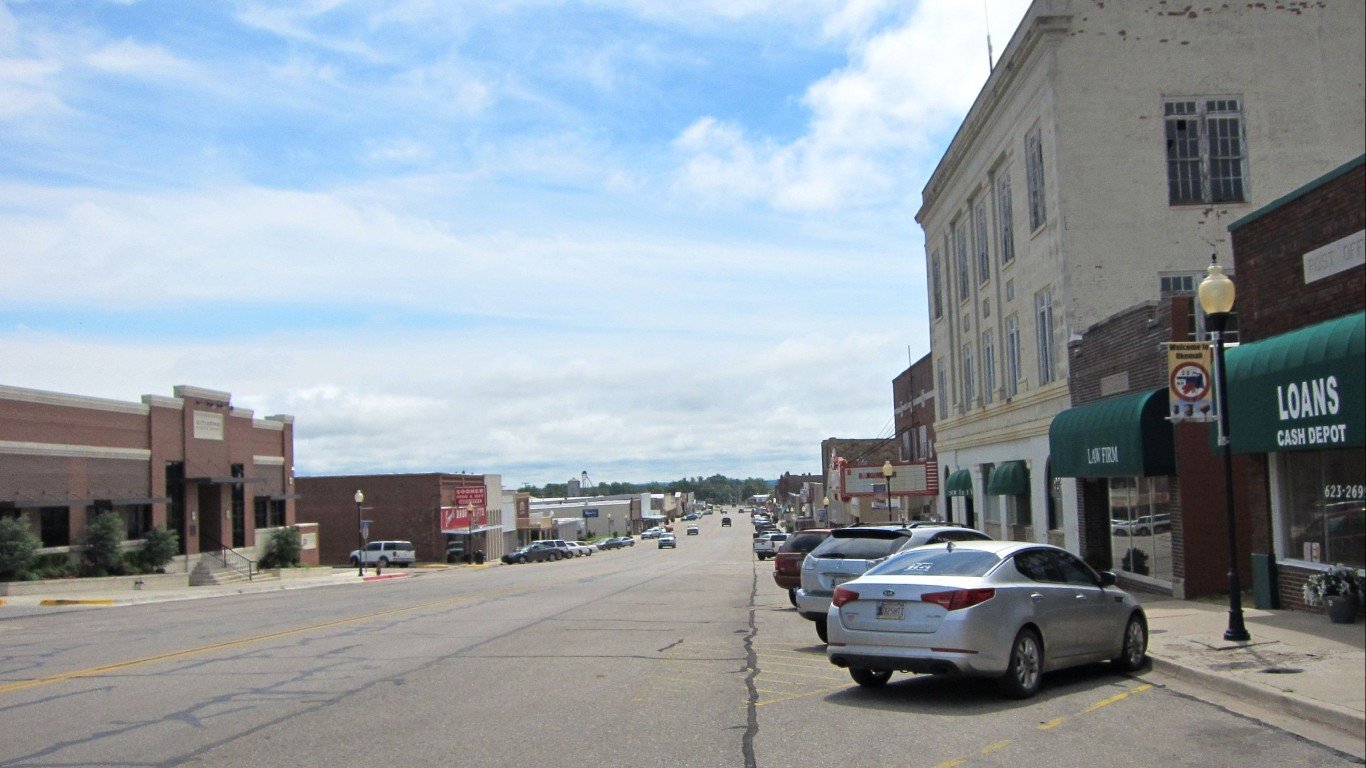
Oklahoma: Okfuskee County
> Change in daily avg. new COVID-19 cases, week over week: +160 per 100,000 people
> Avg. new daily cases in Okfuskee County in 7 days ending Oct. 26: 228 per 100,000
> Avg. new daily cases in Okfuskee County in 7 days ending Oct. 19: 68 per 100,000
> Avg. new daily cases in Oklahoma in 7 days ending Oct. 26: 32 per 100,000 (13th most)
> Cumulative confirmed COVID-19 cases in Okfuskee County as of Oct. 26: 4,482 per 100,000 people (total: 543)
> Population: 12,115
> Largest place in Okfuskee County: Okemah
[in-text-ad]

Oregon: Crook County
> Change in daily avg. new COVID-19 cases, week over week: +7 per 100,000 people
> Avg. new daily cases in Crook County in 7 days ending Oct. 26: 13 per 100,000
> Avg. new daily cases in Crook County in 7 days ending Oct. 19: 7 per 100,000
> Avg. new daily cases in Oregon in 7 days ending Oct. 26: 8 per 100,000 (6th fewest)
> Cumulative confirmed COVID-19 cases in Crook County as of Oct. 26: 488 per 100,000 people (total: 109)
> Population: 22,337
> Largest place in Crook County: Prineville
[recirclink id=802822]

Pennsylvania: Elk County
> Change in daily avg. new COVID-19 cases, week over week: +11 per 100,000 people
> Avg. new daily cases in Elk County in 7 days ending Oct. 26: 19 per 100,000
> Avg. new daily cases in Elk County in 7 days ending Oct. 19: 8 per 100,000
> Avg. new daily cases in Pennsylvania in 7 days ending Oct. 26: 13 per 100,000 (13th fewest)
> Cumulative confirmed COVID-19 cases in Elk County as of Oct. 26: 506 per 100,000 people (total: 155)
> Population: 30,608
> Largest place in Elk County: St. Marys

Rhode Island: Newport County
> Change in daily avg. new COVID-19 cases, week over week: +1 per 100,000 people
> Avg. new daily cases in Newport County in 7 days ending Oct. 26: 8 per 100,000
> Avg. new daily cases in Newport County in 7 days ending Oct. 19: 8 per 100,000
> Avg. new daily cases in Rhode Island in 7 days ending Oct. 26: 30 per 100,000 (16th most)
> Cumulative confirmed COVID-19 cases in Newport County as of Oct. 26: 760 per 100,000 people (total: 631)
> Population: 83,075
> Largest place in Newport County: Newport
[in-text-ad-2]

South Carolina: Pickens County
> Change in daily avg. new COVID-19 cases, week over week: +7 per 100,000 people
> Avg. new daily cases in Pickens County in 7 days ending Oct. 26: 41 per 100,000
> Avg. new daily cases in Pickens County in 7 days ending Oct. 19: 34 per 100,000
> Avg. new daily cases in South Carolina in 7 days ending Oct. 26: 18 per 100,000 (22nd fewest)
> Cumulative confirmed COVID-19 cases in Pickens County as of Oct. 26: 3,546 per 100,000 people (total: 4,352)
> Population: 122,746
> Largest place in Pickens County: Easley

South Dakota: Bon Homme County
> Change in daily avg. new COVID-19 cases, week over week: +300 per 100,000 people
> Avg. new daily cases in Bon Homme County in 7 days ending Oct. 26: 505 per 100,000
> Avg. new daily cases in Bon Homme County in 7 days ending Oct. 19: 204 per 100,000
> Avg. new daily cases in South Dakota in 7 days ending Oct. 26: 70 per 100,000 (2nd most)
> Cumulative confirmed COVID-19 cases in Bon Homme County as of Oct. 26: 11,092 per 100,000 people (total: 773)
> Population: 6,969
> Largest place in Bon Homme County: Tyndall
[in-text-ad]

Tennessee: Perry County
> Change in daily avg. new COVID-19 cases, week over week: +121 per 100,000 people
> Avg. new daily cases in Perry County in 7 days ending Oct. 26: 156 per 100,000
> Avg. new daily cases in Perry County in 7 days ending Oct. 19: 34 per 100,000
> Avg. new daily cases in Tennessee in 7 days ending Oct. 26: 35 per 100,000 (10th most)
> Cumulative confirmed COVID-19 cases in Perry County as of Oct. 26: 3,893 per 100,000 people (total: 308)
> Population: 7,912
> Largest place in Perry County: Lobelville
[recirclink id=802119]

Texas: Maverick County
> Change in daily avg. new COVID-19 cases, week over week: +60 per 100,000 people
> Avg. new daily cases in Maverick County in 7 days ending Oct. 26: 64 per 100,000
> Avg. new daily cases in Maverick County in 7 days ending Oct. 19: 5 per 100,000
> Avg. new daily cases in Texas in 7 days ending Oct. 26: 18 per 100,000 (21st fewest)
> Cumulative confirmed COVID-19 cases in Maverick County as of Oct. 26: 7,214 per 100,000 people (total: 4,182)
> Population: 57,970
> Largest place in Maverick County: Eagle Pass

Utah: San Juan County
> Change in daily avg. new COVID-19 cases, week over week: +18 per 100,000 people
> Avg. new daily cases in San Juan County in 7 days ending Oct. 26: 43 per 100,000
> Avg. new daily cases in San Juan County in 7 days ending Oct. 19: 25 per 100,000
> Avg. new daily cases in Utah in 7 days ending Oct. 26: 43 per 100,000 (6th most)
> Cumulative confirmed COVID-19 cases in San Juan County as of Oct. 26: 5,261 per 100,000 people (total: 804)
> Population: 15,281
> Largest place in San Juan County: Blanding
[in-text-ad-2]

Vermont: Washington County
> Change in daily avg. new COVID-19 cases, week over week: +2 per 100,000 people
> Avg. new daily cases in Washington County in 7 days ending Oct. 26: 5 per 100,000
> Avg. new daily cases in Washington County in 7 days ending Oct. 19: 3 per 100,000
> Avg. new daily cases in Vermont in 7 days ending Oct. 26: 2 per 100,000 (the fewest)
> Cumulative confirmed COVID-19 cases in Washington County as of Oct. 26: 214 per 100,000 people (total: 125)
> Population: 58,477
> Largest place in Washington County: Barre

Virginia: Radford city
> Change in daily avg. new COVID-19 cases, week over week: +34 per 100,000 people
> Avg. new daily cases in Radford city in 7 days ending Oct. 26: 73 per 100,000
> Avg. new daily cases in Radford city in 7 days ending Oct. 19: 40 per 100,000
> Avg. new daily cases in Virginia in 7 days ending Oct. 26: 12 per 100,000 (11th fewest)
> Cumulative confirmed COVID-19 cases in Radford city as of Oct. 26: 5,247 per 100,000 people (total: 925)
> Population: 17,630
> Largest place in Radford city: Radford
[in-text-ad]

Washington: Walla Walla County
> Change in daily avg. new COVID-19 cases, week over week: +11 per 100,000 people
> Avg. new daily cases in Walla Walla County in 7 days ending Oct. 26: 20 per 100,000
> Avg. new daily cases in Walla Walla County in 7 days ending Oct. 19: 9 per 100,000
> Avg. new daily cases in Washington in 7 days ending Oct. 26: 9 per 100,000 (7th fewest)
> Cumulative confirmed COVID-19 cases in Walla Walla County as of Oct. 26: 1,879 per 100,000 people (total: 1,132)
> Population: 60,236
> Largest place in Walla Walla County: Walla Walla
[recirclink id=801762]

West Virginia: Wetzel County
> Change in daily avg. new COVID-19 cases, week over week: +38 per 100,000 people
> Avg. new daily cases in Wetzel County in 7 days ending Oct. 26: 47 per 100,000
> Avg. new daily cases in Wetzel County in 7 days ending Oct. 19: 9 per 100,000
> Avg. new daily cases in West Virginia in 7 days ending Oct. 26: 15 per 100,000 (19th fewest)
> Cumulative confirmed COVID-19 cases in Wetzel County as of Oct. 26: 1,095 per 100,000 people (total: 171)
> Population: 15,614
> Largest place in Wetzel County: New Martinsville

Wisconsin: Sheboygan County
> Change in daily avg. new COVID-19 cases, week over week: +94 per 100,000 people
> Avg. new daily cases in Sheboygan County in 7 days ending Oct. 26: 157 per 100,000
> Avg. new daily cases in Sheboygan County in 7 days ending Oct. 19: 64 per 100,000
> Avg. new daily cases in Wisconsin in 7 days ending Oct. 26: 64 per 100,000 (4th most)
> Cumulative confirmed COVID-19 cases in Sheboygan County as of Oct. 26: 3,984 per 100,000 people (total: 4,590)
> Population: 115,205
> Largest place in Sheboygan County: Sheboygan
[in-text-ad-2]
Wyoming: Big Horn County
> Change in daily avg. new COVID-19 cases, week over week: +27 per 100,000 people
> Avg. new daily cases in Big Horn County in 7 days ending Oct. 26: 72 per 100,000
> Avg. new daily cases in Big Horn County in 7 days ending Oct. 19: 45 per 100,000
> Avg. new daily cases in Wyoming in 7 days ending Oct. 26: 43 per 100,000 (8th most)
> Cumulative confirmed COVID-19 cases in Big Horn County as of Oct. 26: 1,907 per 100,000 people (total: 227)
> Population: 11,901
> Largest place in Big Horn County: Lovell
Contact [email protected] for any questions or corrections.