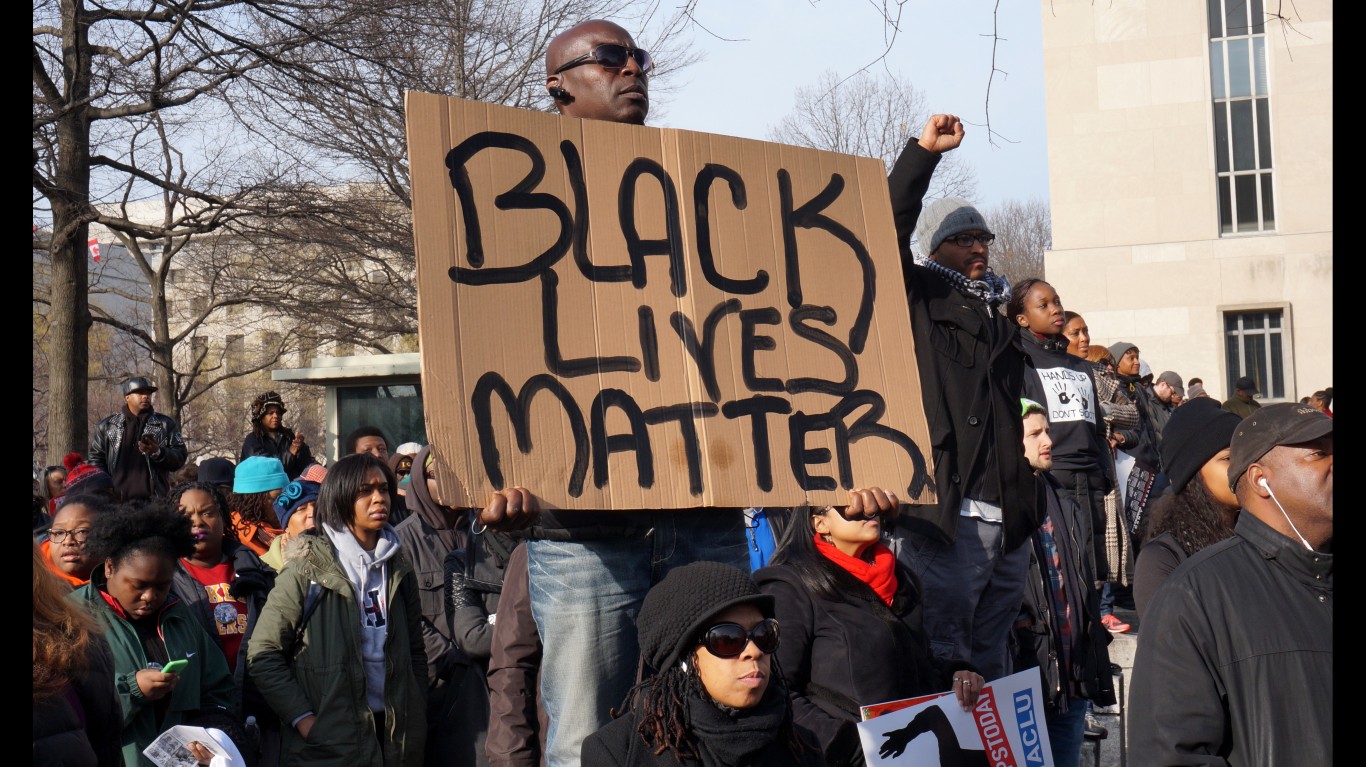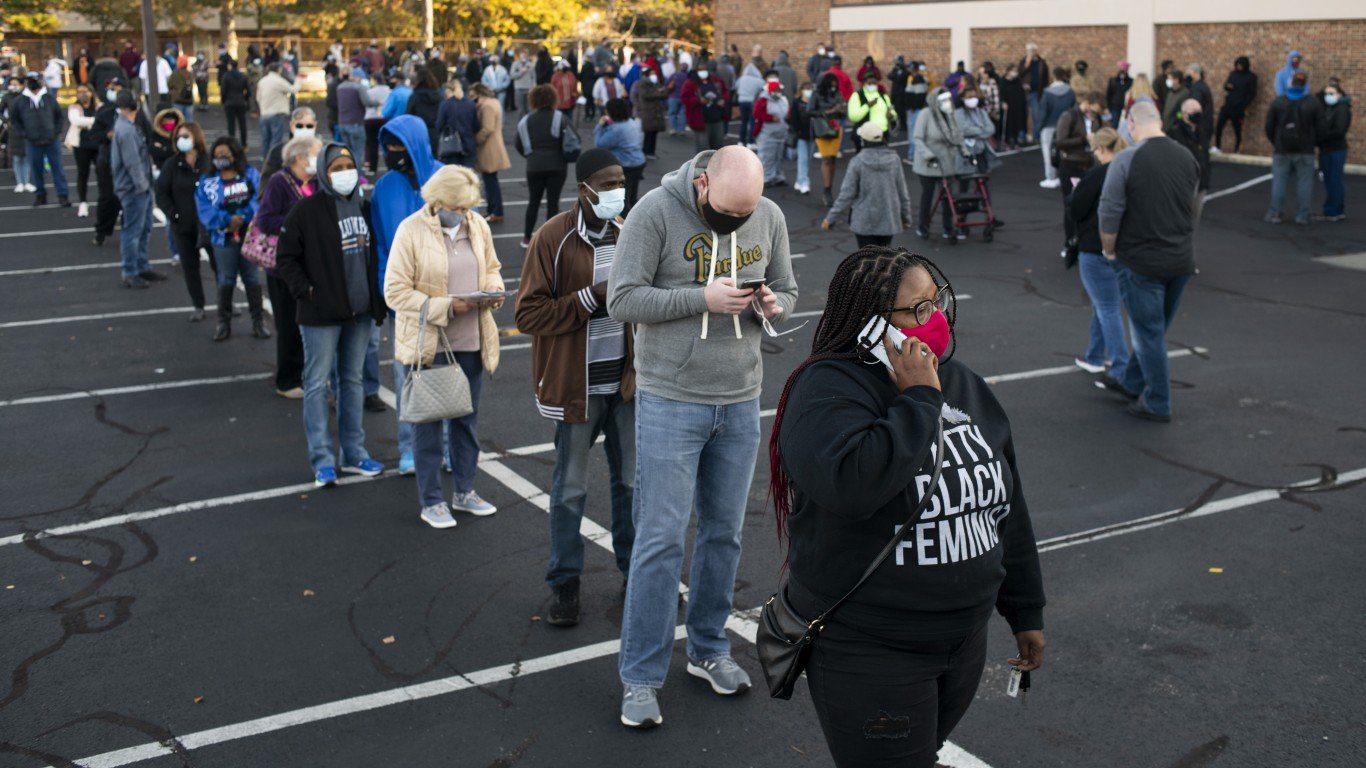
It has been 150 years since the 15th Amendment guaranteed Black American men the right to vote. Yet in that time, people of color have consistently faced discrimination and inequality — much of which persists to this day.
Nearly a quarter of Black Americans live below the poverty line, more than double the share of white Americans. The median income among Black households is just over $40,000, compared to nearly $64,000 for white households. According to the latest Census data, the unemployment rate for Black Americans is over 10%, while the white unemployment rate is less than 5%. Black Americans are also less likely to finish high school and go to college and less likely to own a home compared to white Americans.
While these inequalities are pervasive across the country, there are certain parts of the country where the differences in economic and educational outcomes between Black and white Americans are even more pronounced.
To determine the 30 worst congressional districts for Black Americans, 24/7 Wall St. used data from the U.S. Census Bureau’s American Community Survey to create an index of six measures to assess race-based gaps in socioeconomic outcomes in each of the nation’s congressional districts. Creating the index in this way ensures that districts are ranked on the socioeconomic gaps between Black and white residents rather than the overall socioeconomic status.
Most of the worst congressional districts for Black Americans are concentrated in the eastern part of the country. Arkansas, Louisiana, and Minnesota, are the only states home to districts on this list that are west of the Mississippi River. Of the 30 districts on this list, 13 are in the Midwest, 11 are in the South, and six are in the Northeast.
In many of these areas, the wide socioeconomic disparities are due in part to past discriminatory practices like redlining and exclusionary housing covenants that effectively segregated cities. Though these practices have since been outlawed in the mid-20th century, they restricted economic mobility and entrenched inequality for years to come.
These districts tend to cluster in certain states as well. Illinois has more districts on this list than any other state, with five. Ohio and Louisiana each have four congressional districts on this list. There does not appear to be a common political leaning among these 30 districts as 16 are represented by Democrats in the House of Representatives, while 14 are represented by Republicans.
The worst districts for Black Americans tend to be in economically depressed areas as 24 of the 30 districts have a lower median household income than the overall U.S. median of $60,293. In each district on this list, the typical Black household earns tens of thousands of dollars less per year than the typical white household. These are America’s poorest cities.
In addition to the challenging socioeconomic circumstances in these areas, many are in states with numerous active hate groups. There were nearly 1,000 active groups as of 2019, according to the Southern Poverty Law Center. These are the states with the most hate groups per capita.
Click here to see the worst voting districts for Black Americans.
Click here to read our detailed methodology.
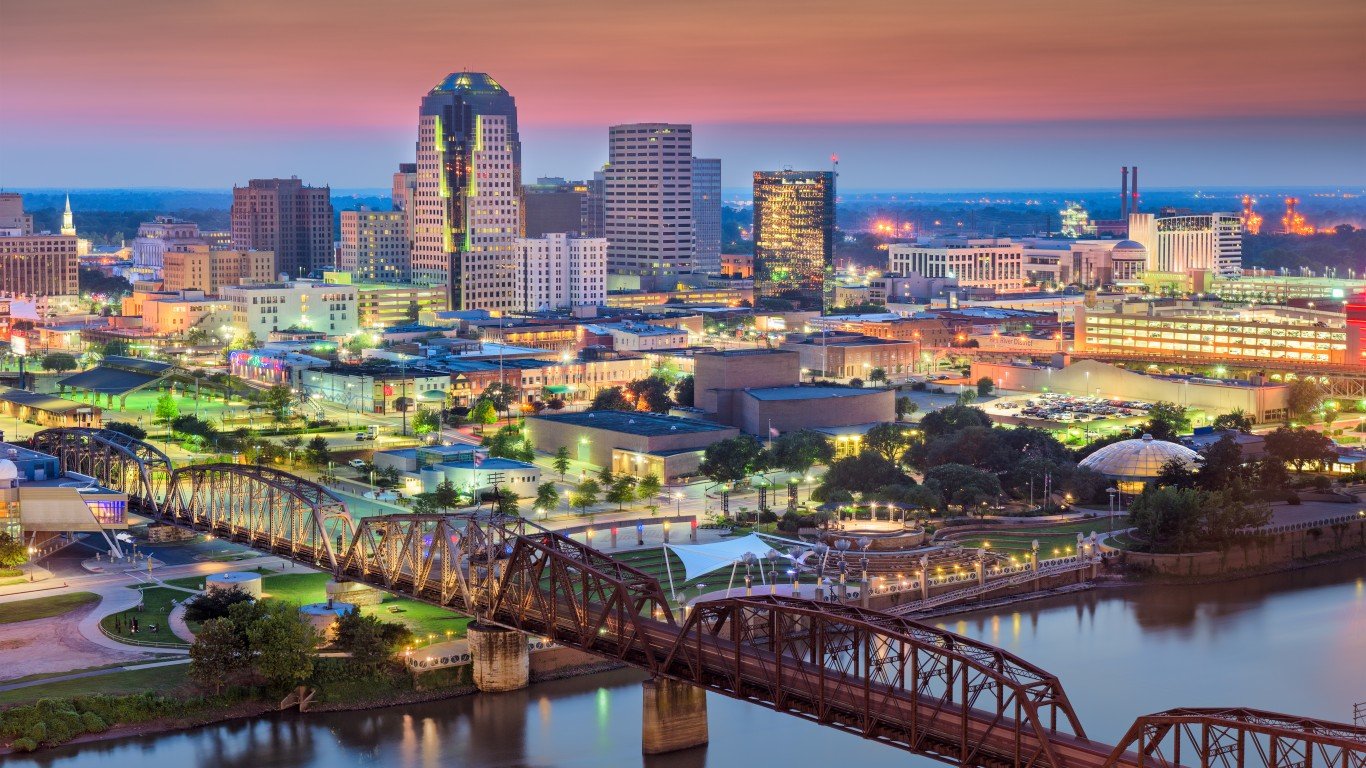
30. Louisiana’s 4th Congressional District
> Current representative: Rep. Mike Johnson (Republican Party)
> Poverty rate: 35.9% Black; 14.9% white
> Unemployment rate: 10.6% Black; 6.1% white
> Homeownership rate: 44.5% Black; 74.2% white
Louisiana’s 4th Congressional District comprises the northwestern portion of the state, and much of the state’s western border with Texas. Four of the state’s six congressional districts rank among the 30 worst for Black Americans.
Just over a third of the district’s approximately 750,000 residents are non-white. Over a third of the district’s Black residents, 35.9%, live in poverty, compared to less than 15% of white residents. This may not be surprising considering the income gap between Black and white households. The median household income in the district is around $41,000. While most white households earn over $51,000 a year, most Black households earn under $27,000 annually.
[in-text-ad]
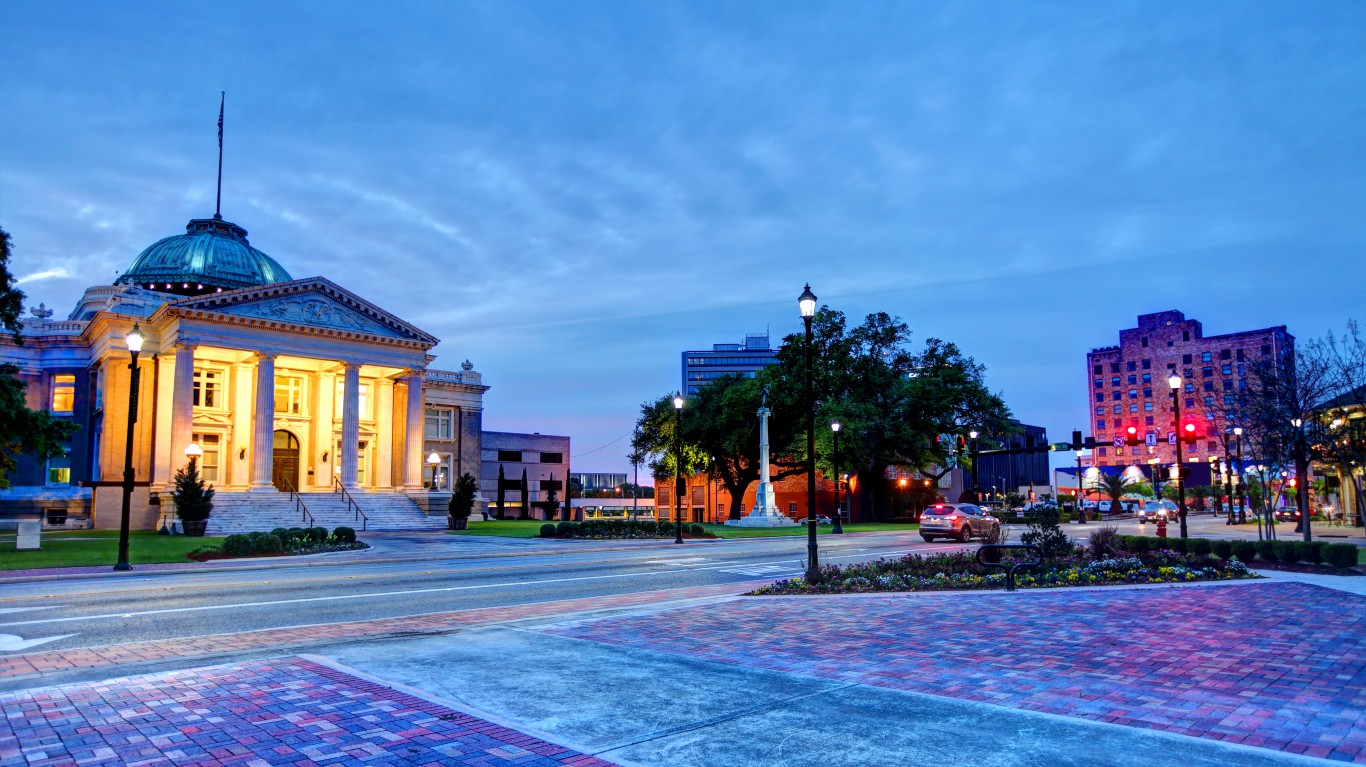
29. Louisiana’s 3rd Congressional District
> Current representative: Rep. Clay Higgins (Republican Party)
> Poverty rate: 31.9% Black; 12.8% white
> Unemployment rate: 10.5% Black; 5.3% white
> Homeownership rate: 47.7% Black; 75.9% white
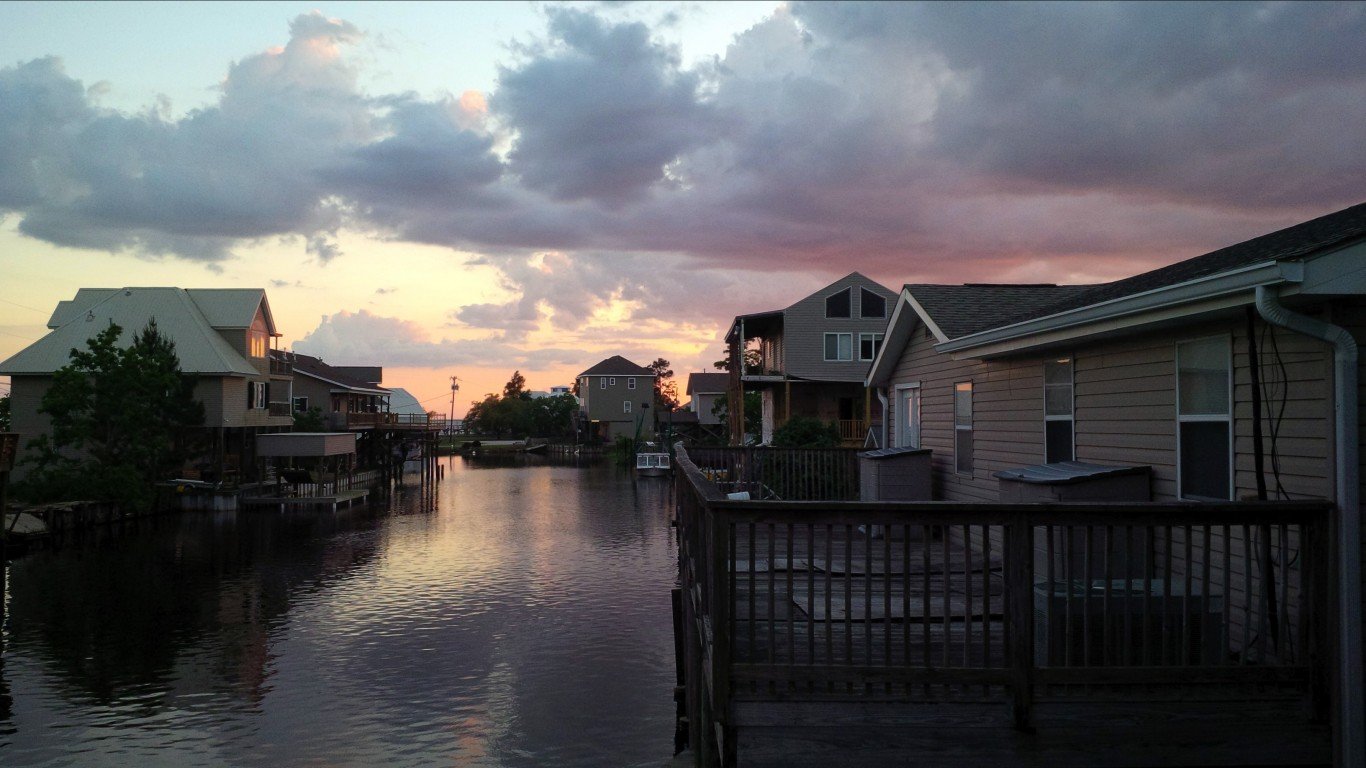
Louisiana’s 3rd Congressional District covers a large portion of the southernmost part of the state along the Gulf Coast, encompassing Lake Charles and Lafayette. Across the district, the typical white household earns about $57,000 annually — nearly double the income the typical Black household earns. This is likely due in part to disparities in employment opportunities. Members of the labor force who are Black are about twice as likely to be unemployed as their white counterparts.
Since 2017, the district has been served by Clay Higgins, a member of the Republican party who worked as a military police officer before running for office.
[recirclink id=801221]
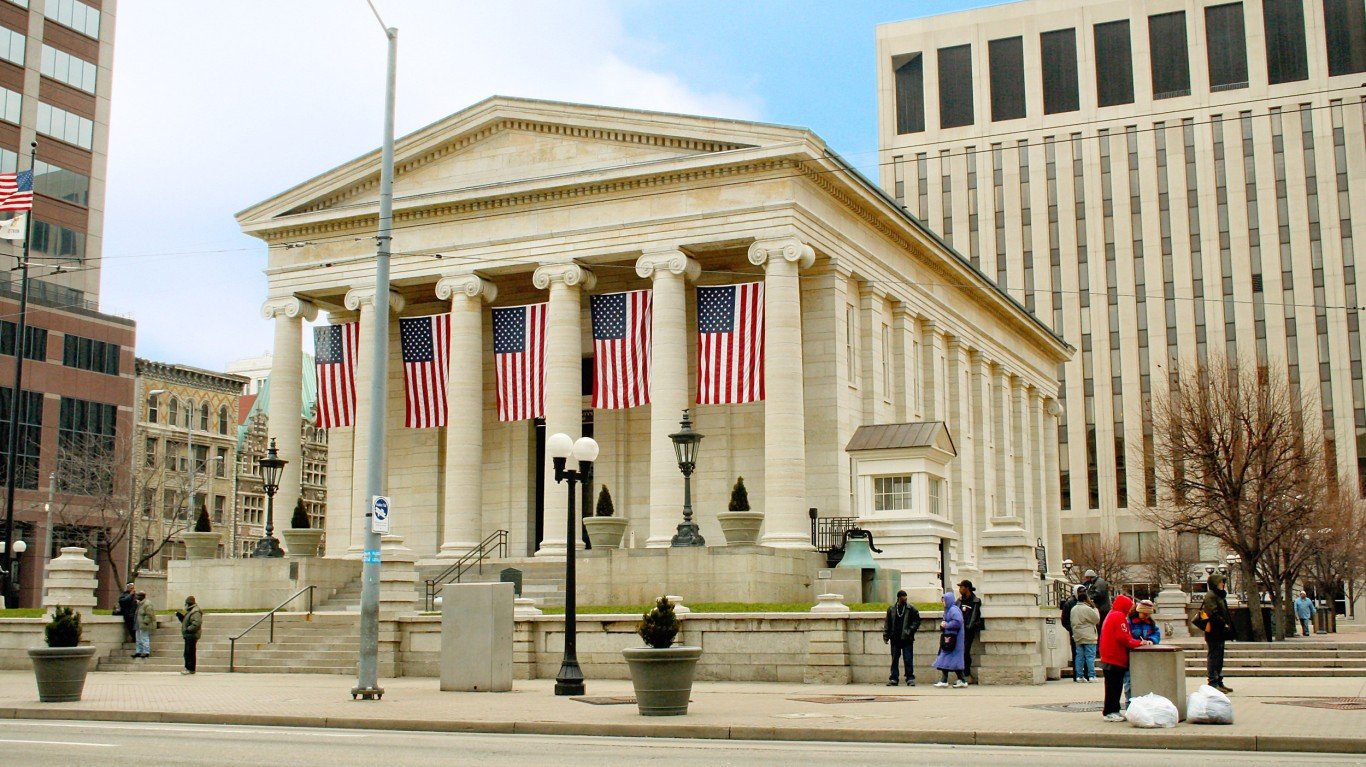
28. Ohio’s 10th Congressional District
> Current representative: Rep. Michael R. Turner (Republican Party)
> Poverty rate: 32.6% Black; 12.2% white
> Unemployment rate: 13.3% Black; 5.2% white
> Homeownership rate: 39.2% Black; 68.5% white
Ohio’s 10th Congressional District, which includes the city of Dayton, is one of several districts in the state to report near nation-leading socioeconomic disparities between Black and white residents. Black area residents are more than two-and-a-half times more likely to live below the poverty line than white area residents, and Black workers are more than twice as likely to be unemployed as white workers.
The district has been represented by Republican Mike Turner since 2003. Before going to Capitol Hill, Turner served as the mayor of Dayton for eight years after running his own private law practice that specialized in real estate and corporate law.
27. Louisiana’s 1st Congressional District
> Current representative: Rep. Steve Scalise (Republican Party)
> Poverty rate: 32.1% Black; 10.6% white
> Unemployment rate: 9.8% Black; 4.9% white
> Homeownership rate: 43.6% Black; 76.7% white
Louisiana’s 1st Congressional District covers much of the southeastern part of the state. White households in the area typically earn over $64,000 a year, slightly above the U.S. median household income of $60,293. Meanwhile, Black households have a median annual income of $35,269.
Black residents are more than three times as likely to live in poverty as white residents, with poverty rates at 32.1% and 10.6%, respectively. This may be due in part to the area’s educational disparity. In the district, 80.8% of Black adults have a high school diploma and 17.7% have at least a bachelor’s degree. Comparatively, 90.2% of white adults have finished high school and 33.5% have a college degree.
[in-text-ad-2]
26. Wisconsin’s 4th Congressional District
> Current representative: Rep. Gwen Moore (Democratic Party)
> Poverty rate: 34.4% Black; 14.9% white
> Unemployment rate: 12.8% Black; 4.1% white
> Homeownership rate: 27.6% Black; 59.5% white
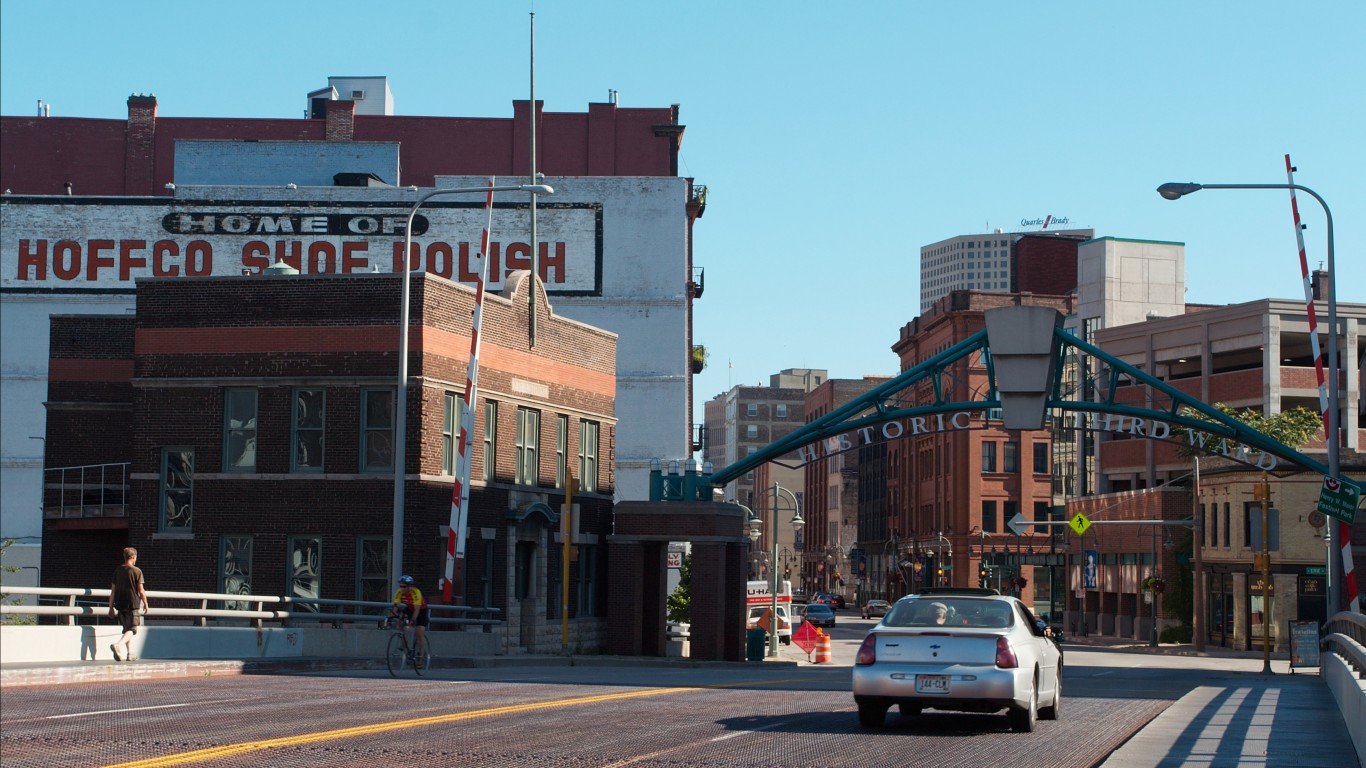
Wisconsin’s 4th Congressional District includes the city of Milwaukee, which is one of the most segregated cities in the country. Like many Rust Belt cities, Milwaukee’s current segregation patterns can be traced back to discriminatory appraisal maps drawn up in the early 20th century that led to reduced property values in majority African American neighborhoods.
Segregated communities often have the worst economic disparities along racial lines, and Wisconsin’s 4th District is no exception. The typical white area household earns nearly $56,000 a year, while the median annual income among Black households is less than $29,000.The Black unemployment rate of 12.8% in the area is also more than triple the unemployment rate of 4.1% among white workers.
25. North Carolina’s 9th Congressional District
> Current representative: Rep. Dan Bishop (Republican Party)
> Poverty rate: 27.8% Black; 9.4% white
> Unemployment rate: 11.7% Black; 4.6% white
> Homeownership rate: 51.5% Black; 79.1% white
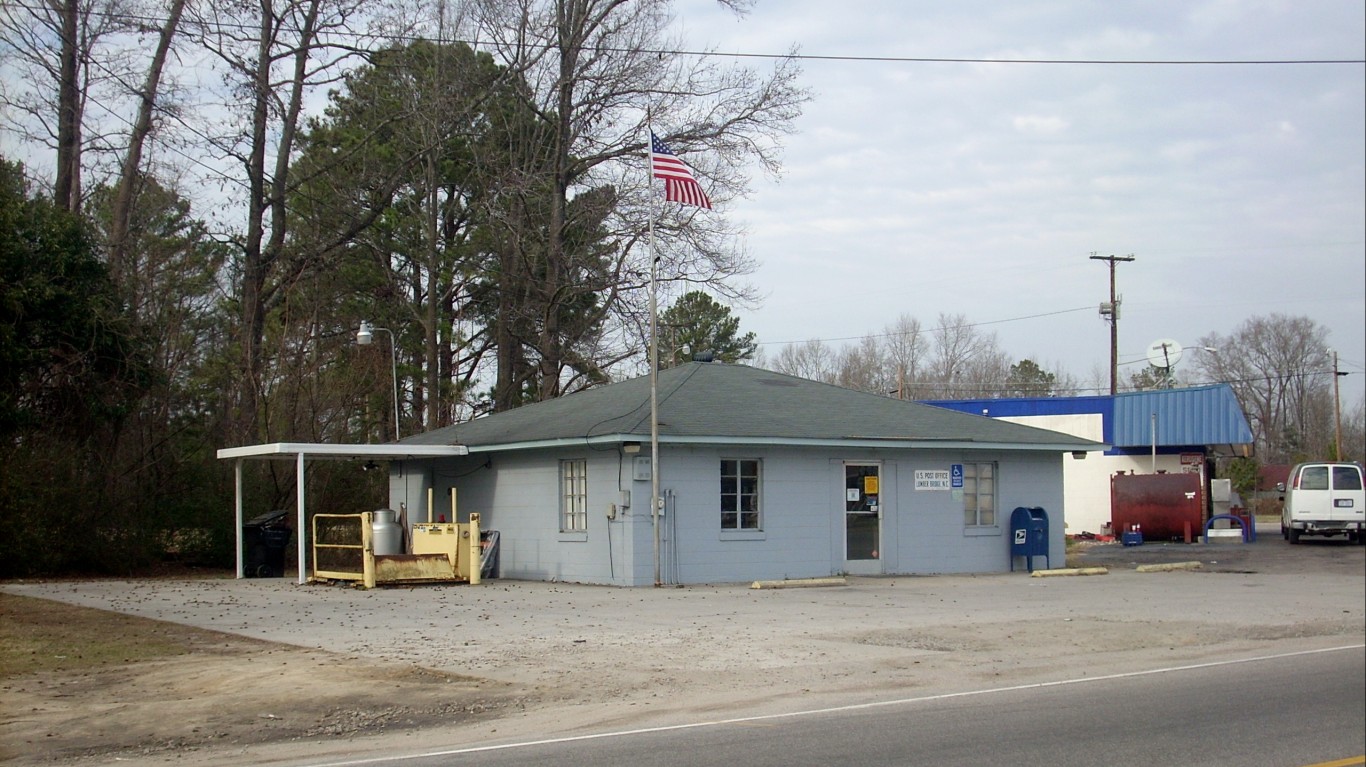
North Carolina’s 9th Congressional District is the only congressional district in the state to rank on this list. It covers the south-central part of the state and runs along the South Carolina border. Black area residents are nearly three times as likely as white residents to live below the poverty line, and the Black unemployment rate is more than double the white unemployment rate.
The area has been served by Republican Dan Bishop since 2019. Bishop has a history in the North Carolina state legislature fighting for deregulation, gun rights, and voter I.D. laws.
[in-text-ad]
24. Maryland’s 1st Congressional District
> Current representative: Rep. Andy Harris (Republican Party)
> Poverty rate: 19.6% Black; 7.4% white
> Unemployment rate: 9.2% Black; 4.4% white
> Homeownership rate: 42.7% Black; 81.7% white
Nearly all of the worst districts for Black Americans are home to a larger share of non-white residents than the share nationwide of 12.6%. Yet this is not the case in Maryland’s 1st Congressional District, where 11.8% of residents do not identify as white.
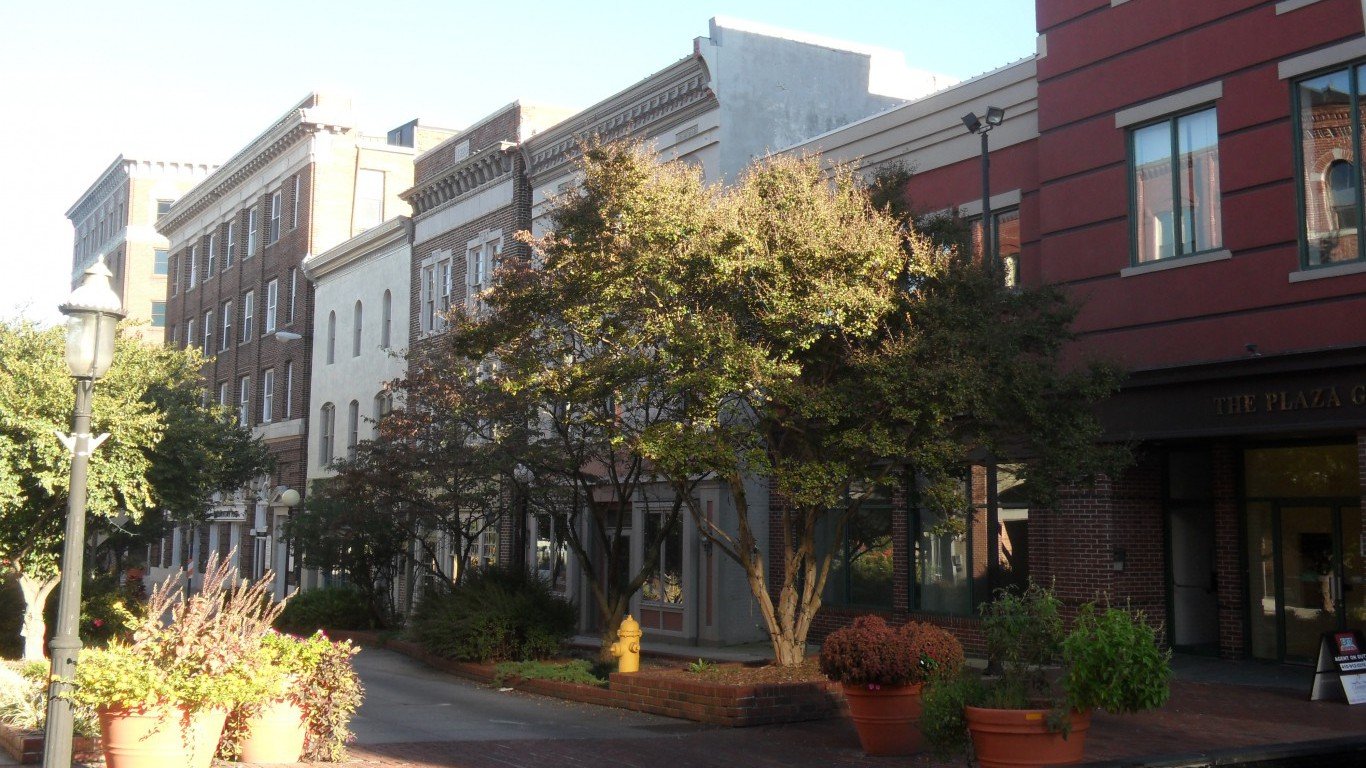
Maryland’s 1st Congressional District covers all of the state’s Eastern Shore area and part of Baltimore. The district is fairly affluent, with a median annual household income of nearly $74,000. Yet Black households typically have an income lower than $43,000, while most white households earn more than $79,000.
[recirclink id=768620]

23. Maryland’s 7th Congressional District
> Current representative: Rep. Kweisi Mfume (Democratic Party)
> Poverty rate: 23.2% Black; 7.2% white
> Unemployment rate: 11.3% Black; 3.9% white
> Homeownership rate: 45.7% Black; 74.0% white
Maryland’s 7th Congressional District extends west and north from Baltimore, surrounding — but not including — the community of Towson. The gerrymandered district is predominantly Black and one of the most racially divided parts of the country by several economic measures. The Black poverty rate in the district of 23.2% is more than triple the white poverty rate of 7.2%. Black workers in the district are also twice as likely to be unemployed as white workers.
The area was served by the late Elijah E. Cummings from 1996 until his passing in 2019. Currently, Democrat Kweisi Mfume serves the 7th District. Mfume formerly worked as the CEO of the NAACP and now sits on the Committee on Homeland Security and the Committee on Small Business.
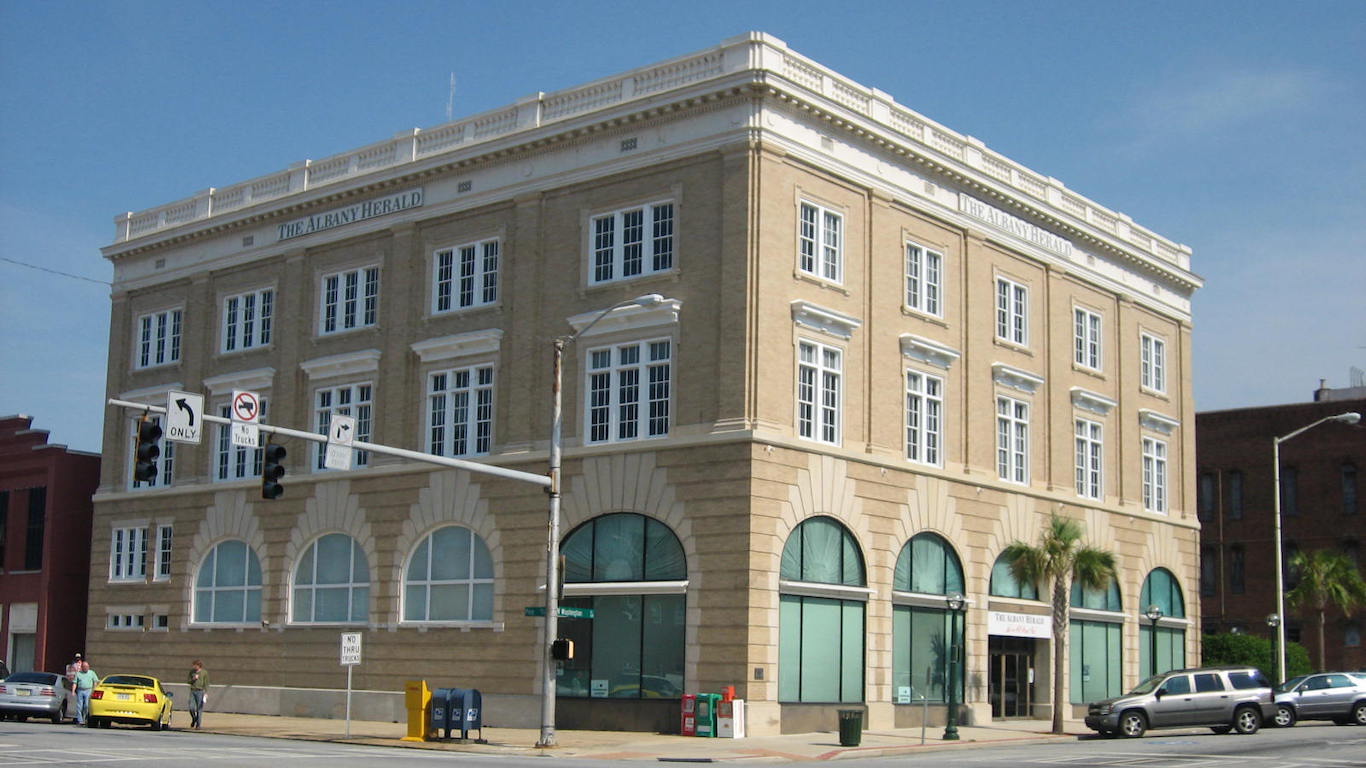
22. Georgia’s 2nd Congressional District
> Current representative: Rep. Sanford D. Bishop Jr. (Democratic Party)
> Poverty rate: 35.4% Black; 14.7% white
> Unemployment rate: 14.2% Black; 6.3% white
> Homeownership rate: 43.0% Black; 70.9% white
The southwestern part of Georgia, comprising the state’s 2nd Congressional District, ranks as one of the worst districts for Black Americans largely because of the unemployment disparity between Black and white members of the labor force. In 2018, the Black unemployment rate was 14.2%, compared to a 6.3% unemployment rate among white workers.
Rep. Sanford D. Bishop Jr. has represented the district since 1993 and serves as the Chairman of the Agriculture, Rural Development, Food and Drug Administration and Related Agencies Appropriations Subcommittee.
[in-text-ad-2]
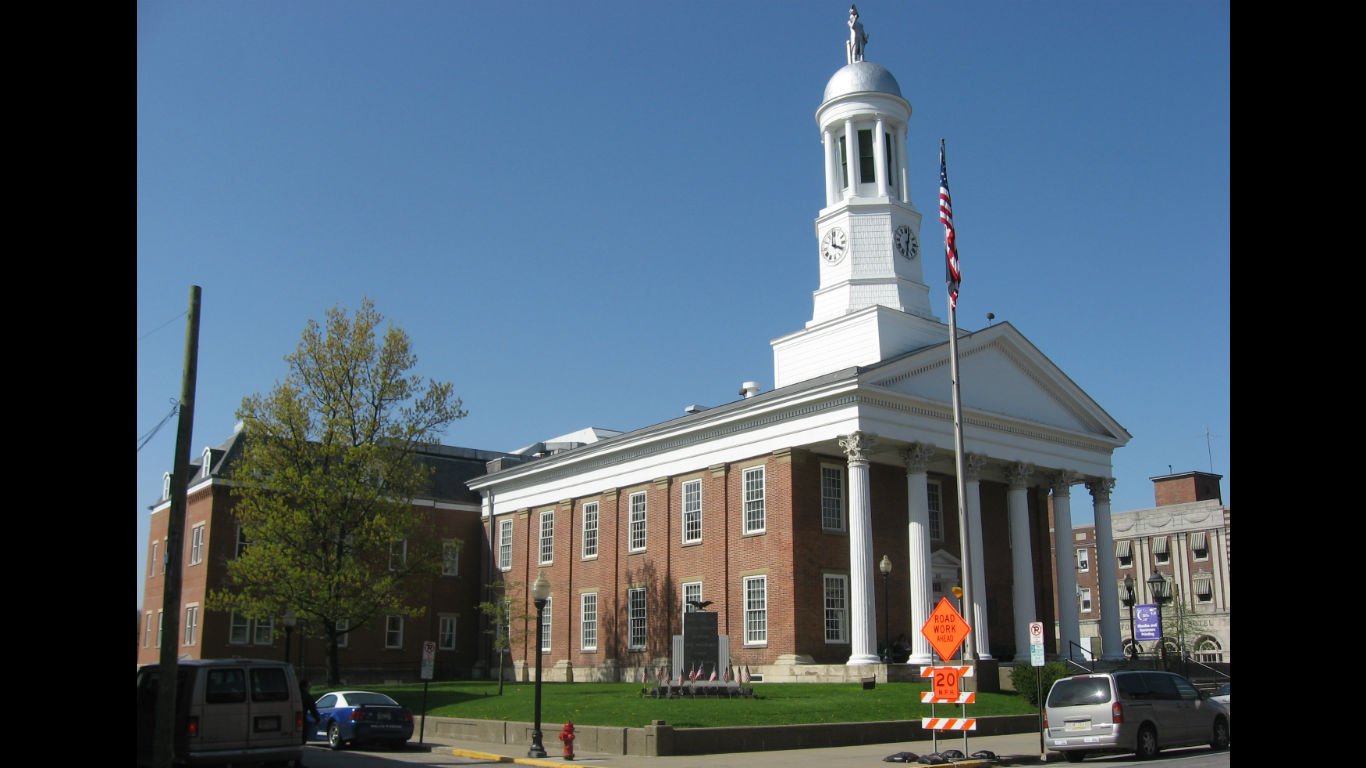
21. Pennsylvania’s 14th Congressional District
> Current representative: Rep. Guy Reschenthaler (Republican Party)
> Poverty rate: 28.8% Black; 10.7% white
> Unemployment rate: 12.8% Black; 4.8% white
> Homeownership rate: 42.1% Black; 77.4% white
Pennsylvania’s 14th Congressional District, located just south of Pittsburgh and extends south and west to the West Virginia state border, is one of two districts in the state with near nation-leading socioeconomic disparities between Black and white residents. Homeownership is one of the most practical ways to build wealth in the United States, and the homeownership rate among Black residents in the district is just 42.1% — compared to 77.4% among white residents. Additionally, most Black households in the area earn less than $33,000 a year, while the median annual income among white households is nearly $58,000.
Since 2019, the district has been served by Republican Guy Reschenthaler, who has worked as an attorney in both the private and public sectors and now sits on the House Judiciary and Foreign Affairs committees.
20. Connecticut’s 4th Congressional District
> Current representative: Rep. James A. Himes (Democratic Party)
> Poverty rate: 16.2% Black; 6.6% white
> Unemployment rate: 12.9% Black; 5.8% white
> Homeownership rate: 38.0% Black; 77.7% white
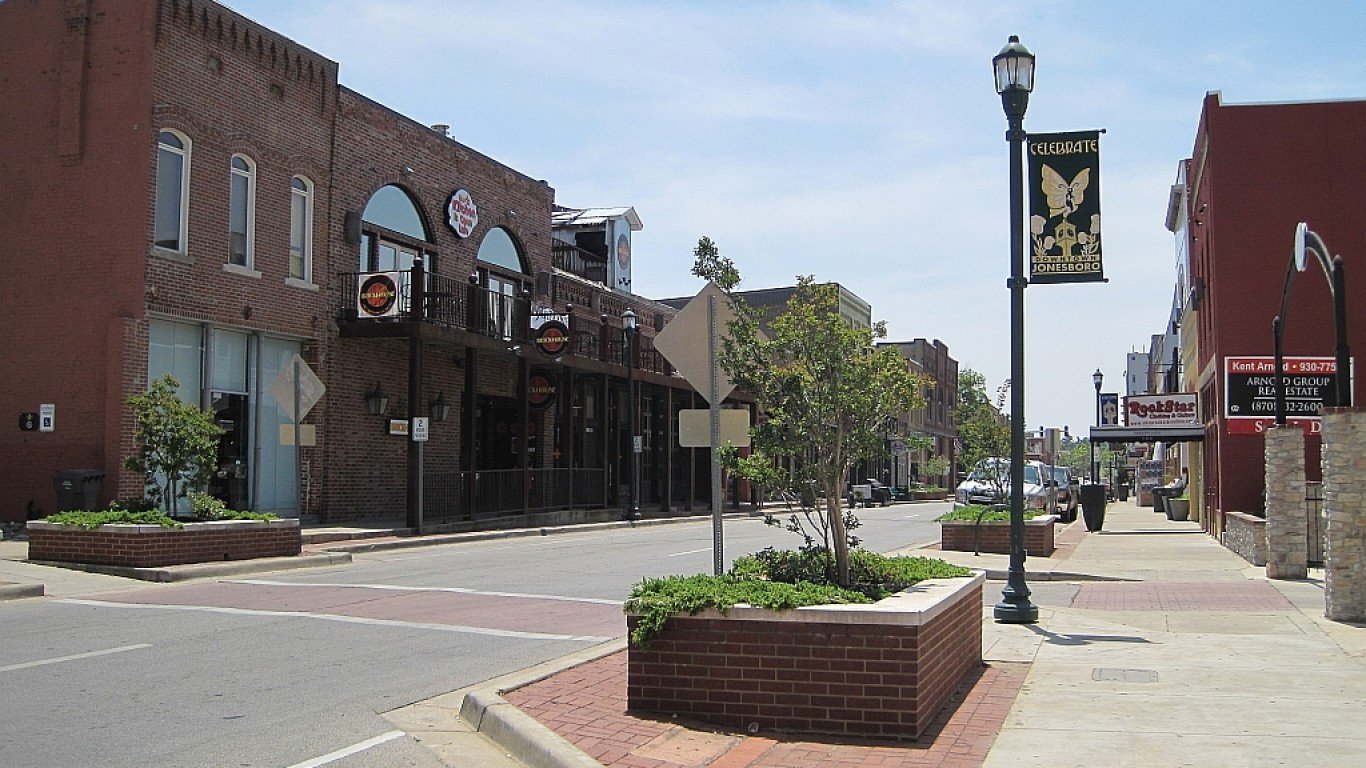
19. Arkansas’ 1st Congressional District (sam) done MA f/c
> Current representative: Rep. Eric A. Crawford (Republican Party)
> Poverty rate: 36.0% Black; 15.8% white
> Unemployment rate: 13% Black; 5.1% white
> Homeownership rate: 40.3% Black; 71.9% white
The 4th Congressional District in Connecticut is the only district in the state and the broader New England region to rank on this list. The district spans the southwest corner of the state, covering the cities of Stamford and Bridgeport. Economic inequality in the district is among the worst in the country — and much of it is along racial lines.
Over 16% of the area’s Black population lives below the poverty line, more than double the 6.6% white poverty rate. Additionally, the typical white household in the area earns nearly $111,000 a year, while the median annual income among black households is $49,458.
Arkansas’s 1st Congressional District covers the entire eastern border of the state and extends as far west as Searcy County. The typical Black household in the district has an income of just $26,585 a year, or over $18,000 less than the median annual income of white households in the district of $44,782. Black district residents are also far more likely to face serious financial hardship than white residents. More than one in every three Black residents live below the poverty line, more than double the poverty rate among white residents of 15.8%.
For nearly a decade, Republican Rick Crawford has represented the district in Washington. Before taking office, Crawford served in the military, competed in rodeos, and started his own broadcasting company. Crawford currently sits on the Agriculture Committee and the House Permanent Select Committee on Intelligence.
[in-text-ad]
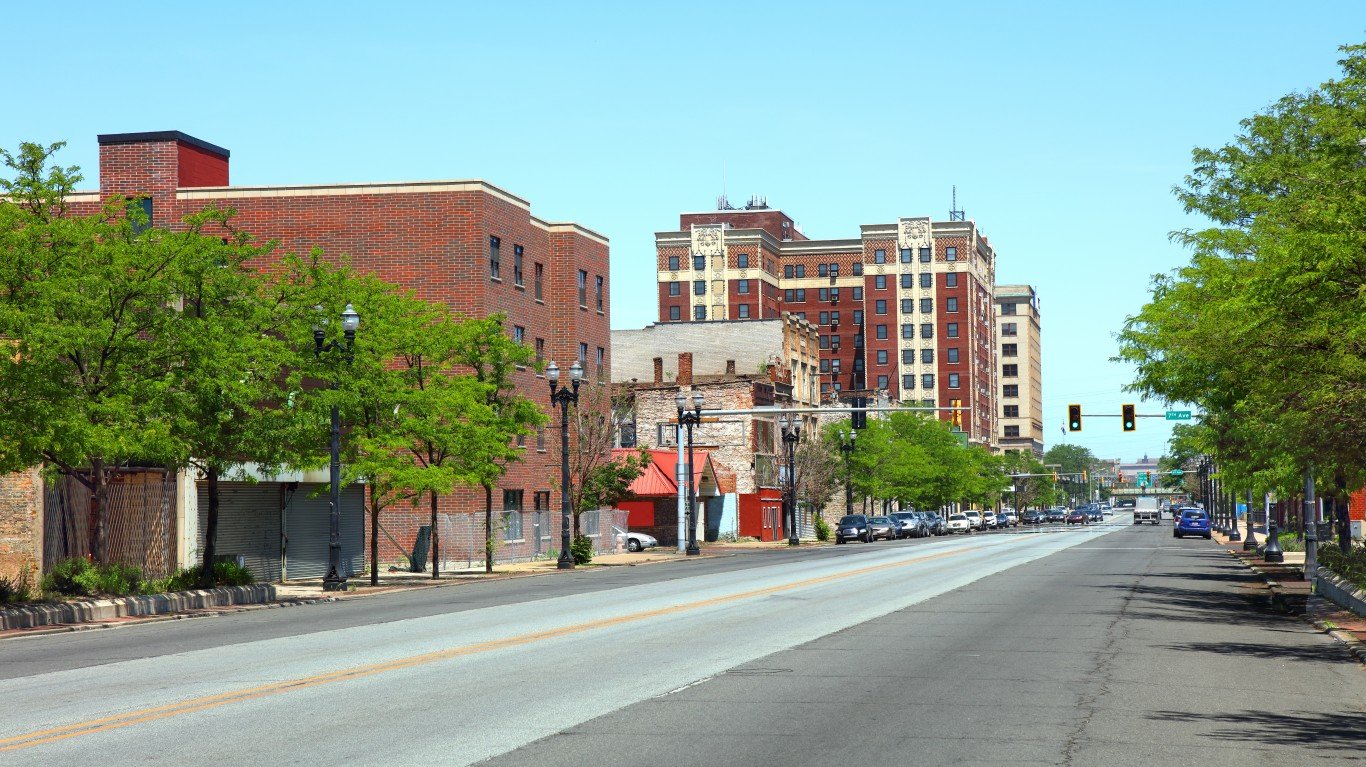
18. Ohio’s 13th Congressional District
> Current representative: Rep. Tim Ryan (Democratic Party)
> Poverty rate: 36.0% Black; 14.3% white
> Unemployment rate: 14.6% Black; 5.7% white
> Homeownership rate: 35.3% Black; 69.3% white
Disparities in socioeconomic measures between white and Black residents of Ohio’s 13th Congressional District are glaring. Unemployment among Black workers in the area stands at 14.6%, nearly three times the white unemployment rate of 5.7%. Similarly, 36.0% of Black area residents live below the poverty line, more than double the 14.3% poverty rate among white residents.
Democratic Rep. Tim Ryan has served in Congress since 2003 and has represented the 13th Congressional District of Ohio since 2013. The district is located in northern Ohio and covers sections of the state from Youngstown west to Akron.
[recirclink id=710529]
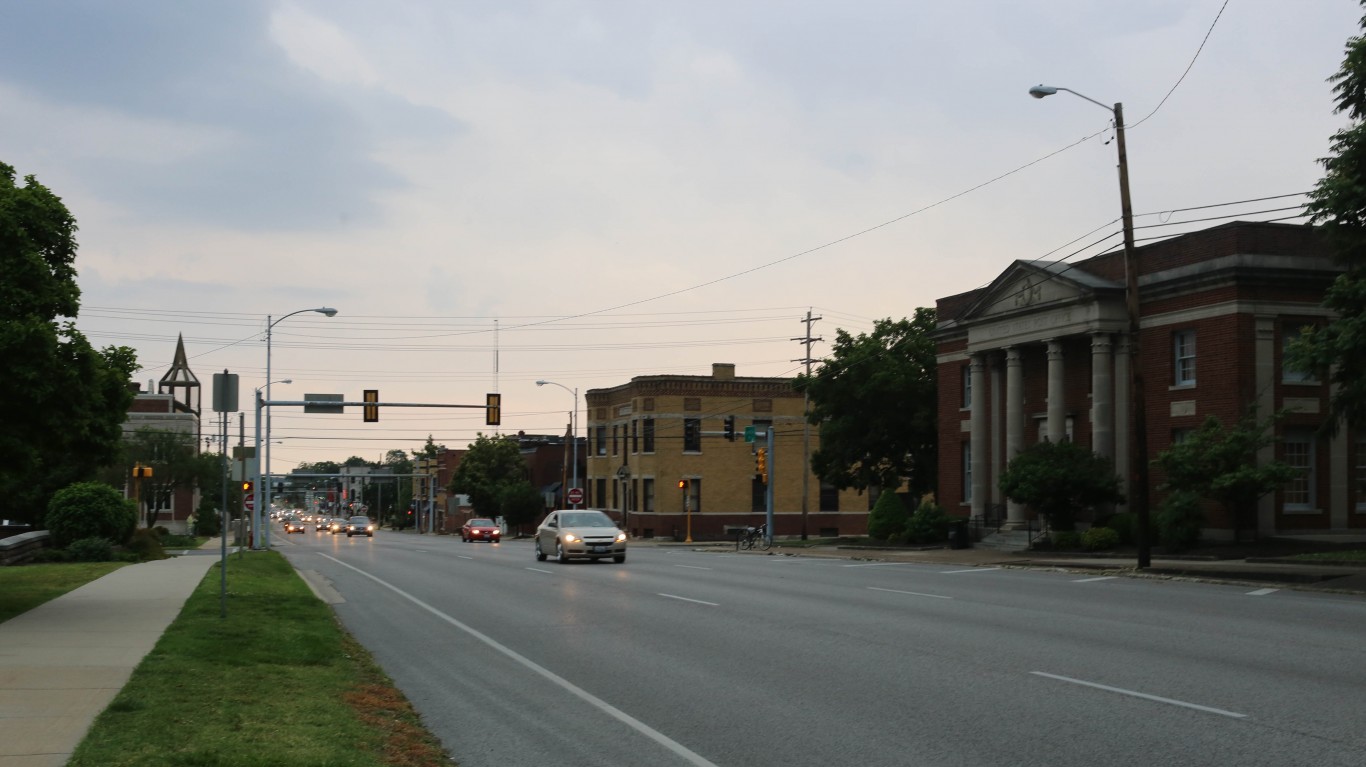
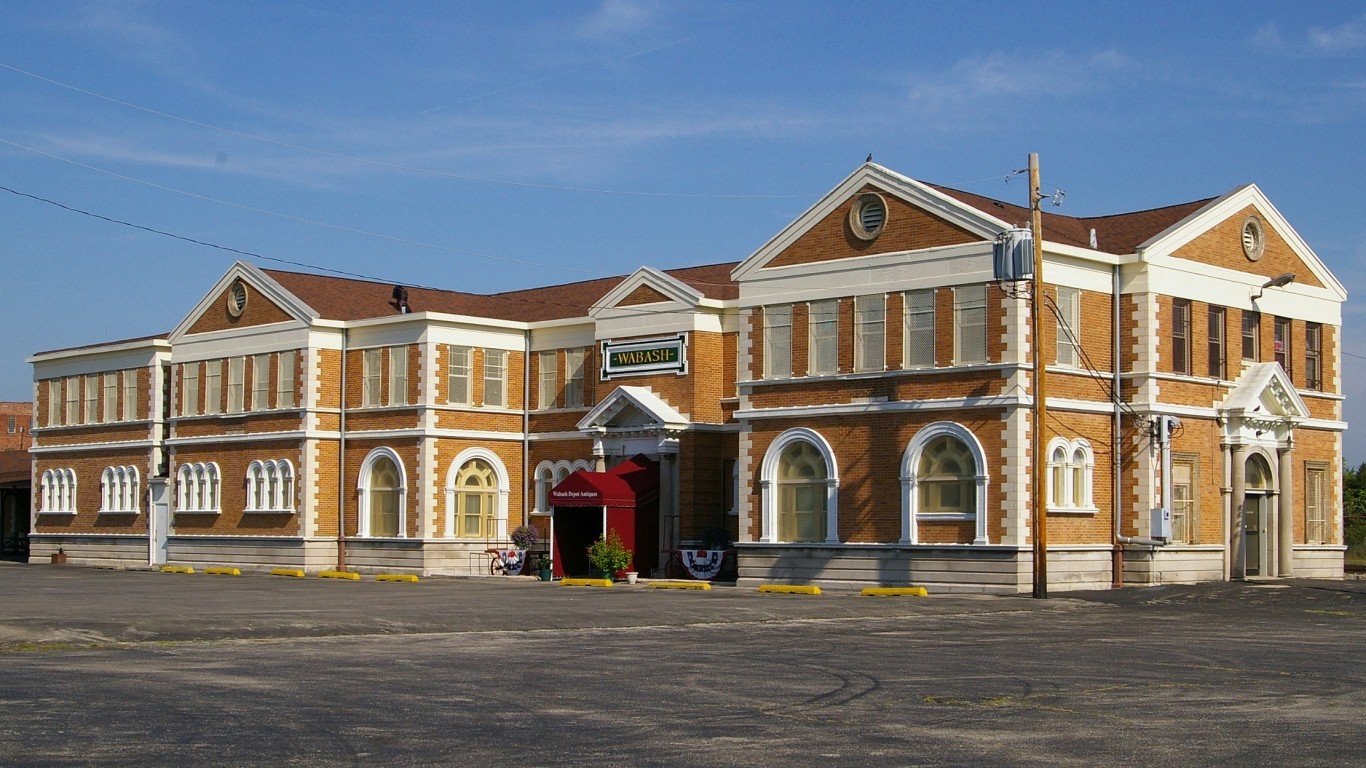
17. Indiana’s 1st Congressional District
> Current representative: Rep. Peter J. Visclosky (Democratic Party)
> Poverty rate: 30.4% Black; 9.9% white
> Unemployment rate: 13.4% Black; 5.6% white
> Homeownership rate: 43.4% Black; 80.3% white
Indiana’s 1st Congressional District is located in the northwestern corner of the state and includes the city of Gary. Rust Belt cities like Gary are among the most racially segregated in the country — and segregated communities often have the worst economic disparities along racial lines. Black area residents are three times more likely to live below the poverty line than their white counterparts and more than twice as likely to be unemployed.
Democrat Pete Visclosky, who has served in Congress since 1985, represents the district and has made revitalizing local industry a top priority. Visclosky is a member of the House Appropriations Committee and serves as the Chairman of the Defense Appropriations Subcommittee. He is not seeking reelection in 2020.
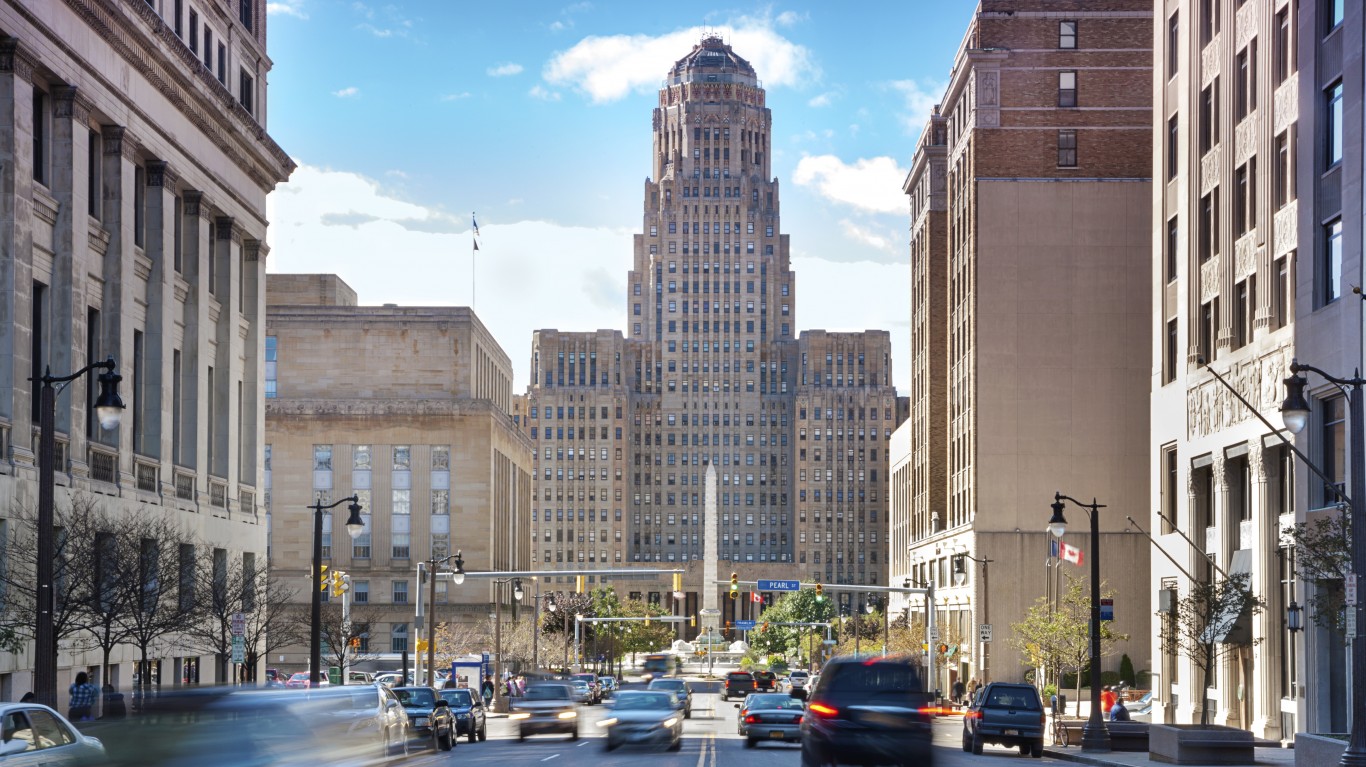
16. New York’s 26th Congressional District
> Current representative: Rep. Brian Higgins (Democratic Party)
> Poverty rate: 33.2% Black; 11.8% white
> Unemployment rate: 10.8% Black; 4.2% white
> Homeownership rate: 32.1% Black; 68.9% white
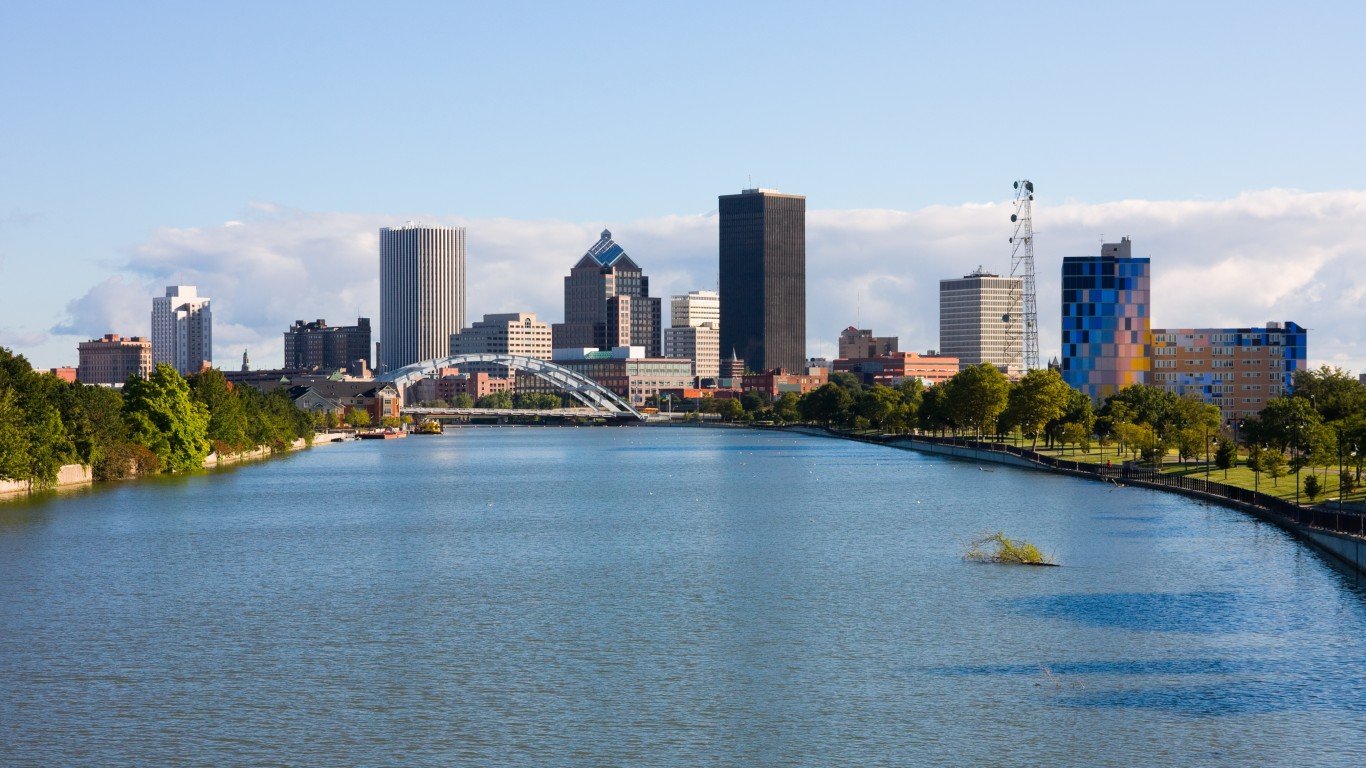
New York’s 26th Congressional District covers the western tip of the state, in the area around Buffalo.
Less than one-third of Black district residents own their own home, compared to 69% of white residents. This 37 percentage point home ownership gap is higher than the 30 percentage point gap nationwide. White district residents are also more than twice as likely to have at least a bachelor’s degree than Black residents, with a bachelor’s degree attainment rate of 34.7% among white adults and 16.7% among Black adults. There is also a severe income disparity, with the typical Black household earning about $26,400 less per year than the typical white household.
[in-text-ad-2]
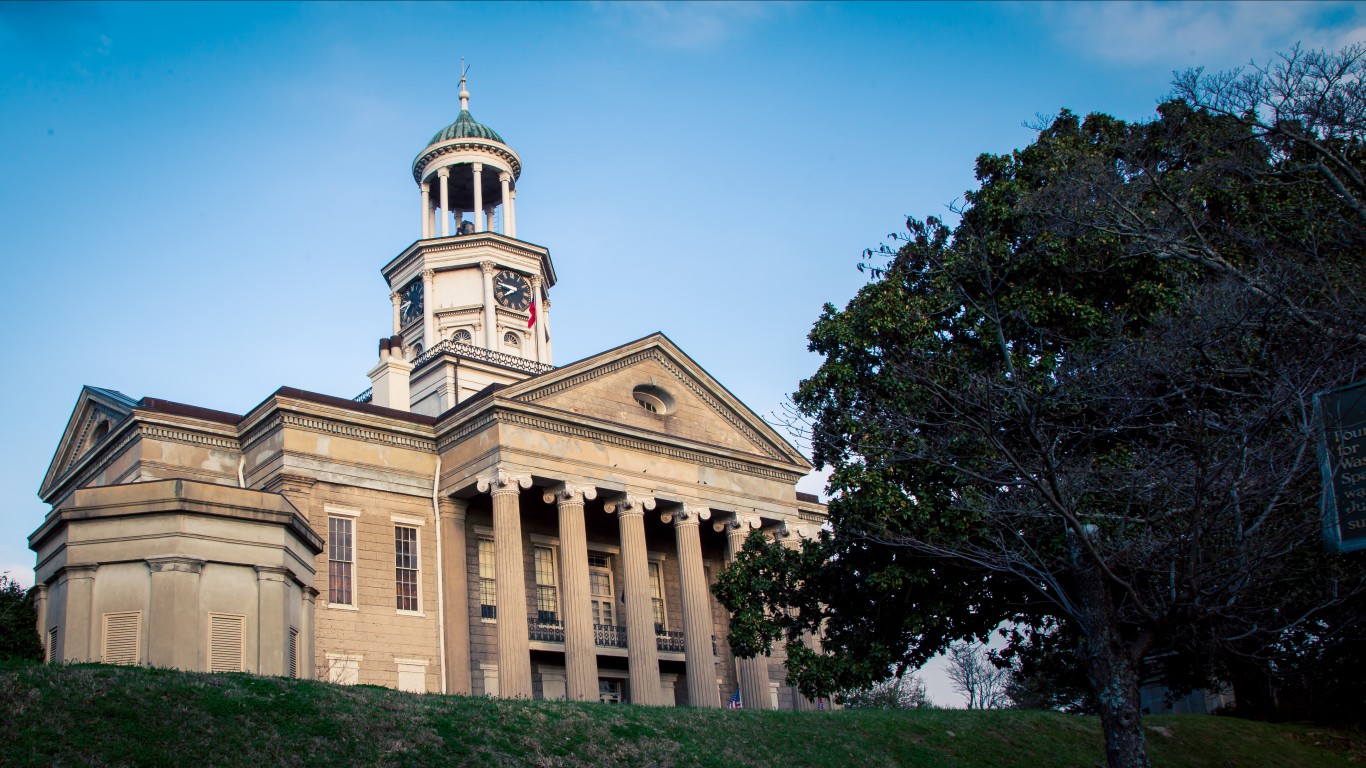
15. Mississippi’s 2nd Congressional District
> Current representative: Rep. Bennie G. Thompson (Democratic Party)
> Poverty rate: 34.5% Black; 12.6% white
> Unemployment rate: 14.1% Black; 6.1% white
> Homeownership rate: 52.1% Black; 80.3% white
The 2nd District in Mississippi is a geographically large, majority-Black area covering the Mississippi Delta and much of the state’s border with Arkansas and Louisiana. In the district, only about three out of every four Black adults have a high school diploma, compared to over 87% of white adults. Disparities in education tend to have economic consequences. The typical white household in the district earns $53,893 a year, nearly double the median income of $28,203 among Black households.
Democrat Rep. Bennie Thompson has served the district since 1993 and is the longest serving elected official who is African American in Mississippi.

14. New Jersey’s 2nd Congressional District
> Current representative: Rep. Jefferson Van Drew (Republican Party)
> Poverty rate: 25.5% Black; 9.4% white
> Unemployment rate: 13.4% Black; 6.8% white
> Homeownership rate: 44.3% Black; 81.9% white
New Jersey’s 2nd Congressional District covers the southern end of the state and includes Atlantic City and Cape May. The district has some of the worst socioeconomic disparities along racial lines in the country. More than one in every four Black district residents live below the poverty line — compared to fewer than one in every 10 white residents. Additionally, the Black unemployment rate of 13.4% is nearly double the white unemployment rate of 6.8%.
Republican Rep. Jefferson Van Drew currently serves the district. Van Drew took office in 2019 after winning the 2018 election. Van Drew is a dentist and previously served in the state legislature. Rep. Frank LoBiondo, who opted not to run in 2018, had held the seat since 1995.
[in-text-ad]
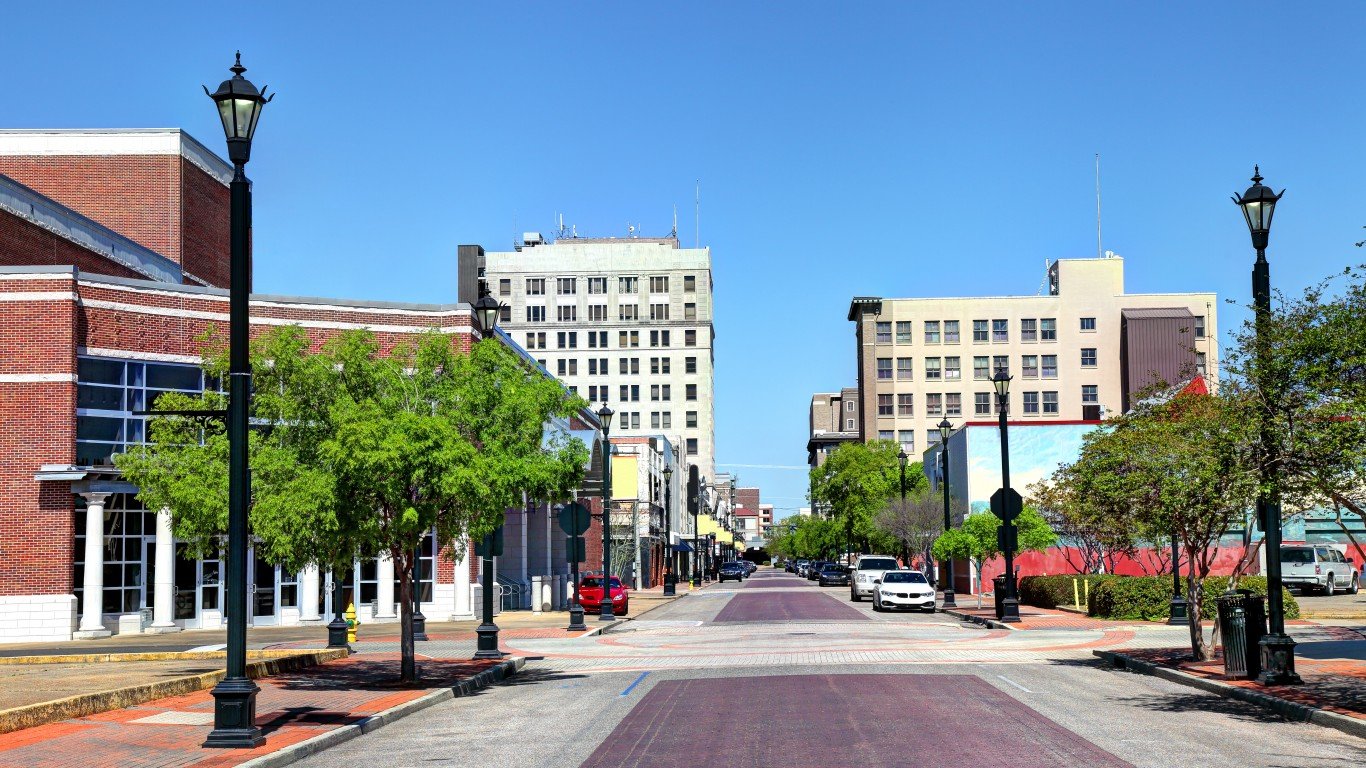
13. Louisiana’s 5th Congressional District
> Current representative: Rep. Ralph Lee Abraham (Republican Party)
> Poverty rate: 41.1% Black; 15.8% white
> Unemployment rate: 11.6% Black; 5.4% white
> Homeownership rate: 44.1% Black; 75.3% white
Louisiana’s 5th Congressional District is a geographically large district that covers much of the state’s eastern border and includes the cities of Monroe and Alexandria. Across the district, 41.1% of Black residents live below the poverty line compared to 15.8% of white residents. Such disparities are partially the result of disparate conditions in the labor market. The 11.6% unemployment rate among the Black members of the labor force is more than double the 5.4% jobless among the district’s white members of the labor force.
Republican Rep. Ralph Abraham has served the district since 2015. He had an unsuccessful bid for governor of the state in 2019 and is not running for reelection for his congressional seat this year in adherence to his self imposed term limit.
[recirclink id=803128]
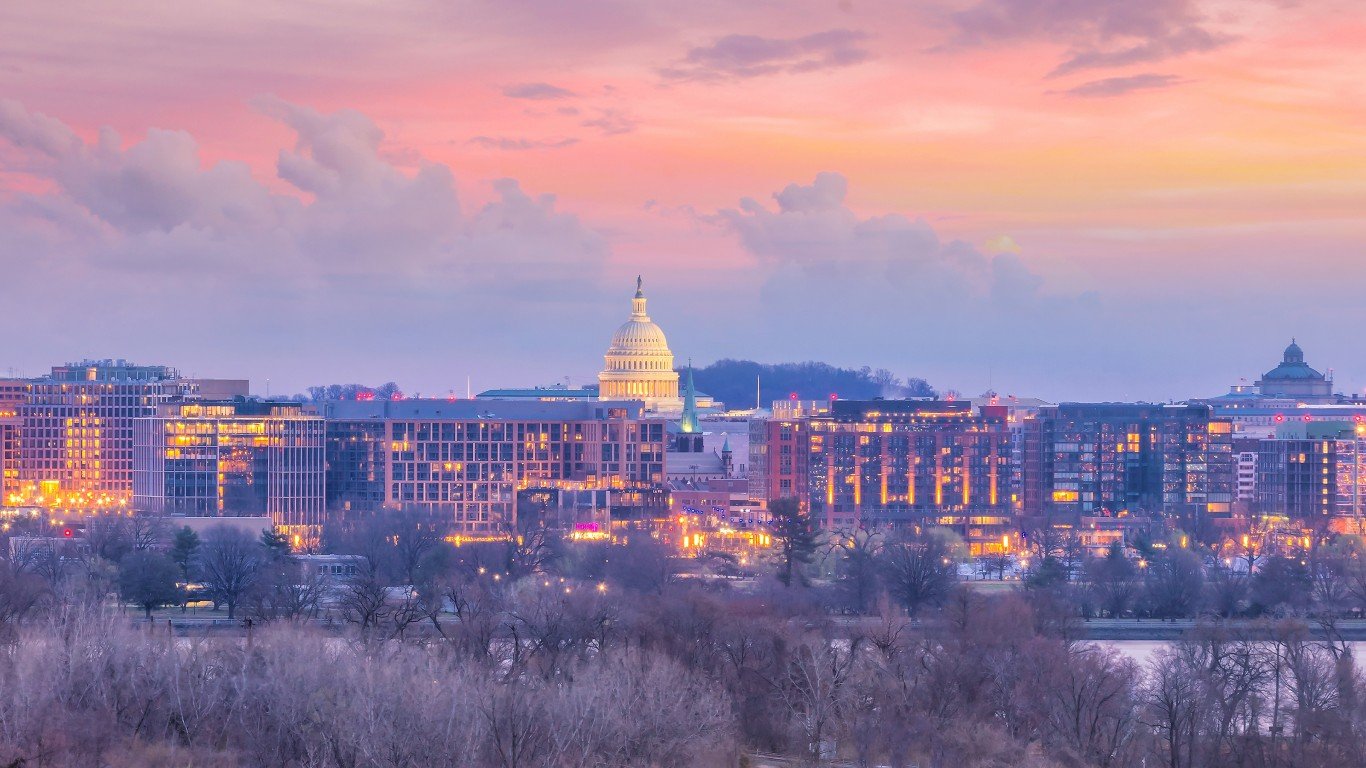
12. District of Columbia’s Congressional District
> Current representative: Delegate Eleanor Holmes Norton (Democratic Party)
> Poverty rate: 25.7% Black; 6.9% white
> Unemployment rate: 14.0% Black; 2.8% white
> Homeownership rate: 36.3% Black; 50.2% white
Washington D.C. has one of the best job markets in the country — at least for white members of the labor force. According to the U.S. Census Bureau, the white unemployment rate stands at 2.8% — well below the 4.9% jobless rate among white Americans nationwide. Black members of the labor force in the city, however, face a much different reality. The unemployment rate among Black members of the labor force in Washington stands at 14.0% — well above the 10.6% unemployment rate among Black members of the labor force nationwide.
Since Washington D.C. is not a state, its residents are not represented on Capitol Hill by senators or House members. Rather, Washington has a single delegate who does not have the same power or voting privileges as a legislator from one of the 50 states. The district has been represented by Eleanor Holmes Norton since 1991.

11. Pennsylvania’s 13th Congressional District
> Current representative: Rep. John Joyce (Republican Party)
> Poverty rate: 33.0% Black; 11.4% white
> Unemployment rate: 12.1% Black; 5.0% white
> Homeownership rate: 29.7% Black; 75.5% white
In Pennsylvania’s 13th Congressional District, in the southern part of the state, the typical white household earns nearly $22,000 more than the typical Black household. This may be due in part to the fact that Black members of the labor force are more than twice as likely to be unemployed as white members of the labor force, with the unemployment rates at 12.1% and 5.0%, respectively.
The white homeownership rate in the district is 75.5% while the Black homeownership rate is less than 30%. This is a 46 percentage point homeownership gap, much higher than even the 30 percentage point nationwide disparity.
[in-text-ad-2]
10. Illinois’ 12th Congressional District
> Current representative: Rep. Mike Bost (Republican Party)
> Poverty rate: 35.7% Black; 13.3% white
> Unemployment rate: 14.1% Black; 5.9% white
> Homeownership rate: 38.1% Black; 73.6% white
Nationwide, 24.2% of Black Americans live in poverty, compared to 11.6% of white Americans — a 12.6 percentage point gap. In Illinois’ 12th Congressional District, which covers the southwestern portion of the state, 35.7% of Black residents live below the poverty line, compared to 13.3% of white residents — a 22.4 percentage point gap. This gap in the poverty rates is one of the reasons this area ranks as one of the 10 worst districts for Black Americans.
White residents also typically earn nearly twice the income Black residents do in this part of Illinois. Black householders have a median income of $27,779, compared to a median of $53,853 for white householders.
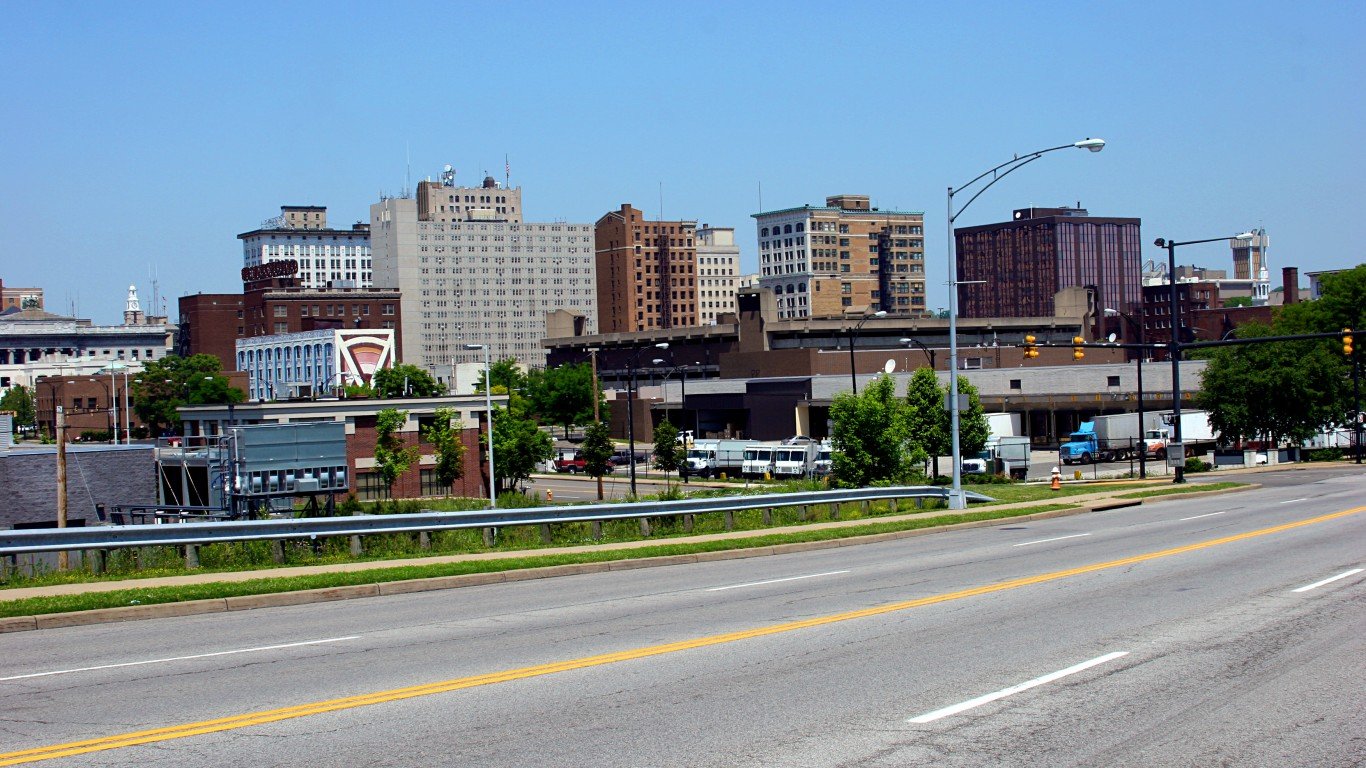
9. Ohio’s 9th Congressional District
> Current representative: Rep. Marcy Kaptur (Democratic Party)
> Poverty rate: 37.2% Black; 15.1% white
> Unemployment rate: 16.2% Black; 6.4% white
> Homeownership rate: 29.8% Black; 67.1% white
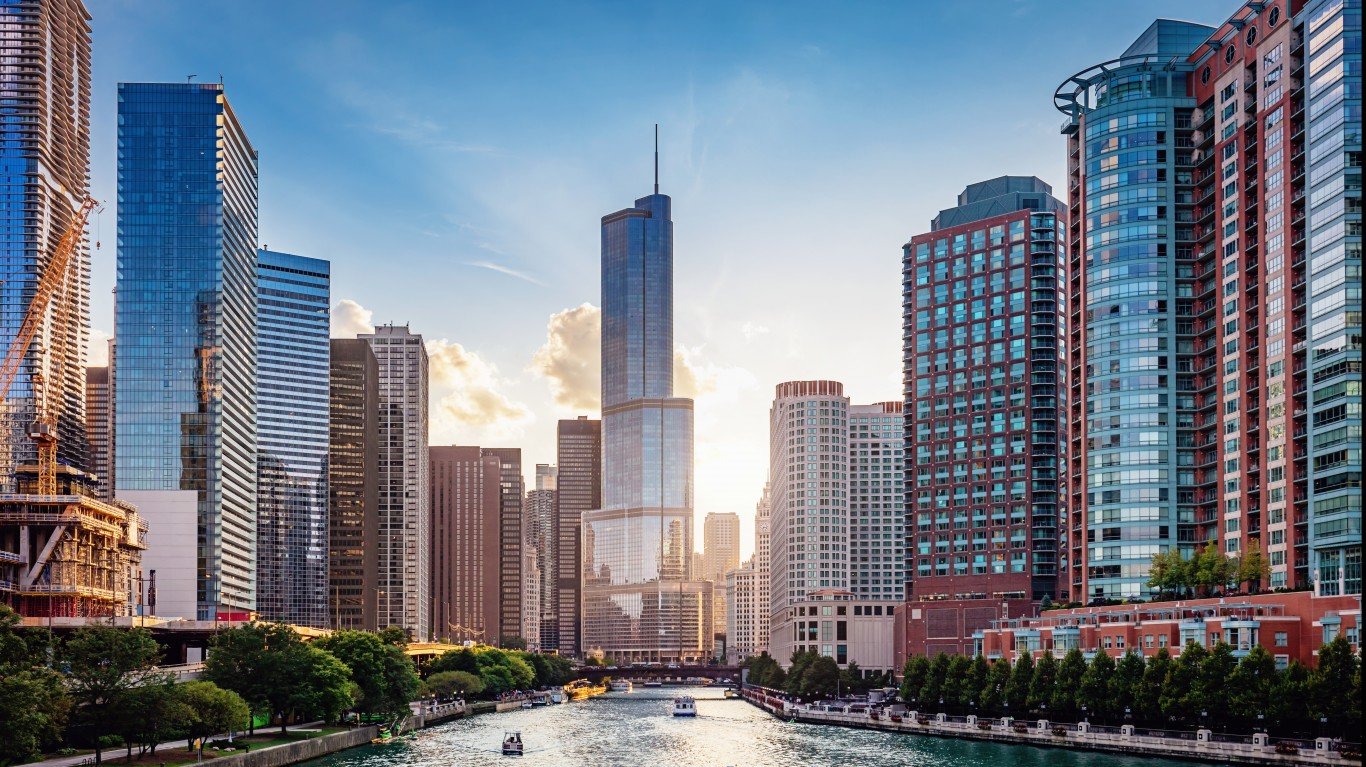
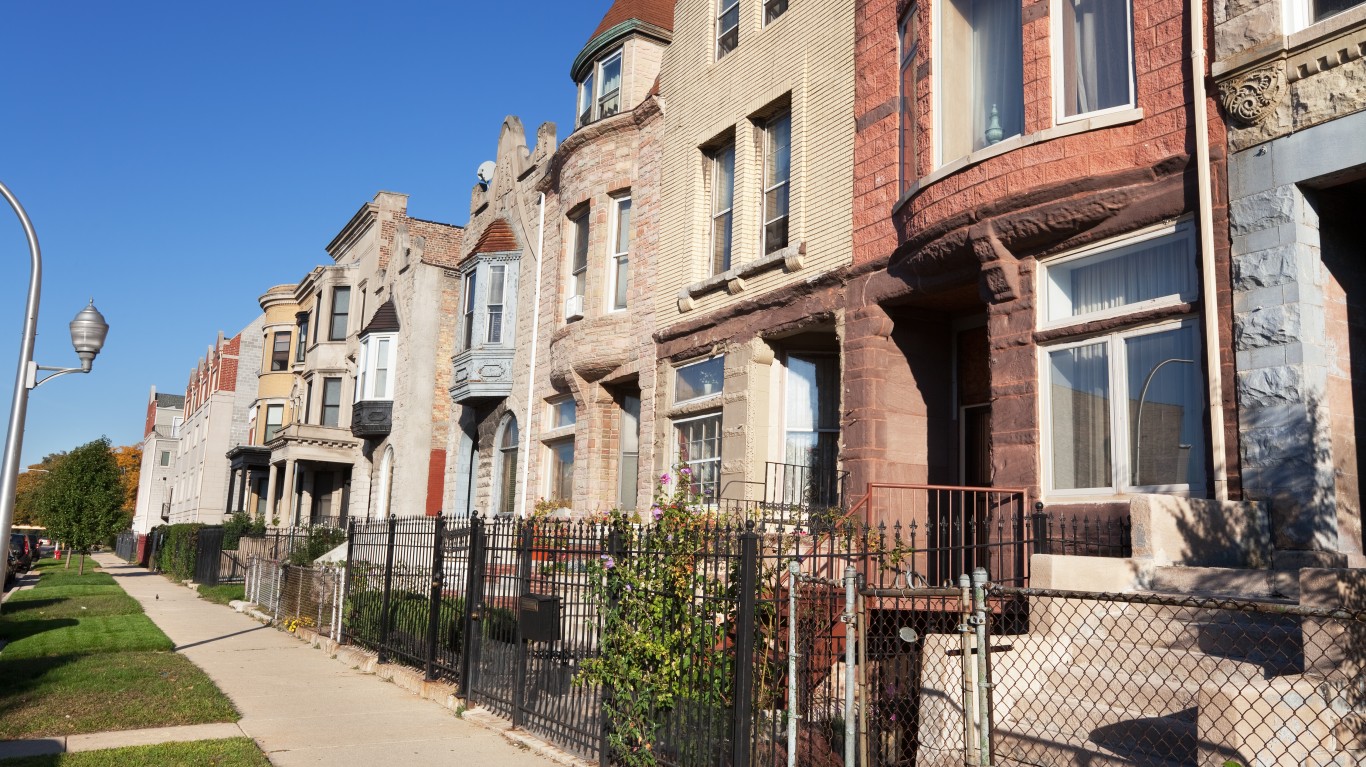
8. Illinois’ 7th Congressional District (Sam) done MA f/c
> Current representative: Rep. Danny K. Davis (Democratic Party)
> Poverty rate: 31.8% Black; 10.3% white
> Unemployment rate: 17.8% Black; 4.5% white
> Homeownership rate: 30.7% Black; 53.6% white
Ohio’s 9th Congressional District is located on the northern border of the state along Lake Erie, stretching from Toledo eastward nearly to Cleveland. The median income among the predominantly white district’s Black households is just $26,624 a year, well below the median annual income among white households of $49,249. Homeownership is a practical way for many American families to build wealth, and in this district, the black homeownership rate of 29.8% is less than half the white homeownership rate of 67.1%.
The district is represented by Marcy Kaptur, a Democrat. Kaptur took office in 1983 — making her the longest serving woman in the history of the U.S. House of Representatives.
Illinois’s 7th Congressional District includes Chicago and stretches westward into the interior of the state. A history of exclusionary zoning, redlining, and discriminatory lending practices in Chicago throughout the 20th century has led to deeply entrenched segregation in and around the city and contributed to some of the largest racial disparities in income and education of any congressional district.
The typical Black household in the district has an income of just $30,363 a year, less than a third of the median income of $96,163 among white area households. Income is closely tied to educational attainment, and just 17.2% of Black adults in the district have a bachelor’s degree compared to 75.0% of white adults.
[in-text-ad]
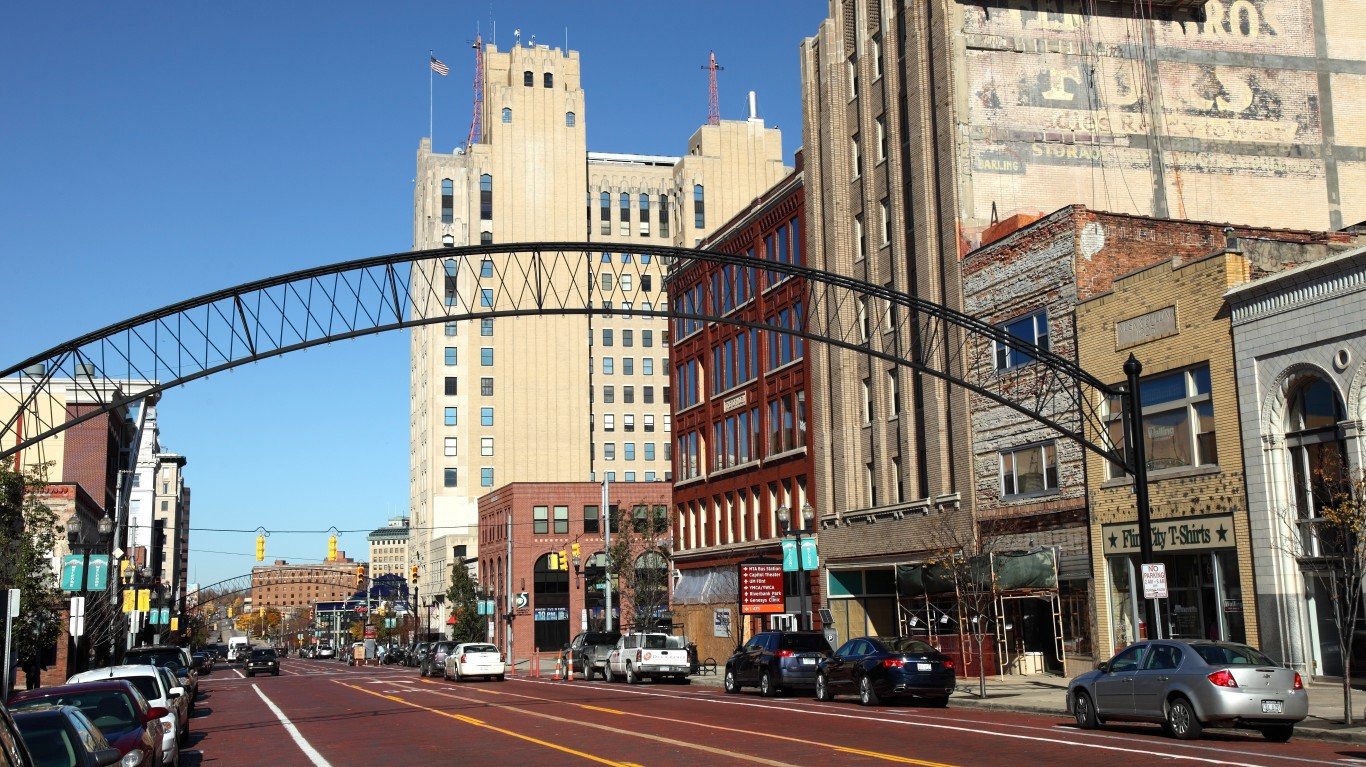
7. Michigan’s 5th Congressional District
> Current representative: Rep. Daniel T. Kildee (Democratic Party)
> Poverty rate: 37.0% Black; 15.2% white
> Unemployment rate: 20.2% Black; 7.0% white
> Homeownership rate: 46.7% Black; 77.1% white
Michigan’s 5th Congressional District covers much of the eastern portion of the state, bordering Lake Huron. The district has relatively low incomes for all groups. The median household income in the district of $45,375 is nearly $15,000 lower than the national median household income. Yet the median income among Black households in the district is less than $29,000 per year, compared to a median of nearly $50,000 for white households.
This may be due in part to the fact that the district’s Black unemployment rate is 20.2%, compared to just 7.0% for white members of the labor force. Nationwide, the Black unemployment rate is 10.6%, and 4.9% among white workers.
[recirclink id=738598]
6. Illinois’ 13th Congressional District
> Current representative: Rep. Rodney Davis (Republican Party)
> Poverty rate: 36.8% Black; 14.6% white
> Unemployment rate: 13.3% Black; 4.9% white
> Homeownership rate: 28.8% Black; 70.9% white
Illinois’s 13th Congressional District is located partially along the state’s western border with Missouri and extends east into the center of the state. The district is predominantly white, and socioeconomic outcomes are heavily lopsided along racial lines. The poverty rate among the area’s Black population of 36.8% is more than double the white poverty rate of 14.6%. Black residents of the 13th District are also far less likely than white residents to own their home. The black homeownership rate of 28.8% is less than half the white homeownership rate of 70.9%. Republican Rep. Rodney Davis has represented the district since 2013.
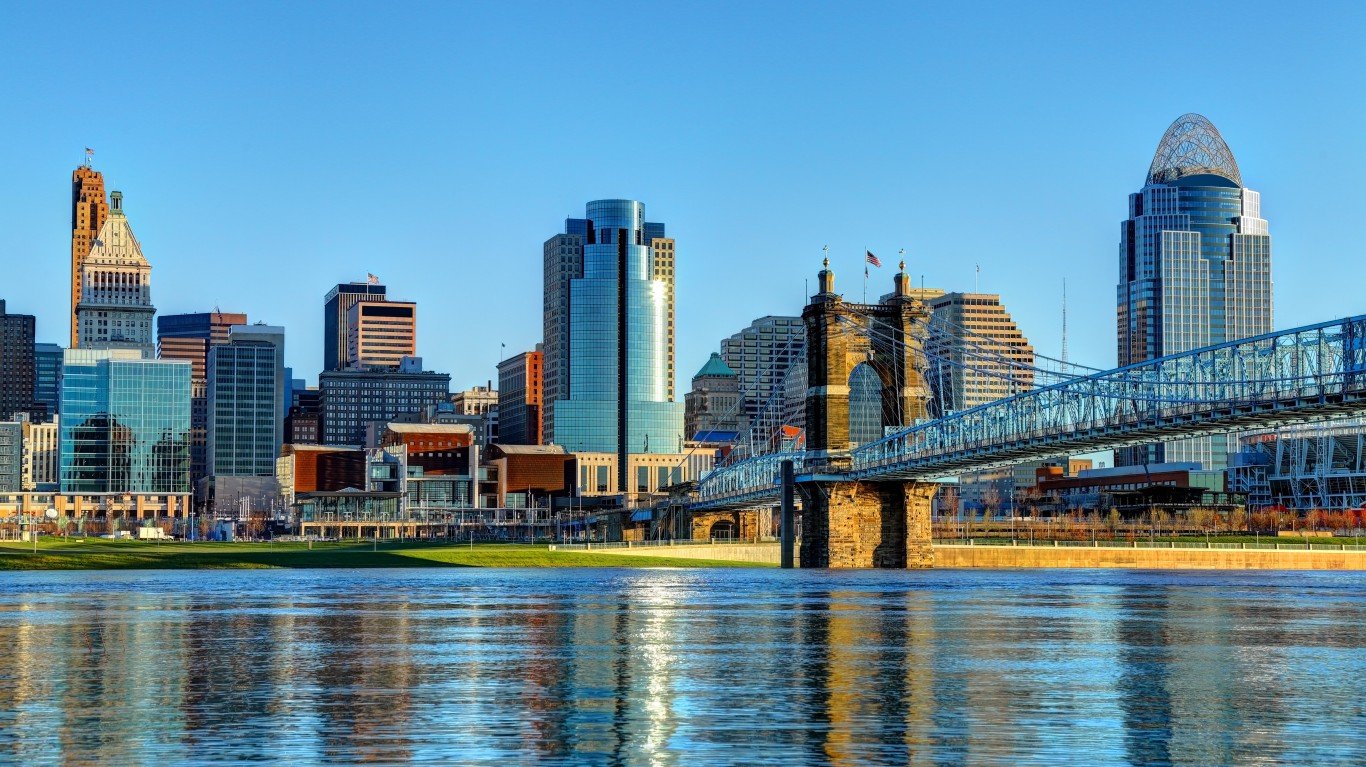
5. Ohio’s 1st Congressional District
> Current representative: Rep. Steve Chabot (Republican Party)
> Poverty rate: 33.6% Black; 9.1% white
> Unemployment rate: 13.1% Black; 4.2% white
> Homeownership rate: 30.9% Black; 73.2% white
Ohio’s 1st Congressional District has the worst disparities along racial lines of any district in the state. The district covers much of the city of Cincinnati and borders Kentucky and Indiana. Republican Rep. Steve Chabot has served the majority-white district since 2011. Chabot also represented the district between 1995 and 2008, the year he lost his bid for reelection.
The typical Black household in the area has an income of less than $29,000 a year, while the median income for white households in the district is nearly $70,000 annually. Black area residents are also more than three times as likely to be unemployed and live in poverty as white residents.
[in-text-ad-2]
4. Illinois’ 1st Congressional District
> Current representative: Rep. Bobby L. Rush (Democratic Party)
> Poverty rate: 25.9% Black; 8.0% white
> Unemployment rate: 17.8% Black; 5.5% white
> Homeownership rate: 43.5% Black; 82.8% white
Illinois’ 1st Congressional District covers much of the south side of Chicago and the suburbs outside of the city. White residents of this district tend to be fairly affluent, while Black residents generally are not. The median household income for white households in the district is $76,764, over $16,000 higher than the overall national median household income. Yet Black households typically have an income less than half white district households, at just over $37,000.
Black members of the labor force in this district are more than three times as likely to be unemployed as white workers in the area, with a 17.8% unemployment rate compared to a 5.5% among whites.
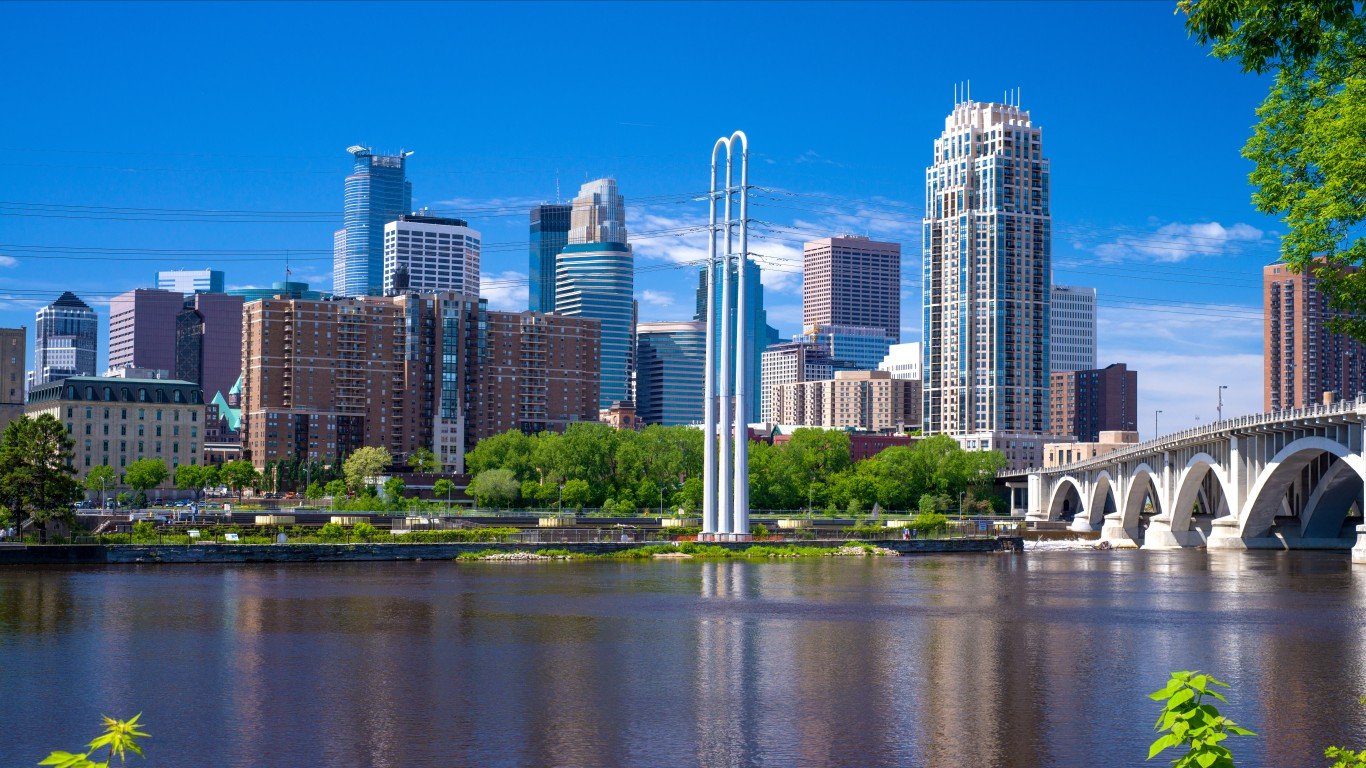
3. Minnesota’s 5th Congressional District
> Current representative: Rep. Ilhan Omar (Democratic Party)
> Poverty rate: 36.3% Black; 9.6% white
> Unemployment rate: 11.2% Black; 3.6% white
> Homeownership rate: 19.5% Black; 63.0% white
Minnesota’s 5th Congressional District covers the city of Minneapolis. Rep. Ilhan Omar was elected to represent the district in 2018. Omar is the Somali-American woman ever to serve in the U.S. Congress.
Black area residents are more than three times more likely to live below the poverty line than white residents and more than three times more likely to be unemployed. Disparate outcomes along racial lines in the district are largely the legacy of historic racism. Minneapolis is one of several Midwestern cities that enacted restrictive housing covenants and exclusionary zoning policies in the early to mid 20th century. These policies continue to impact residential patterns to this day.
[in-text-ad]
2. New York’s 25th Congressional District
> Current representative: Rep. Joseph D. Morelle (Democratic Party)
> Poverty rate: 34.9% Black; 9.8% white
> Unemployment rate: 14.2% Black; 4.4% white
> Homeownership rate: 31.7% Black; 72.3% white
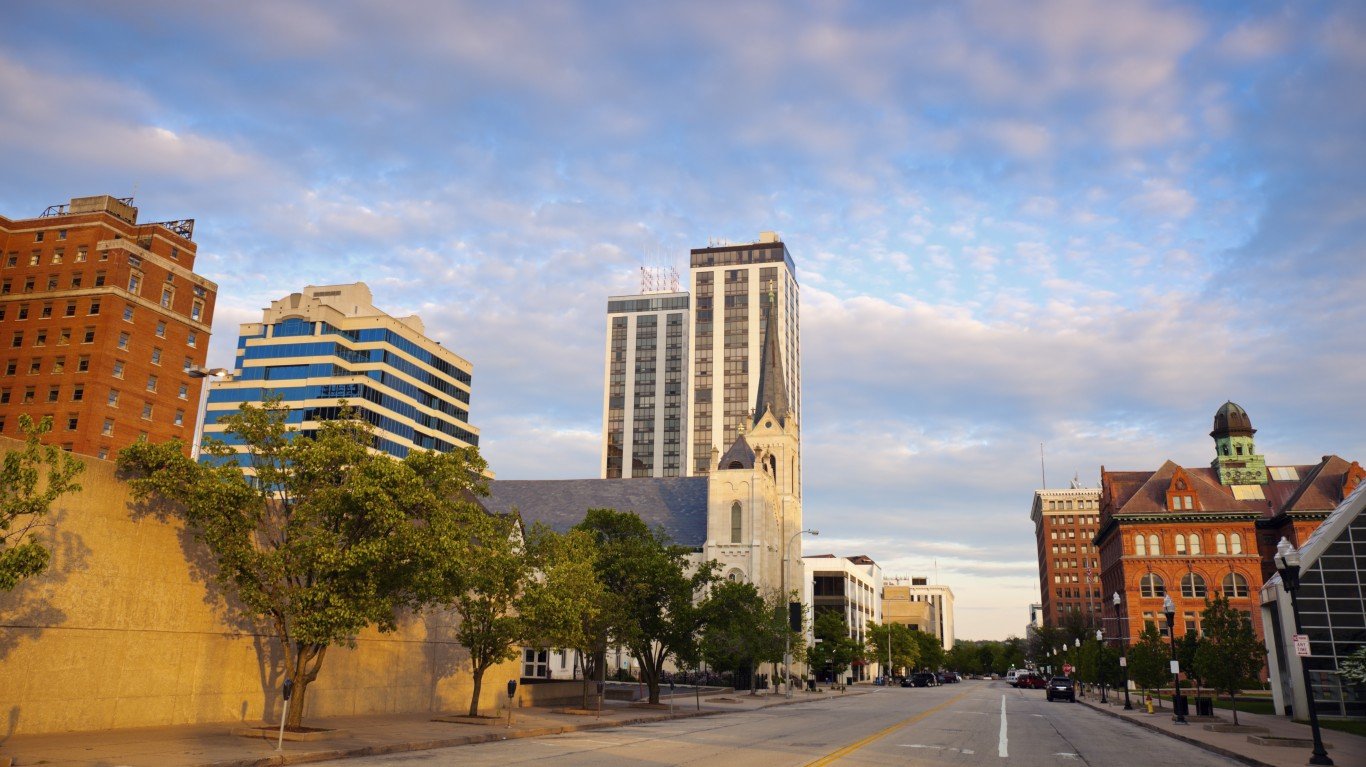
The 25th Congressional District in New York borders Lake Ontario and includes the city of Rochester. Segregation leads to disparate outcomes, and Rochester schools are highly segregated. Only 10% of students in the school district are white, compared to over 80% of students in nearby Penfield.
Currently, over 94% of white adults in the district have a high school diploma, compared to just 77.6% of Black adults. Education is closely linked to income, and more than one in every three Black district residents live below the poverty line, compared to less than one in every 10 white residents. The district’s seat is currently held by Rep. Joseph Morelle, a Democrat.
[recirclink id=801221]
1. Illinois’ 17th Congressional District
> Current representative: Rep. Cheri Bustos (Democratic Party)
> Poverty rate: 39.3% Black; 13.6% white
> Unemployment rate: 19.9% Black; 6.1% white
> Homeownership rate: 30.8% Black; 73.2% white
The 17th District in Illinois stretches through much of the northwestern portion of the state and includes parts of Peoria and Rockford. Cheri Bustos, a Democrat, defeated incumbent Republican Congressman Bobby Schilling in 2012 and has served the district ever since.
Currently, the typical Black household in the district has an income of just $26,762 a year, about half the income of $51,333 of the typical white household. The Black unemployment rate in the district of 19.9% is also nearly four times the white unemployment rate of 6.1%.
Methodology
To determine the 30 worst congressional districts for Black Americans, 24/7 Wall St. created an index consisting of six measures to assess race-based gaps in socioeconomic outcomes in each of the nation’s congressional districts. Creating the index in this way ensured that districts were ranked on the differences between Black and white residents and not on absolute levels of socioeconomic development and not the area’s socioeconomic status.
The six measures — cost of living-adjusted median household income, poverty, adult high school and bachelor’s degree attainment, homeownership, and unemployment rates — are five-year estimates from the U.S. Census Bureau’s 2018 American Community Survey. To better represent the actual disparities in purchasing power in these districts, all income figures referenced are adjusted for the cost of living in the district’s state using regional price parities from the Bureau of Economic Analysis.
For each measure, we constructed an index from the gaps between Black and white Americans. The index was standardized using interdecile normalization so that outliers in the data would not skew results. We excluded districts where Black residents comprised less than 10% of the population or where data limitations made comparisons between racial groups impossible.
With minor differences due to data availability, this methodology is also used to create the Worst Cities for Black Americans and the Worst States for Black Americans. 24/7 Wall St. has published each of these stories within the last three years.
Contact [email protected] for any questions or corrections.