[cnxvideo id=”625485″ placement=”ros”]
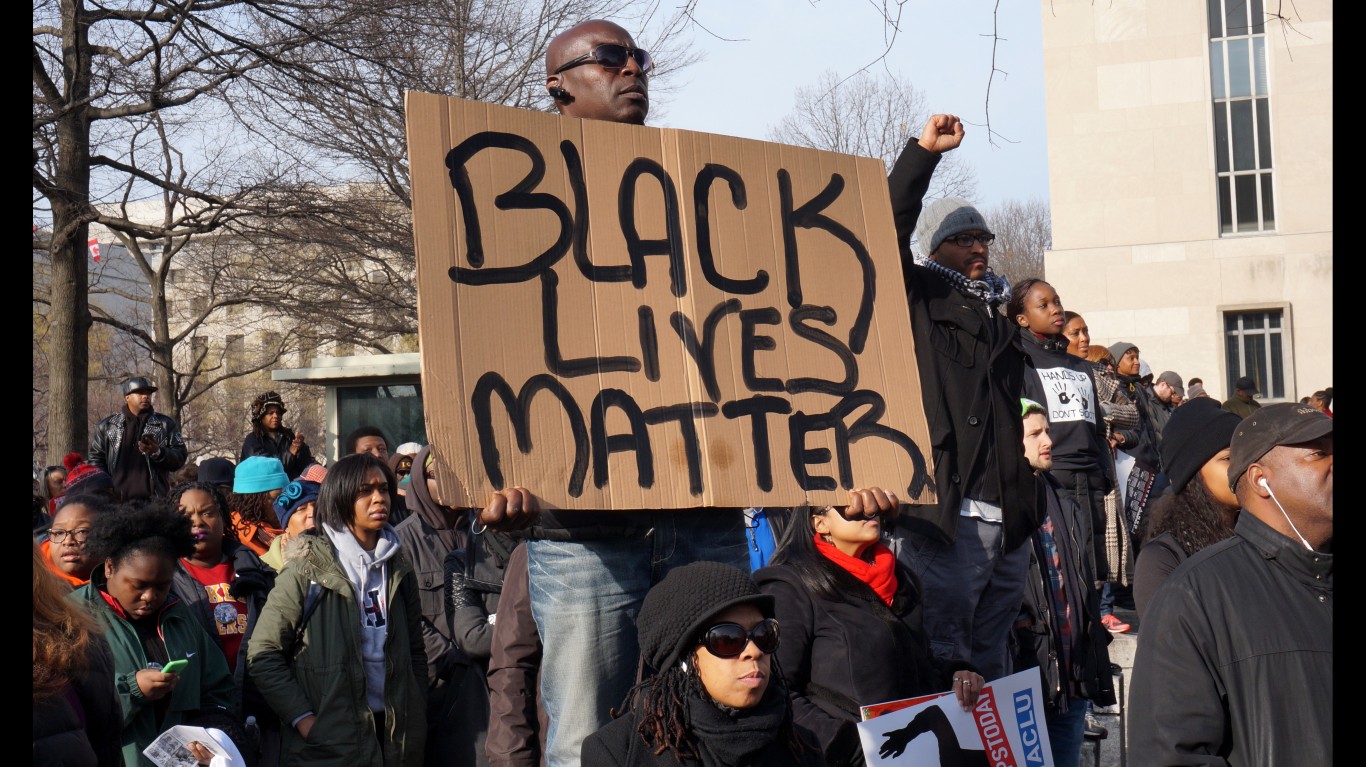
Decades have passed since the end of the Jim Crow era in the United States. While segregation laws are no longer on the books, the legacy of the century-long period, which followed hundreds of years of institutional slavery, is evident across the country as wide socioeconomic gaps exist along racial lines.
Nationwide, the typical black household earns about $25,000 a year less than the typical white household. African-American workers are also more than twice as likely to be unemployed as white workers. Disparities such as these are not even across the country, however, and in some areas, socioeconomic gaps along racial lines are far greater.
Using data from the U.S. Census Bureau, 24/7 Wall St. created an index to measure socioeconomic disparities between black and white Americans by congressional districts to identify the worst congressional districts for black Americans.
Several of the congressional districts on this list fall within some of the worst cities for black Americans. But unlike cities, towns, or counties, congressional districts are not managed by a central municipality. Because the typical congressional district represents about 700,000 people, districts vary in geographical size depending on population density and can span multiple cities or be encompassed within one city. No matter how large they are, the one thing residents of a given congressional district all share is the representative they send to Washington D.C.
24/7 Wall St. discussed conditions within congressional districts with Andre Perry, a fellow in the Metropolitan Policy Program at the Brookings Institution. Perry explained that conditions within a given district are the product of a multitude of historical social and economic factors and therefore often reveal very little as to the efficacy of current political leadership.
However, congressmen and congresswomen are elected to represent the best interests of their constituents at the national level by writing, amending, and voting on legislation that can benefit their district. As such, congressional representatives are in a unique position of power to address issues of social and economic inequality within their district. Civil rights and racial equality are central to the political platform of several representatives on this list.
While congressional representatives do have unique political power to effect change, Perry explained that their tool box is also limited. “An individual congressperson can do a pet project here or there to bring relatively small amounts of capital to a district,” Perry said. For more comprehensive improvements in particular districts, however, broader congressional buy-in is necessary, he added.
Disparities in many of these areas are also a product of racial segregation. Perry explained that nationwide — even after controlling for variables like education, crime, and walkability — homes in black neighborhoods are priced 23% lower in white neighborhoods. And lower property values have far-reaching implications. “…Those revenues that are lost through devaluation are lost on education, infrastructure, quality policing, and all those things it supplies,” Perry said.
Perhaps not surprisingly, many of the congressional districts on this list fall partially or entirely within some of the most segregated cities in the country. These are the 25 most segregated cities in America.
Click here to see the worst congressional districts for black Americans
To determine the 30 worst congressional districts for black Americans, 24/7 Wall St. created an index consisting of six measures to assess race-based gaps in socioeconomic outcomes in each of the nation’s congressional districts. Creating the index in this way ensured that districts were ranked on the differences between black and white residents and not on absolute levels of socioeconomic development.
The seven measures — cost of living-adjusted median household income, poverty, adult high school and bachelor’s degree attainment, homeownership, and unemployment rates — are five-year estimates from the U.S. Census Bureau’s 2017 American Community Survey. To better represent the actual disparities in purchasing power in these districts, all income figures referenced are adjusted for cost of living according to the district’s state using regional price parities from the Bureau of Economic Analysis.
For each measure, we constructed an index from the gaps between black and white Americans. The index was standardized using interdecile normalization so that outliers in the data would not skew results. We excluded districts where black residents comprised less than 10% of the population or where data limitations made comparisons between racial groups impossible.
With minor differences due to data availability, this methodology is also used to create the Worst Cities for Black Americans, and the Worst States for Black Americans. 24/7 Wall St. has published each of these stories within the last three years.
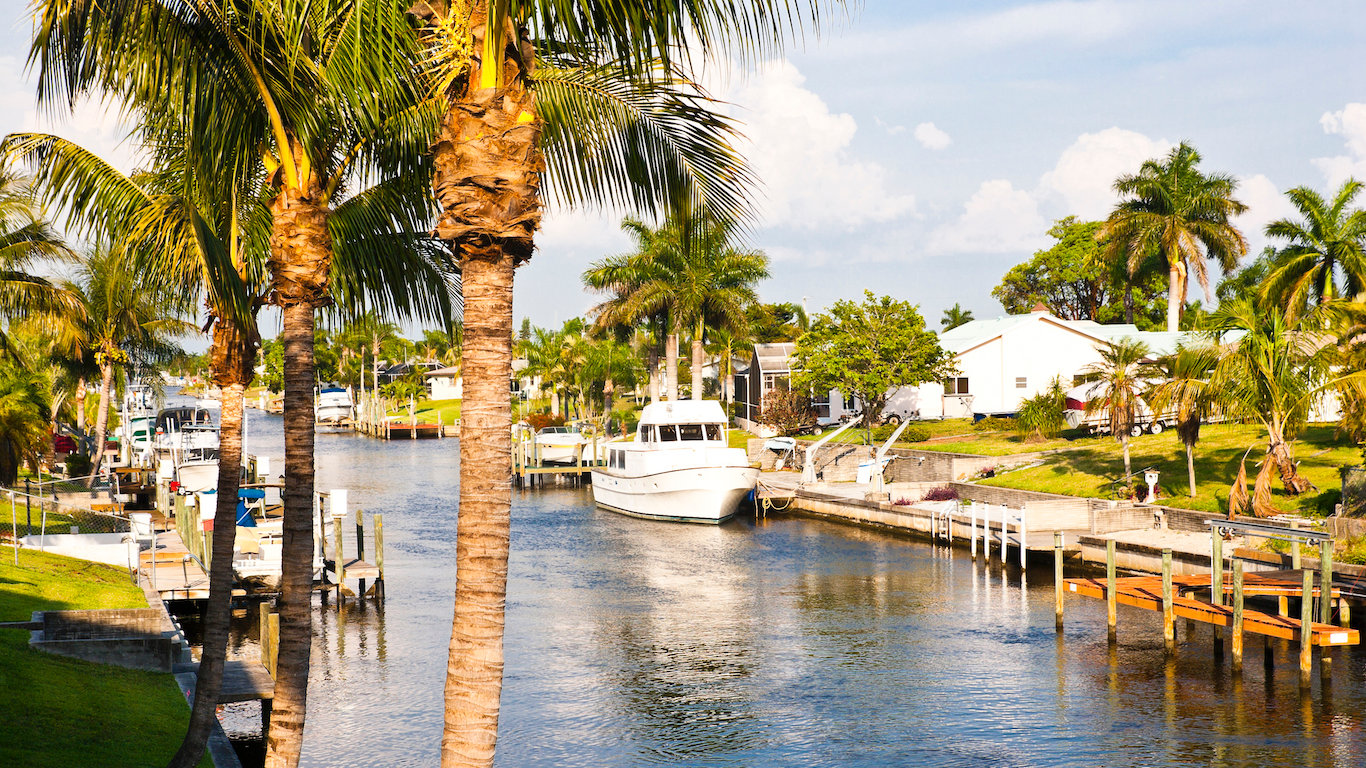
30. Florida’s 24th Congressional District
> Current representative: Rep. Frederica S. Wilson (Democratic Party)
> Poverty rate: 27.3% black; 14.4% white
> Unemployment rate: 13.9% black; 6.5% white
> Homeownership rate: 42.3% black; 66.2% white
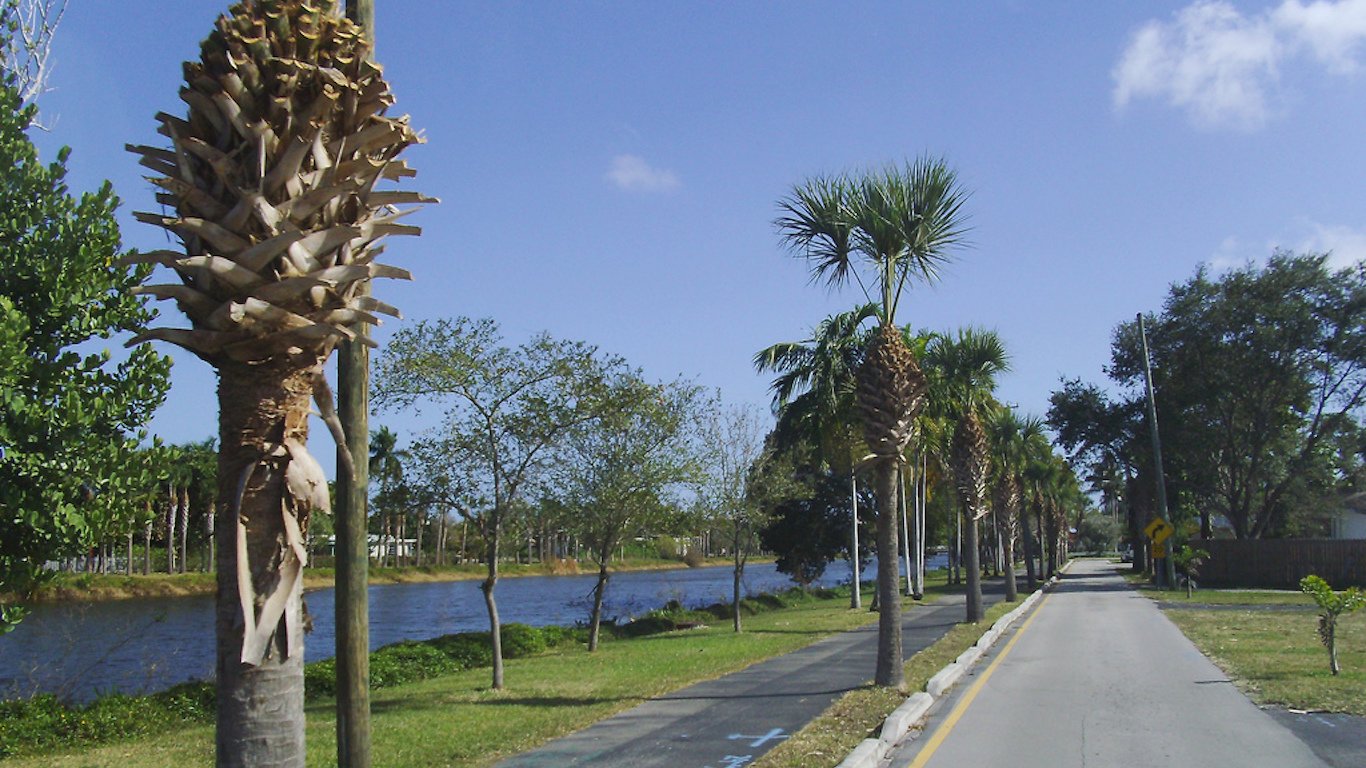
Florida’s 24th District stretches along the Biscayne Bay from the northern part of downtown Miami to Hollywood. Black residents, who make up the largest racial group in the district, are more than twice as likely to be unemployed as white district residents and nearly twice as likely to live below the poverty line. Racial disparities in these economic outcomes are likely due in part to gaps in educational attainment. College-educated adults are more qualified for a wider range of higher-paying jobs, and just 14.0% of black adults in the district have a bachelor’s degree, less than half the 35.6% share of white adults.
The district has been served by Democrat Rep. Frederica Wilson since 2011. Wilson currently sits on the Committee on Education and the Workforce and the Committee on Transportation and Infrastructure.
[in-text-ad]
29. Connecticut’s 4th Congressional District
> Current representative: Rep. James A. Himes (Democratic Party)
> Poverty rate: 17.1% black; 4.4% white
> Unemployment rate: 14.9% black; 5.6% white
> Homeownership rate: 38.0% black; 78.3% white
The 4th Congressional District in Connecticut is the only one in the state and the broader New England region on this list of the worst congressional districts for black Americans. The district makes up the southwest corner of the state, covering cities like Stamford and Bridgeport. Economic inequality in the district is among the worst in the country — and much of it is along racial lines.
Over 17% of the area’s black population lives below the poverty line, more than triple the 4.4% white poverty rate. Perhaps even more striking, the typical white household in the area earns nearly $108,000 a year, adjusted for cost of living — the income measure we use throughout this piece. Meanwhile, the median income among black households is equivalent to $44,168 after adjusting for cost of living.
[recirclink id=504442]
28. Mississippi’s 2nd Congressional District
> Current representative: Rep. Bennie G. Thompson (Democratic Party)
> Poverty rate: 36.5% black; 12.6% white
> Unemployment rate: 15.5% black; 6.3% white
> Homeownership rate: 52.7% black; 79.6% white
The 2nd District in Mississippi is a geographically large, majority-black area covering the Mississippi Delta and much of the state’s border with Arkansas and Louisiana. In the district, only about three out of every four black adults have a high school diploma, compared to over 87% of white adults. Disparities in education tend to have economic consequences. The typical white household in the district earns $60,405 a year, nearly double the median income of $31,350 among black households.
The district intersects with at least one pivot county — a county that voted for Barack Obama in 2008 and 2012 and for Donald Trump in 2016. Democrat Rep. Bennie Thompson has served in the district since 1993.
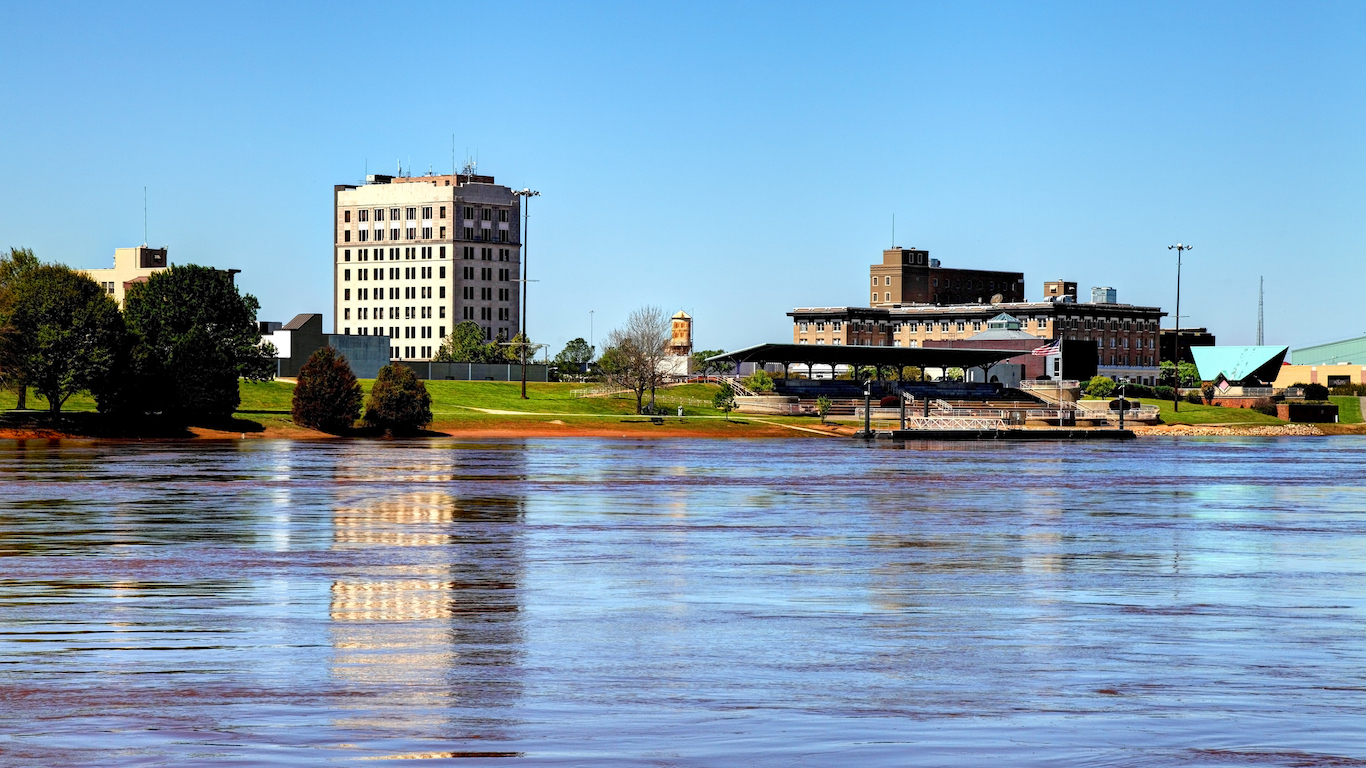
27. Louisiana’s 5th Congressional District
> Current representative: Rep. Ralph Lee Abraham (Republican Party)
> Poverty rate: 41.2% black; 15.7% white
> Unemployment rate: 12.9% black; 6.1% white
> Homeownership rate: 44.5% black; 75.3% white
Louisiana’s 5th Congressional District is a geographically large district that covers much of the state’s eastern border and includes the cities of Monroe and Alexandria. Across the district, 41.2% of black residents live below the poverty line compared to 15.7% of white residents. Such disparities are partially the result of disparate conditions in the labor market. The 12.9% unemployment rate among the black labor force is more than double the 6.1% rate in the district’s white labor force.
Republican Rep. Ralph Abraham has served the district since 2015. He is currently running for governor of the state.
[in-text-ad-2]

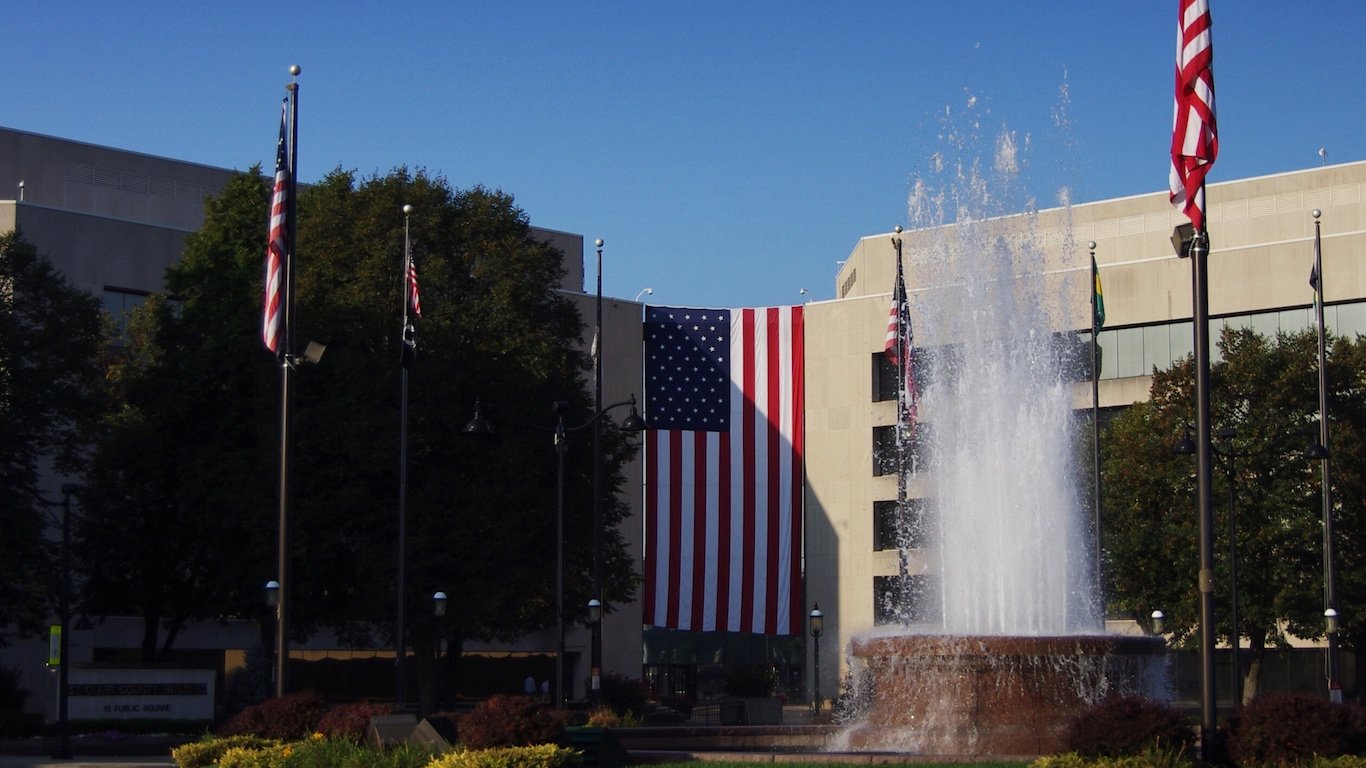
26. Missouri’s 1st Congressional District
> Current representative: Rep. William Lacy Clay (Democratic Party)
> Poverty rate: 26.1% black; 10.7% white
> Unemployment rate: 14.4% black; 4.9% white
> Homeownership rate: 40.4% black; 64.1% white
Missouri’s 1st Congressional District is located in the northern part of the state and covers the city of St. Louis. Heavily segregated cities often have some of the worst disparities in socioeconomic outcomes along racial lines — and St. Louis is one of the most segregated cities in the United States.
The typical white household in the district earns $62,622 a year, which is about $25,000 more than the typical black household income in the district. Incomes tend to increase with educational attainment, and 43.1% of white area residents age 25 and up have a bachelor’s degree compared to just 17.4% of black adults in the district.
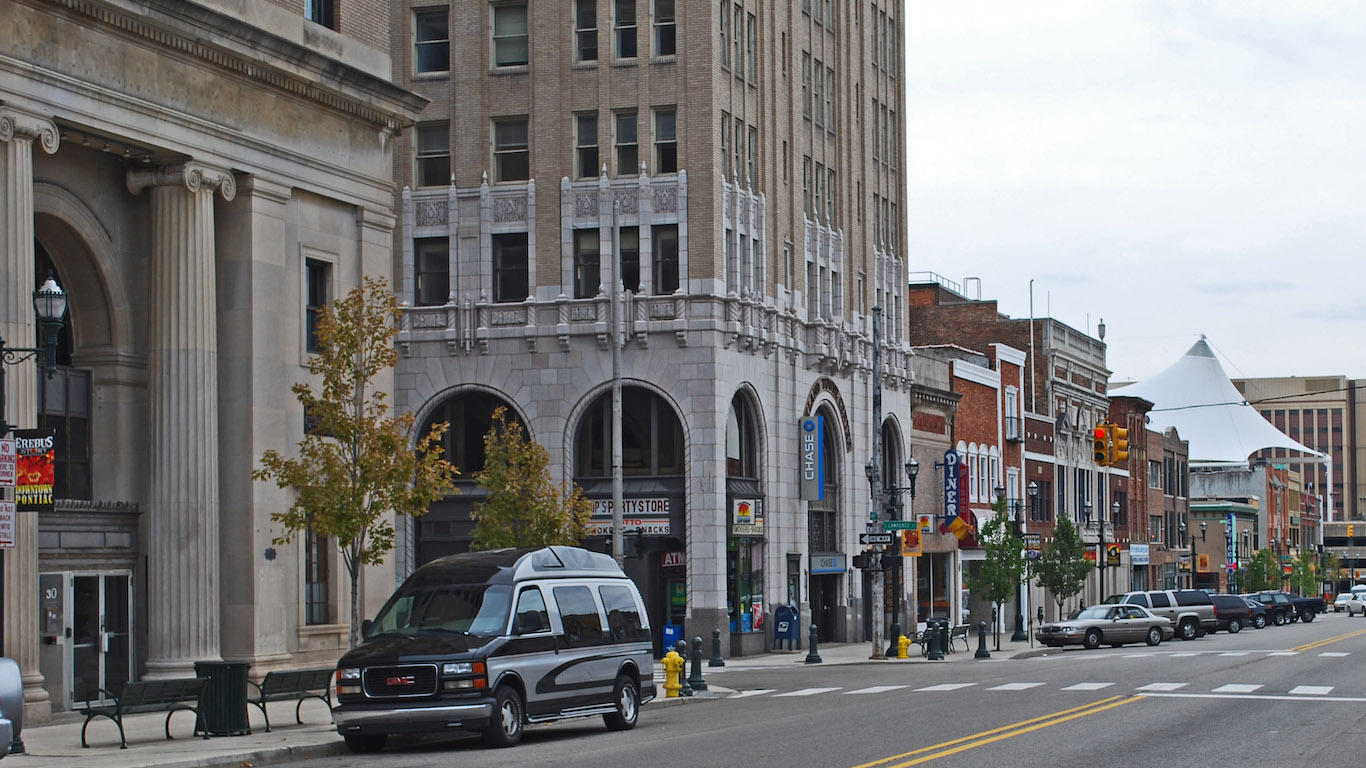
25. Michigan’s 14th Congressional District
> Current representative: Rep. Brenda L. Lawrence (Democratic Party)
> Poverty rate: 28.2% black; 13.7% white
> Unemployment rate: 17.7% black; 5.8% white
> Homeownership rate: 46.7% black; 71.7% white
Michigan’s 14th Congressional District covers parts of Detroit and includes parts of both Wayne and Oakland counties. Within the district’s boundaries, black workers are more than three times as likely to be unemployed as white workers. The high jobless rate among the area’s black residents contributes to disparities in income along racial lines. The typical black household in the area earns just $38,576 a year, well below the median income of $69,076 a year for white households. Over half of the district’s 692,552 residents are black.
Michigan’s 14th District is one of several on this list that lie within a heavily segregated urban area. As Detroit deindustrialized after WWII, large waves of affluent white families left the city center for the suburbs, draining the city’s tax base and leaving its poorer residents deprived of necessary public services and infrastructure.
[in-text-ad]
24. Florida’s 26th Congressional District
> Current representative: Rep. Debbie Mucarsel-Powell (Democratic Party)
> Poverty rate: 29.6% black; 11.0% white
> Unemployment rate: 15.3% black; 5.4% white
> Homeownership rate: 45.9% black; 70.4% white
Florida’s 26th Congressional District covers the southern tip of mainland Florida down to Key West. Within the district’s borders, members of the black labor force are nearly three times as likely to be out of a job as the white labor force. Additionally, the poverty rate of 29.6% among the area’s black residents is nearly triple the white poverty rate of 11.0%.
Democratic candidate Rep. Debbie Mucarsel-Powell defeated incumbent Republican Congressman Carlos Curbelo in the 2018 general election.
[recirclink id=561780]
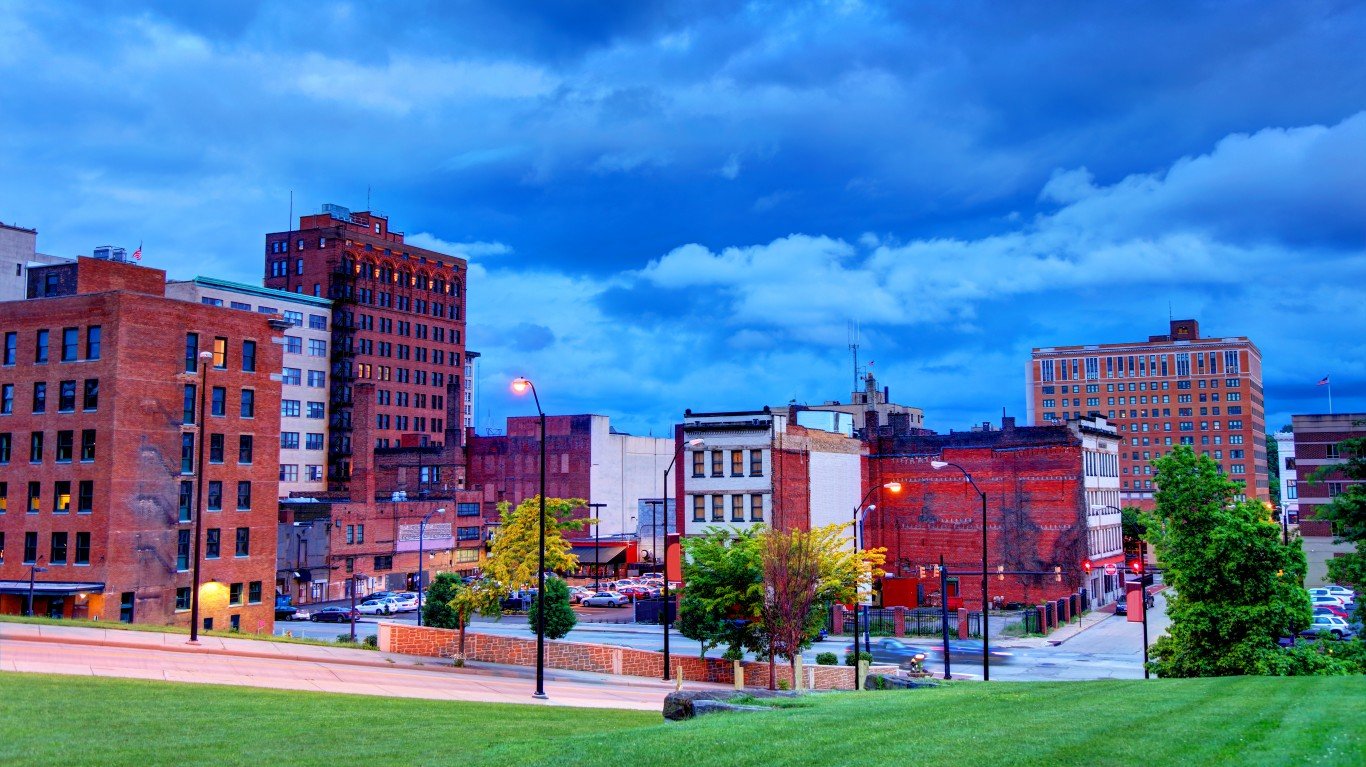
23. Ohio’s 13th Congressional District
> Current representative: Rep. Tim Ryan (Democratic Party)
> Poverty rate: 36.8% black; 14.2% white
> Unemployment rate: 15.8% black; 6.4% white
> Homeownership rate: 35.6% black; 69.0% white
Disparities in socioeconomic measures between white and black residents of Ohio’s 13th Congressional District’s are glaring. Unemployment among black workers in the area stands at 15.8%, nearly three times the white unemployment rate of 6.4%. Similarly, 36.8% of black area residents live below the poverty line, more than double the 14.2% poverty rate among whites.
Democratic presidential hopeful Rep. Tim Ryan has served in Congress since 2003, and has represented the 13th Congressional District of Ohio since 2013. The district is located in northern Ohio and covers sections of the state from Youngstown west to Akron.
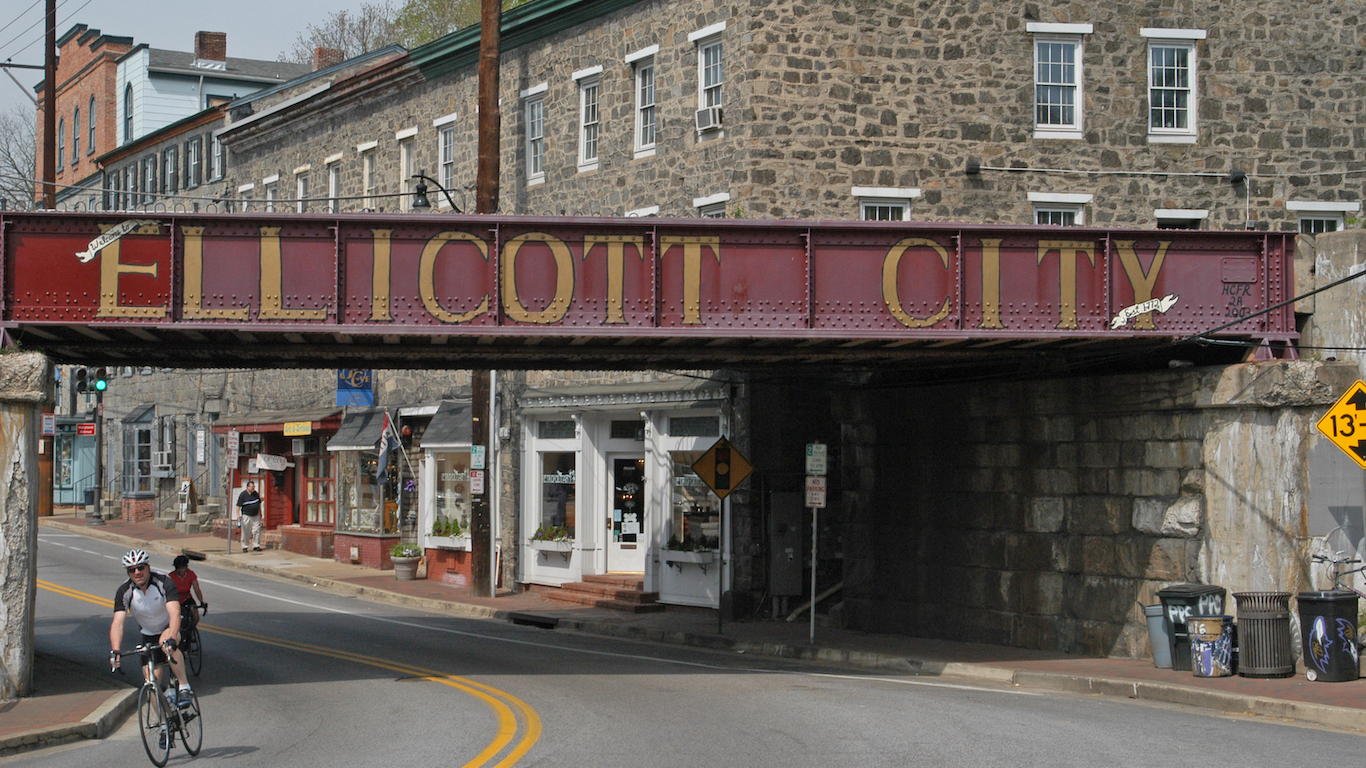
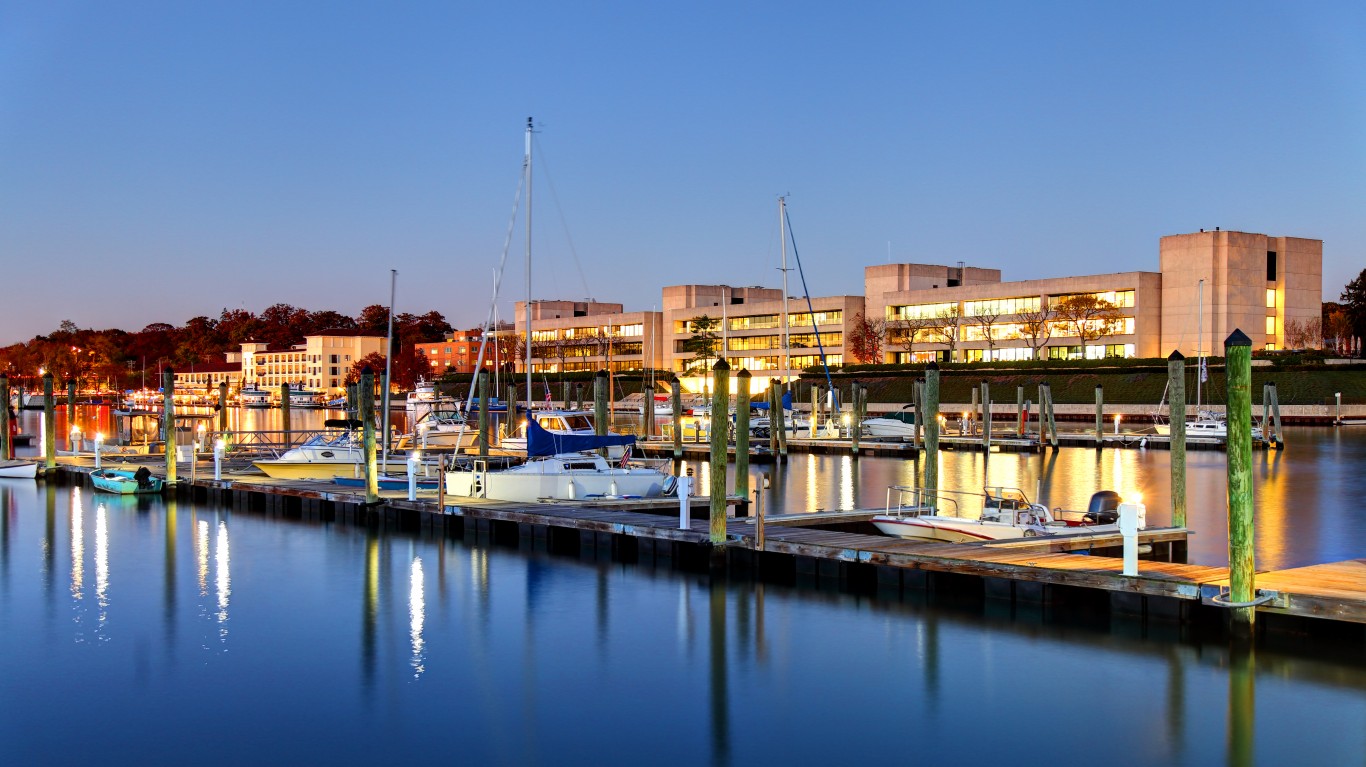
22. Maryland’s 7th Congressional District
> Current representative: Rep. Elijah E. Cummings (Democratic Party)
> Poverty rate: 23.4% black; 6.8% white
> Unemployment rate: 12.6% black; 4.0% white
> Homeownership rate: 45.9% black; 73.9% white
Maryland’s 7th Congressional District extends west and north from Baltimore, surrounding — but not including — the community of Towson. The gerrymandered district is predominantly black and one of the most racially divided parts of the country by several economic measures. The black poverty rate in the district of 23.4% is more than triple the white poverty rate of 6.8%. Black workers in the district are also twice as likely to be unemployed as white workers.
Rep. Elijah E. Cummings has served the district since his election in 1995. Cummings is currently the chair of the House Committee on Oversight and Reform.
[in-text-ad-2]
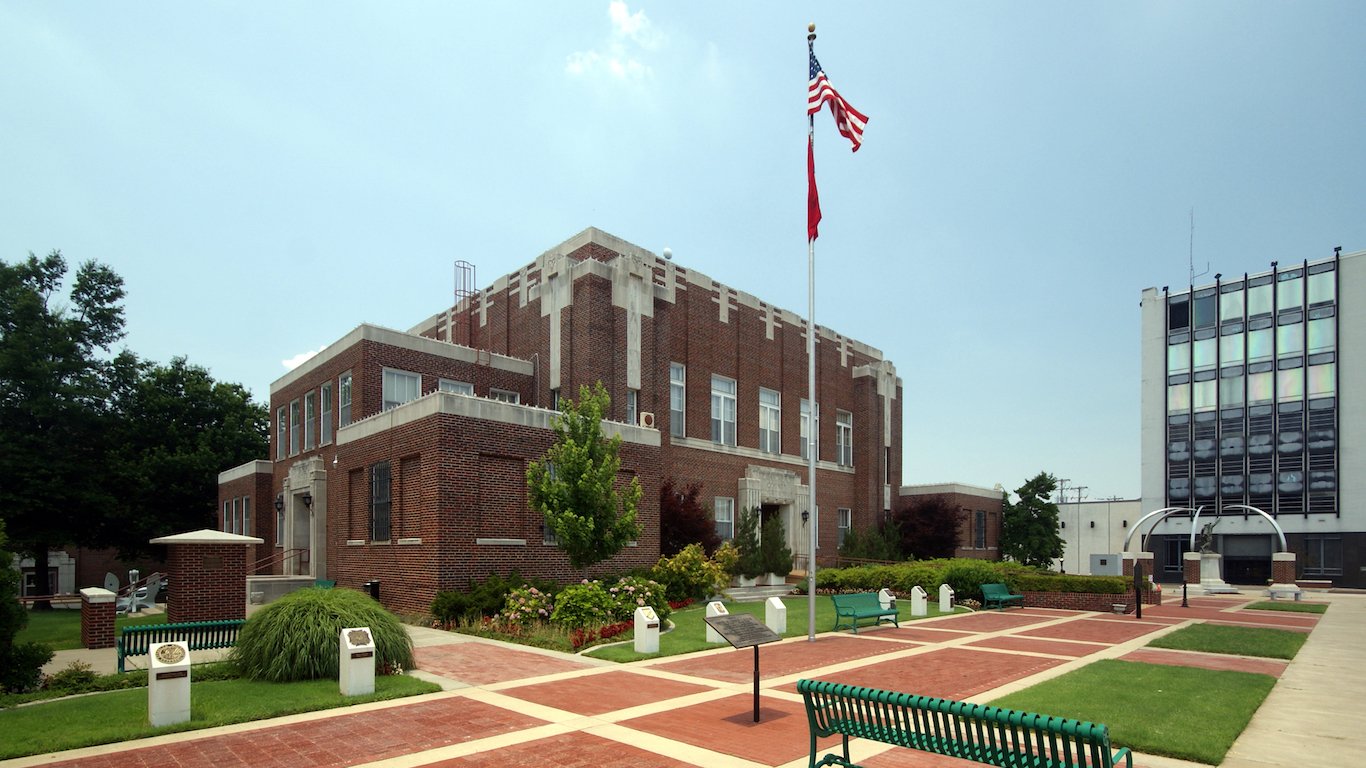
21. Arkansas’s 1st Congressional District
> Current representative: Rep. Eric A. “Rick” Crawford (Republican Party)
> Poverty rate: 36.9% black; 15.8% white
> Unemployment rate: 15.4% black; 5.9% white
> Homeownership rate: 41.0% black; 71.6% white
Arkansas’s 1st Congressional District covers the entire eastern border of the state and extends as far west as Searcy County. The typical black household in the district has an income of $28,488 a year, nearly $22,000 less than the median annual white household income of $50,132 in the district. Black district residents in the district are also far more likely to face serious financial hardship than white residents. More than one in every three black residents of this part of Arkansas live below the poverty line, more than double the poverty rate among white residents of 15.8%.
20. Illinois’s 12th Congressional District
> Current representative: Rep. Mike Bost (Republican Party)
> Poverty rate: 37.8% black; 13.1% white
> Unemployment rate: 15.1% black; 6.5% white
> Homeownership rate: 37.8% black; 73.8% white
Illinois’s 12th Congressional District covers the southern tip of the state. The typical white household in the district has an annual income of $52,903, almost double the income of the typical black area household of $26,490. Black residents in the area are more than twice as likely to be unemployed and nearly three times as likely to live below the poverty line as white residents. Republican Rep. Mike Bost has represented the district since 2015.
[in-text-ad]
19. Illinois’s 13th Congressional District
> Current representative: Rep. Rodney Davis (Republican Party)
> Poverty rate: 37.1% black; 14.4% white
> Unemployment rate: 14.2% black; 5.8% white
> Homeownership rate: 30.3% black; 71.3% white
Illinois’s 13th Congressional District is located partially along the state’s western border with Missouri and extends east into the center of the state. The district is predominantly white, and socioeconomic outcomes are heavily lopsided along racial lines. The poverty rate among the area’s black population of 37.1% is more than double the white poverty rate of 14.4%. Black residents of the 13th District are also far less likely than white residents to own their home. The black homeownership rate of 30.3% is less than half the white homeownership rate of 71.3%.
Republican Rep. Rodney Davis has represented the district since 2013. Davis narrowly won reelection in 2018.
[recirclink id=436289]
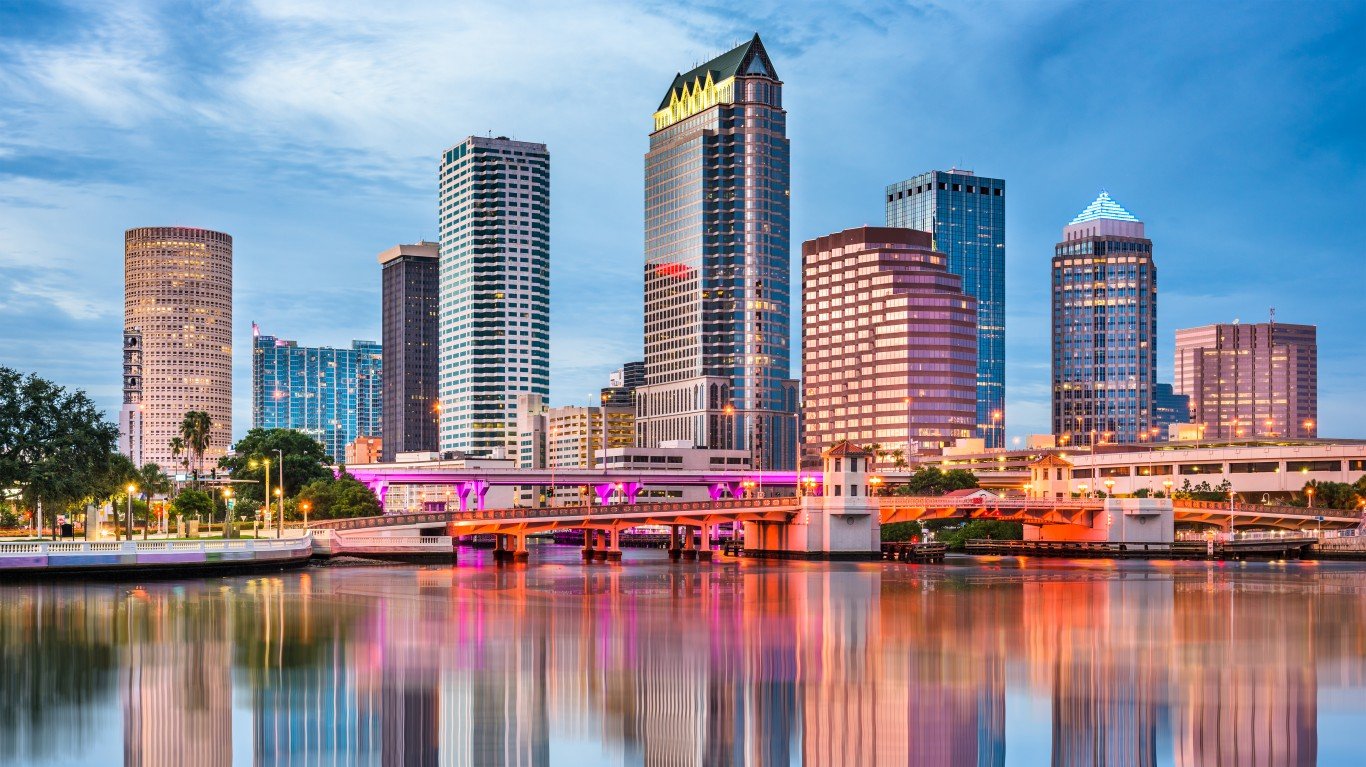
18. Florida’s 14th Congressional District
> Current representative: Rep. Kathy Castor (Democratic Party)
> Poverty rate: 30.8% black; 10.4% white
> Unemployment rate: 13.0% black; 5.3% white
> Homeownership rate: 30.3% black; 61.7% white
Florida’s 14th District, located on the northern side of Tampa Bay, is one of several congressional districts in Florida to rank on this list. Black area residents are less than half as likely to be homeowners as white residents, nearly three times as likely to live below the poverty line, and more than twice as likely to be unemployed.
Democrat Rep. Kathy Castor currently serves the west-central Florida district. Castor has been in congress since 2007, originally serving Florida’s 11th Congressional District. She has served the 14th Congressional District since 2013.
17. Illinois’s 1st Congressional District
> Current representative: Rep. Bobby L. Rush (Democratic Party)
> Poverty rate: 27.6% black; 7.0% white
> Unemployment rate: 19.8% black; 6.3% white
> Homeownership rate: 43.7% black; 83.1% white
The 1st District in Illinois is a predominantly black area that stretches from just south of Chicago southwest into the interior of the state. The typical black household in the area has an income of just $36,064 a year, less than half the median household income of $77,065 for white households in the district. The income gap along racial lines is partially attributable to an even greater disparity in unemployment. Nearly one in every five black workers in the area are unemployed, more than triple the 6.3% white unemployment rate.
The district has been served by Democrat Bobby Rush for the last 26 years. Rush most recently won reelection in 2018 with over 73% of the vote.
[in-text-ad-2]
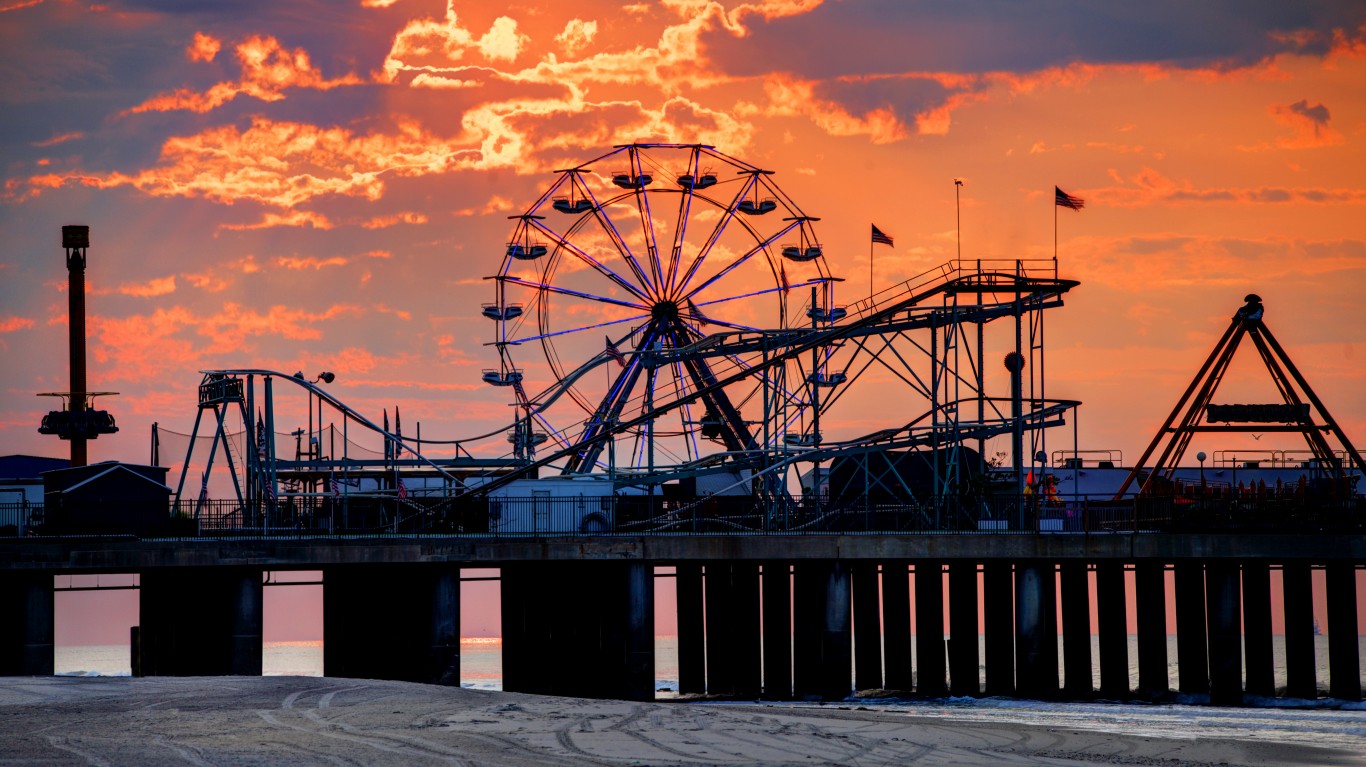
16. New Jersey’s 2nd Congressional District
> Current representative: Rep. Jefferson Van Drew (Democratic Party)
> Poverty rate: 26.5% black; 7.5% white
> Unemployment rate: 16.8% black; 7.6% white
> Homeownership rate: 44.4% black; 81.6% white
New Jersey’s 2nd Congressional District covers the southern end of the state and includes Atlantic City and Cape May. The district has some of the worst socioeconomic disparities along racial lines in the country. Black residents of the congressional district are more than three times as likely as white residents to live below the poverty line and more than twice as likely to be unemployed.
Democrat Rep. Jefferson Van Drew currently serves the district. Van Drew took office in 2019 after winning the 2018 election. Rep. Frank LoBiondo, who opted not to run in 2018, had held the seat since 1995.
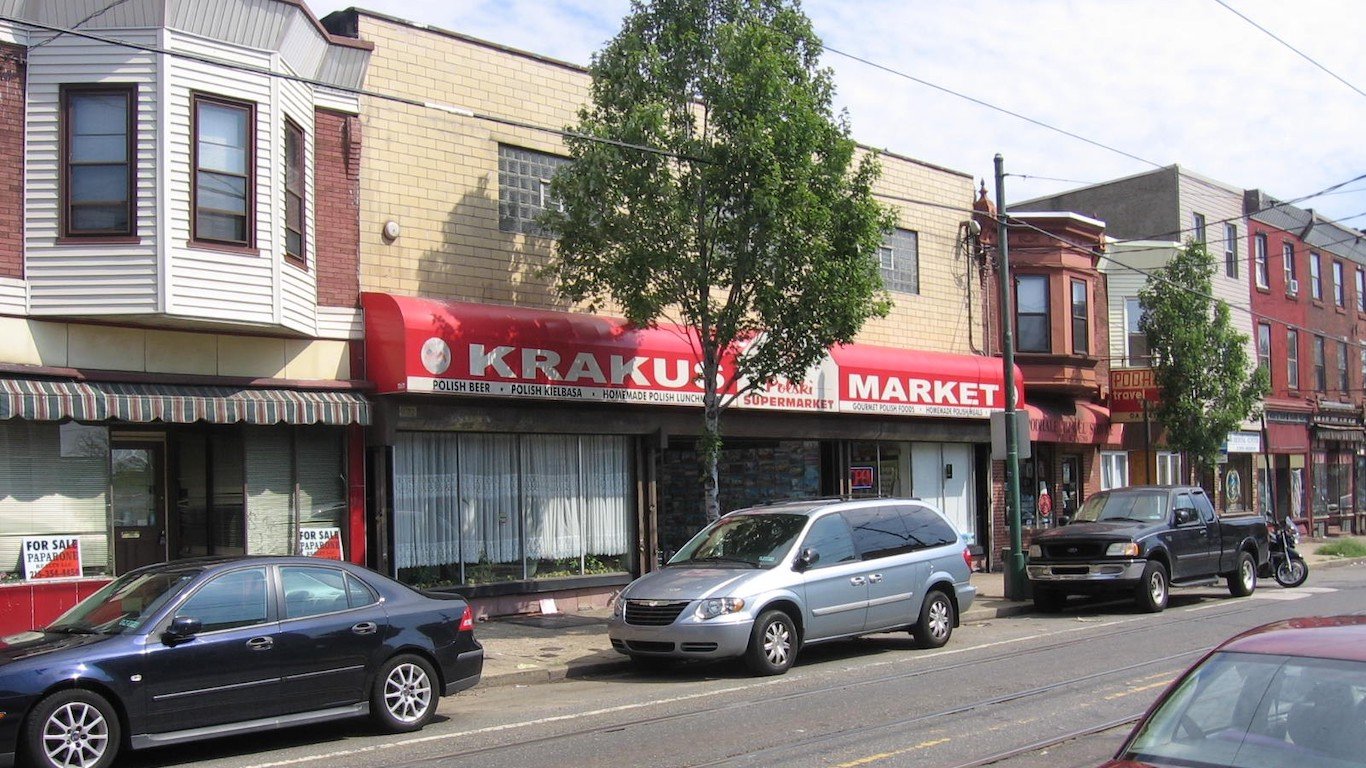
15. Pennsylvania’s 2nd Congressional District
> Current representative: Rep. Brendan F. Boyle (Democratic Party)
> Poverty rate: 31.1% black; 15.4% white
> Unemployment rate: 15.9% black; 4.5% white
> Homeownership rate: 49.0% black; 52.4% white
The 2nd Congressional District in Pennsylvania includes northeastern Philadelphia and extends northeasterly along the Delaware River. The predominantly black district has some of the worst socioeconomic disparities along racial lines in the country. Just 15.7% of black adult area residents have a bachelor’s degree compared to 66.4% of white adult residents. Incomes tend to be higher for adults with a college education, and in Pennsylvania’s 2nd District, the typical white household earns about $76,000 a year, more than double the roughly $30,000 median income among black households.
[in-text-ad]
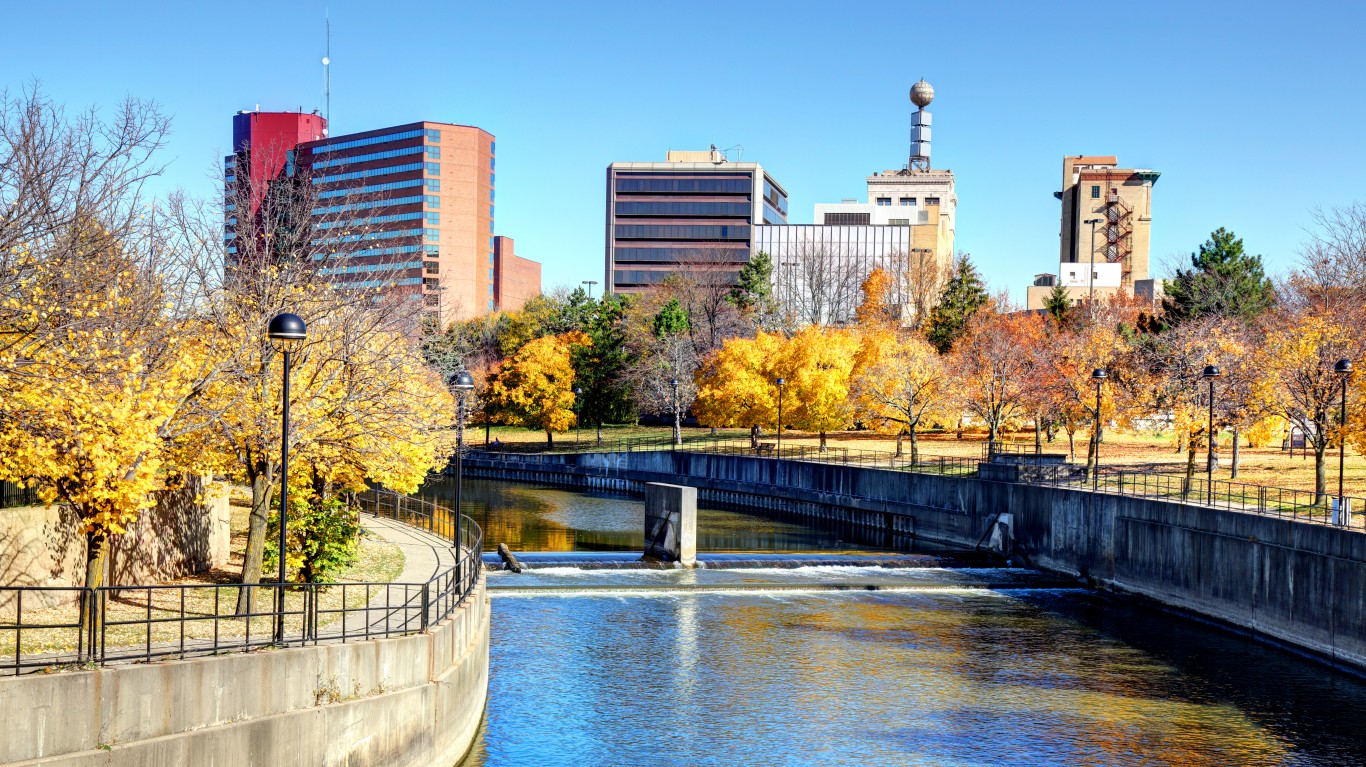
14. Michigan’s 5th Congressional District
> Current representative: Rep. Daniel T. Kildee (Democratic Party)
> Poverty rate: 38.0% black; 14.7% white
> Unemployment rate: 21.9% black; 7.7% white
> Homeownership rate: 48.3% black; 77.3% white
Michigan’s 5th Congressional District is an industrial area on the state’s lower peninsula that stretches along the shore of Lake Huron, extending far enough north to include Tawas City, and far enough south to include Flint. The mostly white district has glaring economic disparities along racial lines. At 38.0%, the poverty rate among black residents is more than double the 14.7% white poverty rate. Members of the area’s black labor force are also nearly three times as likely to be unemployed as members of the white labor force.
Democrat Rep. Daniel T. Kildee has served the district since 2013. Kildee recently won reelection in 2018, defeating Republican challenger Travis Wines.
[recirclink id=487873]
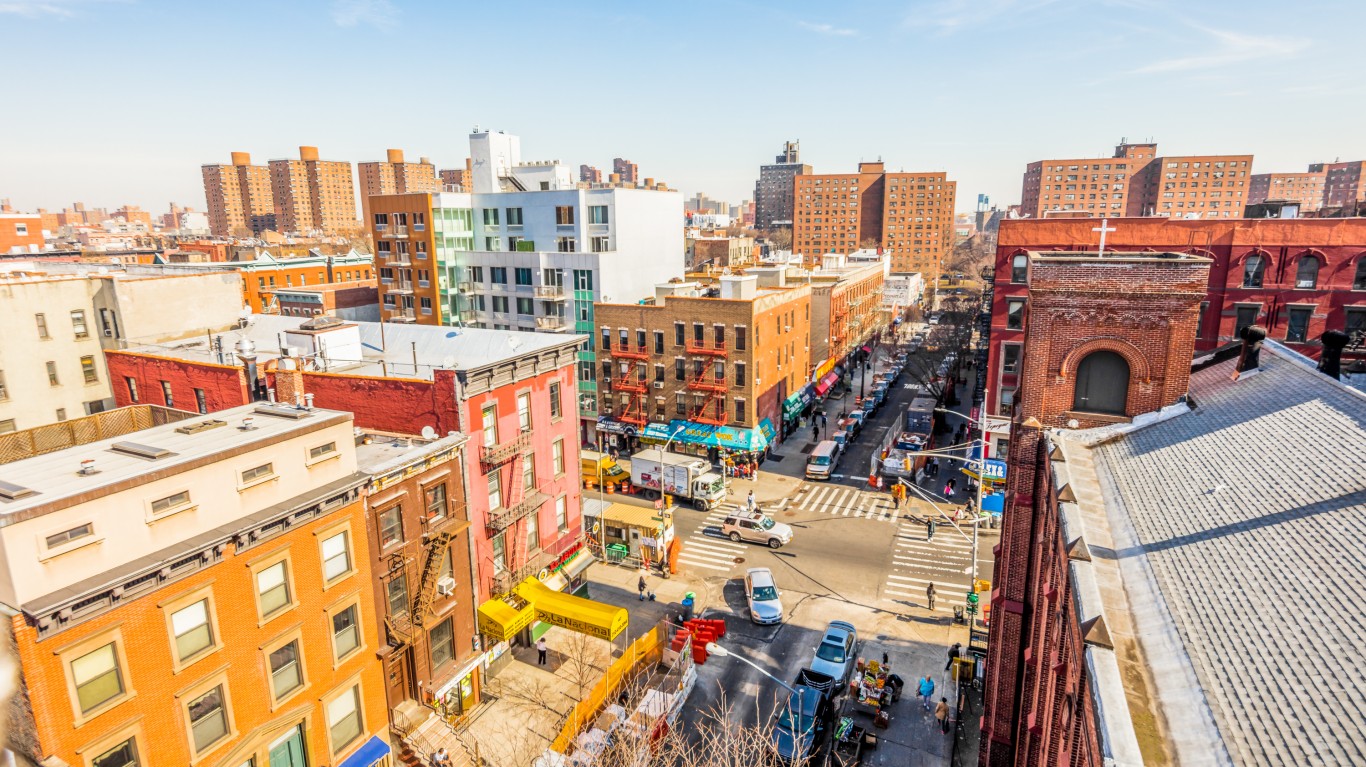
13. New York’s 13th Congressional District
> Current representative: Rep. Adriano Espaillat (Democratic Party)
> Poverty rate: 31.0% black; 14.1% white
> Unemployment rate: 13.7% black; 5.5% white
> Homeownership rate: 10.2% black; 20.8% white
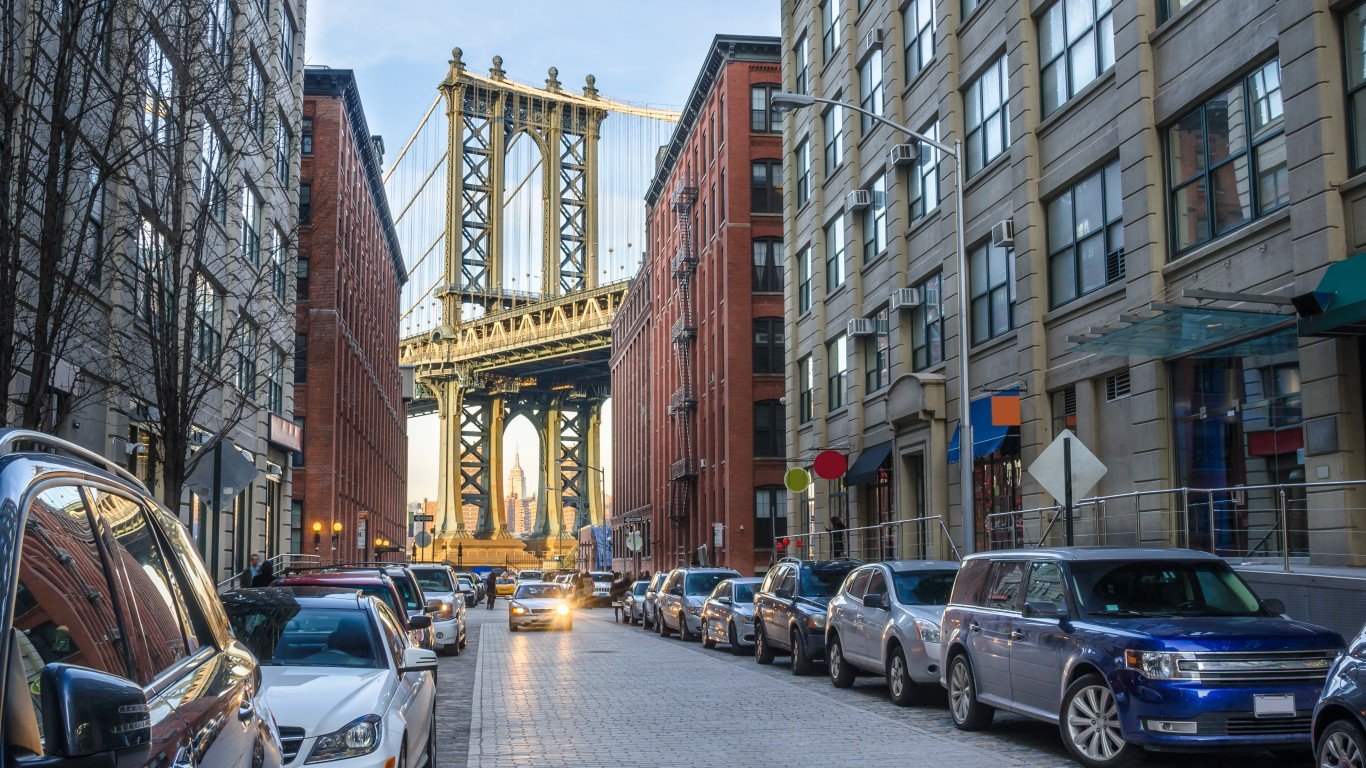
The 13th Congressional District in New York is located in New York City and includes parts of the Bronx and northern Manhattan. The typical black household in the district has an income of less than $30,000 a year, while the typical white household earns over $68,000 annually. The income disparities are linked to gaps in education outcomes. For example, fewer than 80% of black adults in the district have completed high school, compared to about 95% of white adults.
The district was formerly held by Democrat Charles Rangel, a vocal civil rights proponent, who served in the House from 1971 until his retirement in 2017. The seat is currently held by Democrat Adriano Espaillat.
12. New York’s 7th Congressional District
> Current representative: Rep. Nydia M. Velazquez (Democratic Party)
> Poverty rate: 30.8% black; 19.7% white
> Unemployment rate: 15.8% black; 4.3% white
> Homeownership rate: 16.1% black; 30.2% white
New York’s 7th Congressional District covers the eastern border of Brooklyn along the East River as well as parts of Queens and Manhattan. Gentrification in the area has contributed to massive socioeconomic disparities along racial lines. For example, fewer than three out of every four black area residents 25 and older have a high school diploma compared to more than 90% of white area adults. Incomes tend to increase with educational attainment, and the typical black household in the district has an income of about $30,000 a year, less than half the median income among white households of $78,000.
[in-text-ad-2]
11. Georgia’s 5th Congressional District
> Current representative: Rep. John Lewis (Democratic Party)
> Poverty rate: 27.8% black; 9.0% white
> Unemployment rate: 14.4% black; 3.4% white
> Homeownership rate: 38.0% black; 56.6% white
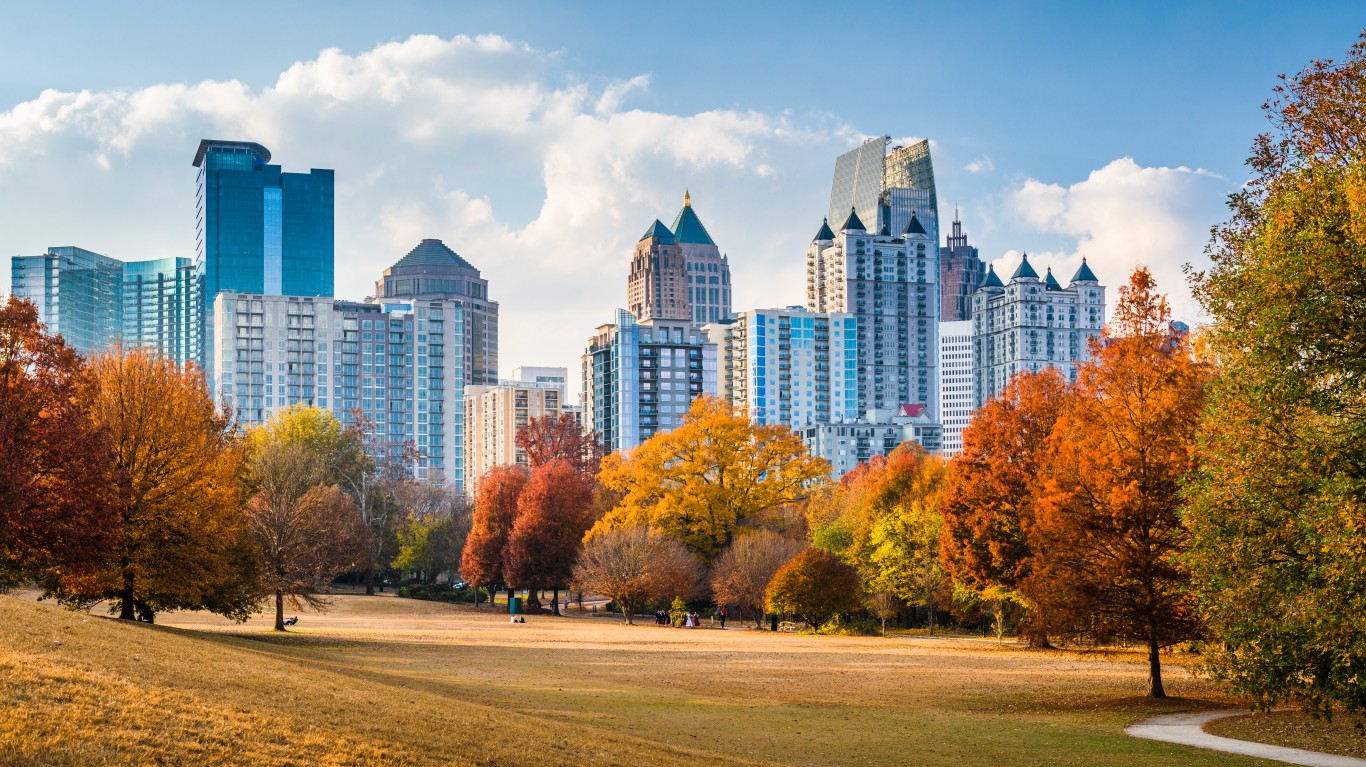
The 5th District in Georgia covers downtown Atlanta and parts of the surrounding area. The heavily Democratic area is served by John Lewis, a congressman for the last 32 years and an outspoken proponent of civil rights.
The district is majority black and has some of the worst economic disparities along racial lines in the country. Black area residents are more than three times as likely to live in poverty and more than four times as likely to be unemployed as white residents. Such gaps are partially the result of disparities in educational attainment levels. For example, over 70% of white area adults have a bachelor’s degree compared to 23.7% of black adults.

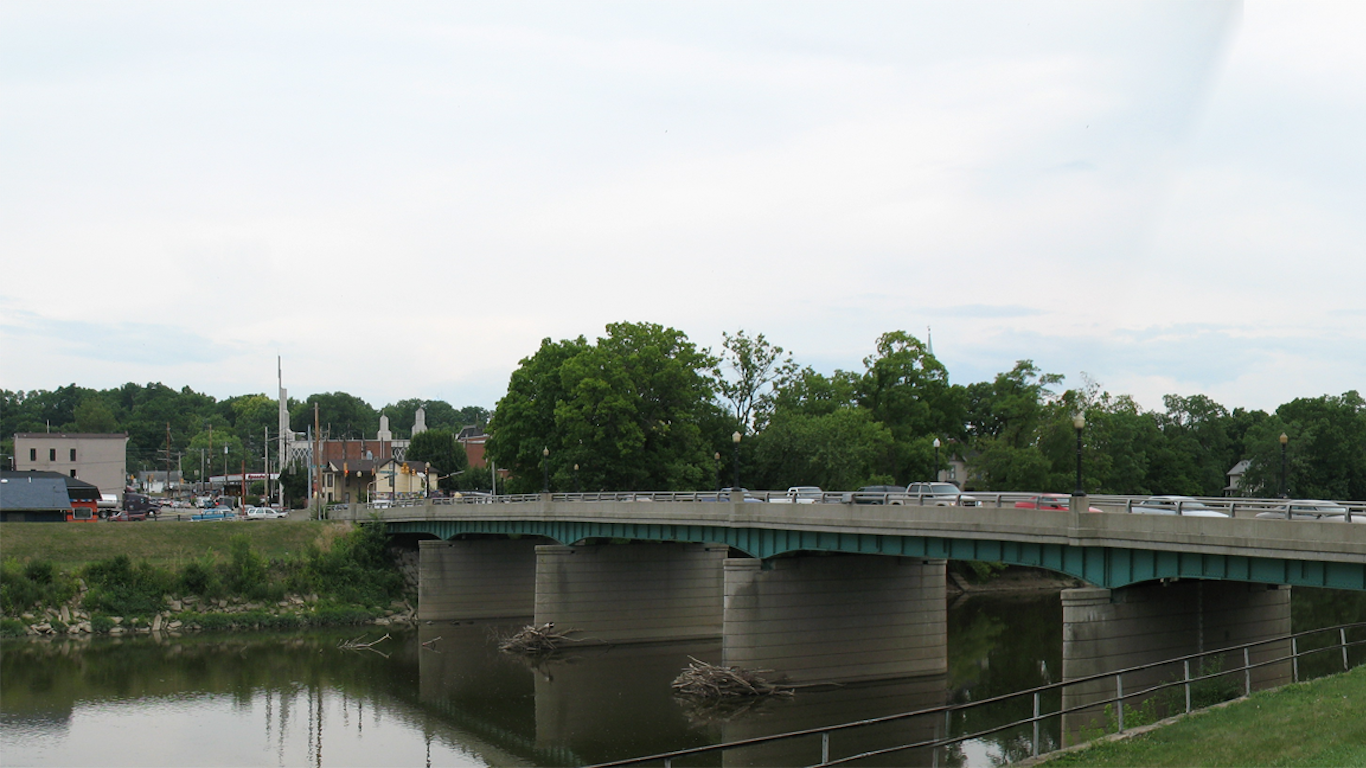
10. Ohio’s 9th Congressional District
> Current representative: Rep. Marcy Kaptur (Democratic Party)
> Poverty rate: 37.8% black; 14.4% white
> Unemployment rate: 17.6% black; 7.2% white
> Homeownership rate: 31.4% black; 66.9% white
Ohio’s 9th Congressional District is located on the northern border of the state along Lake Erie, stretching from Toledo eastward nearly to Cleveland. Like many congressional districts on this list, particularly those in the Midwest, Ohio’s 9th District intersects with at least one pivot county — a county that voted for Barack Obama in 2008 and 2012 and for Donald Trump in 2016.
The median income among the predominantly white district’s black households is just $28,569 a year, well below the median annual income among white households of $54,092. Homeownership is a practical way for many American families to build wealth, and in this district, the black homeownership rate of 31.4% is less than half the white homeownership rate of 66.9%.
[in-text-ad]
9. New York’s 26th Congressional District
> Current representative: Rep. Brian Higgins (Democratic Party)
> Poverty rate: 35.2% black; 11.5% white
> Unemployment rate: 13.0% black; 4.8% white
> Homeownership rate: 32.3% black; 69.0% white
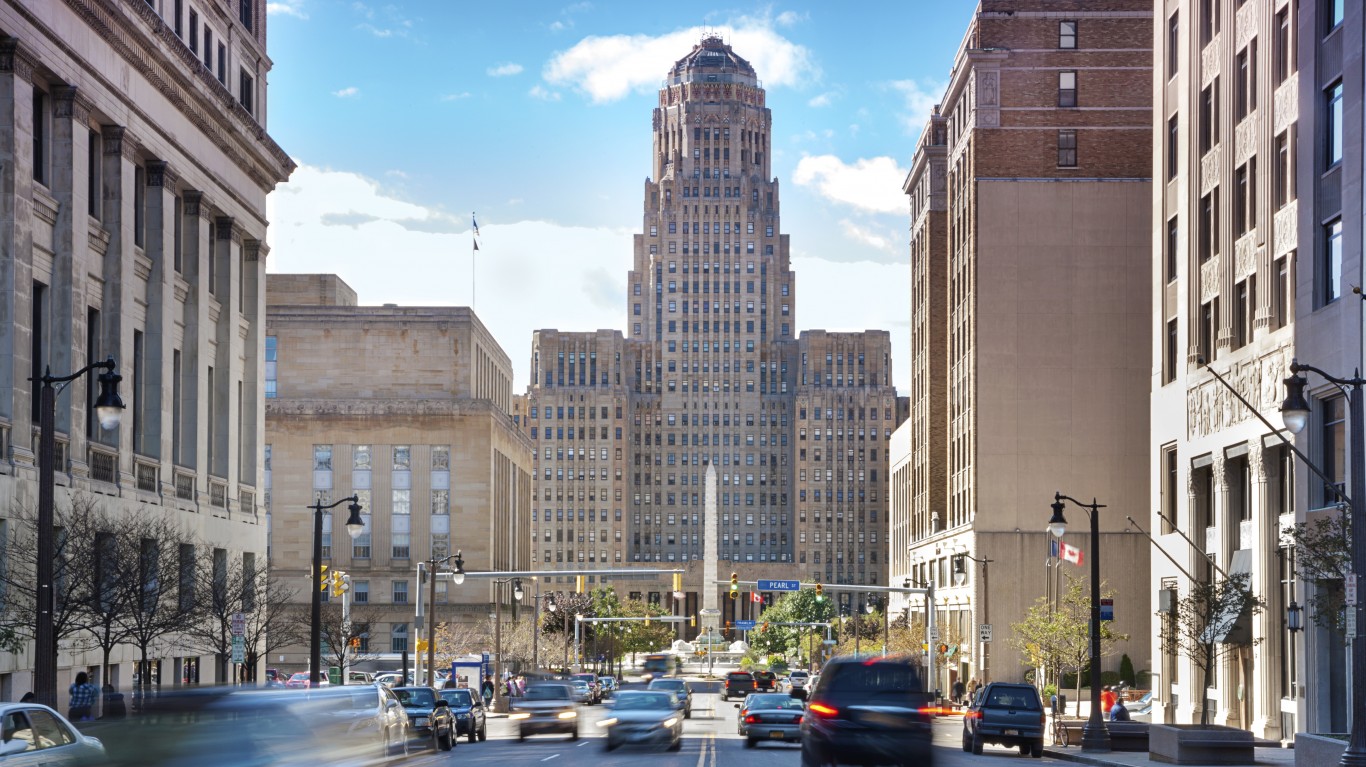
New York’s 26th Congressional District is located along the western border of the state and includes Buffalo, the second most populous city in the state. As is the case for many congressional districts on this list, New York’s 26th overlaps with at least one county that went to Obama in 2008 and 2012 and Trump in 2016. The district is currently served by Democrat Brian Higgins, a congressman since 2005.
This majority-white district has some of the nation’s largest socioeconomic disparities along racial lines. White adults in the district are more than twice as likely to have a college degree as black residents 25 and older, which likely contributes to the income disparities. The typical black district household has an income of just $24,047 a year, compared to the median income of $47,295 among white households.
[recirclink id=562229]
8. Florida’s 21st Congressional District
> Current representative: Rep. Lois Frankel (Democratic Party)
> Poverty rate: 19.5% black; 8.7% white
> Unemployment rate: 12.1% black; 6.6% white
> Homeownership rate: 47.1% black; 79.3% white
Disparities in socioeconomic outcomes in Florida’s 21st Congressional District are worse than anywhere else in the state. Black area workers are nearly twice as likely to be unemployed as white workers, and the 19.5% poverty rate among the district’s black residents is more than double the white poverty rate.
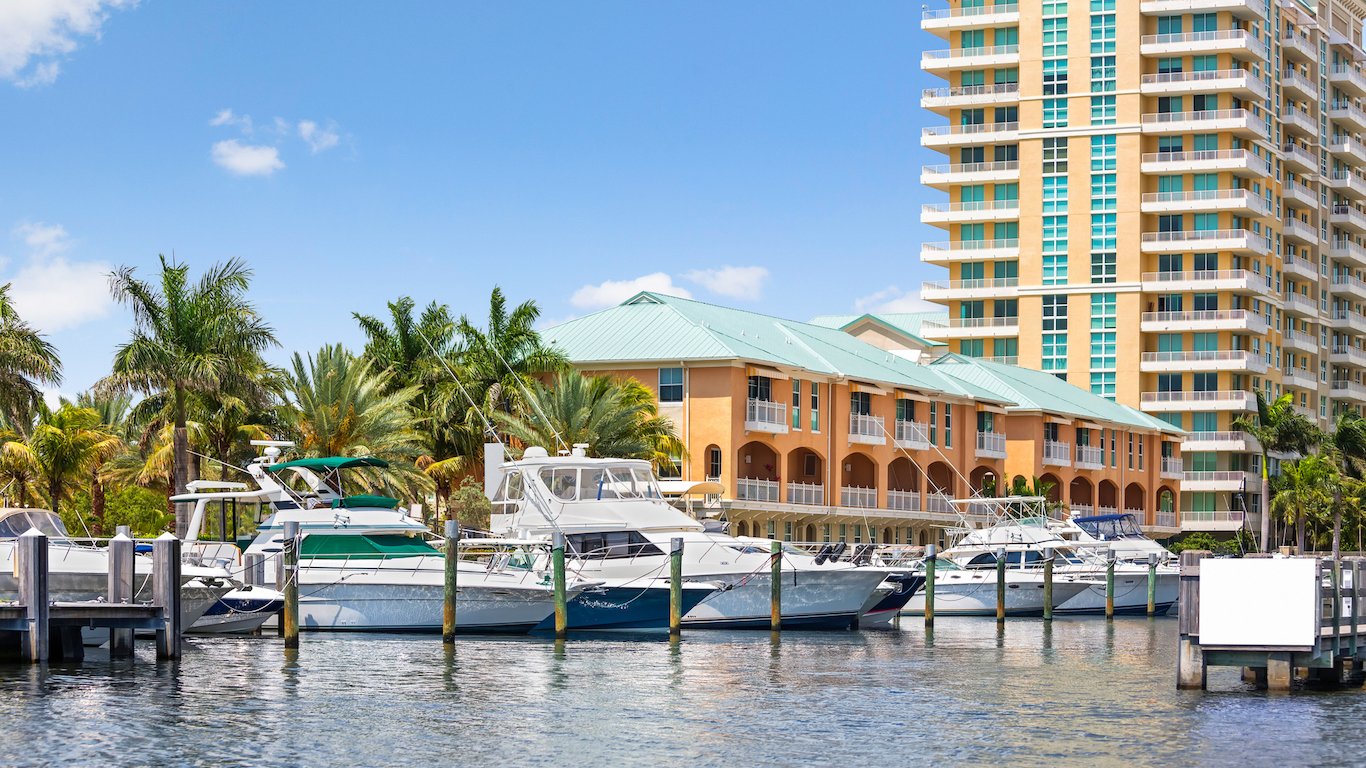
The district is located on Florida’s Atlantic coast, from West Palm Beach down to just north and west of Boca Raton. Democratic Congresswoman Lois Frankel currently represents the district.
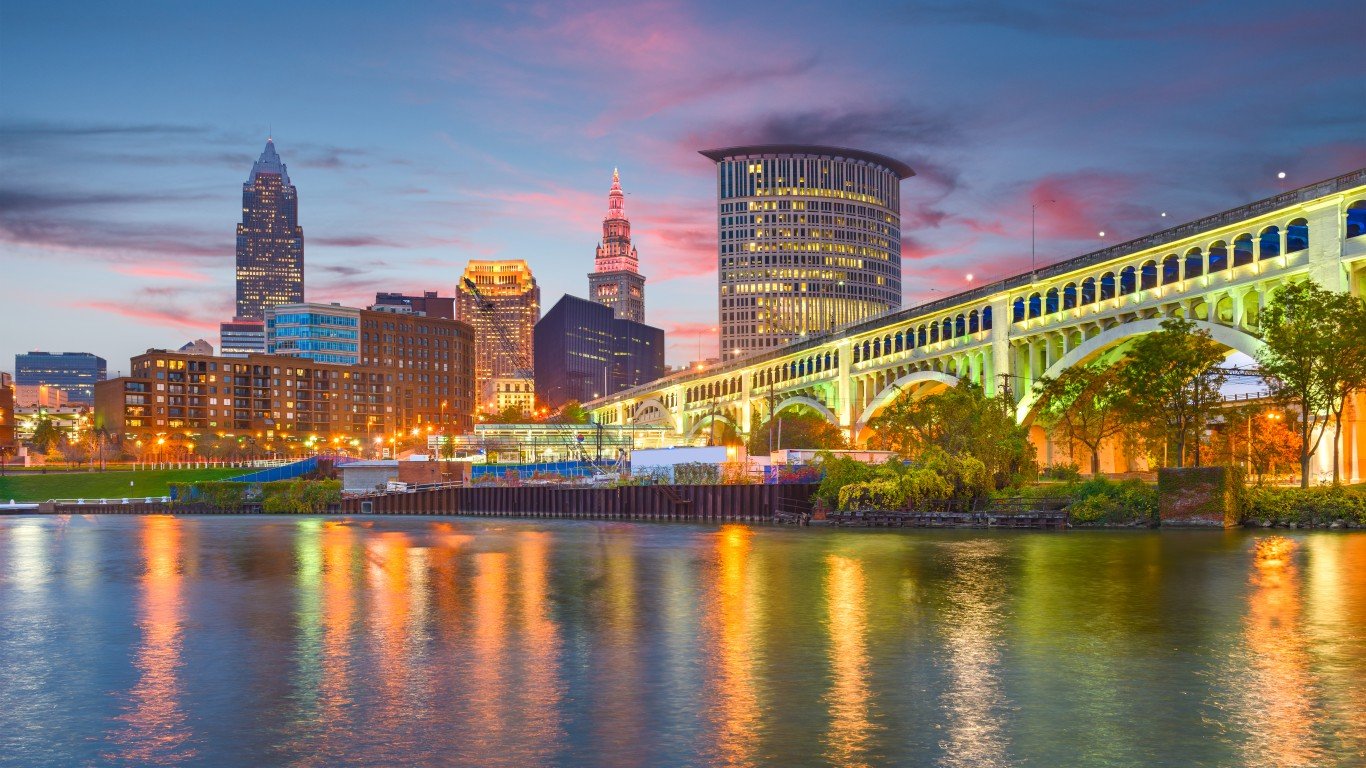
7. Ohio’s 11th Congressional District
> Current representative: Rep. Marcia L. Fudge (Democratic Party)
> Poverty rate: 34.5% black; 14.3% white
> Unemployment rate: 18.4% black; 6.0% white
> Homeownership rate: 38.2% black; 66.0% white
Ohio’s 11th Congressional District is located in the northern part of the state and stretches from Cleveland and Akron. The largely-black district votes heavily Democratic. Congresswoman Marcia Fudge has served the area for the last decade.
The typical white household in the district earns $61,813 a year, more than double the median income of $30,466 for black area households. Black workers in the area are also more than three times as likely to be unemployed as white workers. Heavily segregated areas often have the worst disparities in economic measures like these — and due to the legacy of racist zoning policies in the 20th century, Cleveland ranks among the most racially segregated cities in the country.
[in-text-ad-2]
6. Ohio’s 1st Congressional District
> Current representative: Rep. Steve Chabot (Republican Party)
> Poverty rate: 35.4% black; 9.2% white
> Unemployment rate: 15.5% black; 5.2% white
> Homeownership rate: 30.1% black; 73.1% white
Ohio’s 1st Congressional District has the worst disparities along racial lines of any district in the state. The district covers much of the city of Cincinnati and borders Kentucky and Indiana. Republican Rep. Steve Chabot has served the majority-white district since 2011. Chabot also represented the district between 1995 and 2008, the year he lost his bid for reelection.
The typical black household in the area has an income of less than $30,000 a year, while the median income for white households in the district is nearly $76,000 annually. Black area residents are also about three times as likely to be unemployed and live in poverty as white residents.
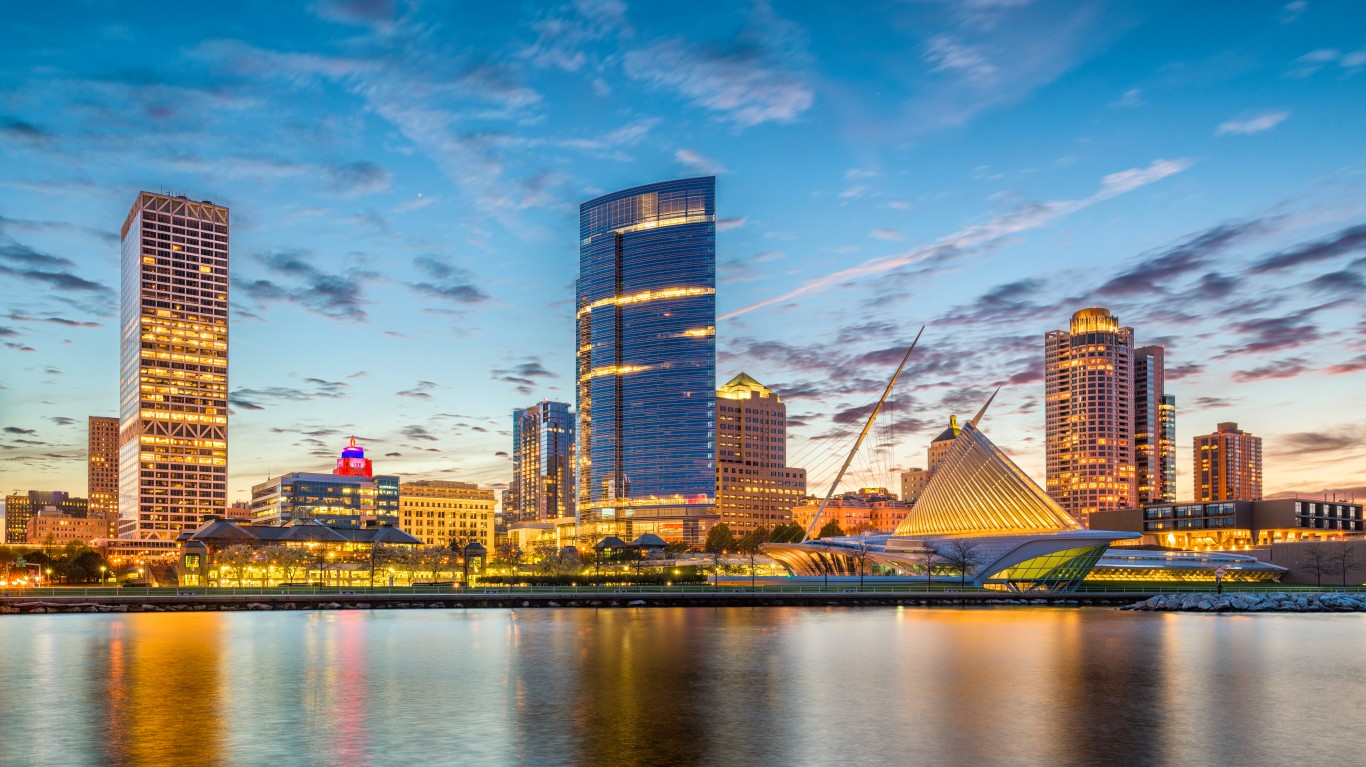
5. Wisconsin’s 4th Congressional District
> Current representative: Rep. Gwen Moore (Democratic Party)
> Poverty rate: 35.6% black; 12.9% white
> Unemployment rate: 15.0% black; 4.6% white
> Homeownership rate: 28.1% black; 59.3% white
Wisconsin’s 4th Congressional District includes the city of Milwaukee, which is one of the most segregated cities in the country. Like many Rust Belt cities, Milwaukee’s current segregation patterns can be traced back to discriminatory appraisal maps drawn up in the early 20th century that led to reduced property values in majority African American neighborhoods.
Segregated communities often have the worst economic disparities along racial lines, and Wisconsin’s 4th District is no exception. The typical white area household earns over $60,000 a year, double the median income among black households of $30,400 a year. The black unemployment rate of 15.0% in the area is also more than triple the unemployment rate of 4.6% among white workers.
[in-text-ad]
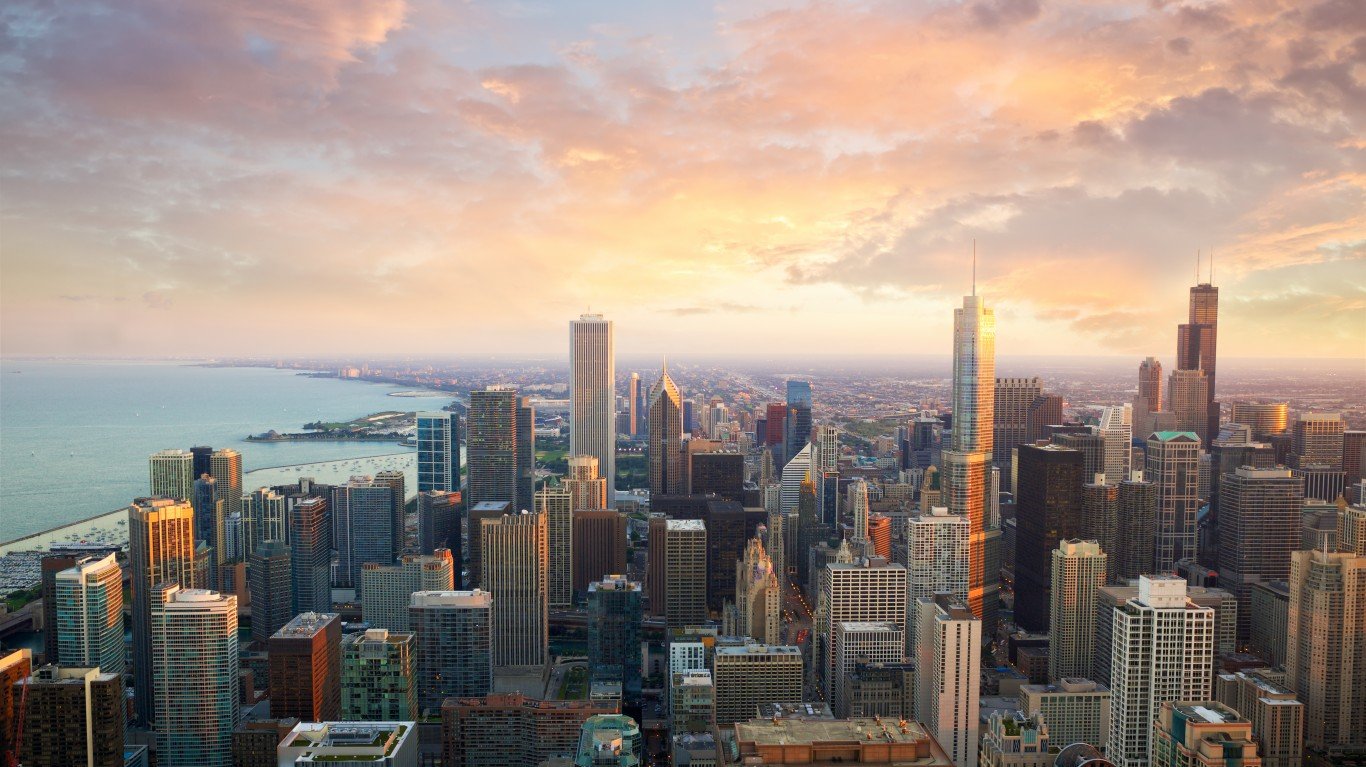
4. Illinois’s 7th Congressional District
> Current representative: Rep. Danny K. Davis (Democratic Party)
> Poverty rate: 32.8% black; 8.6% white
> Unemployment rate: 20.0% black; 4.1% white
> Homeownership rate: 31.0% black; 53.5% white
Illinois’s 7th Congressional District includes Chicago and stretches westward into the interior of the state. A history of exclusionary zoning, redlining, and discriminatory lending practices in Chicago throughout the 20th century has led to deeply entrenched segregation in and around the city — and contributed to some of the largest racial disparities in income and education of any congressional district.
The typical black household in the district has an income of just $30,159 a year, less than a third of the median income of $99,429 among white area households. Income is closely tied to educational attainment, and just 16.1% of black adults in the district have a bachelor’s degree compared to 74.1% of white adults.
[recirclink id=560643]
3. Illinois’s 17th Congressional District
> Current representative: Rep. Cheri Bustos (Democratic Party)
> Poverty rate: 39.8% black; 12.9% white
> Unemployment rate: 21.6% black; 6.6% white
> Homeownership rate: 31.3% black; 73.0% white
The 17th District in Illinois stretches through much of the northwestern portion of the state and includes parts of Peoria and Rockford. The district is one of 108 nationwide that intersects with one or more pivot counties — counties that went for Trump in 2016 after voting for Obama in both 2008 and 2012. Democratic Rep. Cheri Bustos defeated incumbent Republican Congressman Bobby Schilling in 2012 and has served the district ever since.
Currently, the typical black household in the district has an income of just $25,840 a year, about half the income of $51,047 of the typical white household. The black unemployment rate in the district of 21.6% is also nearly four times the white unemployment rate of 6.6%.

2. New York’s 25th Congressional District
> Current representative: Rep. Joseph D. Morelle (Democratic Party)
> Poverty rate: 34.8% black; 8.2% white
> Unemployment rate: 15.1% black; 4.7% white
> Homeownership rate: 31.6% black; 72.2% white
The 25th Congressional District in New York borders Lake Ontario and includes the city of Rochester. Segregation leads to disparate outcomes, and Rochester schools are highly segregated, as only 10% of students in the school district are white.
Currently, over 94% of white adults in the congressional district have a high school diploma, compared to just 78.4% of black adults. Education is closely linked to income, and more than one in every three black district residents live below the poverty line, compared to 8.2% of white residents. The district’s seat is currently held by Rep. Joseph Morelle, a Democrat.
[in-text-ad-2]
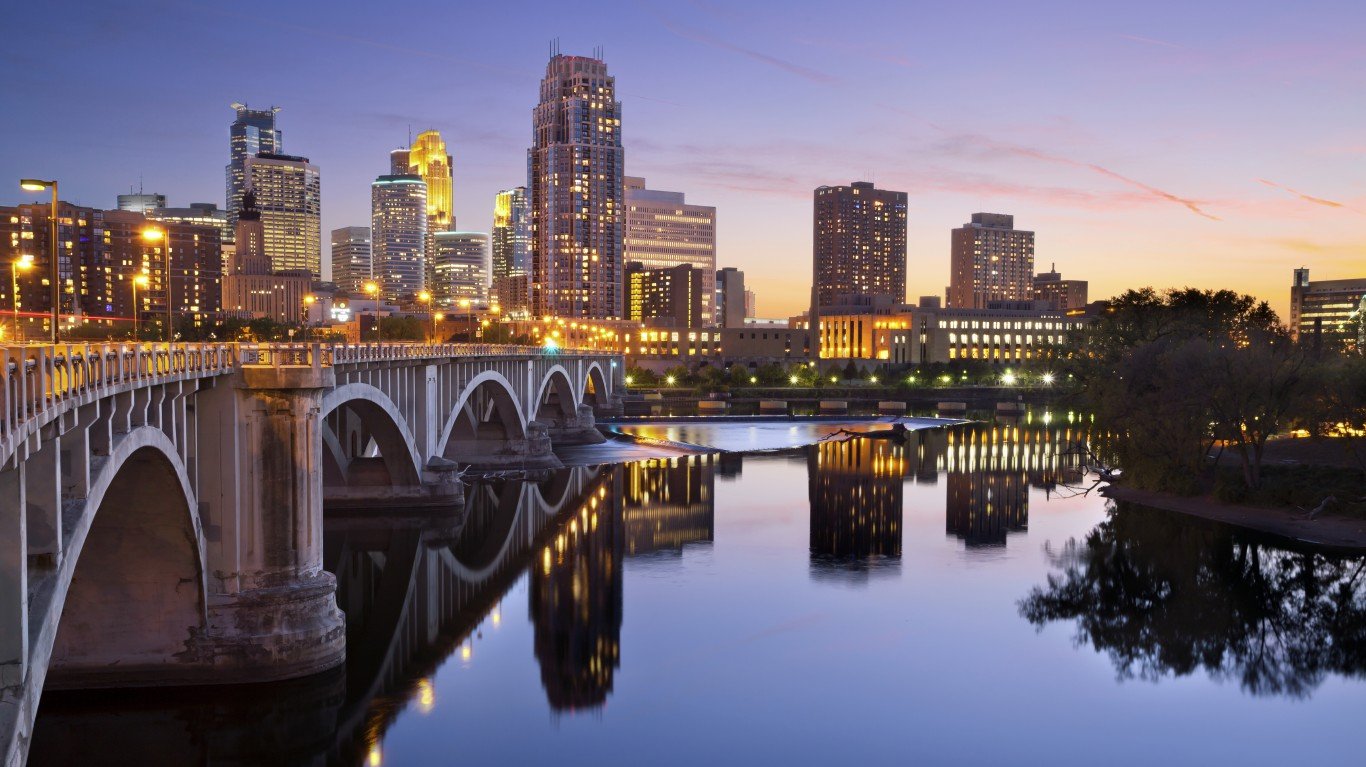
1. Minnesota’s 5th Congressional District
> Current representative: Rep. Ilhan Omar (Democratic Party)
> Poverty rate: 37.2% black; 9.4% white
> Unemployment rate: 12.3% black; 4.0% white
> Homeownership rate: 19.8% black; 63.1% white
Minnesota’s 5th Congressional District covers the city of Minneapolis. Rep. Ilhan Omar was elected to represent the district in 2018. She is the first refugee and Somali-American woman ever to serve in the U.S. Congress.
Black area residents are about four times more likely to live below the poverty line than white residents and three times more likely to be unemployed. Disparate outcomes along racial lines in the district are largely the legacy of historic racism. Minneapolis is one of several Midwestern cities that enacted restrictive housing covenants and exclusionary zoning policies in the early 20th century. These policies impact residential patterns to this day.
Contact [email protected] for any questions or corrections.