
The United States is approaching another grim milestone in the ongoing COVID-19 pandemic. At the current rate of spread, well more than 10 million U.S. residents will have been infected with the virus that causes COVID-19 before the end of November. This comes as the coronavirus has reached its fastest rate of spread since the start of the pandemic — over the week ending Nov. 1, the country added more than 500,000 new cases.
While cases are rising in most parts of the country, the extent of the spread of the novel coronavirus continues to vary considerably from state to state, and from county to county.
Using data from state and local health departments, 24/7 Wall St. compiled and reviewed the average of daily new confirmed COVID-19 cases for the week ending Nov. 1 and compared it to the previous week to determine the county in each state where the virus is spreading the fastest, adjusted for the population. Every state but Hawaii has at least one county or county equivalent in which cases have been reported at a growing rate. We excluded counties with populations of fewer than 5,000 people, as well as those with fewer than 20 reported new cases in the past 14 days.
While all counties on the list are those where the virus is spreading the fastest in their respective states, the virus is spreading much faster in some of them compared to others. Nationwide, the average daily new cases increased by about 6 per 100,000 in the week ending Nov. 1 compared to the previous week, from an average of 16.3 per 100,000 to 22.3 per 100,000.
Fourteen states reported an increase of over 50 average daily new cases per 100,000 residents in the week ending Nov. 1 as compared to the week ending Oct. 25. Meanwhile, in 10 states, the county with the fastest spread reported a week-over-week increase of 10 or fewer new daily cases, on average. These are the states where the virus is spreading the fastest.
As has been the case throughout the pandemic, some of the worst hotspots are tied to residential facilities such as prisons and assisted living facilities. For instance, Bon Homme County, North Dakota, which reported by far the largest increase in daily new cases of any county in the country, is home to Mike Durfee State Prison. The prison has reported a record spike in cases in the past few weeks.
Click here to see the places in every state where COVID-19 is growing the fastest right now.

Alabama: Houston County
> Change in daily avg. new COVID-19 cases, week over week: +25.8 per 100,000 people
> Avg. new daily cases in Houston County in 7 days ending Nov. 1: 59.6 per 100,000
> Avg. new daily cases in Houston County in 7 days ending Oct. 25: 33.9 per 100,000
> Avg. new daily cases in Alabama in 7 days ending Nov. 1: 32 per 100,000 (21st most)
> Cumulative confirmed COVID-19 cases in Houston County as of Nov. 1: 4,140 per 100,000 people (total: 4,320)
> Population: 104,352
> Largest place in Houston County: Dothan
[in-text-ad]
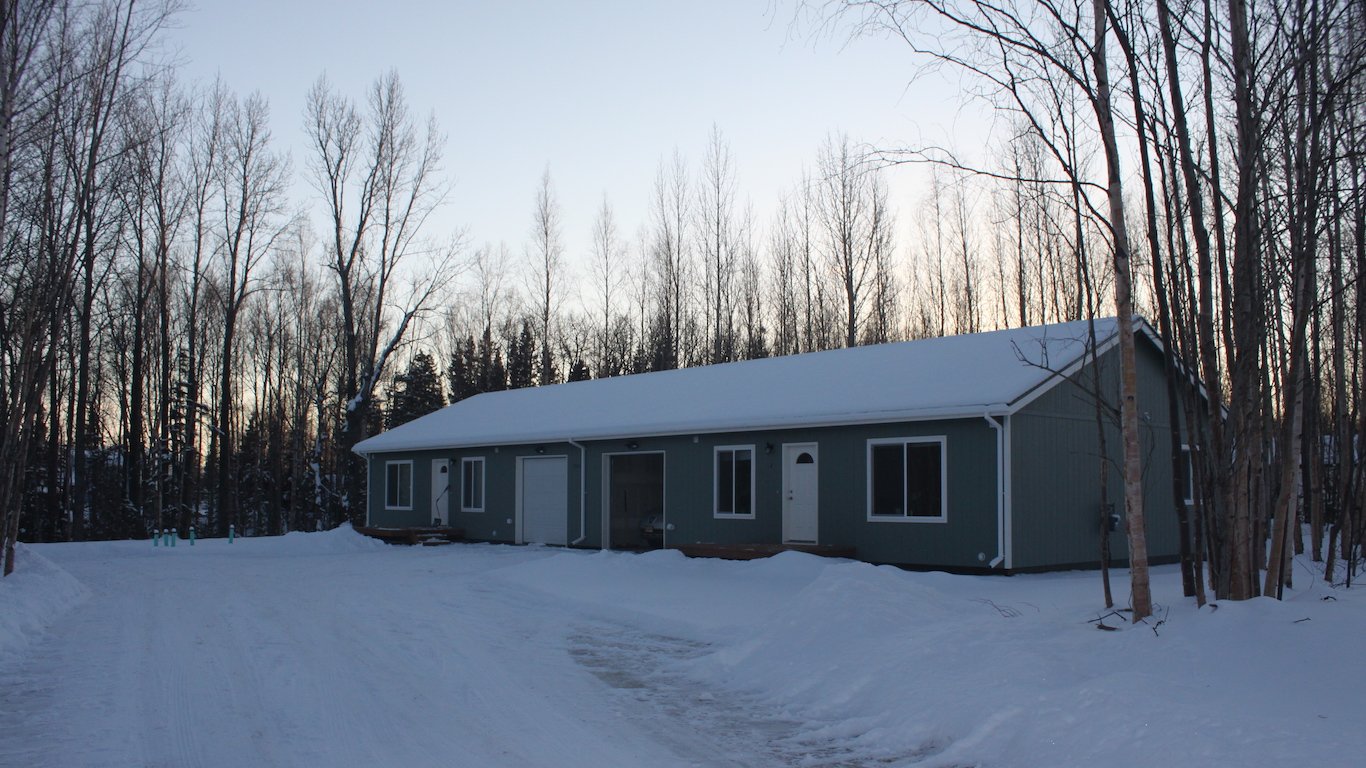
Alaska: Matanuska-Susitna Borough
> Change in daily avg. new COVID-19 cases, week over week: +33.5 per 100,000 people
> Avg. new daily cases in Matanuska-Susitna Borough in 7 days ending Nov. 1: 54.3 per 100,000
> Avg. new daily cases in Matanuska-Susitna Borough in 7 days ending Oct. 25: 20.8 per 100,000
> Avg. new daily cases in Alaska in 7 days ending Nov. 1: 50 per 100,000 (4th most)
> Cumulative confirmed COVID-19 cases in Matanuska-Susitna Borough as of Nov. 1: 1,469 per 100,000 people (total: 1,520)
> Population: 103,464
> Largest place in Matanuska-Susitna Borough: Knik-Fairview CDP
[recirclink id=799927]
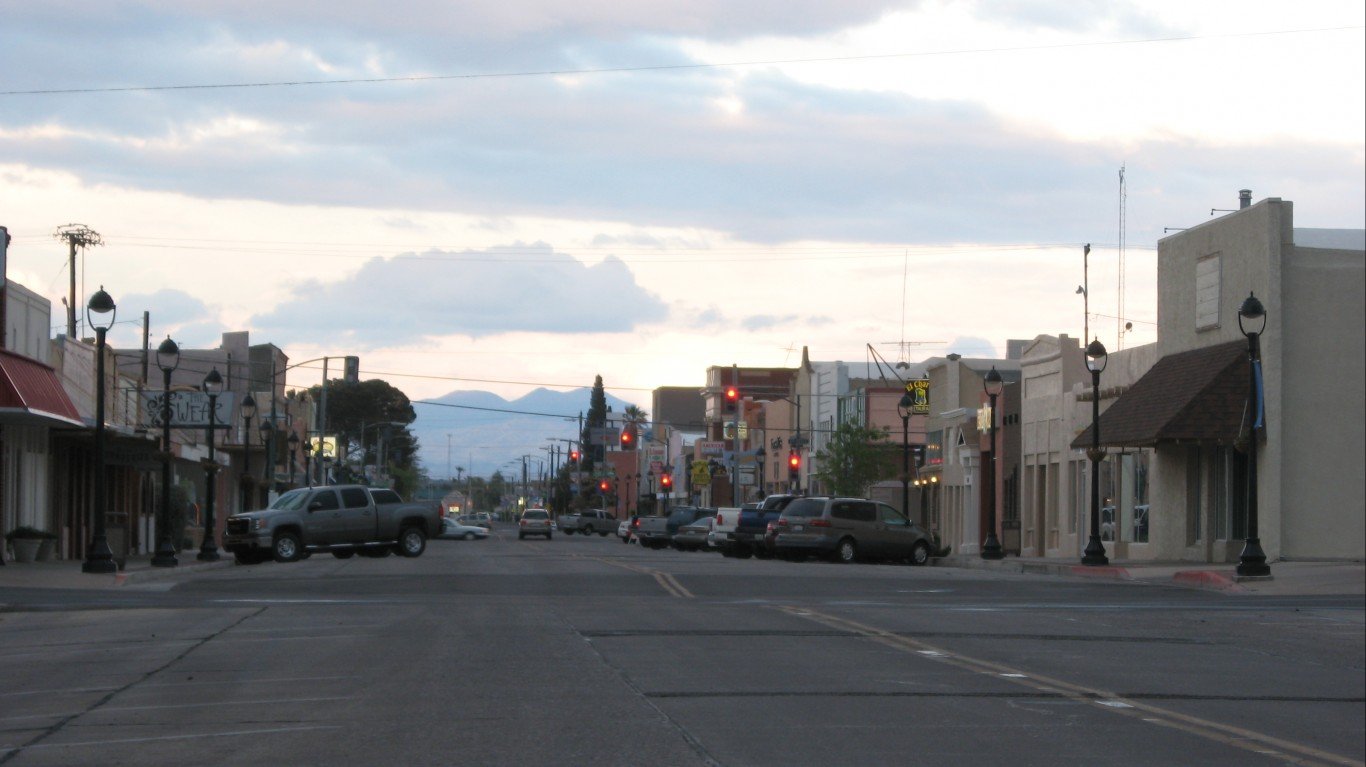
Arizona: Graham County
> Change in daily avg. new COVID-19 cases, week over week: +10.3 per 100,000 people
> Avg. new daily cases in Graham County in 7 days ending Nov. 1: 47.1 per 100,000
> Avg. new daily cases in Graham County in 7 days ending Oct. 25: 36.7 per 100,000
> Avg. new daily cases in Arizona in 7 days ending Nov. 1: 16 per 100,000 (22nd fewest)
> Cumulative confirmed COVID-19 cases in Graham County as of Nov. 1: 3,382 per 100,000 people (total: 1,281)
> Population: 37,879
> Largest place in Graham County: Safford

Arkansas: Jackson County
> Change in daily avg. new COVID-19 cases, week over week: +55.9 per 100,000 people
> Avg. new daily cases in Jackson County in 7 days ending Nov. 1: 144.4 per 100,000
> Avg. new daily cases in Jackson County in 7 days ending Oct. 25: 88.5 per 100,000
> Avg. new daily cases in Arkansas in 7 days ending Nov. 1: 33 per 100,000 (8th fewest)
> Cumulative confirmed COVID-19 cases in Jackson County as of Nov. 1: 6,433 per 100,000 people (total: 1,108)
> Population: 17,225
> Largest place in Jackson County: Newport
[in-text-ad-2]

California: Kings County
> Change in daily avg. new COVID-19 cases, week over week: +17.3 per 100,000 people
> Avg. new daily cases in Kings County in 7 days ending Nov. 1: 23.8 per 100,000
> Avg. new daily cases in Kings County in 7 days ending Oct. 25: 6.5 per 100,000
> Avg. new daily cases in California in 7 days ending Nov. 1: 11 per 100,000 (16th fewest)
> Cumulative confirmed COVID-19 cases in Kings County as of Nov. 1: 5,738 per 100,000 people (total: 8,612)
> Population: 150,075
> Largest place in Kings County: Hanford

Colorado: Pueblo County
> Change in daily avg. new COVID-19 cases, week over week: +13.9 per 100,000 people
> Avg. new daily cases in Pueblo County in 7 days ending Nov. 1: 36.5 per 100,000
> Avg. new daily cases in Pueblo County in 7 days ending Oct. 25: 22.7 per 100,000
> Avg. new daily cases in Colorado in 7 days ending Nov. 1: 29 per 100,000 (16th most)
> Cumulative confirmed COVID-19 cases in Pueblo County as of Nov. 1: 1,479 per 100,000 people (total: 2,436)
> Population: 164,685
> Largest place in Pueblo County: Pueblo
[in-text-ad]

Connecticut: Fairfield County
> Change in daily avg. new COVID-19 cases, week over week: +11.7 per 100,000 people
> Avg. new daily cases in Fairfield County in 7 days ending Nov. 1: 24.3 per 100,000
> Avg. new daily cases in Fairfield County in 7 days ending Oct. 25: 12.6 per 100,000
> Avg. new daily cases in Connecticut in 7 days ending Nov. 1: 19 per 100,000 (18th most)
> Cumulative confirmed COVID-19 cases in Fairfield County as of Nov. 1: 2,558 per 100,000 people (total: 24,155)
> Population: 944,348
> Largest place in Fairfield County: Bridgeport
[recirclink id=723793]

Delaware: Kent County
> Change in daily avg. new COVID-19 cases, week over week: +2.7 per 100,000 people
> Avg. new daily cases in Kent County in 7 days ending Nov. 1: 11.0 per 100,000
> Avg. new daily cases in Kent County in 7 days ending Oct. 25: 8.3 per 100,000
> Avg. new daily cases in Delaware in 7 days ending Nov. 1: 15 per 100,000 (10th fewest)
> Cumulative confirmed COVID-19 cases in Kent County as of Nov. 1: 2,063 per 100,000 people (total: 3,606)
> Population: 174,822
> Largest place in Kent County: Dover

Florida: Taylor County
> Change in daily avg. new COVID-19 cases, week over week: +8.2 per 100,000 people
> Avg. new daily cases in Taylor County in 7 days ending Nov. 1: 25.1 per 100,000
> Avg. new daily cases in Taylor County in 7 days ending Oct. 25: 16.9 per 100,000
> Avg. new daily cases in Florida in 7 days ending Nov. 1: 18 per 100,000 (23rd fewest)
> Cumulative confirmed COVID-19 cases in Taylor County as of Nov. 1: 6,770 per 100,000 people (total: 1,496)
> Population: 22,098
> Largest place in Taylor County: Perry
[in-text-ad-2]

Georgia: Chattahoochee County
> Change in daily avg. new COVID-19 cases, week over week: +22.0 per 100,000 people
> Avg. new daily cases in Chattahoochee County in 7 days ending Nov. 1: 48.0 per 100,000
> Avg. new daily cases in Chattahoochee County in 7 days ending Oct. 25: 26.0 per 100,000
> Avg. new daily cases in Georgia in 7 days ending Nov. 1: 15 per 100,000 (19th fewest)
> Cumulative confirmed COVID-19 cases in Chattahoochee County as of Nov. 1: 16,755 per 100,000 people (total: 1,804)
> Population: 10,767
> Largest place in Chattahoochee County: Fort Benning South CDP

Hawaii: No county with significant increase
> Avg. new daily cases in Hawaii in 7 days ending Nov. 1: 06 per 100,000 (6th fewest)
[in-text-ad]

Idaho: Lincoln County
> Change in daily avg. new COVID-19 cases, week over week: +94.4 per 100,000 people
> Avg. new daily cases in Lincoln County in 7 days ending Nov. 1: 171.1 per 100,000
> Avg. new daily cases in Lincoln County in 7 days ending Oct. 25: 76.7 per 100,000
> Avg. new daily cases in Idaho in 7 days ending Nov. 1: 50 per 100,000 (17th fewest)
> Cumulative confirmed COVID-19 cases in Lincoln County as of Nov. 1: 4,510 per 100,000 people (total: 240)
> Population: 5,321
> Largest place in Lincoln County: Shoshone
[recirclink id=769133]
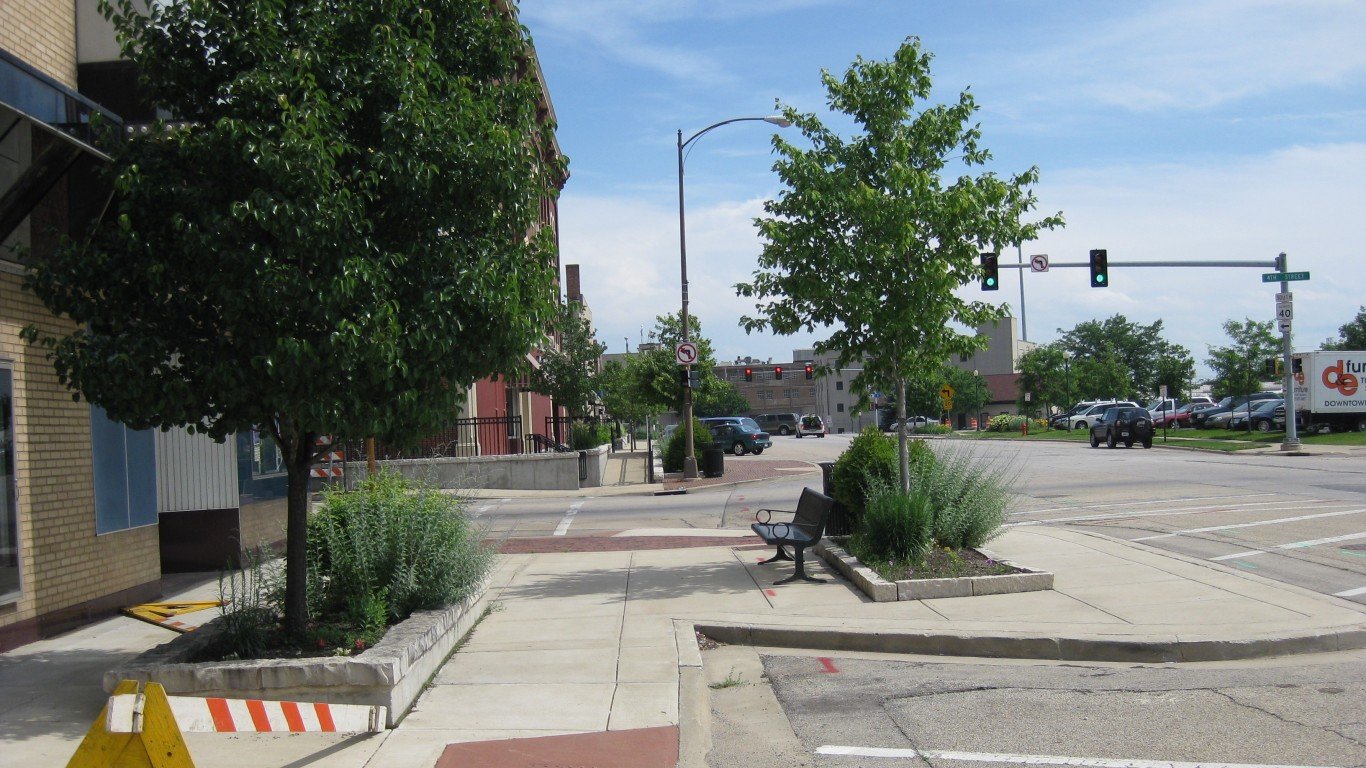
Illinois: Whiteside County
> Change in daily avg. new COVID-19 cases, week over week: +32.7 per 100,000 people
> Avg. new daily cases in Whiteside County in 7 days ending Nov. 1: 87.8 per 100,000
> Avg. new daily cases in Whiteside County in 7 days ending Oct. 25: 55.0 per 100,000
> Avg. new daily cases in Illinois in 7 days ending Nov. 1: 40 per 100,000 (10th most)
> Cumulative confirmed COVID-19 cases in Whiteside County as of Nov. 1: 3,199 per 100,000 people (total: 1,804)
> Population: 56,396
> Largest place in Whiteside County: Sterling

Indiana: Perry County
> Change in daily avg. new COVID-19 cases, week over week: +44.7 per 100,000 people
> Avg. new daily cases in Perry County in 7 days ending Nov. 1: 82.0 per 100,000
> Avg. new daily cases in Perry County in 7 days ending Oct. 25: 37.3 per 100,000
> Avg. new daily cases in Indiana in 7 days ending Nov. 1: 37 per 100,000 (13th most)
> Cumulative confirmed COVID-19 cases in Perry County as of Nov. 1: 2,638 per 100,000 people (total: 505)
> Population: 19,141
> Largest place in Perry County: Tell City
[in-text-ad-2]
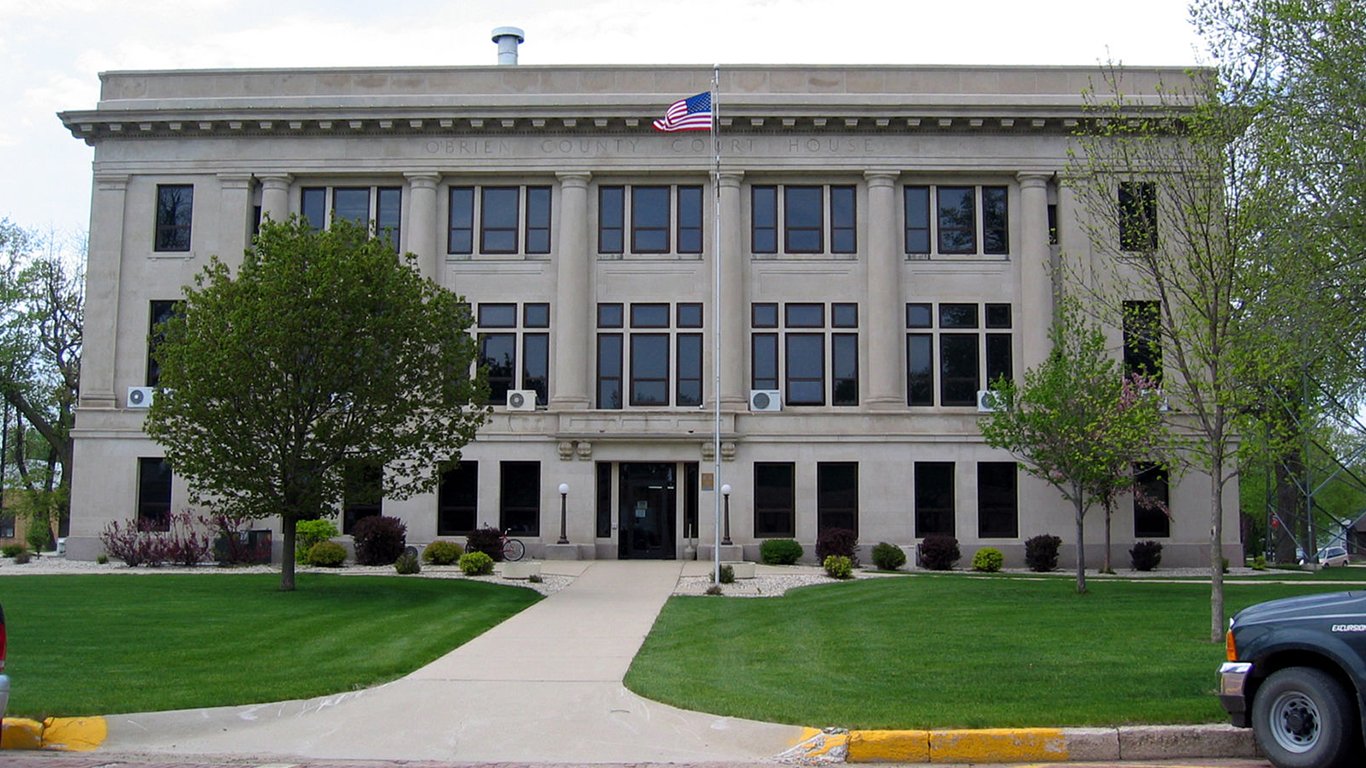
Iowa: O’Brien County
> Change in daily avg. new COVID-19 cases, week over week: +58.8 per 100,000 people
> Avg. new daily cases in O’Brien County in 7 days ending Nov. 1: 128.2 per 100,000
> Avg. new daily cases in O’Brien County in 7 days ending Oct. 25: 69.4 per 100,000
> Avg. new daily cases in Iowa in 7 days ending Nov. 1: 51 per 100,000 (5th most)
> Cumulative confirmed COVID-19 cases in O’Brien County as of Nov. 1: 5,887 per 100,000 people (total: 819)
> Population: 13,911
> Largest place in O’Brien County: Sheldon
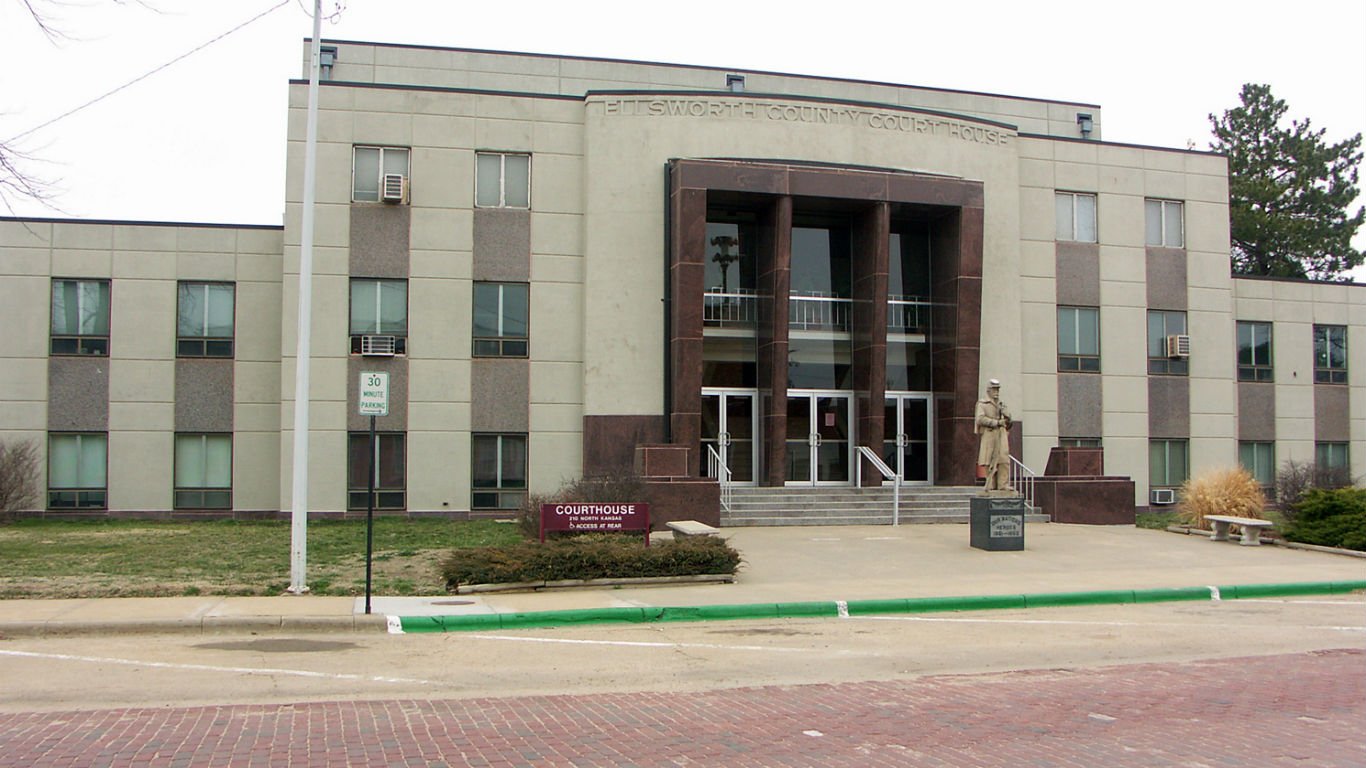
Kansas: Ellsworth County
> Change in daily avg. new COVID-19 cases, week over week: +105.7 per 100,000 people
> Avg. new daily cases in Ellsworth County in 7 days ending Nov. 1: 224.1 per 100,000
> Avg. new daily cases in Ellsworth County in 7 days ending Oct. 25: 118.4 per 100,000
> Avg. new daily cases in Kansas in 7 days ending Nov. 1: 37 per 100,000 (6th most)
> Cumulative confirmed COVID-19 cases in Ellsworth County as of Nov. 1: 5,244 per 100,000 people (total: 330)
> Population: 6,293
> Largest place in Ellsworth County: Ellsworth
[in-text-ad]

Kentucky: Lee County
> Change in daily avg. new COVID-19 cases, week over week: +98.9 per 100,000 people
> Avg. new daily cases in Lee County in 7 days ending Nov. 1: 188.6 per 100,000
> Avg. new daily cases in Lee County in 7 days ending Oct. 25: 89.8 per 100,000
> Avg. new daily cases in Kentucky in 7 days ending Nov. 1: 34 per 100,000 (11th most)
> Cumulative confirmed COVID-19 cases in Lee County as of Nov. 1: 2,800 per 100,000 people (total: 189)
> Population: 6,751
> Largest place in Lee County: Beattyville
[recirclink id=595626]

Louisiana: Caldwell Parish
> Change in daily avg. new COVID-19 cases, week over week: +9.8 per 100,000 people
> Avg. new daily cases in Caldwell Parish in 7 days ending Nov. 1: 29.0 per 100,000
> Avg. new daily cases in Caldwell Parish in 7 days ending Oct. 25: 19.2 per 100,000
> Avg. new daily cases in Louisiana in 7 days ending Nov. 1: 12 per 100,000 (2nd fewest)
> Cumulative confirmed COVID-19 cases in Caldwell Parish as of Nov. 1: 3,762 per 100,000 people (total: 376)
> Population: 9,996
> Largest place in Caldwell Parish: Clarks

Maine: Somerset County
> Change in daily avg. new COVID-19 cases, week over week: +9.9 per 100,000 people
> Avg. new daily cases in Somerset County in 7 days ending Nov. 1: 11.3 per 100,000
> Avg. new daily cases in Somerset County in 7 days ending Oct. 25: 1.4 per 100,000
> Avg. new daily cases in Maine in 7 days ending Nov. 1: 04 per 100,000 (15th fewest)
> Cumulative confirmed COVID-19 cases in Somerset County as of Nov. 1: 392 per 100,000 people (total: 199)
> Population: 50,710
> Largest place in Somerset County: Skowhegan CDP
[in-text-ad-2]

Maryland: Allegany County
> Change in daily avg. new COVID-19 cases, week over week: +8.0 per 100,000 people
> Avg. new daily cases in Allegany County in 7 days ending Nov. 1: 20.6 per 100,000
> Avg. new daily cases in Allegany County in 7 days ending Oct. 25: 12.6 per 100,000
> Avg. new daily cases in Maryland in 7 days ending Nov. 1: 13 per 100,000 (18th fewest)
> Cumulative confirmed COVID-19 cases in Allegany County as of Nov. 1: 1,077 per 100,000 people (total: 775)
> Population: 71,977
> Largest place in Allegany County: Cumberland

Massachusetts: Bristol County
> Change in daily avg. new COVID-19 cases, week over week: +12.3 per 100,000 people
> Avg. new daily cases in Bristol County in 7 days ending Nov. 1: 25.6 per 100,000
> Avg. new daily cases in Bristol County in 7 days ending Oct. 25: 13.3 per 100,000
> Avg. new daily cases in Massachusetts in 7 days ending Nov. 1: 16 per 100,000 (20th most)
> Cumulative confirmed COVID-19 cases in Bristol County as of Nov. 1: 2,292 per 100,000 people (total: 12,812)
> Population: 558,905
> Largest place in Bristol County: New Bedford
[in-text-ad]

Michigan: Luce County
> Change in daily avg. new COVID-19 cases, week over week: +27.6 per 100,000 people
> Avg. new daily cases in Luce County in 7 days ending Nov. 1: 53.2 per 100,000
> Avg. new daily cases in Luce County in 7 days ending Oct. 25: 25.7 per 100,000
> Avg. new daily cases in Michigan in 7 days ending Nov. 1: 28 per 100,000 (15th most)
> Cumulative confirmed COVID-19 cases in Luce County as of Nov. 1: 1,226 per 100,000 people (total: 78)
> Population: 6,364
> Largest place in Luce County: Newberry
[recirclink id=799927]

Minnesota: Polk County
> Change in daily avg. new COVID-19 cases, week over week: +67.8 per 100,000 people
> Avg. new daily cases in Polk County in 7 days ending Nov. 1: 119.6 per 100,000
> Avg. new daily cases in Polk County in 7 days ending Oct. 25: 51.9 per 100,000
> Avg. new daily cases in Minnesota in 7 days ending Nov. 1: 35 per 100,000 (9th most)
> Cumulative confirmed COVID-19 cases in Polk County as of Nov. 1: 3,077 per 100,000 people (total: 972)
> Population: 31,591
> Largest place in Polk County: East Grand Forks

Mississippi: Perry County
> Change in daily avg. new COVID-19 cases, week over week: +23.4 per 100,000 people
> Avg. new daily cases in Perry County in 7 days ending Nov. 1: 46.2 per 100,000
> Avg. new daily cases in Perry County in 7 days ending Oct. 25: 22.7 per 100,000
> Avg. new daily cases in Mississippi in 7 days ending Nov. 1: 26 per 100,000 (5th fewest)
> Cumulative confirmed COVID-19 cases in Perry County as of Nov. 1: 4,506 per 100,000 people (total: 542)
> Population: 12,028
> Largest place in Perry County: Beaumont
[in-text-ad-2]

Missouri: Sullivan County
> Change in daily avg. new COVID-19 cases, week over week: +77.5 per 100,000 people
> Avg. new daily cases in Sullivan County in 7 days ending Nov. 1: 126.6 per 100,000
> Avg. new daily cases in Sullivan County in 7 days ending Oct. 25: 49.1 per 100,000
> Avg. new daily cases in Missouri in 7 days ending Nov. 1: 35 per 100,000 (17th most)
> Cumulative confirmed COVID-19 cases in Sullivan County as of Nov. 1: 6,031 per 100,000 people (total: 381)
> Population: 6,317
> Largest place in Sullivan County: Milan

Montana: Pondera County
> Change in daily avg. new COVID-19 cases, week over week: +53.0 per 100,000 people
> Avg. new daily cases in Pondera County in 7 days ending Nov. 1: 89.5 per 100,000
> Avg. new daily cases in Pondera County in 7 days ending Oct. 25: 36.5 per 100,000
> Avg. new daily cases in Montana in 7 days ending Nov. 1: 72 per 100,000 (7th most)
> Cumulative confirmed COVID-19 cases in Pondera County as of Nov. 1: 3,177 per 100,000 people (total: 192)
> Population: 6,044
> Largest place in Pondera County: Conrad
[in-text-ad]
Nebraska: Madison County
> Change in daily avg. new COVID-19 cases, week over week: +50.1 per 100,000 people
> Avg. new daily cases in Madison County in 7 days ending Nov. 1: 98.1 per 100,000
> Avg. new daily cases in Madison County in 7 days ending Oct. 25: 47.9 per 100,000
> Avg. new daily cases in Nebraska in 7 days ending Nov. 1: 48 per 100,000 (23rd most)
> Cumulative confirmed COVID-19 cases in Madison County as of Nov. 1: 4,314 per 100,000 people (total: 1,517)
> Population: 35,164
> Largest place in Madison County: Norfolk
[recirclink id=723793]

Nevada: Nye County
> Change in daily avg. new COVID-19 cases, week over week: +12.6 per 100,000 people
> Avg. new daily cases in Nye County in 7 days ending Nov. 1: 27.7 per 100,000
> Avg. new daily cases in Nye County in 7 days ending Oct. 25: 15.2 per 100,000
> Avg. new daily cases in Nevada in 7 days ending Nov. 1: 27 per 100,000 (21st fewest)
> Cumulative confirmed COVID-19 cases in Nye County as of Nov. 1: 1,661 per 100,000 people (total: 726)
> Population: 43,705
> Largest place in Nye County: Pahrump CDP

New Hampshire: Grafton County
> Change in daily avg. new COVID-19 cases, week over week: +3.5 per 100,000 people
> Avg. new daily cases in Grafton County in 7 days ending Nov. 1: 5.9 per 100,000
> Avg. new daily cases in Grafton County in 7 days ending Oct. 25: 2.4 per 100,000
> Avg. new daily cases in New Hampshire in 7 days ending Nov. 1: 08 per 100,000 (14th fewest)
> Cumulative confirmed COVID-19 cases in Grafton County as of Nov. 1: 284 per 100,000 people (total: 255)
> Population: 89,811
> Largest place in Grafton County: Lebanon
[in-text-ad-2]

New Jersey: Essex County
> Change in daily avg. new COVID-19 cases, week over week: +9.5 per 100,000 people
> Avg. new daily cases in Essex County in 7 days ending Nov. 1: 27.6 per 100,000
> Avg. new daily cases in Essex County in 7 days ending Oct. 25: 18.0 per 100,000
> Avg. new daily cases in New Jersey in 7 days ending Nov. 1: 16 per 100,000 (25th fewest)
> Cumulative confirmed COVID-19 cases in Essex County as of Nov. 1: 3,187 per 100,000 people (total: 25,292)
> Population: 793,555
> Largest place in Essex County: Newark

New Mexico: Luna County
> Change in daily avg. new COVID-19 cases, week over week: +108.5 per 100,000 people
> Avg. new daily cases in Luna County in 7 days ending Nov. 1: 201.3 per 100,000
> Avg. new daily cases in Luna County in 7 days ending Oct. 25: 92.8 per 100,000
> Avg. new daily cases in New Mexico in 7 days ending Nov. 1: 37 per 100,000 (19th most)
> Cumulative confirmed COVID-19 cases in Luna County as of Nov. 1: 4,773 per 100,000 people (total: 1,158)
> Population: 24,264
> Largest place in Luna County: Deming
[in-text-ad]

New York: Wayne County
> Change in daily avg. new COVID-19 cases, week over week: +11.0 per 100,000 people
> Avg. new daily cases in Wayne County in 7 days ending Nov. 1: 16.7 per 100,000
> Avg. new daily cases in Wayne County in 7 days ending Oct. 25: 5.7 per 100,000
> Avg. new daily cases in New York in 7 days ending Nov. 1: 09 per 100,000 (9th fewest)
> Cumulative confirmed COVID-19 cases in Wayne County as of Nov. 1: 617 per 100,000 people (total: 561)
> Population: 90,856
> Largest place in Wayne County: Newark
[recirclink id=769133]

North Carolina: Madison County
> Change in daily avg. new COVID-19 cases, week over week: +21.3 per 100,000 people
> Avg. new daily cases in Madison County in 7 days ending Nov. 1: 52.8 per 100,000
> Avg. new daily cases in Madison County in 7 days ending Oct. 25: 31.6 per 100,000
> Avg. new daily cases in North Carolina in 7 days ending Nov. 1: 21 per 100,000 (7th fewest)
> Cumulative confirmed COVID-19 cases in Madison County as of Nov. 1: 1,416 per 100,000 people (total: 303)
> Population: 21,405
> Largest place in Madison County: Mars Hill
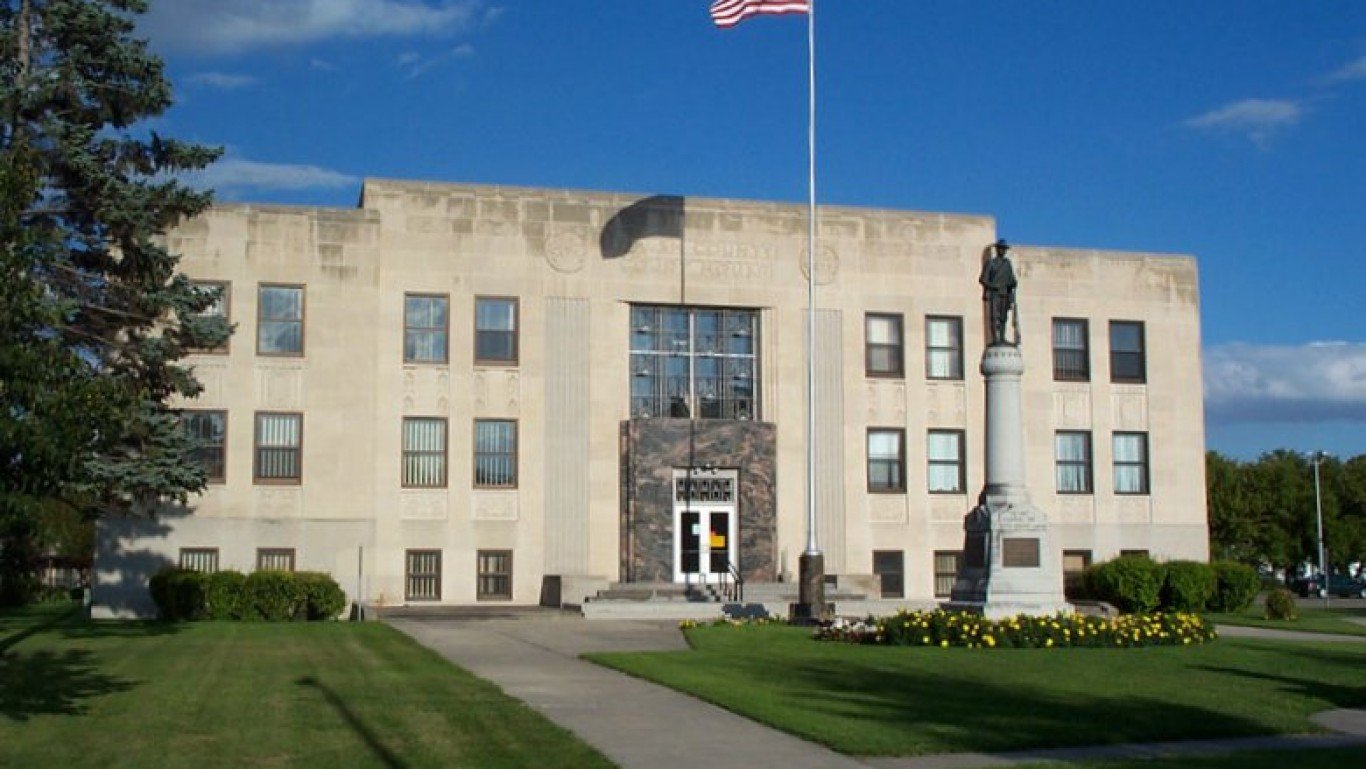
North Dakota: Walsh County
> Change in daily avg. new COVID-19 cases, week over week: +116.0 per 100,000 people
> Avg. new daily cases in Walsh County in 7 days ending Nov. 1: 208.6 per 100,000
> Avg. new daily cases in Walsh County in 7 days ending Oct. 25: 92.6 per 100,000
> Avg. new daily cases in North Dakota in 7 days ending Nov. 1: 132 per 100,000 (the most)
> Cumulative confirmed COVID-19 cases in Walsh County as of Nov. 1: 5,869 per 100,000 people (total: 634)
> Population: 10,802
> Largest place in Walsh County: Grafton
[in-text-ad-2]

Ohio: Holmes County
> Change in daily avg. new COVID-19 cases, week over week: +32.9 per 100,000 people
> Avg. new daily cases in Holmes County in 7 days ending Nov. 1: 70.1 per 100,000
> Avg. new daily cases in Holmes County in 7 days ending Oct. 25: 37.2 per 100,000
> Avg. new daily cases in Ohio in 7 days ending Nov. 1: 23 per 100,000 (22nd most)
> Cumulative confirmed COVID-19 cases in Holmes County as of Nov. 1: 2,118 per 100,000 people (total: 929)
> Population: 43,859
> Largest place in Holmes County: Millersburg
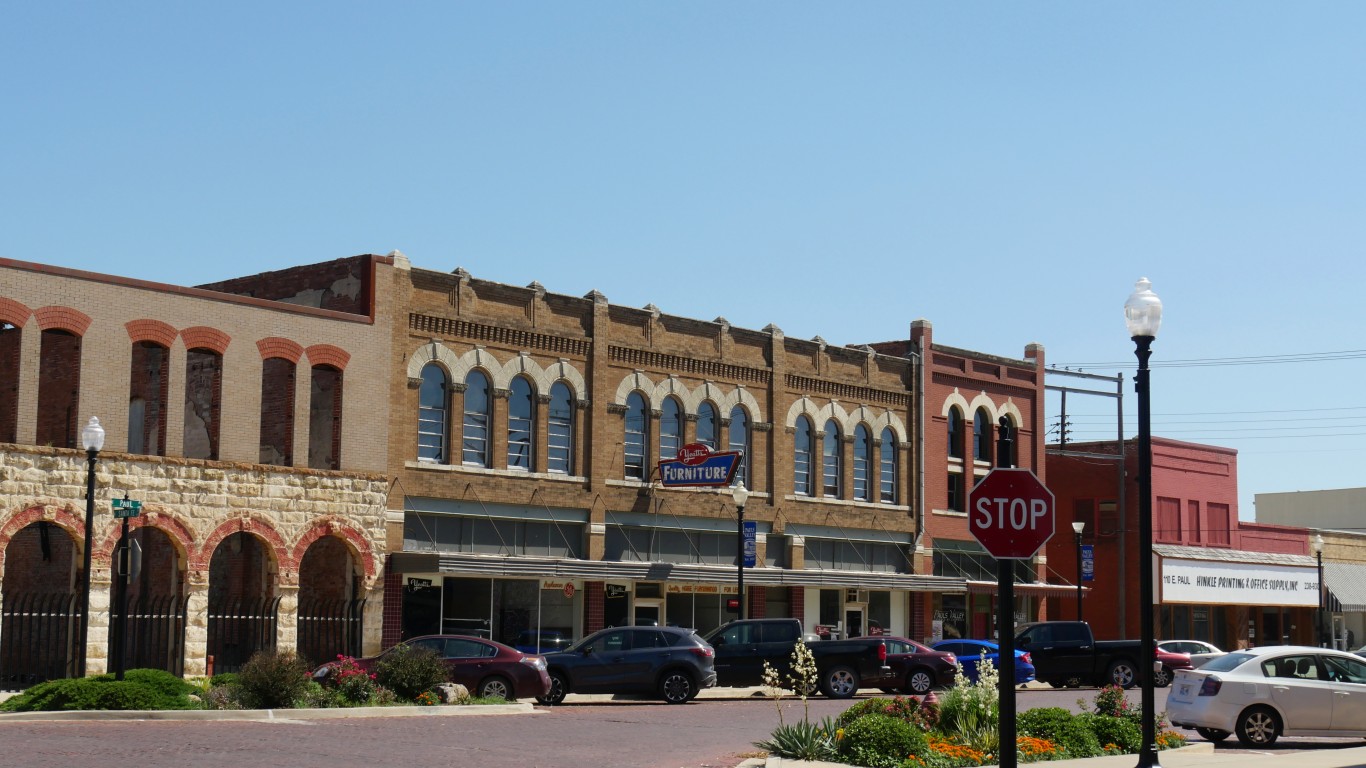
Oklahoma: Garvin County
> Change in daily avg. new COVID-19 cases, week over week: +16.9 per 100,000 people
> Avg. new daily cases in Garvin County in 7 days ending Nov. 1: 52.2 per 100,000
> Avg. new daily cases in Garvin County in 7 days ending Oct. 25: 35.3 per 100,000
> Avg. new daily cases in Oklahoma in 7 days ending Nov. 1: 29 per 100,000 (the fewest)
> Cumulative confirmed COVID-19 cases in Garvin County as of Nov. 1: 2,782 per 100,000 people (total: 774)
> Population: 27,823
> Largest place in Garvin County: Pauls Valley
[in-text-ad]

Oregon: Umatilla County
> Change in daily avg. new COVID-19 cases, week over week: +5.5 per 100,000 people
> Avg. new daily cases in Umatilla County in 7 days ending Nov. 1: 21.5 per 100,000
> Avg. new daily cases in Umatilla County in 7 days ending Oct. 25: 16.0 per 100,000
> Avg. new daily cases in Oregon in 7 days ending Nov. 1: 10 per 100,000 (13th fewest)
> Cumulative confirmed COVID-19 cases in Umatilla County as of Nov. 1: 4,527 per 100,000 people (total: 3,481)
> Population: 76,898
> Largest place in Umatilla County: Hermiston
[recirclink id=595626]

Pennsylvania: Bradford County
> Change in daily avg. new COVID-19 cases, week over week: +14.6 per 100,000 people
> Avg. new daily cases in Bradford County in 7 days ending Nov. 1: 49.8 per 100,000
> Avg. new daily cases in Bradford County in 7 days ending Oct. 25: 35.2 per 100,000
> Avg. new daily cases in Pennsylvania in 7 days ending Nov. 1: 16 per 100,000 (24th fewest)
> Cumulative confirmed COVID-19 cases in Bradford County as of Nov. 1: 1,460 per 100,000 people (total: 895)
> Population: 61,304
> Largest place in Bradford County: Sayre

Rhode Island: Providence County
> Change in daily avg. new COVID-19 cases, week over week: +8.2 per 100,000 people
> Avg. new daily cases in Providence County in 7 days ending Nov. 1: 35.7 per 100,000
> Avg. new daily cases in Providence County in 7 days ending Oct. 25: 27.5 per 100,000
> Avg. new daily cases in Rhode Island in 7 days ending Nov. 1: 37 per 100,000 (12th most)
> Cumulative confirmed COVID-19 cases in Providence County as of Nov. 1: 3,675 per 100,000 people (total: 23,320)
> Population: 634,533
> Largest place in Providence County: Providence
[in-text-ad-2]

South Carolina: Abbeville County
> Change in daily avg. new COVID-19 cases, week over week: +15.0 per 100,000 people
> Avg. new daily cases in Abbeville County in 7 days ending Nov. 1: 30.4 per 100,000
> Avg. new daily cases in Abbeville County in 7 days ending Oct. 25: 15.4 per 100,000
> Avg. new daily cases in South Carolina in 7 days ending Nov. 1: 20 per 100,000 (12th fewest)
> Cumulative confirmed COVID-19 cases in Abbeville County as of Nov. 1: 3,265 per 100,000 people (total: 805)
> Population: 24,657
> Largest place in Abbeville County: Abbeville

South Dakota: Bon Homme County
> Change in daily avg. new COVID-19 cases, week over week: +630.5 per 100,000 people
> Avg. new daily cases in Bon Homme County in 7 days ending Nov. 1: 1046.3 per 100,000
> Avg. new daily cases in Bon Homme County in 7 days ending Oct. 25: 415.8 per 100,000
> Avg. new daily cases in South Dakota in 7 days ending Nov. 1: 104 per 100,000 (2nd most)
> Cumulative confirmed COVID-19 cases in Bon Homme County as of Nov. 1: 14,579 per 100,000 people (total: 1,016)
> Population: 6,969
> Largest place in Bon Homme County: Tyndall
[in-text-ad]

Tennessee: Haywood County
> Change in daily avg. new COVID-19 cases, week over week: +25.8 per 100,000 people
> Avg. new daily cases in Haywood County in 7 days ending Nov. 1: 75.2 per 100,000
> Avg. new daily cases in Haywood County in 7 days ending Oct. 25: 49.4 per 100,000
> Avg. new daily cases in Tennessee in 7 days ending Nov. 1: 38 per 100,000 (25th most)
> Cumulative confirmed COVID-19 cases in Haywood County as of Nov. 1: 7,531 per 100,000 people (total: 1,339)
> Population: 17,779
> Largest place in Haywood County: Brownsville
[recirclink id=799927]

Texas: El Paso County
> Change in daily avg. new COVID-19 cases, week over week: +63.2 per 100,000 people
> Avg. new daily cases in El Paso County in 7 days ending Nov. 1: 157.1 per 100,000
> Avg. new daily cases in El Paso County in 7 days ending Oct. 25: 94.0 per 100,000
> Avg. new daily cases in Texas in 7 days ending Nov. 1: 21 per 100,000 (20th fewest)
> Cumulative confirmed COVID-19 cases in El Paso County as of Nov. 1: 5,836 per 100,000 people (total: 48,885)
> Population: 837,654
> Largest place in El Paso County: El Paso

Utah: Wasatch County
> Change in daily avg. new COVID-19 cases, week over week: +27.1 per 100,000 people
> Avg. new daily cases in Wasatch County in 7 days ending Nov. 1: 64.1 per 100,000
> Avg. new daily cases in Wasatch County in 7 days ending Oct. 25: 36.9 per 100,000
> Avg. new daily cases in Utah in 7 days ending Nov. 1: 50 per 100,000 (14th most)
> Cumulative confirmed COVID-19 cases in Wasatch County as of Nov. 1: 3,994 per 100,000 people (total: 1,219)
> Population: 30,523
> Largest place in Wasatch County: Heber
[in-text-ad-2]

Vermont: Chittenden County
> Change in daily avg. new COVID-19 cases, week over week: +2.3 per 100,000 people
> Avg. new daily cases in Chittenden County in 7 days ending Nov. 1: 5.3 per 100,000
> Avg. new daily cases in Chittenden County in 7 days ending Oct. 25: 3.1 per 100,000
> Avg. new daily cases in Vermont in 7 days ending Nov. 1: 03 per 100,000 (4th fewest)
> Cumulative confirmed COVID-19 cases in Chittenden County as of Nov. 1: 623 per 100,000 people (total: 1,009)
> Population: 162,052
> Largest place in Chittenden County: Burlington

Virginia: Wise County
> Change in daily avg. new COVID-19 cases, week over week: +21.1 per 100,000 people
> Avg. new daily cases in Wise County in 7 days ending Nov. 1: 38.7 per 100,000
> Avg. new daily cases in Wise County in 7 days ending Oct. 25: 17.6 per 100,000
> Avg. new daily cases in Virginia in 7 days ending Nov. 1: 14 per 100,000 (11th fewest)
> Cumulative confirmed COVID-19 cases in Wise County as of Nov. 1: 1,824 per 100,000 people (total: 712)
> Population: 39,025
> Largest place in Wise County: Big Stone Gap
[in-text-ad]
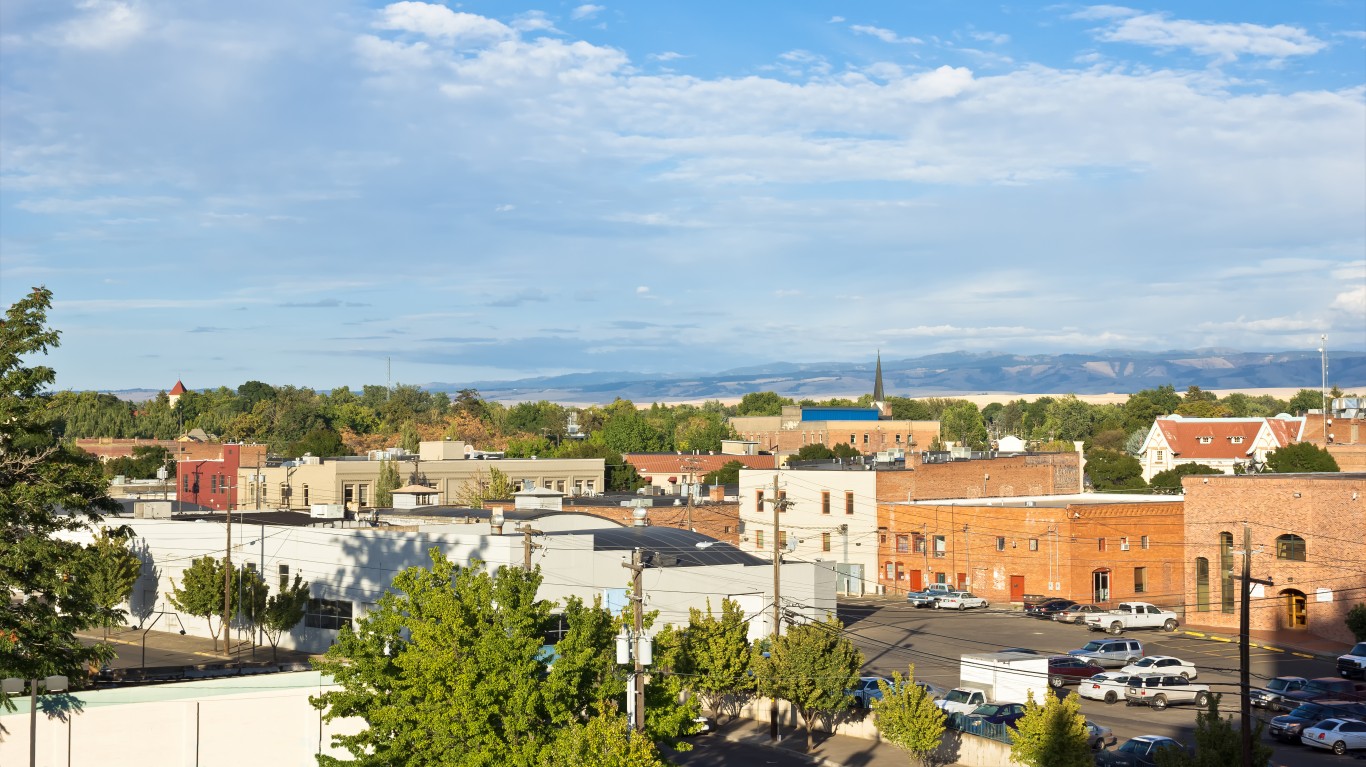
Washington: Walla Walla County
> Change in daily avg. new COVID-19 cases, week over week: +15.3 per 100,000 people
> Avg. new daily cases in Walla Walla County in 7 days ending Nov. 1: 32.5 per 100,000
> Avg. new daily cases in Walla Walla County in 7 days ending Oct. 25: 17.2 per 100,000
> Avg. new daily cases in Washington in 7 days ending Nov. 1: 10 per 100,000 (3rd fewest)
> Cumulative confirmed COVID-19 cases in Walla Walla County as of Nov. 1: 2,059 per 100,000 people (total: 1,240)
> Population: 60,236
> Largest place in Walla Walla County: Walla Walla
[recirclink id=723793]

West Virginia: Wyoming County
> Change in daily avg. new COVID-19 cases, week over week: +26.8 per 100,000 people
> Avg. new daily cases in Wyoming County in 7 days ending Nov. 1: 62.2 per 100,000
> Avg. new daily cases in Wyoming County in 7 days ending Oct. 25: 35.4 per 100,000
> Avg. new daily cases in West Virginia in 7 days ending Nov. 1: 19 per 100,000 (24th most)
> Cumulative confirmed COVID-19 cases in Wyoming County as of Nov. 1: 1,654 per 100,000 people (total: 359)
> Population: 21,711
> Largest place in Wyoming County: Mullens

Wisconsin: Jackson County
> Change in daily avg. new COVID-19 cases, week over week: +67.8 per 100,000 people
> Avg. new daily cases in Jackson County in 7 days ending Nov. 1: 136.5 per 100,000
> Avg. new daily cases in Jackson County in 7 days ending Oct. 25: 68.8 per 100,000
> Avg. new daily cases in Wisconsin in 7 days ending Nov. 1: 71 per 100,000 (8th most)
> Cumulative confirmed COVID-19 cases in Jackson County as of Nov. 1: 2,936 per 100,000 people (total: 602)
> Population: 20,506
> Largest place in Jackson County: Black River Falls
[in-text-ad-2]
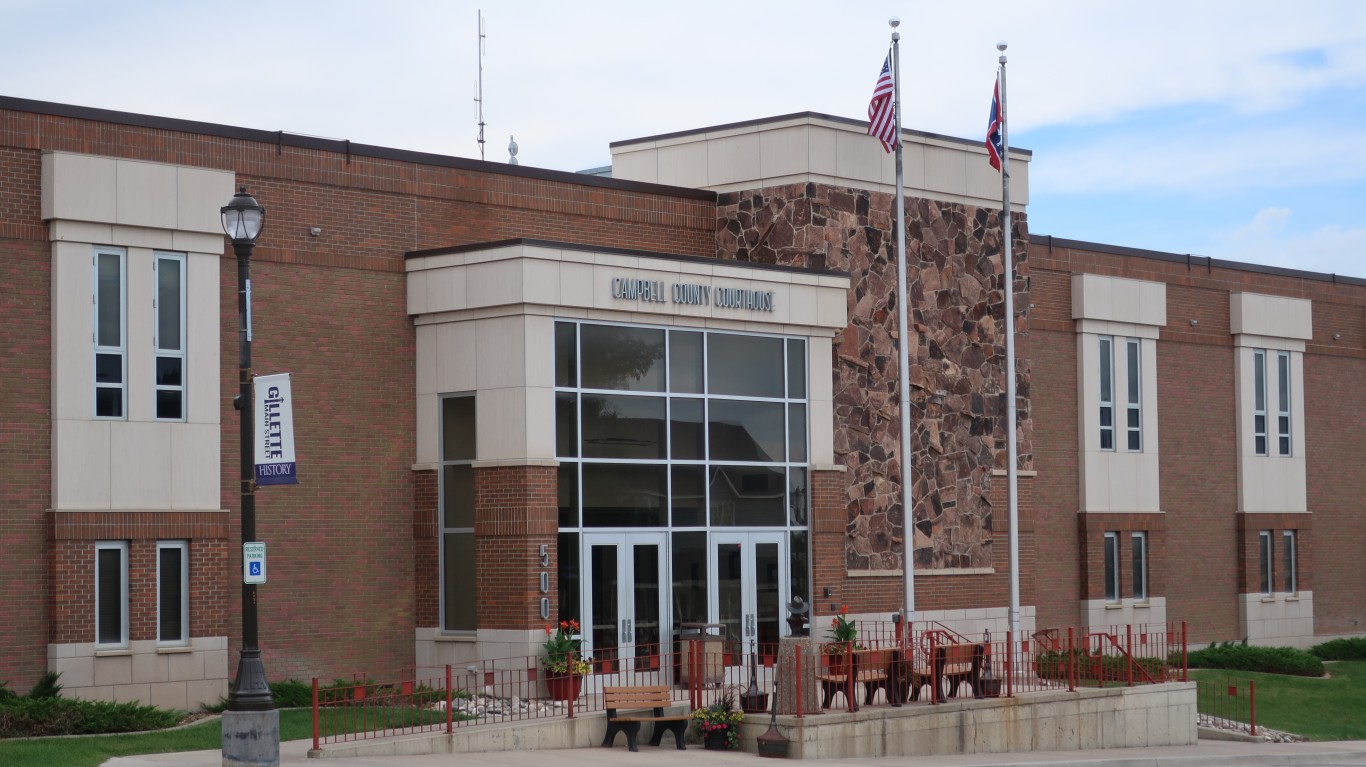
Wyoming: Campbell County
> Change in daily avg. new COVID-19 cases, week over week: +48.1 per 100,000 people
> Avg. new daily cases in Campbell County in 7 days ending Nov. 1: 100.7 per 100,000
> Avg. new daily cases in Campbell County in 7 days ending Oct. 25: 52.6 per 100,000
> Avg. new daily cases in Wyoming in 7 days ending Nov. 1: 63 per 100,000 (3rd most)
> Cumulative confirmed COVID-19 cases in Campbell County as of Nov. 1: 2,494 per 100,000 people (total: 1,190)
> Population: 47,708
> Largest place in Campbell County: Gillette
Contact [email protected] for any questions or corrections.