
With more than 3,000 reported deaths on Dec. 10, the U.S. daily death toll from COVID-19 has now surpassed the record of 2,700 set in May. Deaths are a lagging indicator in the spread of the coronavirus, occurring several weeks after diagnosis. So with cases of the virus just now reaching new highs — and with some of the busiest travel days of the year approaching — all signs point to daily deaths well exceeding the May record as the nation closes in on the 300,000 death mark.
Using data from state and local health departments, 24/7 Wall St. compiled and reviewed county-level COVID-19 data. We compared the average of daily new confirmed COVID-19 cases for the week ending Dec. 7 and compared it to the previous week to determine the county in each state where the virus is spreading the fastest, adjusted for the population. All but two states have at least one county or county equivalent in which cases have grown at a faster rate over the past week. We excluded counties with populations of fewer than 5,000 people as well as those with fewer than 20 reported new cases in the past 14 days.
Nationwide, the number of new daily cases per 100,000 residents rose by 5, from roughly 48 per 100,000 in the week ending Nov. 30 to 53 per 100,000 in the week ending Dec. 7. In 47 states there is at least one county reporting a weekly increase of at least 10 cases per 100,000. In eight states, the county with the largest increase in cases reported a weekly surge of more than 100 COVID-19 cases per 100,000 residents. These are the states where the virus is still getting worse.
In many counties, the pandemic has stretched already struggling hospitals and health care centers to the limit. In many parts of the country, health care infrastructure is at risk of being overwhelmed as there may be just one hospital to serve over 100,000 residents. These are the counties with the fewest hospitals.
Click here to see the places in every state where COVID-19 is growing the fastest right now.

Alabama: Jackson County
> Change in daily avg. new COVID-19 cases, week over week: +60 per 100,000 people
> Avg. new daily cases in Jackson County in 7 days ending Dec. 7: 149 per 100,000
> Avg. new daily cases in Jackson County in 7 days ending Nov. 30: 89 per 100,000
> Avg. new daily cases in Alabama in 7 days ending Dec. 7: 59 per 100,000 (22nd fewest)
> Cumulative confirmed COVID-19 cases in Jackson County as of Dec. 7: 7,536 per 100,000 people (total: 3,926)
> Population: 52,094
> Largest place in Jackson County: Scottsboro
[in-text-ad]
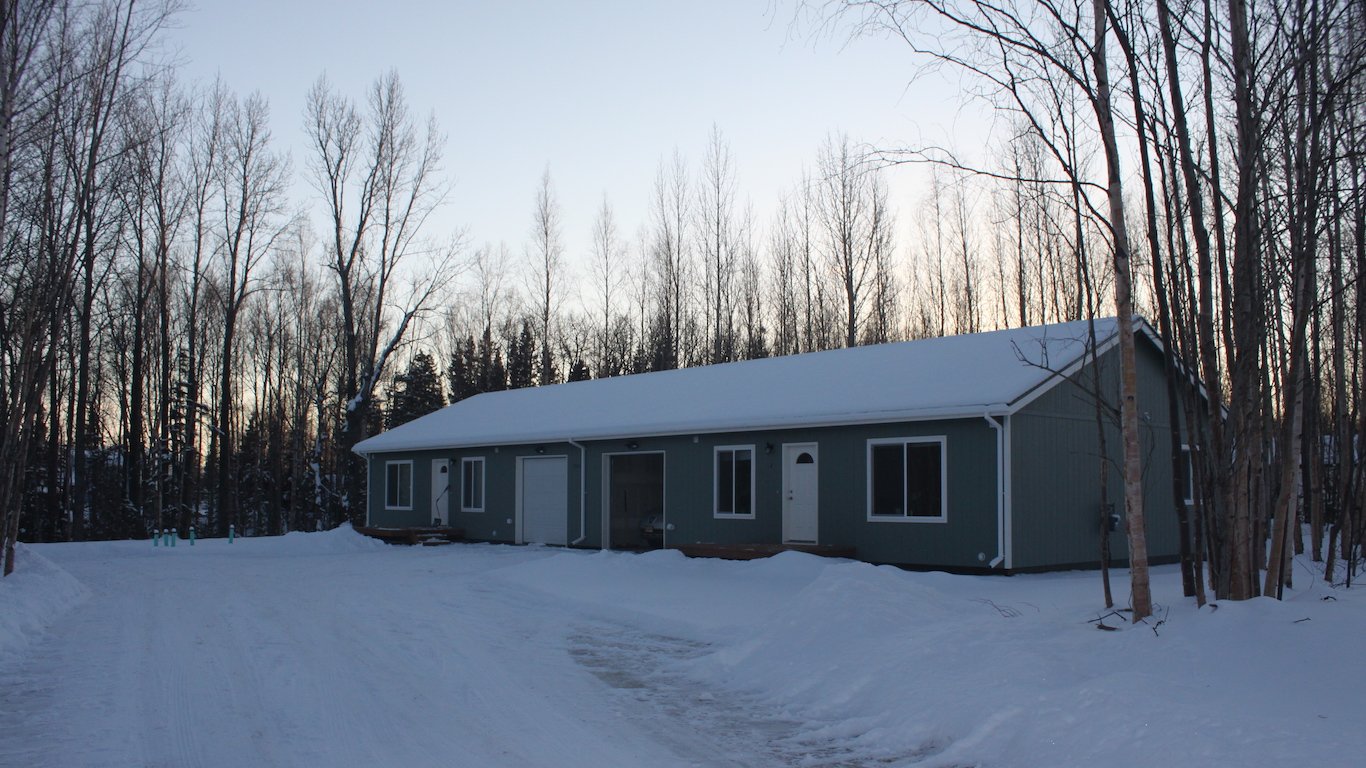
Alaska: Matanuska-Susitna Borough
> Change in daily avg. new COVID-19 cases, week over week: +17 per 100,000 people
> Avg. new daily cases in Matanuska-Susitna Borough in 7 days ending Dec. 7: 91 per 100,000
> Avg. new daily cases in Matanuska-Susitna Borough in 7 days ending Nov. 30: 75 per 100,000
> Avg. new daily cases in Alaska in 7 days ending Dec. 7: 91 per 100,000 (7th most)
> Cumulative confirmed COVID-19 cases in Matanuska-Susitna Borough as of Dec. 7: 3,698 per 100,000 people (total: 3,826)
> Population: 103,464
> Largest place in Matanuska-Susitna Borough: Knik-Fairview CDP
[recirclink id=823589]

Arizona: La Paz County
> Change in daily avg. new COVID-19 cases, week over week: +24 per 100,000 people
> Avg. new daily cases in La Paz County in 7 days ending Dec. 7: 85 per 100,000
> Avg. new daily cases in La Paz County in 7 days ending Nov. 30: 61 per 100,000
> Avg. new daily cases in Arizona in 7 days ending Dec. 7: 68 per 100,000 (22nd most)
> Cumulative confirmed COVID-19 cases in La Paz County as of Dec. 7: 4,715 per 100,000 people (total: 976)
> Population: 20,701
> Largest place in La Paz County: Quartzsite
Arkansas: Searcy County
> Change in daily avg. new COVID-19 cases, week over week: +85 per 100,000 people
> Avg. new daily cases in Searcy County in 7 days ending Dec. 7: 140 per 100,000
> Avg. new daily cases in Searcy County in 7 days ending Nov. 30: 55 per 100,000
> Avg. new daily cases in Arkansas in 7 days ending Dec. 7: 63 per 100,000 (24th most)
> Cumulative confirmed COVID-19 cases in Searcy County as of Dec. 7: 5,604 per 100,000 people (total: 444)
> Population: 7,923
> Largest place in Searcy County: Marshall
[in-text-ad-2]

California: Amador County
> Change in daily avg. new COVID-19 cases, week over week: +55 per 100,000 people
> Avg. new daily cases in Amador County in 7 days ending Dec. 7: 79 per 100,000
> Avg. new daily cases in Amador County in 7 days ending Nov. 30: 23 per 100,000
> Avg. new daily cases in California in 7 days ending Dec. 7: 44 per 100,000 (14th fewest)
> Cumulative confirmed COVID-19 cases in Amador County as of Dec. 7: 2,517 per 100,000 people (total: 952)
> Population: 37,829
> Largest place in Amador County: Ione
Colorado: Lincoln County
> Change in daily avg. new COVID-19 cases, week over week: +653 per 100,000 people
> Avg. new daily cases in Lincoln County in 7 days ending Dec. 7: 717 per 100,000
> Avg. new daily cases in Lincoln County in 7 days ending Nov. 30: 64 per 100,000
> Avg. new daily cases in Colorado in 7 days ending Dec. 7: 74 per 100,000 (17th most)
> Cumulative confirmed COVID-19 cases in Lincoln County as of Dec. 7: 10,058 per 100,000 people (total: 558)
> Population: 5,548
> Largest place in Lincoln County: Limon
[in-text-ad]

Connecticut: New Haven County
> Change in daily avg. new COVID-19 cases, week over week: +31 per 100,000 people
> Avg. new daily cases in New Haven County in 7 days ending Dec. 7: 77 per 100,000
> Avg. new daily cases in New Haven County in 7 days ending Nov. 30: 46 per 100,000
> Avg. new daily cases in Connecticut in 7 days ending Dec. 7: 60 per 100,000 (23rd fewest)
> Cumulative confirmed COVID-19 cases in New Haven County as of Dec. 7: 4,047 per 100,000 people (total: 34,777)
> Population: 859,339
> Largest place in New Haven County: New Haven
[recirclink id=823478]

Delaware: Kent County
> Change in daily avg. new COVID-19 cases, week over week: +27 per 100,000 people
> Avg. new daily cases in Kent County in 7 days ending Dec. 7: 67 per 100,000
> Avg. new daily cases in Kent County in 7 days ending Nov. 30: 41 per 100,000
> Avg. new daily cases in Delaware in 7 days ending Dec. 7: 63 per 100,000 (25th most)
> Cumulative confirmed COVID-19 cases in Kent County as of Dec. 7: 3,518 per 100,000 people (total: 6,150)
> Population: 174,822
> Largest place in Kent County: Dover

Florida: Lafayette County
> Change in daily avg. new COVID-19 cases, week over week: +25 per 100,000 people
> Avg. new daily cases in Lafayette County in 7 days ending Dec. 7: 55 per 100,000
> Avg. new daily cases in Lafayette County in 7 days ending Nov. 30: 30 per 100,000
> Avg. new daily cases in Florida in 7 days ending Dec. 7: 42 per 100,000 (12th fewest)
> Cumulative confirmed COVID-19 cases in Lafayette County as of Dec. 7: 15,611 per 100,000 people (total: 1,365)
> Population: 8,744
> Largest place in Lafayette County: Mayo
[in-text-ad-2]

Georgia: Calhoun County
> Change in daily avg. new COVID-19 cases, week over week: +33 per 100,000 people
> Avg. new daily cases in Calhoun County in 7 days ending Dec. 7: 36 per 100,000
> Avg. new daily cases in Calhoun County in 7 days ending Nov. 30: 3 per 100,000
> Avg. new daily cases in Georgia in 7 days ending Dec. 7: 29 per 100,000 (4th fewest)
> Cumulative confirmed COVID-19 cases in Calhoun County as of Dec. 7: 4,589 per 100,000 people (total: 295)
> Population: 6,428
> Largest place in Calhoun County: Morgan

Hawaii: No county with increase in new cases
> Avg. new daily cases in Hawaii in 7 days ending Dec. 7: 8 per 100,000 (the fewest)
[in-text-ad]
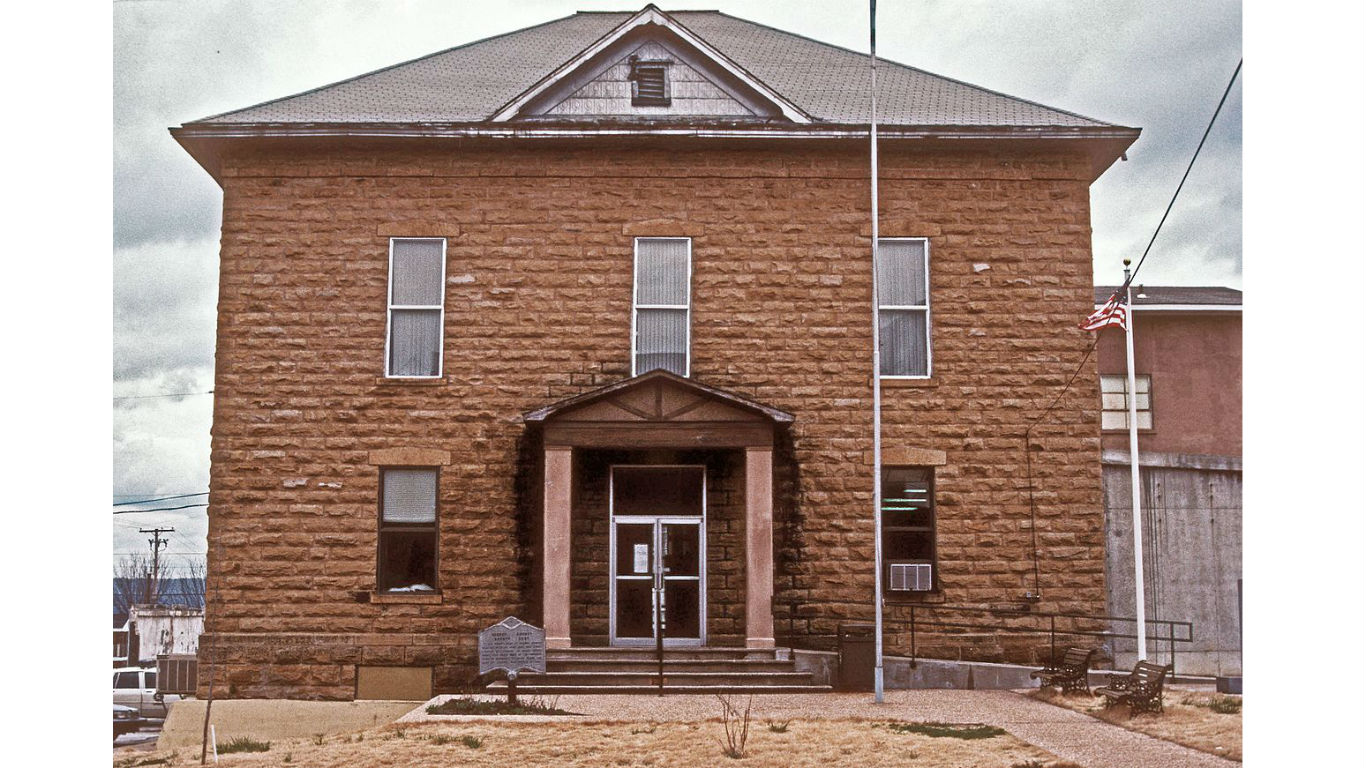
Idaho: Jefferson County
> Change in daily avg. new COVID-19 cases, week over week: +28 per 100,000 people
> Avg. new daily cases in Jefferson County in 7 days ending Dec. 7: 88 per 100,000
> Avg. new daily cases in Jefferson County in 7 days ending Nov. 30: 60 per 100,000
> Avg. new daily cases in Idaho in 7 days ending Dec. 7: 78 per 100,000 (13th most)
> Cumulative confirmed COVID-19 cases in Jefferson County as of Dec. 7: 6,253 per 100,000 people (total: 1,749)
> Population: 27,969
> Largest place in Jefferson County: Rigby
[recirclink id=823069]

Illinois: Schuyler County
> Change in daily avg. new COVID-19 cases, week over week: +49 per 100,000 people
> Avg. new daily cases in Schuyler County in 7 days ending Dec. 7: 153 per 100,000
> Avg. new daily cases in Schuyler County in 7 days ending Nov. 30: 105 per 100,000
> Avg. new daily cases in Illinois in 7 days ending Dec. 7: 74 per 100,000 (16th most)
> Cumulative confirmed COVID-19 cases in Schuyler County as of Dec. 7: 5,238 per 100,000 people (total: 370)
> Population: 7,064
> Largest place in Schuyler County: Rushville

Indiana: Benton County
> Change in daily avg. new COVID-19 cases, week over week: +49 per 100,000 people
> Avg. new daily cases in Benton County in 7 days ending Dec. 7: 167 per 100,000
> Avg. new daily cases in Benton County in 7 days ending Nov. 30: 118 per 100,000
> Avg. new daily cases in Indiana in 7 days ending Dec. 7: 92 per 100,000 (6th most)
> Cumulative confirmed COVID-19 cases in Benton County as of Dec. 7: 5,815 per 100,000 people (total: 504)
> Population: 8,667
> Largest place in Benton County: Fowler
[in-text-ad-2]
Iowa: Cherokee County
> Change in daily avg. new COVID-19 cases, week over week: +59 per 100,000 people
> Avg. new daily cases in Cherokee County in 7 days ending Dec. 7: 190 per 100,000
> Avg. new daily cases in Cherokee County in 7 days ending Nov. 30: 132 per 100,000
> Avg. new daily cases in Iowa in 7 days ending Dec. 7: 73 per 100,000 (19th most)
> Cumulative confirmed COVID-19 cases in Cherokee County as of Dec. 7: 8,781 per 100,000 people (total: 1,007)
> Population: 11,468
> Largest place in Cherokee County: Cherokee
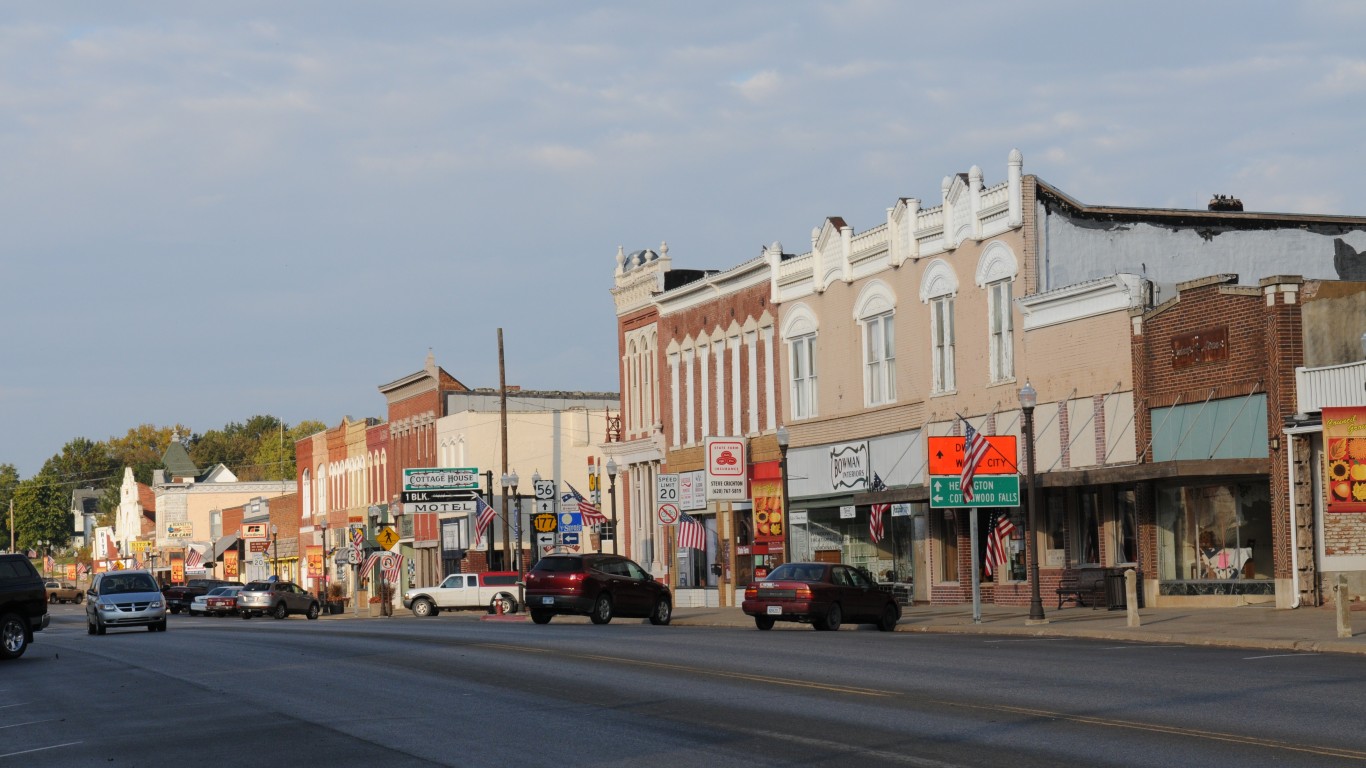
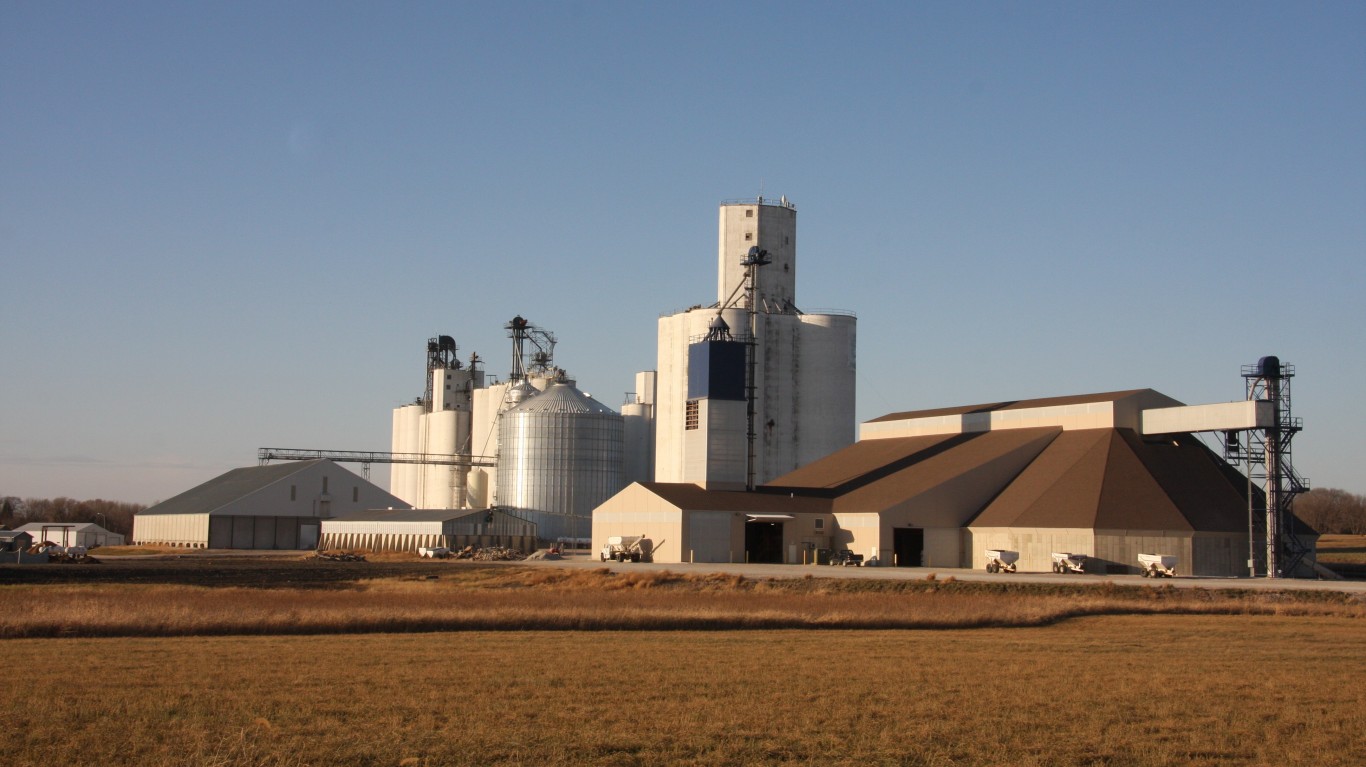
Kansas: Morris County
> Change in daily avg. new COVID-19 cases, week over week: +61 per 100,000 people
> Avg. new daily cases in Morris County in 7 days ending Dec. 7: 103 per 100,000
> Avg. new daily cases in Morris County in 7 days ending Nov. 30: 42 per 100,000
> Avg. new daily cases in Kansas in 7 days ending Dec. 7: 75 per 100,000 (15th most)
> Cumulative confirmed COVID-19 cases in Morris County as of Dec. 7: 4,060 per 100,000 people (total: 226)
> Population: 5,566
> Largest place in Morris County: Council Grove
[in-text-ad]

Kentucky: Hart County
> Change in daily avg. new COVID-19 cases, week over week: +88 per 100,000 people
> Avg. new daily cases in Hart County in 7 days ending Dec. 7: 141 per 100,000
> Avg. new daily cases in Hart County in 7 days ending Nov. 30: 53 per 100,000
> Avg. new daily cases in Kentucky in 7 days ending Dec. 7: 71 per 100,000 (21st most)
> Cumulative confirmed COVID-19 cases in Hart County as of Dec. 7: 5,363 per 100,000 people (total: 999)
> Population: 18,627
> Largest place in Hart County: Horse Cave
[recirclink id=823036]

Louisiana: Plaquemines Parish
> Change in daily avg. new COVID-19 cases, week over week: +48 per 100,000 people
> Avg. new daily cases in Plaquemines Parish in 7 days ending Dec. 7: 89 per 100,000
> Avg. new daily cases in Plaquemines Parish in 7 days ending Nov. 30: 42 per 100,000
> Avg. new daily cases in Louisiana in 7 days ending Dec. 7: 52 per 100,000 (17th fewest)
> Cumulative confirmed COVID-19 cases in Plaquemines Parish as of Dec. 7: 5,669 per 100,000 people (total: 1,325)
> Population: 23,373
> Largest place in Plaquemines Parish: Belle Chasse CDP

Maine: Oxford County
> Change in daily avg. new COVID-19 cases, week over week: +11 per 100,000 people
> Avg. new daily cases in Oxford County in 7 days ending Dec. 7: 25 per 100,000
> Avg. new daily cases in Oxford County in 7 days ending Nov. 30: 13 per 100,000
> Avg. new daily cases in Maine in 7 days ending Dec. 7: 17 per 100,000 (2nd fewest)
> Cumulative confirmed COVID-19 cases in Oxford County as of Dec. 7: 853 per 100,000 people (total: 489)
> Population: 57,325
> Largest place in Oxford County: Rumford CDP
[in-text-ad-2]
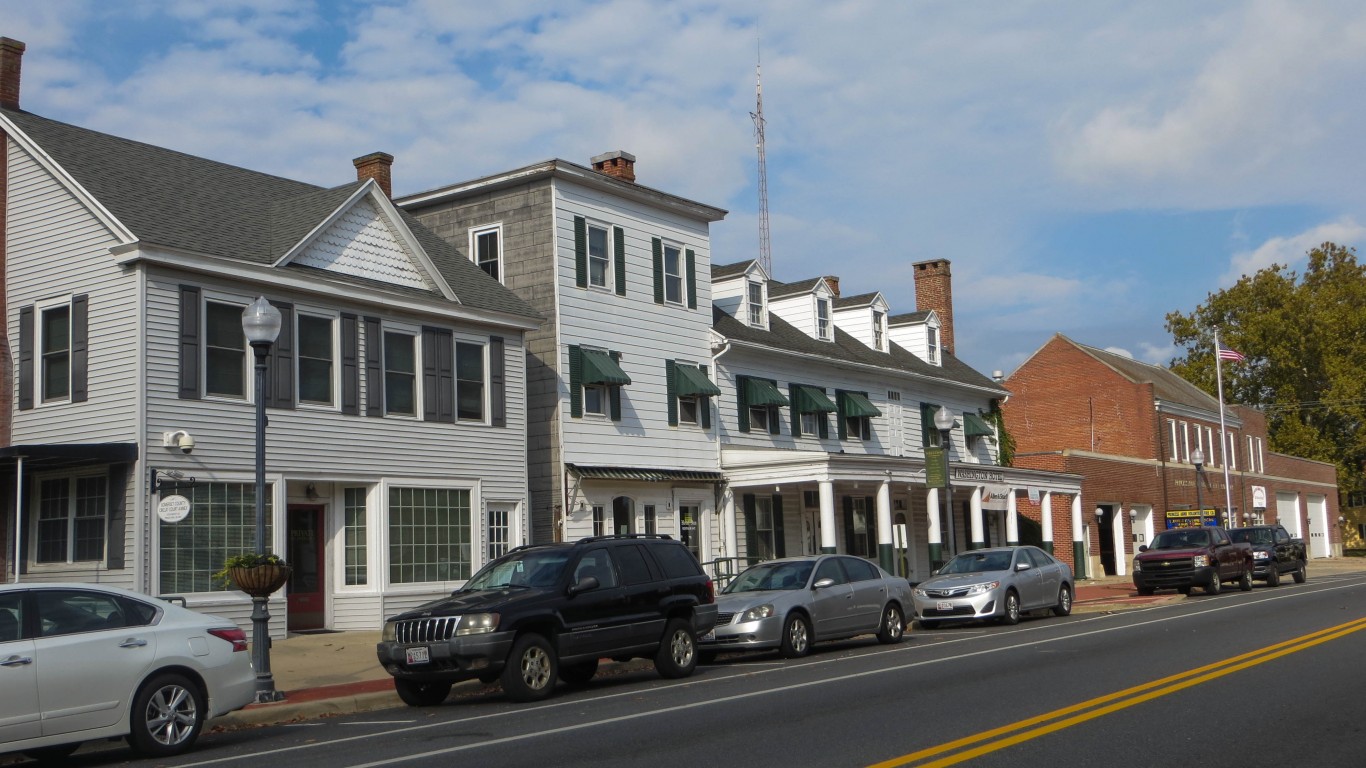
Maryland: Somerset County
> Change in daily avg. new COVID-19 cases, week over week: +60 per 100,000 people
> Avg. new daily cases in Somerset County in 7 days ending Dec. 7: 161 per 100,000
> Avg. new daily cases in Somerset County in 7 days ending Nov. 30: 101 per 100,000
> Avg. new daily cases in Maryland in 7 days ending Dec. 7: 40 per 100,000 (9th fewest)
> Cumulative confirmed COVID-19 cases in Somerset County as of Dec. 7: 4,596 per 100,000 people (total: 1,183)
> Population: 25,737
> Largest place in Somerset County: Princess Anne

Massachusetts: Nantucket County
> Change in daily avg. new COVID-19 cases, week over week: +94 per 100,000 people
> Avg. new daily cases in Nantucket County in 7 days ending Dec. 7: 122 per 100,000
> Avg. new daily cases in Nantucket County in 7 days ending Nov. 30: 27 per 100,000
> Avg. new daily cases in Massachusetts in 7 days ending Dec. 7: 55 per 100,000 (18th fewest)
> Cumulative confirmed COVID-19 cases in Nantucket County as of Dec. 7: 3,973 per 100,000 people (total: 441)
> Population: 11,101
> Largest place in Nantucket County: Nantucket CDP
[in-text-ad]
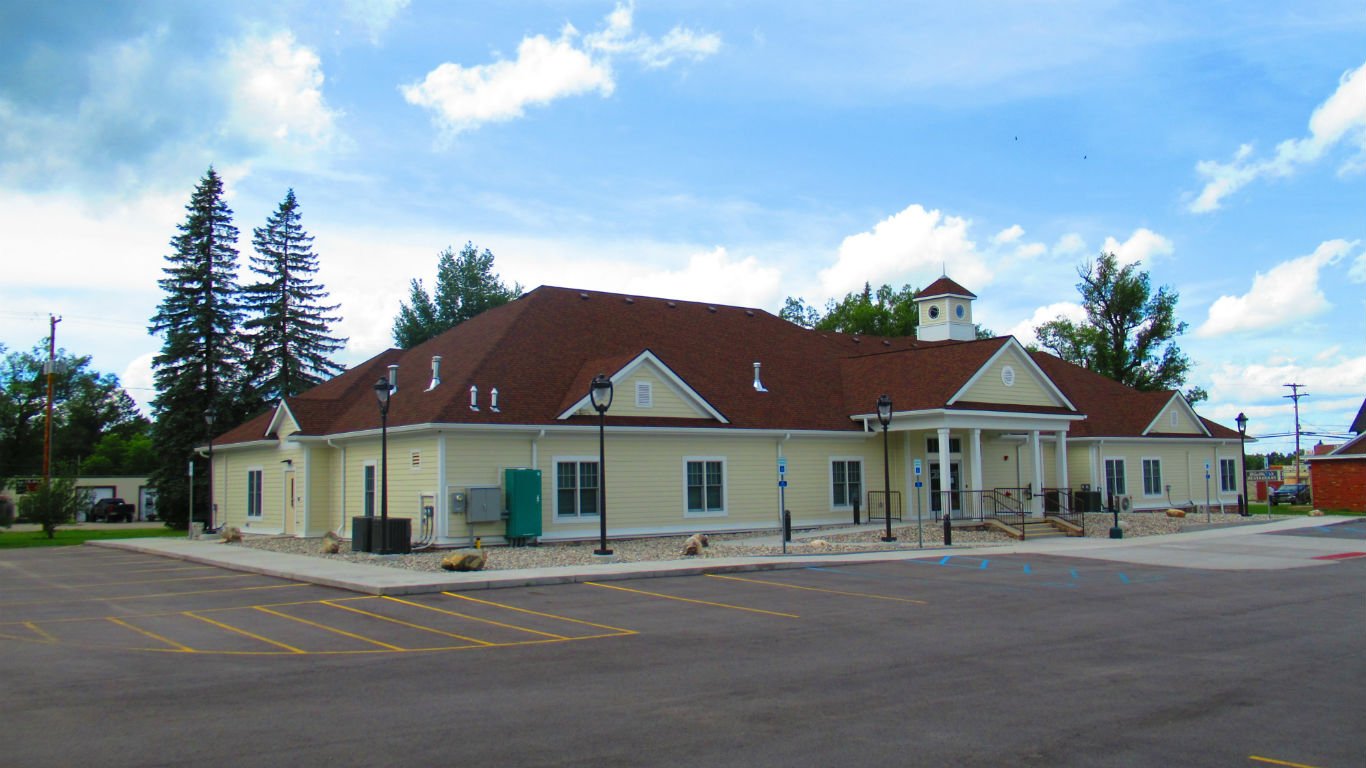
Michigan: Oscoda County
> Change in daily avg. new COVID-19 cases, week over week: +54 per 100,000 people
> Avg. new daily cases in Oscoda County in 7 days ending Dec. 7: 118 per 100,000
> Avg. new daily cases in Oscoda County in 7 days ending Nov. 30: 64 per 100,000
> Avg. new daily cases in Michigan in 7 days ending Dec. 7: 72 per 100,000 (20th most)
> Cumulative confirmed COVID-19 cases in Oscoda County as of Dec. 7: 2,984 per 100,000 people (total: 247)
> Population: 8,277
> Largest place in Oscoda County: Mio CDP
[recirclink id=823427]

Minnesota: Chippewa County
> Change in daily avg. new COVID-19 cases, week over week: +40 per 100,000 people
> Avg. new daily cases in Chippewa County in 7 days ending Dec. 7: 186 per 100,000
> Avg. new daily cases in Chippewa County in 7 days ending Nov. 30: 146 per 100,000
> Avg. new daily cases in Minnesota in 7 days ending Dec. 7: 96 per 100,000 (3rd most)
> Cumulative confirmed COVID-19 cases in Chippewa County as of Dec. 7: 8,676 per 100,000 people (total: 1,042)
> Population: 12,010
> Largest place in Chippewa County: Montevideo

Mississippi: Kemper County
> Change in daily avg. new COVID-19 cases, week over week: +47 per 100,000 people
> Avg. new daily cases in Kemper County in 7 days ending Dec. 7: 98 per 100,000
> Avg. new daily cases in Kemper County in 7 days ending Nov. 30: 50 per 100,000
> Avg. new daily cases in Mississippi in 7 days ending Dec. 7: 58 per 100,000 (21st fewest)
> Cumulative confirmed COVID-19 cases in Kemper County as of Dec. 7: 5,185 per 100,000 people (total: 524)
> Population: 10,107
> Largest place in Kemper County: De Kalb
[in-text-ad-2]

Missouri: Benton County
> Change in daily avg. new COVID-19 cases, week over week: +25 per 100,000 people
> Avg. new daily cases in Benton County in 7 days ending Dec. 7: 57 per 100,000
> Avg. new daily cases in Benton County in 7 days ending Nov. 30: 32 per 100,000
> Avg. new daily cases in Missouri in 7 days ending Dec. 7: 56 per 100,000 (19th fewest)
> Cumulative confirmed COVID-19 cases in Benton County as of Dec. 7: 4,687 per 100,000 people (total: 890)
> Population: 18,989
> Largest place in Benton County: Warsaw
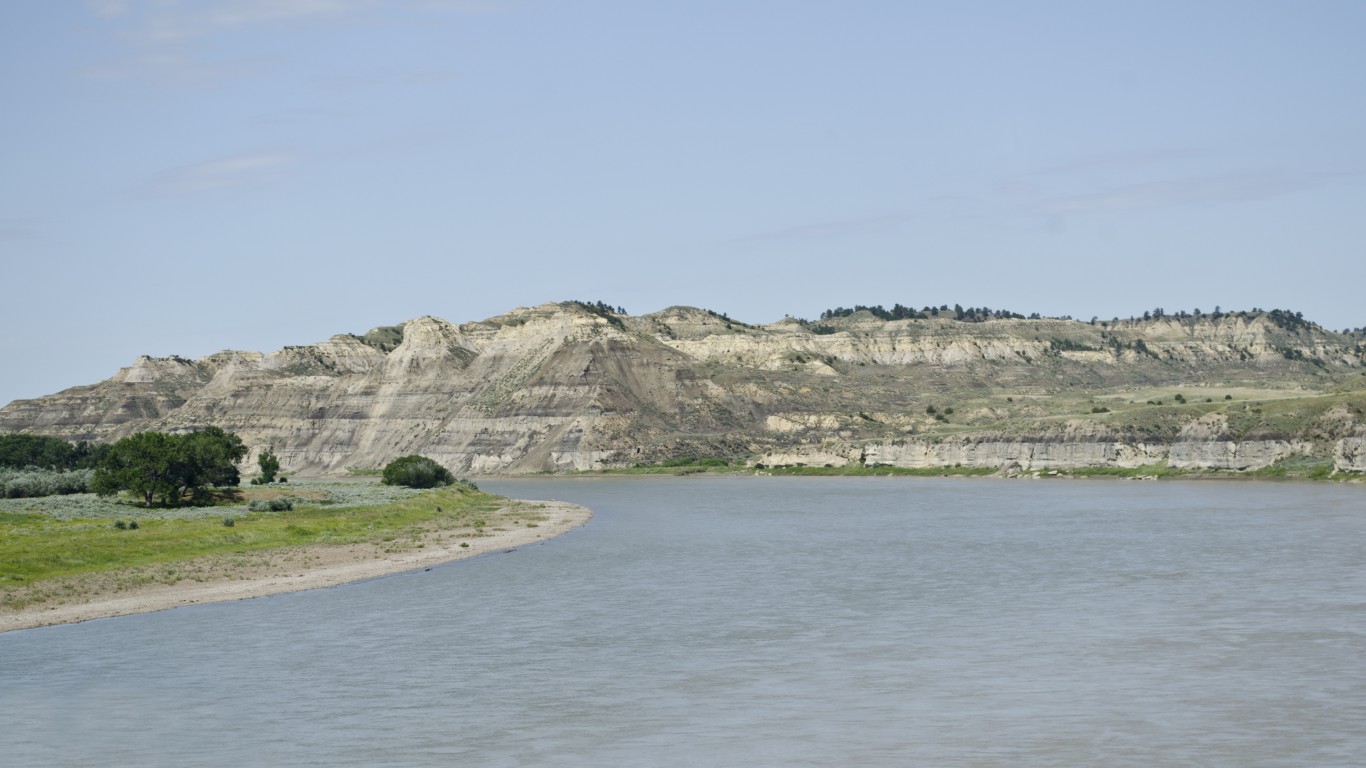
Montana: Richland County
> Change in daily avg. new COVID-19 cases, week over week: +221 per 100,000 people
> Avg. new daily cases in Richland County in 7 days ending Dec. 7: 241 per 100,000
> Avg. new daily cases in Richland County in 7 days ending Nov. 30: 20 per 100,000
> Avg. new daily cases in Montana in 7 days ending Dec. 7: 81 per 100,000 (11th most)
> Cumulative confirmed COVID-19 cases in Richland County as of Dec. 7: 6,408 per 100,000 people (total: 728)
> Population: 11,360
> Largest place in Richland County: Sidney
[in-text-ad]

Nebraska: Nemaha County
> Change in daily avg. new COVID-19 cases, week over week: +66 per 100,000 people
> Avg. new daily cases in Nemaha County in 7 days ending Dec. 7: 114 per 100,000
> Avg. new daily cases in Nemaha County in 7 days ending Nov. 30: 48 per 100,000
> Avg. new daily cases in Nebraska in 7 days ending Dec. 7: 93 per 100,000 (5th most)
> Cumulative confirmed COVID-19 cases in Nemaha County as of Dec. 7: 5,168 per 100,000 people (total: 362)
> Population: 7,004
> Largest place in Nemaha County: Auburn
[recirclink id=823589]

Nevada: Humboldt County
> Change in daily avg. new COVID-19 cases, week over week: +49 per 100,000 people
> Avg. new daily cases in Humboldt County in 7 days ending Dec. 7: 96 per 100,000
> Avg. new daily cases in Humboldt County in 7 days ending Nov. 30: 48 per 100,000
> Avg. new daily cases in Nevada in 7 days ending Dec. 7: 77 per 100,000 (14th most)
> Cumulative confirmed COVID-19 cases in Humboldt County as of Dec. 7: 3,053 per 100,000 people (total: 516)
> Population: 16,904
> Largest place in Humboldt County: Winnemucca

New Hampshire: Merrimack County
> Change in daily avg. new COVID-19 cases, week over week: +27 per 100,000 people
> Avg. new daily cases in Merrimack County in 7 days ending Dec. 7: 47 per 100,000
> Avg. new daily cases in Merrimack County in 7 days ending Nov. 30: 20 per 100,000
> Avg. new daily cases in New Hampshire in 7 days ending Dec. 7: 44 per 100,000 (15th fewest)
> Cumulative confirmed COVID-19 cases in Merrimack County as of Dec. 7: 1,615 per 100,000 people (total: 2,413)
> Population: 149,452
> Largest place in Merrimack County: Concord
[in-text-ad-2]

New Jersey: Salem County
> Change in daily avg. new COVID-19 cases, week over week: +13 per 100,000 people
> Avg. new daily cases in Salem County in 7 days ending Dec. 7: 44 per 100,000
> Avg. new daily cases in Salem County in 7 days ending Nov. 30: 31 per 100,000
> Avg. new daily cases in New Jersey in 7 days ending Dec. 7: 49 per 100,000 (16th fewest)
> Cumulative confirmed COVID-19 cases in Salem County as of Dec. 7: 2,946 per 100,000 people (total: 1,866)
> Population: 63,336
> Largest place in Salem County: Pennsville CDP

New Mexico: Colfax County
> Change in daily avg. new COVID-19 cases, week over week: +28 per 100,000 people
> Avg. new daily cases in Colfax County in 7 days ending Dec. 7: 101 per 100,000
> Avg. new daily cases in Colfax County in 7 days ending Nov. 30: 73 per 100,000
> Avg. new daily cases in New Mexico in 7 days ending Dec. 7: 94 per 100,000 (4th most)
> Cumulative confirmed COVID-19 cases in Colfax County as of Dec. 7: 2,631 per 100,000 people (total: 325)
> Population: 12,353
> Largest place in Colfax County: Raton
[in-text-ad]

New York: Oneida County
> Change in daily avg. new COVID-19 cases, week over week: +26 per 100,000 people
> Avg. new daily cases in Oneida County in 7 days ending Dec. 7: 69 per 100,000
> Avg. new daily cases in Oneida County in 7 days ending Nov. 30: 44 per 100,000
> Avg. new daily cases in New York in 7 days ending Dec. 7: 42 per 100,000 (13th fewest)
> Cumulative confirmed COVID-19 cases in Oneida County as of Dec. 7: 2,765 per 100,000 people (total: 6,382)
> Population: 230,782
> Largest place in Oneida County: Utica
[recirclink id=823478]

North Carolina: Warren County
> Change in daily avg. new COVID-19 cases, week over week: +30 per 100,000 people
> Avg. new daily cases in Warren County in 7 days ending Dec. 7: 77 per 100,000
> Avg. new daily cases in Warren County in 7 days ending Nov. 30: 47 per 100,000
> Avg. new daily cases in North Carolina in 7 days ending Dec. 7: 41 per 100,000 (11th fewest)
> Cumulative confirmed COVID-19 cases in Warren County as of Dec. 7: 4,278 per 100,000 people (total: 857)
> Population: 20,033
> Largest place in Warren County: Norlina

North Dakota: No county with increase in new cases
> Avg. new daily cases in North Dakota in 7 days ending Dec. 7: 87 per 100,000 (9th most)
[in-text-ad-2]

Ohio: Jackson County
> Change in daily avg. new COVID-19 cases, week over week: +44 per 100,000 people
> Avg. new daily cases in Jackson County in 7 days ending Dec. 7: 125 per 100,000
> Avg. new daily cases in Jackson County in 7 days ending Nov. 30: 81 per 100,000
> Avg. new daily cases in Ohio in 7 days ending Dec. 7: 73 per 100,000 (18th most)
> Cumulative confirmed COVID-19 cases in Jackson County as of Dec. 7: 4,474 per 100,000 people (total: 1,455)
> Population: 32,524
> Largest place in Jackson County: Jackson

Oklahoma: Kiowa County
> Change in daily avg. new COVID-19 cases, week over week: +42 per 100,000 people
> Avg. new daily cases in Kiowa County in 7 days ending Dec. 7: 119 per 100,000
> Avg. new daily cases in Kiowa County in 7 days ending Nov. 30: 77 per 100,000
> Avg. new daily cases in Oklahoma in 7 days ending Dec. 7: 62 per 100,000 (25th fewest)
> Cumulative confirmed COVID-19 cases in Kiowa County as of Dec. 7: 4,855 per 100,000 people (total: 437)
> Population: 9,001
> Largest place in Kiowa County: Hobart
[in-text-ad]

Oregon: Klamath County
> Change in daily avg. new COVID-19 cases, week over week: +26 per 100,000 people
> Avg. new daily cases in Klamath County in 7 days ending Dec. 7: 55 per 100,000
> Avg. new daily cases in Klamath County in 7 days ending Nov. 30: 29 per 100,000
> Avg. new daily cases in Oregon in 7 days ending Dec. 7: 37 per 100,000 (8th fewest)
> Cumulative confirmed COVID-19 cases in Klamath County as of Dec. 7: 0 per 100,000 people (total: 00)
> Population: 66,310
> Largest place in Klamath County: Klamath Falls
[recirclink id=823069]

Pennsylvania: Montour County
> Change in daily avg. new COVID-19 cases, week over week: +234 per 100,000 people
> Avg. new daily cases in Montour County in 7 days ending Dec. 7: 271 per 100,000
> Avg. new daily cases in Montour County in 7 days ending Nov. 30: 36 per 100,000
> Avg. new daily cases in Pennsylvania in 7 days ending Dec. 7: 62 per 100,000 (24th fewest)
> Cumulative confirmed COVID-19 cases in Montour County as of Dec. 7: 5,811 per 100,000 people (total: 1,063)
> Population: 18,294
> Largest place in Montour County: Danville

Rhode Island: Washington County
> Change in daily avg. new COVID-19 cases, week over week: +9 per 100,000 people
> Avg. new daily cases in Washington County in 7 days ending Dec. 7: 46 per 100,000
> Avg. new daily cases in Washington County in 7 days ending Nov. 30: 37 per 100,000
> Avg. new daily cases in Rhode Island in 7 days ending Dec. 7: 107 per 100,000 (the most)
> Cumulative confirmed COVID-19 cases in Washington County as of Dec. 7: 2,092 per 100,000 people (total: 2,641)
> Population: 126,242
> Largest place in Washington County: Westerly CDP
[in-text-ad-2]

South Carolina: Darlington County
> Change in daily avg. new COVID-19 cases, week over week: +19 per 100,000 people
> Avg. new daily cases in Darlington County in 7 days ending Dec. 7: 38 per 100,000
> Avg. new daily cases in Darlington County in 7 days ending Nov. 30: 19 per 100,000
> Avg. new daily cases in South Carolina in 7 days ending Dec. 7: 37 per 100,000 (7th fewest)
> Cumulative confirmed COVID-19 cases in Darlington County as of Dec. 7: 4,889 per 100,000 people (total: 3,288)
> Population: 67,253
> Largest place in Darlington County: Hartsville

South Dakota: Dewey County
> Change in daily avg. new COVID-19 cases, week over week: +285 per 100,000 people
> Avg. new daily cases in Dewey County in 7 days ending Dec. 7: 514 per 100,000
> Avg. new daily cases in Dewey County in 7 days ending Nov. 30: 229 per 100,000
> Avg. new daily cases in South Dakota in 7 days ending Dec. 7: 85 per 100,000 (10th most)
> Cumulative confirmed COVID-19 cases in Dewey County as of Dec. 7: 18,965 per 100,000 people (total: 1,096)
> Population: 5,779
> Largest place in Dewey County: North Eagle Butte CDP
[in-text-ad]

Tennessee: White County
> Change in daily avg. new COVID-19 cases, week over week: +55 per 100,000 people
> Avg. new daily cases in White County in 7 days ending Dec. 7: 104 per 100,000
> Avg. new daily cases in White County in 7 days ending Nov. 30: 49 per 100,000
> Avg. new daily cases in Tennessee in 7 days ending Dec. 7: 78 per 100,000 (12th most)
> Cumulative confirmed COVID-19 cases in White County as of Dec. 7: 7,555 per 100,000 people (total: 2,008)
> Population: 26,580
> Largest place in White County: Sparta
[recirclink id=823036]

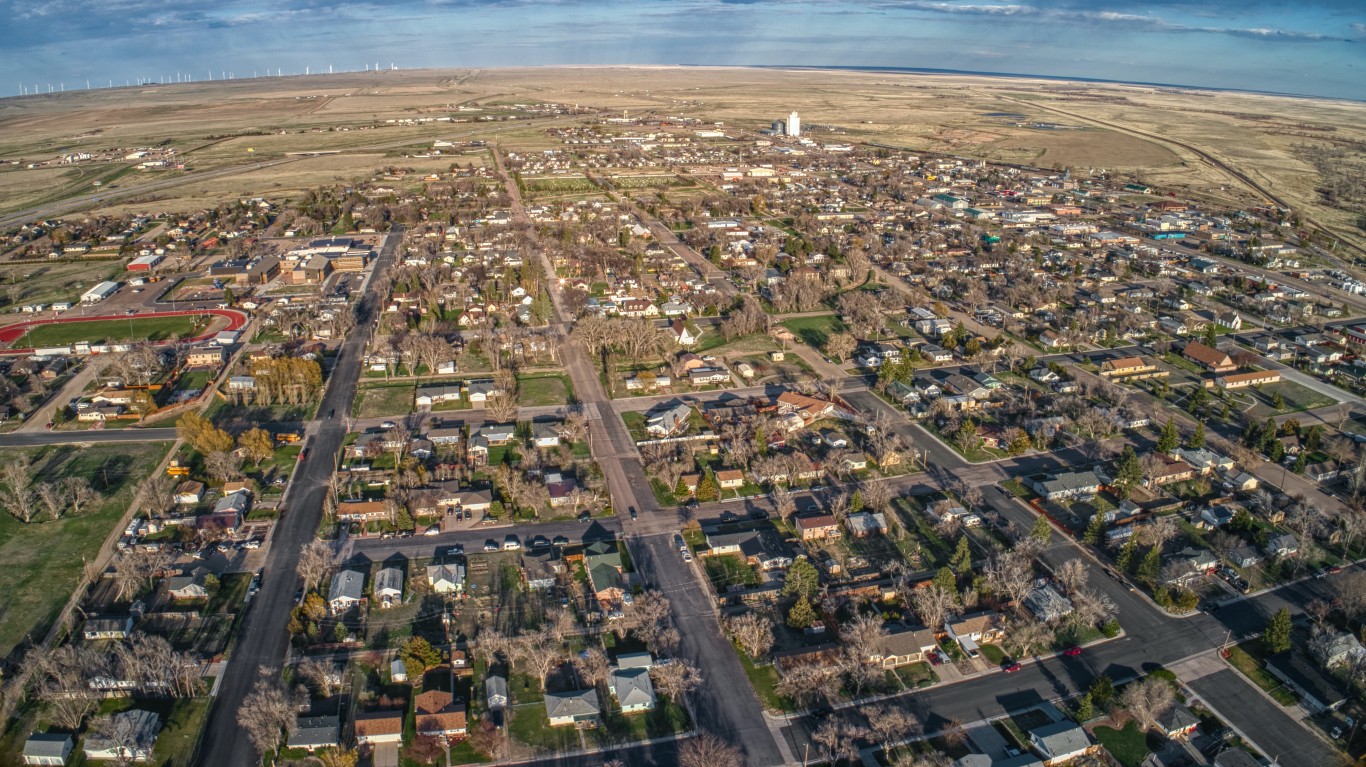
Texas: Deaf Smith County
> Change in daily avg. new COVID-19 cases, week over week: +148 per 100,000 people
> Avg. new daily cases in Deaf Smith County in 7 days ending Dec. 7: 177 per 100,000
> Avg. new daily cases in Deaf Smith County in 7 days ending Nov. 30: 28 per 100,000
> Avg. new daily cases in Texas in 7 days ending Dec. 7: 40 per 100,000 (10th fewest)
> Cumulative confirmed COVID-19 cases in Deaf Smith County as of Dec. 7: 8,461 per 100,000 people (total: 1,599)
> Population: 18,899
> Largest place in Deaf Smith County: Hereford

Utah: San Juan County
> Change in daily avg. new COVID-19 cases, week over week: +26 per 100,000 people
> Avg. new daily cases in San Juan County in 7 days ending Dec. 7: 82 per 100,000
> Avg. new daily cases in San Juan County in 7 days ending Nov. 30: 56 per 100,000
> Avg. new daily cases in Utah in 7 days ending Dec. 7: 90 per 100,000 (8th most)
> Cumulative confirmed COVID-19 cases in San Juan County as of Dec. 7: 7,598 per 100,000 people (total: 1,161)
> Population: 15,281
> Largest place in San Juan County: Blanding
[in-text-ad-2]
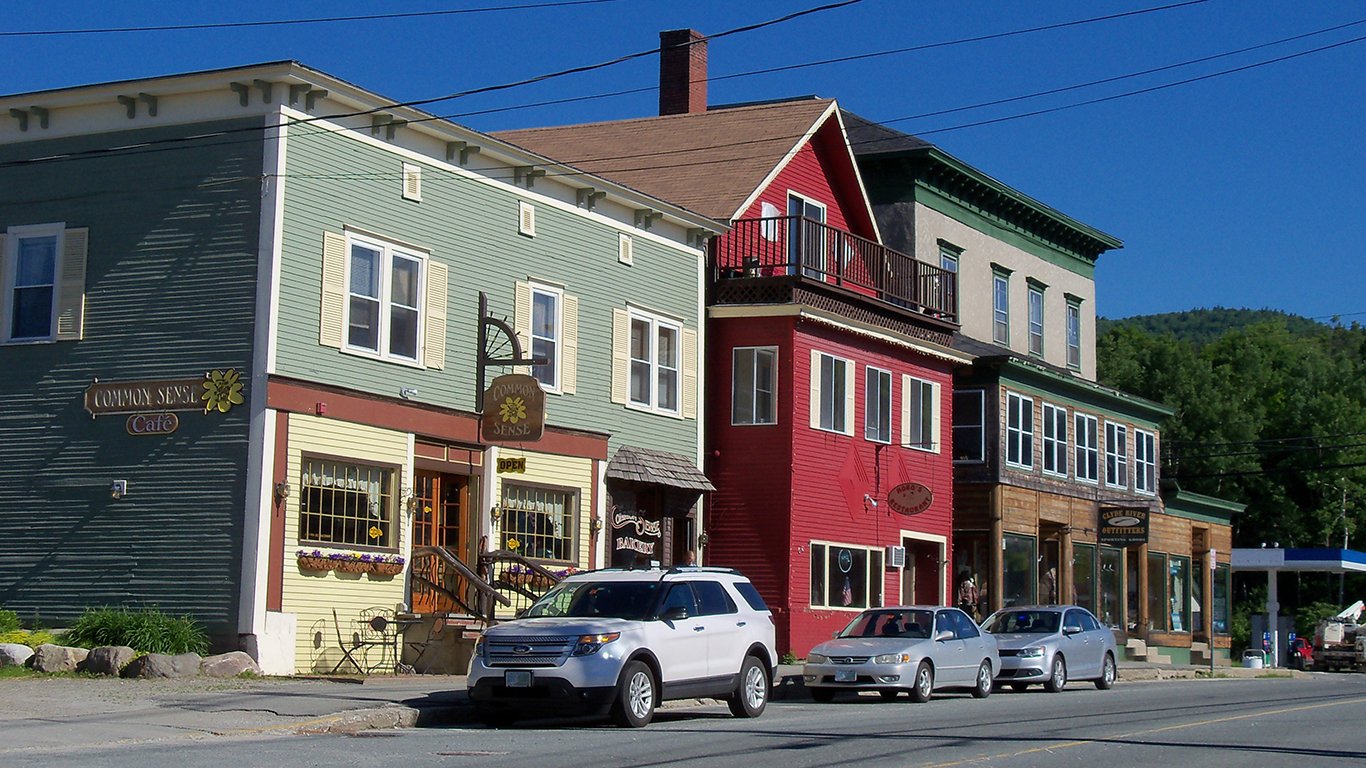
Vermont: Essex County
> Change in daily avg. new COVID-19 cases, week over week: +26 per 100,000 people
> Avg. new daily cases in Essex County in 7 days ending Dec. 7: 50 per 100,000
> Avg. new daily cases in Essex County in 7 days ending Nov. 30: 24 per 100,000
> Avg. new daily cases in Vermont in 7 days ending Dec. 7: 17 per 100,000 (3rd fewest)
> Cumulative confirmed COVID-19 cases in Essex County as of Dec. 7: 1,031 per 100,000 people (total: 64)
> Population: 6,208
> Largest place in Essex County: Island Pond CDP

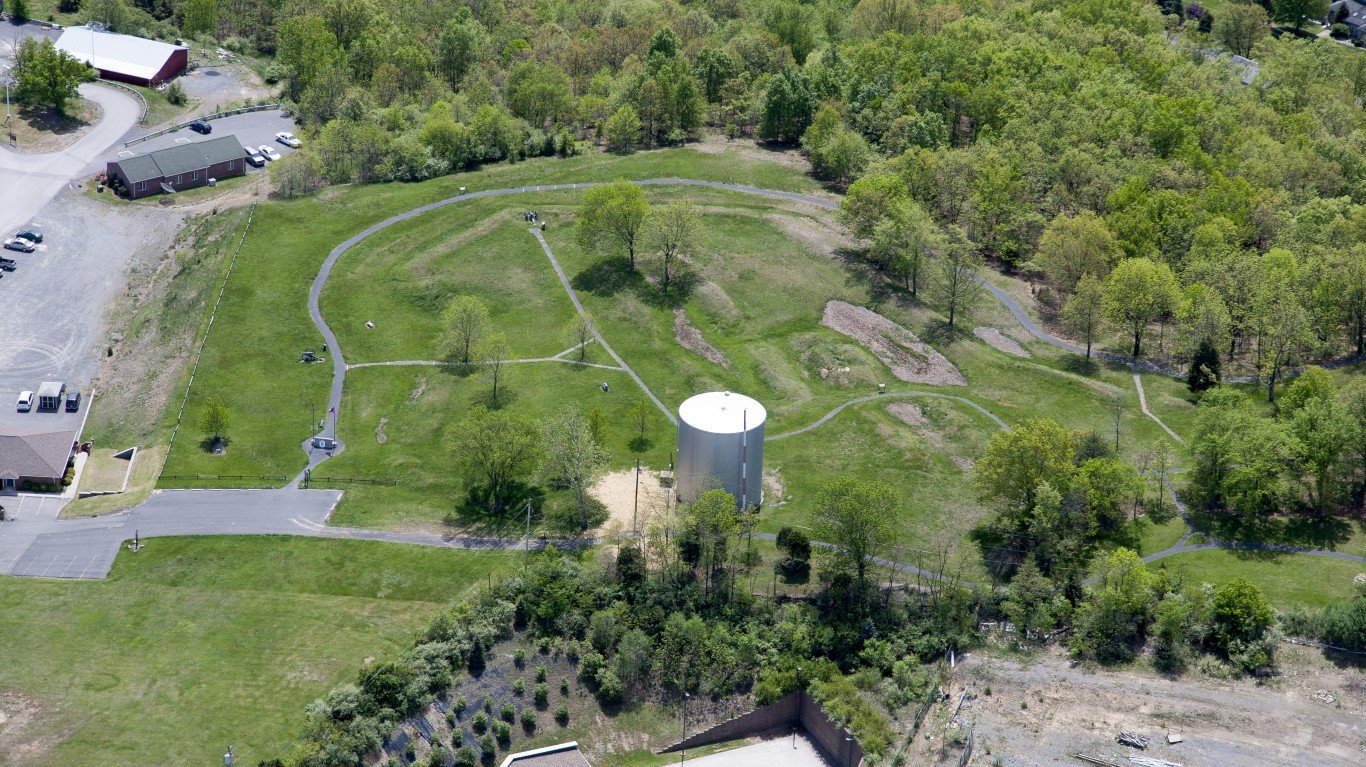
Virginia: Staunton city
> Change in daily avg. new COVID-19 cases, week over week: +112 per 100,000 people
> Avg. new daily cases in Staunton city in 7 days ending Dec. 7: 198 per 100,000
> Avg. new daily cases in Staunton city in 7 days ending Nov. 30: 86 per 100,000
> Avg. new daily cases in Virginia in 7 days ending Dec. 7: 29 per 100,000 (5th fewest)
> Cumulative confirmed COVID-19 cases in Staunton city as of Dec. 7: 4,646 per 100,000 people (total: 1,136)
> Population: 24,452
> Largest place in Staunton city: Staunton
[in-text-ad]

Washington: Franklin County
> Change in daily avg. new COVID-19 cases, week over week: +109 per 100,000 people
> Avg. new daily cases in Franklin County in 7 days ending Dec. 7: 122 per 100,000
> Avg. new daily cases in Franklin County in 7 days ending Nov. 30: 13 per 100,000
> Avg. new daily cases in Washington in 7 days ending Dec. 7: 31 per 100,000 (6th fewest)
> Cumulative confirmed COVID-19 cases in Franklin County as of Dec. 7: 0 per 100,000 people (total: 00)
> Population: 90,660
> Largest place in Franklin County: Pasco
[recirclink id=823427]
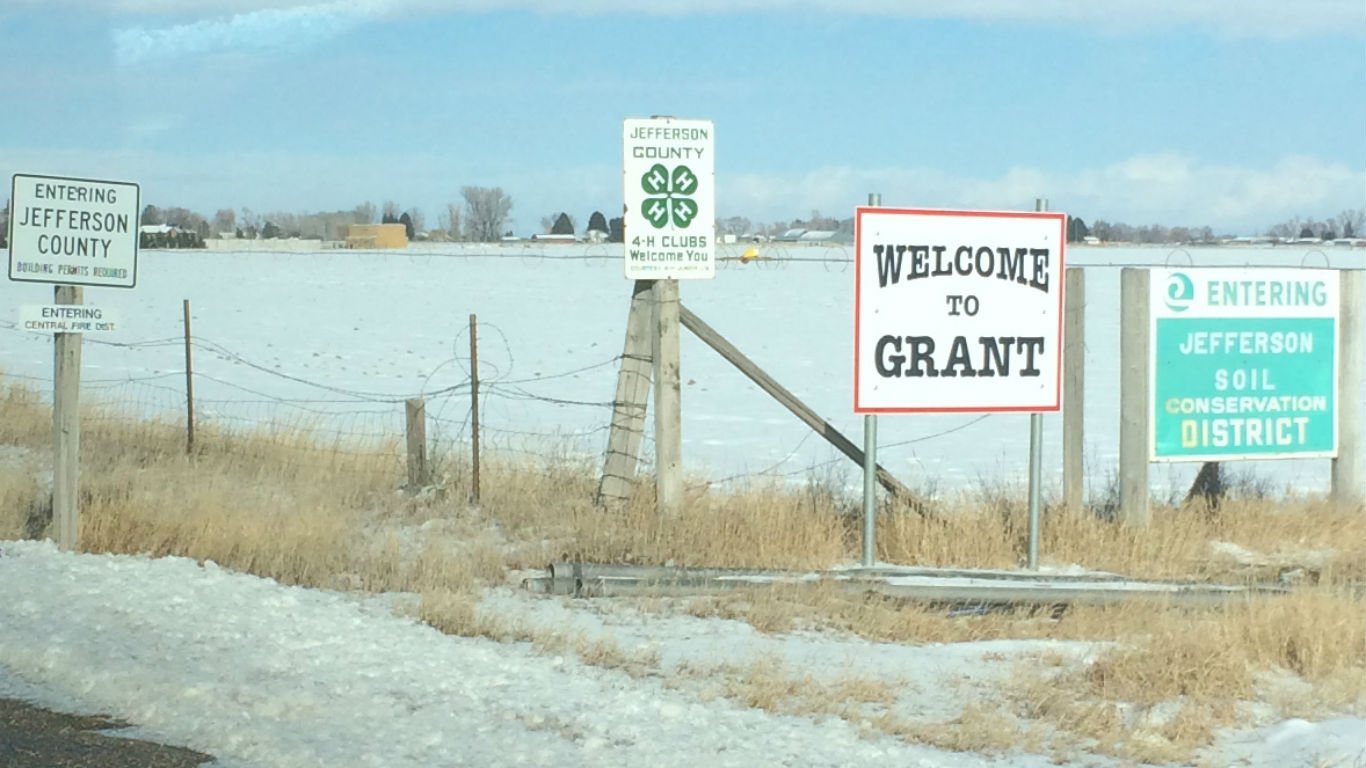
West Virginia: Grant County
> Change in daily avg. new COVID-19 cases, week over week: +51 per 100,000 people
> Avg. new daily cases in Grant County in 7 days ending Dec. 7: 135 per 100,000
> Avg. new daily cases in Grant County in 7 days ending Nov. 30: 84 per 100,000
> Avg. new daily cases in West Virginia in 7 days ending Dec. 7: 58 per 100,000 (20th fewest)
> Cumulative confirmed COVID-19 cases in Grant County as of Dec. 7: 4,295 per 100,000 people (total: 500)
> Population: 11,641
> Largest place in Grant County: Petersburg

Wisconsin: Ashland County
> Change in daily avg. new COVID-19 cases, week over week: +18 per 100,000 people
> Avg. new daily cases in Ashland County in 7 days ending Dec. 7: 97 per 100,000
> Avg. new daily cases in Ashland County in 7 days ending Nov. 30: 78 per 100,000
> Avg. new daily cases in Wisconsin in 7 days ending Dec. 7: 67 per 100,000 (23rd most)
> Cumulative confirmed COVID-19 cases in Ashland County as of Dec. 7: 5,092 per 100,000 people (total: 800)
> Population: 15,712
> Largest place in Ashland County: Ashland
[in-text-ad-2]
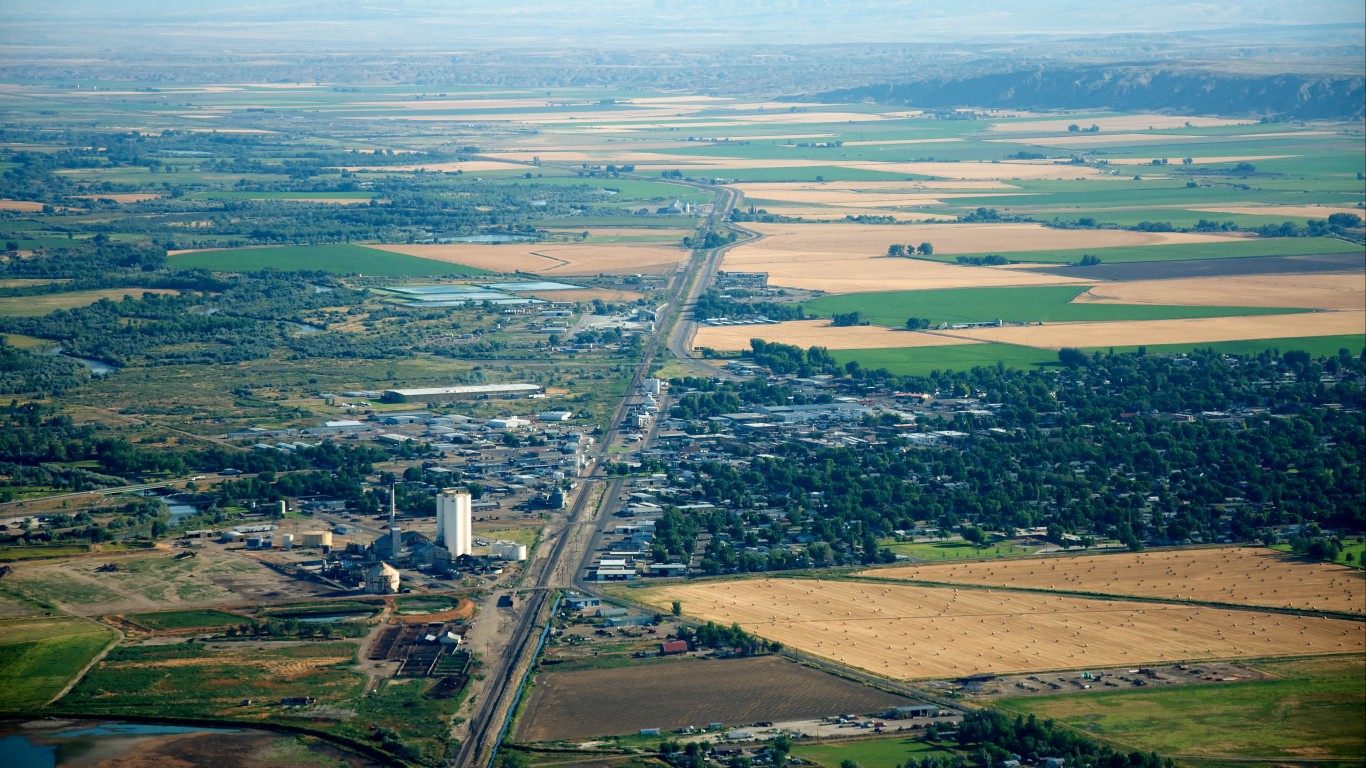
Wyoming: Washakie County
> Change in daily avg. new COVID-19 cases, week over week: +146 per 100,000 people
> Avg. new daily cases in Washakie County in 7 days ending Dec. 7: 211 per 100,000
> Avg. new daily cases in Washakie County in 7 days ending Nov. 30: 65 per 100,000
> Avg. new daily cases in Wyoming in 7 days ending Dec. 7: 99 per 100,000 (2nd most)
> Cumulative confirmed COVID-19 cases in Washakie County as of Dec. 7: 6,840 per 100,000 people (total: 556)
> Population: 8,129
> Largest place in Washakie County: Worland
Contact [email protected] for any questions or corrections.