The death toll from the novel coronavirus in the United States has now surpassed 330,000. At nearly 1 death for every 1,000 residents, the U.S. continues to report among the worst COVID-19 mortality rates of any nation in the world.
Using data compiled from state and local health departments, 24/7 Wall St. compared average daily COVID-19 cases per 100,000 people for the week ending Dec. 21 and compared it to the average in the previous week ending Dec. 14. We excluded counties with populations of fewer than 5,000 people as well as those with fewer than 20 reported new cases in the past 14 days.
Between these two weeks, the daily occurrence of COVID-19 cases nationwide dropped from 66.0 per 100,000 people to 61.6 per 100,000. While the decline is certainly good news, average daily cases in each of these weeks were higher than in the previous two weeks ending Nov. 30 and Dec. 7.
In 21 states, every county considered reported a decline in average daily new COVID-19 cases between the weeks ending Dec. 15 and 21. In the remaining 29 states, at least one county reported an increase.
In six states, the county with the largest increase in cases reported a weekly surge of more than 100 COVID-19 cases per 100,000 residents.
Click here to see the places in every state where COVID-19 is growing the fastest right now.

Alabama: Clarke County
> Population: 24,387
> Change in daily avg. new COVID-19 cases, week over week: 85.0 per 100,000 people (total: 46)
> Avg. new daily cases in Clarke County in 7 days ending Dec 21: 189.6 per 100,000
> Avg. new daily cases in Clarke County in 7 days ending Dec 14: 104.6 per 100,000
> Avg. new daily cases in Alabama in 7 days ending Dec 21: 78.7 per 100,000 — 11th highest (total: 3,827)
> Cumulative confirmed COVID-19 cases in Clarke County as of Dec 21: 8,984.3 per 100,000 people (total: 2,191)
> Most populous place in Clarke County: Jackson
[in-text-ad]

Alaska: Anchorage Municipality
> Population: 296,112
> Change in daily avg. new COVID-19 cases, week over week: -19.3 per 100,000 people (total: 161)
> Avg. new daily cases in Anchorage Municipality in 7 days ending Dec 21: 54.4 per 100,000
> Avg. new daily cases in Anchorage Municipality in 7 days ending Dec 14: 73.7 per 100,000
> Avg. new daily cases in Alaska in 7 days ending Dec 21: 62.9 per 100,000 — 25th highest (total: 465)
> Cumulative confirmed COVID-19 cases in Anchorage Municipality as of Dec 21: 5,577.3 per 100,000 people (total: 16,515)
> Most populous place in Anchorage Municipality: Anchorage
[recirclink id=825469]
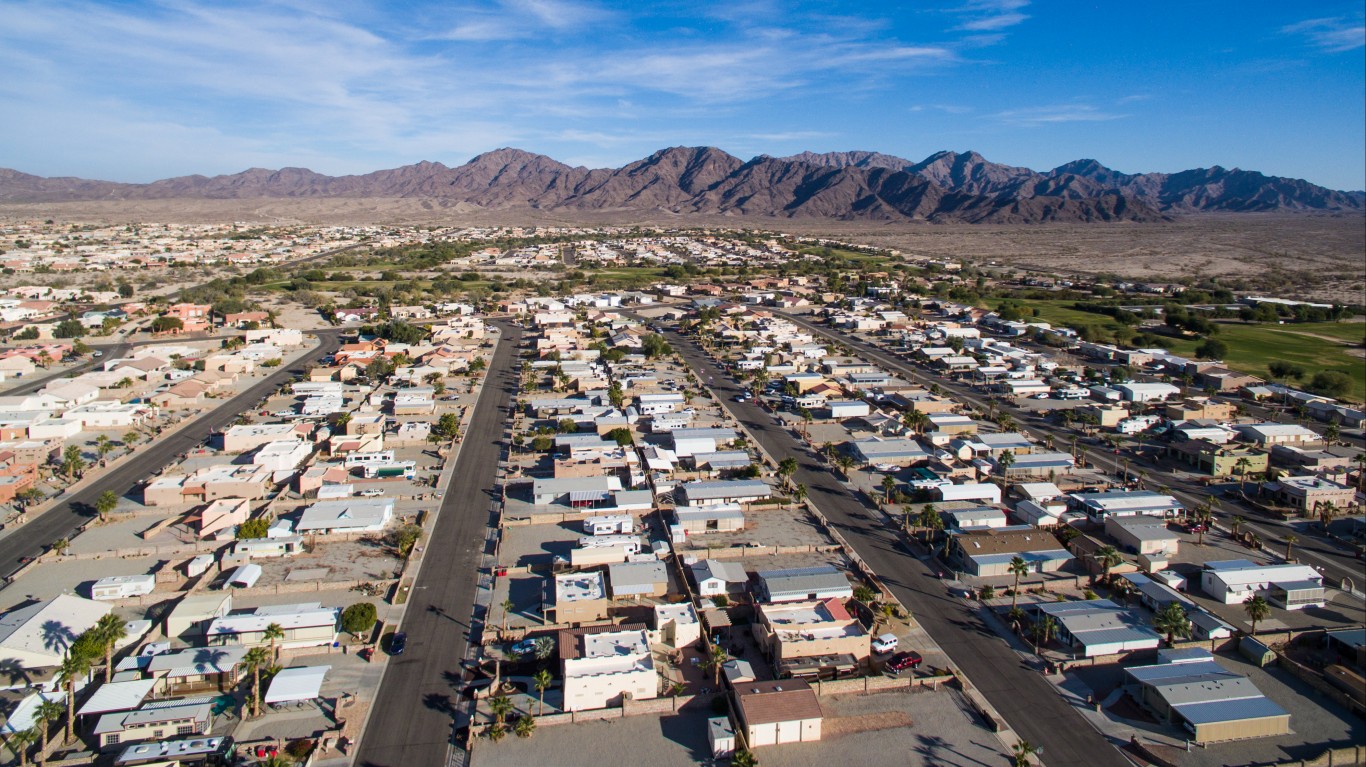
Arizona: Yuma County
> Population: 207,829
> Change in daily avg. new COVID-19 cases, week over week: -21.5 per 100,000 people (total: 338)
> Avg. new daily cases in Yuma County in 7 days ending Dec 21: 162.6 per 100,000
> Avg. new daily cases in Yuma County in 7 days ending Dec 14: 184.1 per 100,000
> Avg. new daily cases in Arizona in 7 days ending Dec 21: 94.1 per 100,000 — 5th highest (total: 6,539)
> Cumulative confirmed COVID-19 cases in Yuma County as of Dec 21: 12,011.8 per 100,000 people (total: 24,964)
> Most populous place in Yuma County: Yuma

Arkansas: Jackson County
> Population: 17,225
> Change in daily avg. new COVID-19 cases, week over week: -74.6 per 100,000 people (total: 44)
> Avg. new daily cases in Jackson County in 7 days ending Dec 21: 253.5 per 100,000
> Avg. new daily cases in Jackson County in 7 days ending Dec 14: 328.2 per 100,000
> Avg. new daily cases in Arkansas in 7 days ending Dec 21: 76.9 per 100,000 — 14th highest (total: 2,301)
> Cumulative confirmed COVID-19 cases in Jackson County as of Dec 21: 18,438.3 per 100,000 people (total: 3,176)
> Most populous place in Jackson County: Newport
[in-text-ad-2]

California: San Bernardino County
> Population: 2,135,413
> Change in daily avg. new COVID-19 cases, week over week: 77.9 per 100,000 people (total: 4,244)
> Avg. new daily cases in San Bernardino County in 7 days ending Dec 21: 198.8 per 100,000
> Avg. new daily cases in San Bernardino County in 7 days ending Dec 14: 120.8 per 100,000
> Avg. new daily cases in California in 7 days ending Dec 21: 100.4 per 100,000 — 3rd highest (total: 39,317)
> Cumulative confirmed COVID-19 cases in San Bernardino County as of Dec 21: 7,624.3 per 100,000 people (total: 162,810)
> Most populous place in San Bernardino County: San Bernardino

Colorado: Bent County
> Population: 5,809
> Change in daily avg. new COVID-19 cases, week over week: 17.2 per 100,000 people (total: 37)
> Avg. new daily cases in Bent County in 7 days ending Dec 21: 644.3 per 100,000
> Avg. new daily cases in Bent County in 7 days ending Dec 14: 627.1 per 100,000
> Avg. new daily cases in Colorado in 7 days ending Dec 21: 59.8 per 100,000 — 21st lowest (total: 3,308)
> Cumulative confirmed COVID-19 cases in Bent County as of Dec 21: 15,097.3 per 100,000 people (total: 877)
> Most populous place in Bent County: Las Animas
[in-text-ad]

Connecticut: Windham County
> Population: 116,538
> Change in daily avg. new COVID-19 cases, week over week: 9.8 per 100,000 people (total: 95)
> Avg. new daily cases in Windham County in 7 days ending Dec 21: 81.7 per 100,000
> Avg. new daily cases in Windham County in 7 days ending Dec 14: 71.9 per 100,000
> Avg. new daily cases in Connecticut in 7 days ending Dec 21: 64.4 per 100,000 — 23rd highest (total: 2,306)
> Cumulative confirmed COVID-19 cases in Windham County as of Dec 21: 3,740.4 per 100,000 people (total: 4,359)
> Most populous place in Windham County: Willimantic
[recirclink id=825816]

Delaware: New Castle County
> Population: 555,133
> Change in daily avg. new COVID-19 cases, week over week: -6.7 per 100,000 people (total: 452)
> Avg. new daily cases in New Castle County in 7 days ending Dec 21: 81.4 per 100,000
> Avg. new daily cases in New Castle County in 7 days ending Dec 14: 88.1 per 100,000
> Avg. new daily cases in Delaware in 7 days ending Dec 21: 80.1 per 100,000 — 10th highest (total: 760)
> Cumulative confirmed COVID-19 cases in New Castle County as of Dec 21: 5,278.0 per 100,000 people (total: 29,300)
> Most populous place in New Castle County: Wilmington

Florida: Bradford County
> Population: 26,979
> Change in daily avg. new COVID-19 cases, week over week: 47.1 per 100,000 people (total: 25)
> Avg. new daily cases in Bradford County in 7 days ending Dec 21: 92.0 per 100,000
> Avg. new daily cases in Bradford County in 7 days ending Dec 14: 44.9 per 100,000
> Avg. new daily cases in Florida in 7 days ending Dec 21: 52.8 per 100,000 — 13th lowest (total: 10,869)
> Cumulative confirmed COVID-19 cases in Bradford County as of Dec 21: 6,942.4 per 100,000 people (total: 1,873)
> Most populous place in Bradford County: Starke
[in-text-ad-2]

Georgia: Whitfield County
> Population: 103,849
> Change in daily avg. new COVID-19 cases, week over week: 3.1 per 100,000 people (total: 111)
> Avg. new daily cases in Whitfield County in 7 days ending Dec 21: 107.3 per 100,000
> Avg. new daily cases in Whitfield County in 7 days ending Dec 14: 104.2 per 100,000
> Avg. new daily cases in Georgia in 7 days ending Dec 21: 45.4 per 100,000 — 9th lowest (total: 4,674)
> Cumulative confirmed COVID-19 cases in Whitfield County as of Dec 21: 9,550.4 per 100,000 people (total: 9,918)
> Most populous place in Whitfield County: Dalton

Hawaii: Maui County
> Population: 165,281
> Change in daily avg. new COVID-19 cases, week over week: 33.4 per 100,000 people (total: 89)
> Avg. new daily cases in Maui County in 7 days ending Dec 21: 53.8 per 100,000
> Avg. new daily cases in Maui County in 7 days ending Dec 14: 20.4 per 100,000
> Avg. new daily cases in Hawaii in 7 days ending Dec 21: 06.3 per 100,000 — the lowest (total: 89)
> Cumulative confirmed COVID-19 cases in Maui County as of Dec 21: 552.4 per 100,000 people (total: 913)
> Most populous place in Maui County: Kahului
[in-text-ad]

Idaho: Kootenai County
> Population: 153,605
> Change in daily avg. new COVID-19 cases, week over week: -27.9 per 100,000 people (total: 173)
> Avg. new daily cases in Kootenai County in 7 days ending Dec 21: 112.5 per 100,000
> Avg. new daily cases in Kootenai County in 7 days ending Dec 14: 140.4 per 100,000
> Avg. new daily cases in Idaho in 7 days ending Dec 21: 75.8 per 100,000 — 16th highest (total: 1,280)
> Cumulative confirmed COVID-19 cases in Kootenai County as of Dec 21: 7,372.2 per 100,000 people (total: 11,324)
> Most populous place in Kootenai County: Coeur d’Alene
[recirclink id=825695]

Illinois: Lawrence County
> Population: 16,189
> Change in daily avg. new COVID-19 cases, week over week: 33.3 per 100,000 people (total: 30)
> Avg. new daily cases in Lawrence County in 7 days ending Dec 21: 182.7 per 100,000
> Avg. new daily cases in Lawrence County in 7 days ending Dec 14: 149.4 per 100,000
> Avg. new daily cases in Illinois in 7 days ending Dec 21: 60.5 per 100,000 — 24th lowest (total: 7,762)
> Cumulative confirmed COVID-19 cases in Lawrence County as of Dec 21: 10,538.0 per 100,000 people (total: 1,706)
> Most populous place in Lawrence County: Lawrenceville

Indiana: Dubois County
> Population: 42,418
> Change in daily avg. new COVID-19 cases, week over week: 52.5 per 100,000 people (total: 80)
> Avg. new daily cases in Dubois County in 7 days ending Dec 21: 189.3 per 100,000
> Avg. new daily cases in Dubois County in 7 days ending Dec 14: 136.8 per 100,000
> Avg. new daily cases in Indiana in 7 days ending Dec 21: 86.9 per 100,000 — 6th highest (total: 5,770)
> Cumulative confirmed COVID-19 cases in Dubois County as of Dec 21: 9,432.3 per 100,000 people (total: 4,001)
> Most populous place in Dubois County: Jasper
[in-text-ad-2]

Iowa: Henry County
> Population: 19,926
> Change in daily avg. new COVID-19 cases, week over week: -69.0 per 100,000 people (total: 24)
> Avg. new daily cases in Henry County in 7 days ending Dec 21: 118.7 per 100,000
> Avg. new daily cases in Henry County in 7 days ending Dec 14: 187.7 per 100,000
> Avg. new daily cases in Iowa in 7 days ending Dec 21: 50.2 per 100,000 — 10th lowest (total: 1,574)
> Cumulative confirmed COVID-19 cases in Henry County as of Dec 21: 12,039.5 per 100,000 people (total: 2,399)
> Most populous place in Henry County: Mount Pleasant

Kansas: Ellsworth County
> Population: 6,293
> Change in daily avg. new COVID-19 cases, week over week: -45.7 per 100,000 people (total: 12)
> Avg. new daily cases in Ellsworth County in 7 days ending Dec 21: 196.8 per 100,000
> Avg. new daily cases in Ellsworth County in 7 days ending Dec 14: 242.6 per 100,000
> Avg. new daily cases in Kansas in 7 days ending Dec 21: 74.0 per 100,000 — 18th highest (total: 2,153)
> Cumulative confirmed COVID-19 cases in Ellsworth County as of Dec 21: 14,857.8 per 100,000 people (total: 935)
> Most populous place in Ellsworth County: Ellsworth
[in-text-ad]

Kentucky: Clinton County
> Population: 10,211
> Change in daily avg. new COVID-19 cases, week over week: 107.3 per 100,000 people (total: 22)
> Avg. new daily cases in Clinton County in 7 days ending Dec 21: 216.3 per 100,000
> Avg. new daily cases in Clinton County in 7 days ending Dec 14: 108.9 per 100,000
> Avg. new daily cases in Kentucky in 7 days ending Dec 21: 66.8 per 100,000 — 22nd highest (total: 2,966)
> Cumulative confirmed COVID-19 cases in Clinton County as of Dec 21: 6,972.9 per 100,000 people (total: 712)
> Most populous place in Clinton County: Albany
[recirclink id=825621]

Louisiana: Caldwell Parish
> Population: 9,996
> Change in daily avg. new COVID-19 cases, week over week: 20.2 per 100,000 people (total: 11)
> Avg. new daily cases in Caldwell Parish in 7 days ending Dec 21: 110.9 per 100,000
> Avg. new daily cases in Caldwell Parish in 7 days ending Dec 14: 90.6 per 100,000
> Avg. new daily cases in Louisiana in 7 days ending Dec 21: 54.3 per 100,000 — 16th lowest (total: 2,530)
> Cumulative confirmed COVID-19 cases in Caldwell Parish as of Dec 21: 8,483.4 per 100,000 people (total: 848)
> Most populous place in Caldwell Parish: Clarks

Maine: Oxford County
> Population: 57,325
> Change in daily avg. new COVID-19 cases, week over week: 12.4 per 100,000 people (total: 30)
> Avg. new daily cases in Oxford County in 7 days ending Dec 21: 52.6 per 100,000
> Avg. new daily cases in Oxford County in 7 days ending Dec 14: 40.2 per 100,000
> Avg. new daily cases in Maine in 7 days ending Dec 21: 31.9 per 100,000 — 4th lowest (total: 425)
> Cumulative confirmed COVID-19 cases in Oxford County as of Dec 21: 1,535.1 per 100,000 people (total: 880)
> Most populous place in Oxford County: Rumford
[in-text-ad-2]

Maryland: Allegany County
> Population: 71,977
> Change in daily avg. new COVID-19 cases, week over week: -36.9 per 100,000 people (total: 70)
> Avg. new daily cases in Allegany County in 7 days ending Dec 21: 97.5 per 100,000
> Avg. new daily cases in Allegany County in 7 days ending Dec 14: 134.4 per 100,000
> Avg. new daily cases in Maryland in 7 days ending Dec 21: 42.1 per 100,000 — 5th lowest (total: 2,525)
> Cumulative confirmed COVID-19 cases in Allegany County as of Dec 21: 7,045.3 per 100,000 people (total: 5,071)
> Most populous place in Allegany County: Cumberland

Massachusetts: Nantucket County
> Population: 11,101
> Change in daily avg. new COVID-19 cases, week over week: -34.9 per 100,000 people (total: 17)
> Avg. new daily cases in Nantucket County in 7 days ending Dec 21: 149.3 per 100,000
> Avg. new daily cases in Nantucket County in 7 days ending Dec 14: 184.2 per 100,000
> Avg. new daily cases in Massachusetts in 7 days ending Dec 21: 71.1 per 100,000 — 19th highest (total: 4,857)
> Cumulative confirmed COVID-19 cases in Nantucket County as of Dec 21: 6,017.5 per 100,000 people (total: 668)
> Most populous place in Nantucket County: Nantucket
[in-text-ad]

Michigan: Huron County
> Population: 31,543
> Change in daily avg. new COVID-19 cases, week over week: -34.4 per 100,000 people (total: 26)
> Avg. new daily cases in Huron County in 7 days ending Dec 21: 82.5 per 100,000
> Avg. new daily cases in Huron County in 7 days ending Dec 14: 116.9 per 100,000
> Avg. new daily cases in Michigan in 7 days ending Dec 21: 45.0 per 100,000 — 8th lowest (total: 4,482)
> Cumulative confirmed COVID-19 cases in Huron County as of Dec 21: 4,536.7 per 100,000 people (total: 1,431)
> Most populous place in Huron County: Bad Axe
[recirclink id=825469]

Minnesota: Pine County
> Population: 29,129
> Change in daily avg. new COVID-19 cases, week over week: -4.8 per 100,000 people (total: 46)
> Avg. new daily cases in Pine County in 7 days ending Dec 21: 157.9 per 100,000
> Avg. new daily cases in Pine County in 7 days ending Dec 14: 162.7 per 100,000
> Avg. new daily cases in Minnesota in 7 days ending Dec 21: 75.0 per 100,000 — 17th highest (total: 4,144)
> Cumulative confirmed COVID-19 cases in Pine County as of Dec 21: 7,844.4 per 100,000 people (total: 2,285)
> Most populous place in Pine County: Pine City

Mississippi: Union County
> Population: 28,356
> Change in daily avg. new COVID-19 cases, week over week: 5.9 per 100,000 people (total: 43)
> Avg. new daily cases in Union County in 7 days ending Dec 21: 151.4 per 100,000
> Avg. new daily cases in Union County in 7 days ending Dec 14: 145.5 per 100,000
> Avg. new daily cases in Mississippi in 7 days ending Dec 21: 70.9 per 100,000 — 20th highest (total: 2,120)
> Cumulative confirmed COVID-19 cases in Union County as of Dec 21: 8,798.8 per 100,000 people (total: 2,495)
> Most populous place in Union County: New Albany
[in-text-ad-2]

Missouri: Pettis County
> Population: 42,371
> Change in daily avg. new COVID-19 cases, week over week: -40.8 per 100,000 people (total: 55)
> Avg. new daily cases in Pettis County in 7 days ending Dec 21: 130.1 per 100,000
> Avg. new daily cases in Pettis County in 7 days ending Dec 14: 170.9 per 100,000
> Avg. new daily cases in Missouri in 7 days ending Dec 21: 51.4 per 100,000 — 11th lowest (total: 3,133)
> Cumulative confirmed COVID-19 cases in Pettis County as of Dec 21: 8,977.8 per 100,000 people (total: 3,804)
> Most populous place in Pettis County: Sedalia
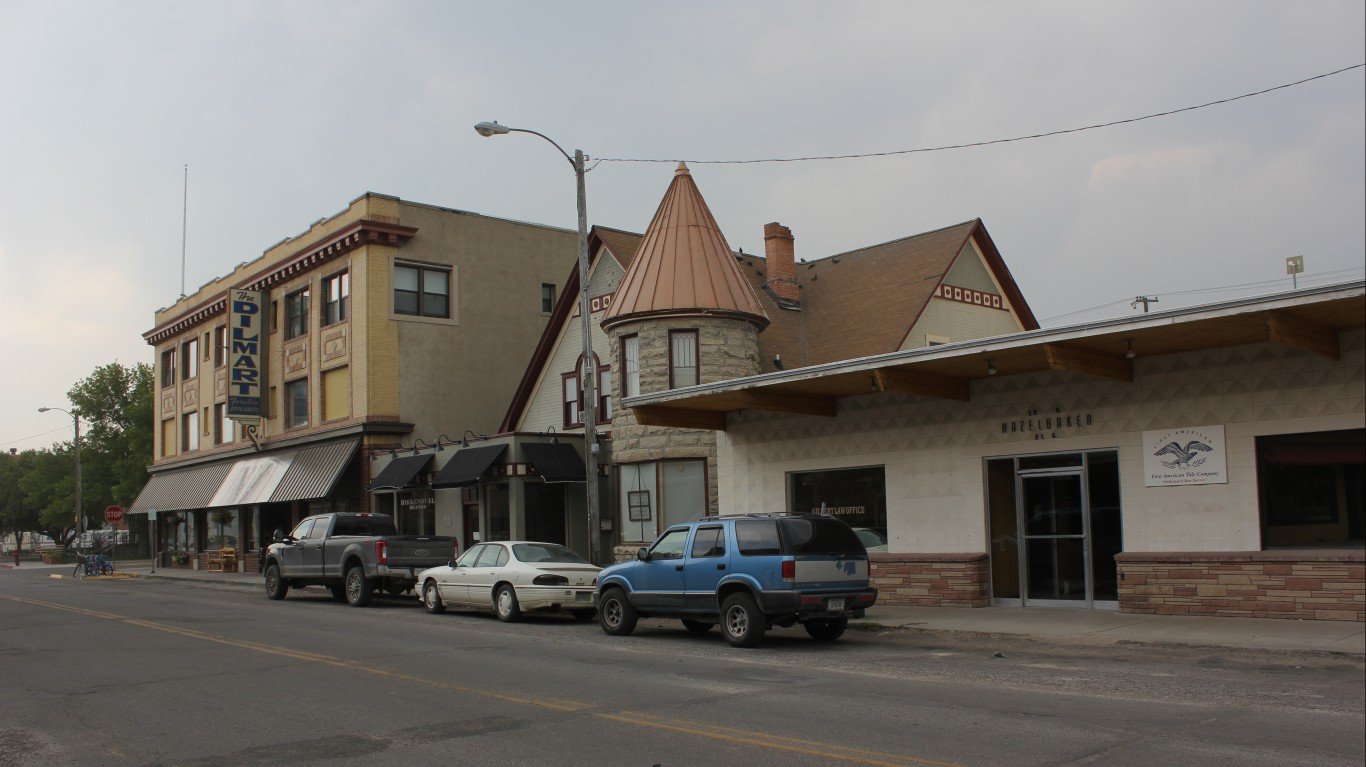
Montana: Beaverhead County
> Population: 9,393
> Change in daily avg. new COVID-19 cases, week over week: 15.9 per 100,000 people (total: 10)
> Avg. new daily cases in Beaverhead County in 7 days ending Dec 21: 101.7 per 100,000
> Avg. new daily cases in Beaverhead County in 7 days ending Dec 14: 85.8 per 100,000
> Avg. new daily cases in Montana in 7 days ending Dec 21: 58.3 per 100,000 — 18th lowest (total: 608)
> Cumulative confirmed COVID-19 cases in Beaverhead County as of Dec 21: 7,803.7 per 100,000 people (total: 733)
> Most populous place in Beaverhead County: Dillon
[in-text-ad]

Nebraska: Johnson County
> Population: 5,197
> Change in daily avg. new COVID-19 cases, week over week: 122.9 per 100,000 people (total: 12)
> Avg. new daily cases in Johnson County in 7 days ending Dec 21: 225.4 per 100,000
> Avg. new daily cases in Johnson County in 7 days ending Dec 14: 102.5 per 100,000
> Avg. new daily cases in Nebraska in 7 days ending Dec 21: 59.4 per 100,000 — 20th lowest (total: 1,131)
> Cumulative confirmed COVID-19 cases in Johnson County as of Dec 21: 9,139.9 per 100,000 people (total: 475)
> Most populous place in Johnson County: Tecumseh
[recirclink id=825816]

Nevada: Carson City
> Population: 54,467
> Change in daily avg. new COVID-19 cases, week over week: -0.8 per 100,000 people (total: 112)
> Avg. new daily cases in Carson City in 7 days ending Dec 21: 206.4 per 100,000
> Avg. new daily cases in Carson City in 7 days ending Dec 14: 207.2 per 100,000
> Avg. new daily cases in Nevada in 7 days ending Dec 21: 86.2 per 100,000 — 8th highest (total: 2,521)
> Cumulative confirmed COVID-19 cases in Carson City as of Dec 21: 8,346.3 per 100,000 people (total: 4,546)
> Most populous place in Carson City: Carson City

New Hampshire: Merrimack County
> Population: 149,452
> Change in daily avg. new COVID-19 cases, week over week: 15.7 per 100,000 people (total: 122)
> Avg. new daily cases in Merrimack County in 7 days ending Dec 21: 81.6 per 100,000
> Avg. new daily cases in Merrimack County in 7 days ending Dec 14: 66.0 per 100,000
> Avg. new daily cases in New Hampshire in 7 days ending Dec 21: 60.3 per 100,000 — 23rd lowest (total: 811)
> Cumulative confirmed COVID-19 cases in Merrimack County as of Dec 21: 2,699.2 per 100,000 people (total: 4,034)
> Most populous place in Merrimack County: Concord
[in-text-ad-2]

New Jersey: Passaic County
> Population: 504,041
> Change in daily avg. new COVID-19 cases, week over week: -9.3 per 100,000 people (total: 339)
> Avg. new daily cases in Passaic County in 7 days ending Dec 21: 67.2 per 100,000
> Avg. new daily cases in Passaic County in 7 days ending Dec 14: 76.4 per 100,000
> Avg. new daily cases in New Jersey in 7 days ending Dec 21: 51.7 per 100,000 — 12th lowest (total: 4,588)
> Cumulative confirmed COVID-19 cases in Passaic County as of Dec 21: 7,476.6 per 100,000 people (total: 37,685)
> Most populous place in Passaic County: Paterson

New Mexico: Lea County
> Population: 70,126
> Change in daily avg. new COVID-19 cases, week over week: 14.8 per 100,000 people (total: 94)
> Avg. new daily cases in Lea County in 7 days ending Dec 21: 134.0 per 100,000
> Avg. new daily cases in Lea County in 7 days ending Dec 14: 119.2 per 100,000
> Avg. new daily cases in New Mexico in 7 days ending Dec 21: 76.4 per 100,000 — 15th highest (total: 1,598)
> Cumulative confirmed COVID-19 cases in Lea County as of Dec 21: 8,621.6 per 100,000 people (total: 6,046)
> Most populous place in Lea County: Hobbs
[in-text-ad]

New York: Oneida County
> Population: 230,782
> Change in daily avg. new COVID-19 cases, week over week: 1.7 per 100,000 people (total: 227)
> Avg. new daily cases in Oneida County in 7 days ending Dec 21: 98.1 per 100,000
> Avg. new daily cases in Oneida County in 7 days ending Dec 14: 96.5 per 100,000
> Avg. new daily cases in New York in 7 days ending Dec 21: 52.9 per 100,000 — 14th lowest (total: 10,387)
> Cumulative confirmed COVID-19 cases in Oneida County as of Dec 21: 4,147.2 per 100,000 people (total: 9,571)
> Most populous place in Oneida County: Utica
[recirclink id=825695]

North Carolina: Yancey County
> Population: 17,667
> Change in daily avg. new COVID-19 cases, week over week: -5.9 per 100,000 people (total: 18)
> Avg. new daily cases in Yancey County in 7 days ending Dec 21: 104.5 per 100,000
> Avg. new daily cases in Yancey County in 7 days ending Dec 14: 110.4 per 100,000
> Avg. new daily cases in North Carolina in 7 days ending Dec 21: 59.3 per 100,000 — 19th lowest (total: 6,027)
> Cumulative confirmed COVID-19 cases in Yancey County as of Dec 21: 5,167.8 per 100,000 people (total: 913)
> Most populous place in Yancey County: Burnsville
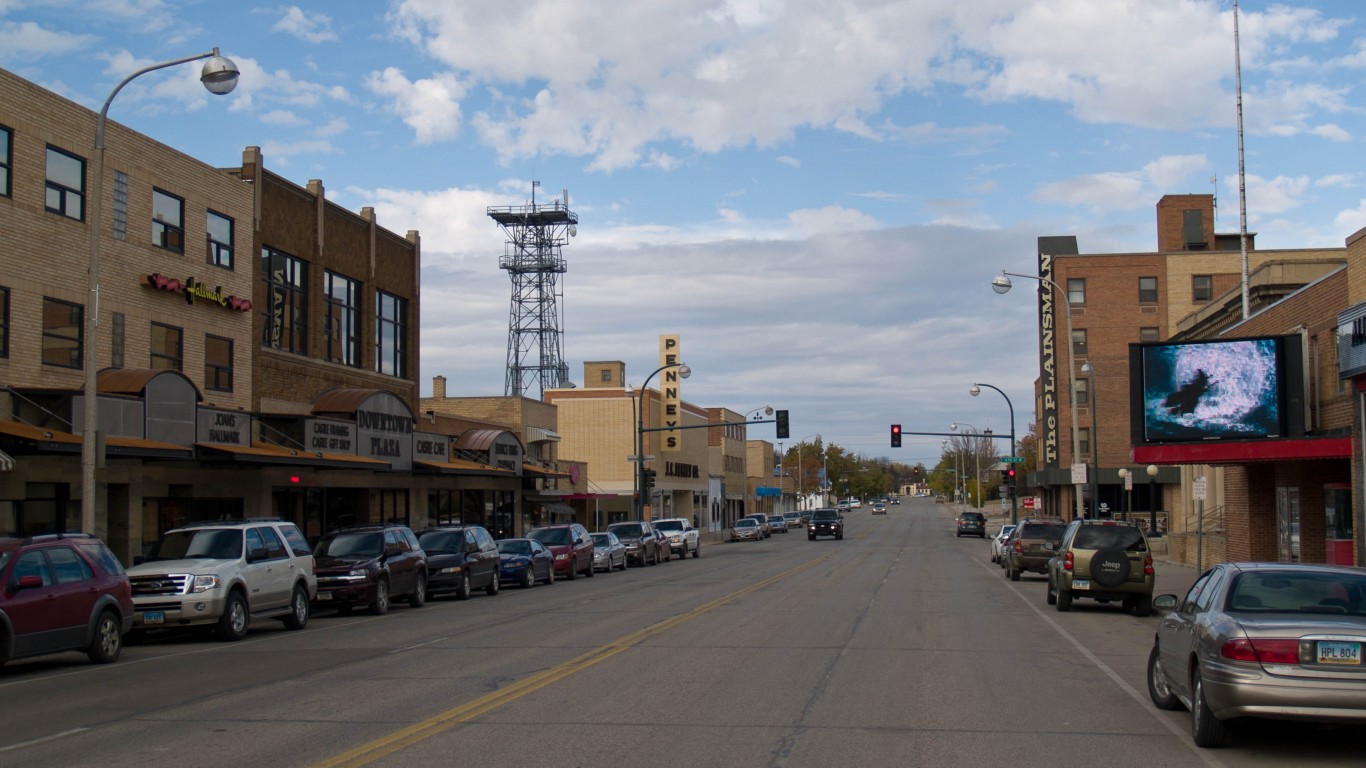
North Dakota: Williams County
> Population: 34,061
> Change in daily avg. new COVID-19 cases, week over week: 229.9 per 100,000 people (total: 88)
> Avg. new daily cases in Williams County in 7 days ending Dec 21: 259.6 per 100,000
> Avg. new daily cases in Williams County in 7 days ending Dec 14: 29.7 per 100,000
> Avg. new daily cases in North Dakota in 7 days ending Dec 21: 113.8 per 100,000 — 2nd highest (total: 856)
> Cumulative confirmed COVID-19 cases in Williams County as of Dec 21: 11,306.2 per 100,000 people (total: 3,851)
> Most populous place in Williams County: Williston
[in-text-ad-2]

Ohio: Wyandot County
> Population: 22,107
> Change in daily avg. new COVID-19 cases, week over week: -1.9 per 100,000 people (total: 29)
> Avg. new daily cases in Wyandot County in 7 days ending Dec 21: 133.4 per 100,000
> Avg. new daily cases in Wyandot County in 7 days ending Dec 14: 135.3 per 100,000
> Avg. new daily cases in Ohio in 7 days ending Dec 21: 77.4 per 100,000 — 12th highest (total: 9,016)
> Cumulative confirmed COVID-19 cases in Wyandot County as of Dec 21: 6,323.8 per 100,000 people (total: 1,398)
> Most populous place in Wyandot County: Upper Sandusky

Oklahoma: Alfalfa County
> Population: 5,857
> Change in daily avg. new COVID-19 cases, week over week: 143.2 per 100,000 people (total: 33)
> Avg. new daily cases in Alfalfa County in 7 days ending Dec 21: 563.4 per 100,000
> Avg. new daily cases in Alfalfa County in 7 days ending Dec 14: 420.2 per 100,000
> Avg. new daily cases in Oklahoma in 7 days ending Dec 21: 86.8 per 100,000 — 7th highest (total: 3,400)
> Cumulative confirmed COVID-19 cases in Alfalfa County as of Dec 21: 14,632.1 per 100,000 people (total: 857)
> Most populous place in Alfalfa County: Cherokee
[in-text-ad]

Oregon: Jefferson County
> Population: 23,143
> Change in daily avg. new COVID-19 cases, week over week: -52.1 per 100,000 people (total: 15)
> Avg. new daily cases in Jefferson County in 7 days ending Dec 21: 63.8 per 100,000
> Avg. new daily cases in Jefferson County in 7 days ending Dec 14: 115.9 per 100,000
> Avg. new daily cases in Oregon in 7 days ending Dec 21: 30.9 per 100,000 — 3rd lowest (total: 1,260)
> Cumulative confirmed COVID-19 cases in Jefferson County as of Dec 21: 5,556.8 per 100,000 people (total: 1,286)
> Most populous place in Jefferson County: Madras
[recirclink id=825621]

Pennsylvania: Somerset County
> Population: 74,949
> Change in daily avg. new COVID-19 cases, week over week: 36.3 per 100,000 people (total: 126)
> Avg. new daily cases in Somerset County in 7 days ending Dec 21: 167.7 per 100,000
> Avg. new daily cases in Somerset County in 7 days ending Dec 14: 131.4 per 100,000
> Avg. new daily cases in Pennsylvania in 7 days ending Dec 21: 77.0 per 100,000 — 13th highest (total: 9,847)
> Cumulative confirmed COVID-19 cases in Somerset County as of Dec 21: 5,523.8 per 100,000 people (total: 4,140)
> Most populous place in Somerset County: Somerset

Rhode Island: Providence County
> Population: 634,533
> Change in daily avg. new COVID-19 cases, week over week: -1.0 per 100,000 people (total: 815)
> Avg. new daily cases in Providence County in 7 days ending Dec 21: 128.5 per 100,000
> Avg. new daily cases in Providence County in 7 days ending Dec 14: 129.5 per 100,000
> Avg. new daily cases in Rhode Island in 7 days ending Dec 21: 99.0 per 100,000 — 4th highest (total: 1,046)
> Cumulative confirmed COVID-19 cases in Providence County as of Dec 21: 8,174.7 per 100,000 people (total: 51,871)
> Most populous place in Providence County: Providence
[in-text-ad-2]

South Carolina: Pickens County
> Population: 122,746
> Change in daily avg. new COVID-19 cases, week over week: 10.7 per 100,000 people (total: 132)
> Avg. new daily cases in Pickens County in 7 days ending Dec 21: 107.8 per 100,000
> Avg. new daily cases in Pickens County in 7 days ending Dec 14: 97.0 per 100,000
> Avg. new daily cases in South Carolina in 7 days ending Dec 21: 60.9 per 100,000 — 25th lowest (total: 3,018)
> Cumulative confirmed COVID-19 cases in Pickens County as of Dec 21: 7,364.8 per 100,000 people (total: 9,040)
> Most populous place in Pickens County: Easley

South Dakota: Dewey County
> Population: 5,779
> Change in daily avg. new COVID-19 cases, week over week: -160.7 per 100,000 people (total: 7)
> Avg. new daily cases in Dewey County in 7 days ending Dec 21: 128.9 per 100,000
> Avg. new daily cases in Dewey County in 7 days ending Dec 14: 289.6 per 100,000
> Avg. new daily cases in South Dakota in 7 days ending Dec 21: 55.2 per 100,000 — 17th lowest (total: 477)
> Cumulative confirmed COVID-19 cases in Dewey County as of Dec 21: 21,318.6 per 100,000 people (total: 1,232)
> Most populous place in Dewey County: North Eagle Butte
[in-text-ad]

Tennessee: Warren County
> Population: 40,454
> Change in daily avg. new COVID-19 cases, week over week: 117.1 per 100,000 people (total: 102)
> Avg. new daily cases in Warren County in 7 days ending Dec 21: 252.3 per 100,000
> Avg. new daily cases in Warren County in 7 days ending Dec 14: 135.2 per 100,000
> Avg. new daily cases in Tennessee in 7 days ending Dec 21: 130.0 per 100,000 — the highest (total: 8,649)
> Cumulative confirmed COVID-19 cases in Warren County as of Dec 21: 9,803.7 per 100,000 people (total: 3,966)
> Most populous place in Warren County: McMinnville
[recirclink id=825469]

Texas: Floyd County
> Population: 5,872
> Change in daily avg. new COVID-19 cases, week over week: 298.5 per 100,000 people (total: 30)
> Avg. new daily cases in Floyd County in 7 days ending Dec 21: 510.2 per 100,000
> Avg. new daily cases in Floyd County in 7 days ending Dec 14: 211.7 per 100,000
> Avg. new daily cases in Texas in 7 days ending Dec 21: 84.3 per 100,000 — 9th highest (total: 23,497)
> Cumulative confirmed COVID-19 cases in Floyd County as of Dec 21: 8,498.0 per 100,000 people (total: 499)
> Most populous place in Floyd County: Floydada

Utah: Utah County
> Population: 590,440
> Change in daily avg. new COVID-19 cases, week over week: -10.6 per 100,000 people (total: 553)
> Avg. new daily cases in Utah County in 7 days ending Dec 21: 93.7 per 100,000
> Avg. new daily cases in Utah County in 7 days ending Dec 14: 104.3 per 100,000
> Avg. new daily cases in Utah in 7 days ending Dec 21: 63.9 per 100,000 — 24th highest (total: 1,947)
> Cumulative confirmed COVID-19 cases in Utah County as of Dec 21: 10,446.3 per 100,000 people (total: 61,679)
> Most populous place in Utah County: Provo
[in-text-ad-2]

Vermont: Bennington County
> Population: 35,920
> Change in daily avg. new COVID-19 cases, week over week: 7.7 per 100,000 people (total: 10)
> Avg. new daily cases in Bennington County in 7 days ending Dec 21: 28.2 per 100,000
> Avg. new daily cases in Bennington County in 7 days ending Dec 14: 20.5 per 100,000
> Avg. new daily cases in Vermont in 7 days ending Dec 21: 16.3 per 100,000 — 2nd lowest (total: 102)
> Cumulative confirmed COVID-19 cases in Bennington County as of Dec 21: 1,102.4 per 100,000 people (total: 396)
> Most populous place in Bennington County: Bennington

Virginia: Covington city
> Population: 5,582
> Change in daily avg. new COVID-19 cases, week over week: 1.8 per 100,000 people (total: 9)
> Avg. new daily cases in Covington city in 7 days ending Dec 21: 163.4 per 100,000
> Avg. new daily cases in Covington city in 7 days ending Dec 14: 161.6 per 100,000
> Avg. new daily cases in Virginia in 7 days ending Dec 21: 42.6 per 100,000 — 6th lowest (total: 3,586)
> Cumulative confirmed COVID-19 cases in Covington city as of Dec 21: 5,768.5 per 100,000 people (total: 322)
> Most populous place in Covington city: Covington
[in-text-ad]

Washington: Pacific County
> Population: 21,281
> Change in daily avg. new COVID-19 cases, week over week: 62.5 per 100,000 people (total: 19)
> Avg. new daily cases in Pacific County in 7 days ending Dec 21: 88.6 per 100,000
> Avg. new daily cases in Pacific County in 7 days ending Dec 14: 26.1 per 100,000
> Avg. new daily cases in Washington in 7 days ending Dec 21: 43.6 per 100,000 — 7th lowest (total: 3,178)
> Cumulative confirmed COVID-19 cases in Pacific County as of Dec 21: 2,391.8 per 100,000 people (total: 509)
> Most populous place in Pacific County: Raymond
[recirclink id=825816]

West Virginia: Pleasants County
> Population: 7,507
> Change in daily avg. new COVID-19 cases, week over week: 84.8 per 100,000 people (total: 13)
> Avg. new daily cases in Pleasants County in 7 days ending Dec 21: 169.6 per 100,000
> Avg. new daily cases in Pleasants County in 7 days ending Dec 14: 84.8 per 100,000
> Avg. new daily cases in West Virginia in 7 days ending Dec 21: 69.3 per 100,000 — 21st highest (total: 1,267)
> Cumulative confirmed COVID-19 cases in Pleasants County as of Dec 21: 3,836.4 per 100,000 people (total: 288)
> Most populous place in Pleasants County: St. Marys

Wisconsin: Pepin County
> Population: 7,262
> Change in daily avg. new COVID-19 cases, week over week: 5.1 per 100,000 people (total: 7)
> Avg. new daily cases in Pepin County in 7 days ending Dec 21: 92.5 per 100,000
> Avg. new daily cases in Pepin County in 7 days ending Dec 14: 87.4 per 100,000
> Avg. new daily cases in Wisconsin in 7 days ending Dec 21: 53.8 per 100,000 — 15th lowest (total: 3,106)
> Cumulative confirmed COVID-19 cases in Pepin County as of Dec 21: 8,399.9 per 100,000 people (total: 610)
> Most populous place in Pepin County: Durand
[in-text-ad-2]

Wyoming: Washakie County
> Population: 8,129
> Change in daily avg. new COVID-19 cases, week over week: -171.7 per 100,000 people (total: 10)
> Avg. new daily cases in Washakie County in 7 days ending Dec 21: 123.5 per 100,000
> Avg. new daily cases in Washakie County in 7 days ending Dec 14: 295.2 per 100,000
> Avg. new daily cases in Wyoming in 7 days ending Dec 21: 60.3 per 100,000 — 22nd lowest (total: 351)
> Cumulative confirmed COVID-19 cases in Washakie County as of Dec 21: 8,771.1 per 100,000 people (total: 713)
> Most populous place in Washakie County: Worland
Contact [email protected] for any questions or corrections.