
Economic measures such as gross domestic product or gross national income are often used to rank the level of development in a country or state. Yet these measures do not reveal much about the well-being of the population.
According to the Human Development Index created by the United Nations, one way to assess the development of an area is to consider the well-being of its population. This index comprises three measures of well-being: education, standard of living, and life expectancy.
24/7 Wall St. created its own index using the HDI model in order to rank the best and worst states to live in. Our index consists of three measures: life expectancy at birth, bachelor’s degree attainment, and poverty rate. Poverty rates and bachelor’s degree attainment rates came from the U.S. Census Bureau’s 2019 American Community Survey. Life expectancy at birth is from the 2020 County Health Rankings & Roadmaps, a Robert Wood Johnson Foundation and the University of Wisconsin Population Health Institute joint program, and is based on data from the years 2016-2018.
After ranking all 50 states, geographic patterns begin to emerge — the states in the Northeastern part of the country tend to rank towards the top of the list, while nearly all of the worst states to live are in the South.
The three measures — education, life expectancy, and poverty rate — are all connected. Americans with higher educational attainment tend to live longer, healthier lives and have a smaller chance of living in poverty. More and more American adults are becoming college educated, though this growth has been uneven — some states have a bachelor’s degree attainment rate of more than 40%, while in others the rate is less than 25%. These are the most and least educated states.
Click here to see the best and worst states to live in.
Click here to read our methodology.

1. Massachusetts
> Population change; 2010-2019: +5.1% (23rd largest increase)
> 2019 unemployment: 2.9% (11th lowest)
> Poverty rate: 9.4% (8th lowest)
> Life expectancy at birth: 80.5 years (6th longest)
Based on educational attainment, life expectancy, and the relatively lack of widespread economic hardship, Massachusetts ranks as the best state to live in in the country. The best educated state in the country, Massachusetts has a bachelor’s degree attainment rate of 45.0% — well above the comparable rate of 33.1% nationwide.
Incomes typically rise with educational attainment, and in Massachusetts, most households earn over $85,000 a year — or about $20,000 more than what the annual income the typical U.S. household earns. Additionally, Massachusetts is one of only 11 states where fewer than one in every 10 residents live below the poverty line.
[in-text-ad]

2. Colorado
> Population change; 2010-2019: +14.1% (3rd largest increase)
> 2019 unemployment: 2.8% (9th lowest)
> Poverty rate: 9.3% (7th lowest)
> Life expectancy at birth: 80.5 years (7th longest)
Colorado is one of the fastest growing states in the country, with its population increasing by more than 700,000 people from 2010 to 2019, up to nearly 5.8 million. The state is among the healthiest and most economically prosperous in the country, ranking in the top 10 in many important socioeconomic categories.
Colorado’s median household income of $77,127 is the ninth highest of all states and over $11,000 higher than the overall U.S. median. The state also has the seventh lowest poverty rate, at 9.3% — 3 percentage points lower than the U.S. poverty rate. Colorado is one of 10 states with a life expectancy at birth of 80 years or more.
[recirclink id=804981]

3. New Jersey
> Population change; 2010-2019: +0.9% (5th smallest increase)
> 2019 unemployment: 3.6% (20th highest)
> Poverty rate: 9.2% (5th lowest)
> Life expectancy at birth: 80.4 years (8th longest)
Three of the top five best states to live in are in the Northeastern United States — and New Jersey is one of them. Like other high-ranking states on this list, New Jersey’s population is relatively healthy and financially secure. Life expectancy at birth in the state stands at about 80.4 years, over one year longer than the national average. Additionally, only 9.2% of Garden State residents live below the poverty line, over 3 percentage points below the 12.3% U.S. poverty rate.

4. Connecticut
> Population change; 2010-2019: -0.3% (3rd largest decrease)
> 2019 unemployment: 3.7% (18th highest)
> Poverty rate: 10.0% (12th lowest)
> Life expectancy at birth: 80.9 years (5th longest)
Connecticut ranks as the fourth best state to live in, largely because of its well-educated and relatively healthy population. Nearly 40% of state residents aged 25 and up have a bachelor’s degree, compared to only about one-third of Americans nationwide in the same age group. The state population is also one of the healthiest overall as life expectancy at birth among residents is 80.9 years, nearly two years longer than the national average.
States that rank highly on this list typically report stronger population growth than those on the other end of the spectrum. Connecticut is a notable exception, however, as it is one of only four states nationwide that is home to fewer people today than in 2010.
[in-text-ad-2]

5. Hawaii
> Population change; 2010-2019: +3.8% (22nd smallest increase)
> 2019 unemployment: 2.7% (6th lowest)
> Poverty rate: 9.3% (7th lowest)
> Life expectancy at birth: 82.3 years (the longest)
Based on average life expectancy at birth, Hawaii has the healthiest population of any state. Hawaiians born today are expected to live an average of 82.3 years. For context, life expectancy nationwide is just 79.1 years.
Hawaii’s economy, before the COVID-19 downturn, was also among the strongest in the country. Average unemployment in 2019 stood at just 2.7%, and with a thriving job market, only 9.3% of the state population lives below the poverty line. Nationwide, the annual unemployment rate stood at 3.7% in 2019, and 12.3% of the U.S. population lives on poverty-level income.

6. Minnesota
> Population change; 2010-2019: +6.2% (19th largest increase)
> 2019 unemployment: 3.2% (17th lowest)
> Poverty rate: 9.0% (4th lowest)
> Life expectancy at birth: 80.9 years (4th longest)
Based on educational attainment, life expectancy, and the poverty rate, Minnesota ranks as the best Midwestern state to live in, and the sixth best state nationwide. At 80.9 years, life expectancy at birth in the state is nearly two years longer than the national average. Additionally, Minnesota is one of fewer than a dozen states in which fewer than one in every 10 residents live below the poverty line. Adults in Minnesota are also far more likely than the typical American adult to have a four-year college education.
Well-educated, financially secure areas are less likely than average to report high crime rates — and Minnesota is a relatively safe state. There were 236 violent crimes reported for every 100,000 state residents in 2019. For reference, the national violent crime rate was 367 incidents per 100,000 people that year.
[in-text-ad]

7. New Hampshire
> Population change; 2010-2019: +3.3% (18th smallest increase)
> 2019 unemployment: 2.5% (3rd lowest)
> Poverty rate: 7.3% (the lowest)
> Life expectancy at birth: 79.5 years (18th longest)
New Hampshire is one of three New England states to rank among the top 10 best states to live. This is largely due to the fact that just 7.3% of state residents live in poverty, the lowest share of any state and 5 percentage points below the U.S. poverty rate. The typical household in the state has an annual income of nearly $78,000, over $12,000 higher than the U.S. median household income.
Poverty rate and income levels are closely tied to educational attainment, and New Hampshire residents are among the most educated in the nation. The state ranks in the top 10 in both high school and college attainment rates, as 93.3% of New Hampshire adults 25 and older have a high school diploma and 37.6% have at least a bachelor’s degree.
[recirclink id=804955]

8. Maryland
> Population change; 2010-2019: +4.5% (23rd smallest increase)
> 2019 unemployment: 3.6% (20th highest)
> Poverty rate: 9.0% (4th lowest)
> Life expectancy at birth: 79.1 years (24th longest)
In Maryland, residents are far more likely to have high incomes and far less likely to live in poverty than the average American nationwide. The typical household in Maryland earns $86,738 a year, about $21,000 more than the typical U.S. household and more than the median income in every other state. Additionally, only 9.0% of the Maryland population lives below the poverty line, compared to 12.3% of Americans nationwide.
Incomes in the United States tend to rise with educational attainment. In Maryland, 40.9% of the 25 and older population have a bachelor’s degree, compared to 33.1% of the population in the same age group nationwide.

9. Washington
> Population change; 2010-2019: +12.9% (9th largest increase)
> 2019 unemployment: 4.3% (8th highest)
> Poverty rate: 9.8% (9th lowest)
> Life expectancy at birth: 80.4 years (9th longest)
Washington, along with Hawaii and Colorado, is one of three Western states to rank among the 10 best states to live. The state’s life expectancy at birth of 80.4 years is more than a full year longer than the U.S. life expectancy at birth of 79.1 years.
From 2010 to 2019, the U.S. population grew by 6.1%. During that same time, the population of Washington grew more than twice as fast, increasing from 6.7 million to 7.6 million, or a 12.9% growth.
[in-text-ad-2]

10. Virginia
> Population change; 2010-2019: +6.4% (18th largest increase)
> 2019 unemployment: 2.8% (9th lowest)
> Poverty rate: 9.9% (11th lowest)
> Life expectancy at birth: 79.5 years (19th longest)
Virginia reports some of the best economic conditions of any state, making it one of the best places to live in the country. The typical Virginia household has an annual income of nearly $76,500, well above the U.S. median household income of $65,712. The state’s 2019 unemployment rate of 2.8% was one of the lowest in the country and well below the nation’s 3.7% unemployment rate that year. Virginia is one of 11 states in which fewer than 10% of residents live below the poverty line.
However, goods and services are typically more expensive in Virginia than they are nationwide by about 2.0%.

11. Vermont
> Population change; 2010-2019: -0.3% (4th largest decrease)
> 2019 unemployment: 2.4% (2nd lowest)
> Poverty rate: 10.2% (15th lowest)
> Life expectancy at birth: 79.7 years (16th longest)
Vermont reported the second lowest 2019 unemployment rate, at just 2.4%. Unemployment is closely tied to educational attainment, and the state has one of the country’s highest educational attainment rates. In Vermont, 38.7% of adults 25 and older have at least a bachelor’s degree, the seventh largest share in the country.
State residents tend to be fairly healthy, with a life expectancy at birth of 79.7 years. Just 4.5% of Vermonters lack health insurance, compared to 9.2% of Americans overall. Though Vermont is one of the best states to live, its population is in decline. It is one of just four states in which the population decreased from 2010 to 2019.
[in-text-ad]

12. Utah
> Population change; 2010-2019: +15.5% (largest increase)
> 2019 unemployment: 2.6% (4th lowest)
> Poverty rate: 8.9% (2nd lowest)
> Life expectancy at birth: 79.9 years (14th longest)
Thanks in part to a strong job market, Utah has one of the lowest poverty rates of any state in the country. Just 8.9% of state residents live on poverty level incomes, a smaller share than in every state other than New Hampshire.
Several of the states that rank well on this list are growing rapidly, but none as fast as Utah. Since 2010, the number of people living in the state climbed by a nation-leading 15.5%. Over the same period, the U.S. population expanded by 6.1%
[recirclink id=802426]

13. California
> Population change; 2010-2019: +5.8% (20th largest increase)
> 2019 unemployment: 4% (12th highest)
> Poverty rate: 11.8% (25th highest)
> Life expectancy at birth: 81.6 years (2nd longest)
California is home to one of the healthiest populations in the United States. Average life expectancy at birth in the state is 81.6 years — longer than in every state except Hawaii and more than two years longer than the national average.
College-educated Americans are more likely to make healthier lifestyle choices than those without a postsecondary education, and partially as a result, they tend to live longer and healthier lives. In California, 35.0% of adults have a bachelor’s degree or higher, compared to the national bachelor’s degree attainment rate of 33.1%.

14. New York
> Population change; 2010-2019: +0.3% (2nd smallest increase)
> 2019 unemployment: 4% (12th highest)
> Poverty rate: 13.0% (16th highest)
> Life expectancy at birth: 81.3 years (3rd longest)
New Yorkers have among the best health outcomes of residents of any state, with America’s third highest life expectancy at birth of 81.3 years. The state has the seventh lowest uninsured rate in the country, as 5.2% of residents lack health insurance.
Though New York has a relatively high median annual household income, at over $72,000. Still, there is a relatively wide disparity in the state between the wealthy and those living in poverty. Of all households in New York, 12.1% earn at least $200,000 per year — the sixth largest share among states. At the same time, 6.7% of state households earn less than $10,000, 10th largest share of all states. Also, the state’s poverty rate of 13.0% is higher than the nationwide rate of 12.3%.
[in-text-ad-2]

15. Rhode Island
> Population change; 2010-2019: +0.6% (3rd smallest increase)
> 2019 unemployment: 3.6% (20th highest)
> Poverty rate: 10.8% (18th lowest)
> Life expectancy at birth: 79.9 years (11th longest)
In Rhode Island, the typical household earns over $71,000 annually, compared to $65,712 the typical American household earns. The additional income dollars also go further, as goods and services typically cost a bit less in Rhode Island than they do in the U.S. overall. The state has a relatively low poverty rate, at 10.8%, yet 14.5% of residents rely on food stamps — the third highest share of any state.
Only 10 states have a longer life expectancy at birth than Rhode Island’s average life expectancy of 79.9 years. The state also has the second lowest uninsured rate, with 4.1% of residents lacking health insurance.

16. Nebraska
> Population change; 2010-2019: +5.7% (21st largest increase)
> 2019 unemployment: 3% (14th lowest)
> Poverty rate: 9.9% (11th lowest)
> Life expectancy at birth: 79.6 years (17th longest)
With a median annual household income of $63,229 — about $2,500 below the national median — Nebraska is not a particularly wealthy state. Still, serious financial hardship is not especially common as the state is one of only 11 where fewer than one in every 10 residents live below the poverty line.
People living below the poverty line are restricted in their access to health care and their ability to afford a range of healthy lifestyle options in addition to the stress associated with poverty. As a result, those living below the poverty line are less likely to live long and healthy lives. With a lower than average poverty rate, Nebraska’s average life expectancy at birth of 79.6 years is about half a year longer than the national average.
[in-text-ad]

17. Oregon
> Population change; 2010-2019: +9.9% (11th largest increase)
> 2019 unemployment: 3.7% (18th highest)
> Poverty rate: 11.4% (24th lowest)
> Life expectancy at birth: 79.8 years (15th longest)
Oregon ranks higher than most states as a desirable place to live because of its higher than average life expectancy at birth. At 79.8 years, average life expectancy in Oregon is higher than in all but 14 states and the 79.1 year national average.
Oregon also has a better educated population than most of the rest of the nation. Of state residents 25 and older, 34.5% have a bachelor’s degree or higher, a larger share than in all but 15 other states and the 33.1% national average.
[recirclink id=801221]

18. Illinois
> Population change; 2010-2019: -1.3% (2nd largest decrease)
> 2019 unemployment: 4% (12th highest)
> Poverty rate: 11.5% (25th lowest)
> Life expectancy at birth: 79.3 years (23rd longest)
Illinois has a bachelor’s degree attainment rate of 35.8% — making it one of the better educated states in the country. Better-educated adults are less likely to face financial insecurity and hardship than those with lower educational attainment, and in Illinois, 11.5% of the population lives below the poverty line, a smaller share than the 12.3% national poverty rate.
Despite outranking most states on this list, Illinois is not drawing in new residents and families. The state is one of only four nationwide to be home to fewer people today than in 2010.

19. North Dakota
> Population change; 2010-2019: +13.0% (8th largest increase)
> 2019 unemployment: 2.4% (2nd lowest)
> Poverty rate: 10.6% (17th lowest)
> Life expectancy at birth: 79.9 years (13th longest)
North Dakota is home to a smaller than average share of college-educated adults. Just 30.4% of state residents 25 and older have a bachelor’s degree, compared to 33.1% of all U.S. adults. Still, the state ranks as a better place to live than most states due to its low poverty rate and high average life expectancy.
Only 10.6% of North Dakota residents live below the poverty line, and the average person born in the state lives about 80 years. Nationwide, the poverty rate stands at 12.3%, and average life expectancy at birth is about 79 years.
[in-text-ad-2]

20. Wisconsin
> Population change; 2010-2019: +2.3% (12th smallest increase)
> 2019 unemployment: 3.3% (22nd lowest)
> Poverty rate: 10.4% (16th lowest)
> Life expectancy at birth: 79.4 years (20th longest)
In Wisconsin, the typical household earns about $64,000 a year, nearly $1,500 less than what the typical U.S. household earns. Despite slightly lower than average incomes, Wisconsin residents are less likely to face serious financial hardship than the typical American. An estimated 10.4% of the state population lives on poverty-level incomes, compared to 12.3% of the U.S. population.
Other measures, such as life expectancy at birth, we used to rank the best places to live are more closely in line with the national average in Wisconsin. Average household life expectancy is 79.4 years in the state, only slightly higher than the 79.1 year national average.

21. Maine
> Population change; 2010-2019: +1.3% (7th smallest increase)
> 2019 unemployment: 3% (14th lowest)
> Poverty rate: 10.9% (19th lowest)
> Life expectancy at birth: 78.7 years (21st shortest)
Maine is the only state in New England where the average life expectancy is below the national average. Life expectancy at birth in the state is 78.7 years — compared to 79.1 years nationwide and over 80 years in nearby Connecticut and Massachusetts.
In other important socioeconomic measures, however, Maine performs better than the nation. For example, Maine’s poverty rate of 10.9% is well below the 12.3% national average.
[in-text-ad]

22. Kansas
> Population change; 2010-2019: +1.9% (10th smallest increase)
> 2019 unemployment: 3.2% (17th lowest)
> Poverty rate: 11.4% (24th lowest)
> Life expectancy at birth: 78.5 years (20th shortest)
Life expectancy at birth in Kansas is 78.5 years — about half a year below the national average.
In other measures, however, Kansas does slightly better than the U.S. as a whole. For example, 34% of adults in the state have a bachelor’s degree or higher, compared to 33.1% of adults nationwide. Additionally, the poverty rate of 11.4% in Kansas is slightly lower than the 12.3% U.S. poverty rate.
[recirclink id=804981]
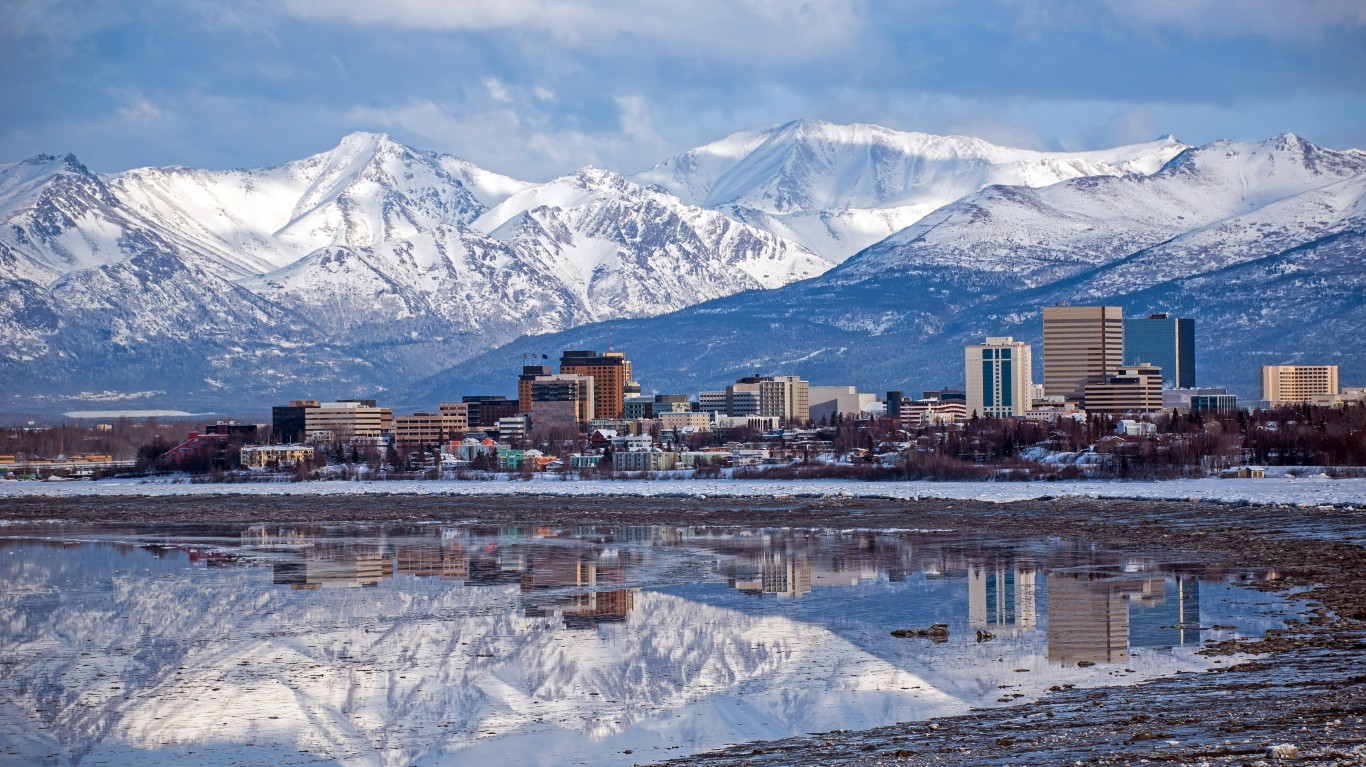
23. Alaska
> Population change; 2010-2019: +2.5% (14th smallest increase)
> 2019 unemployment: 6.1% (the highest)
> Poverty rate: 10.1% (14th lowest)
> Life expectancy at birth: 78.8 years (22nd shortest)
Before the COVID-19 pandemic and the resulting economic downturn, Alaska had the worst job market of any state. An average of 6.1% of the state’s labor force were unemployed in 2019, well above the comparable 3.7% national jobless rate. Still, despite a weak job market, Alaskans tend to be relatively financially secure. The typical household in the state earns $75,463 a year, nearly $10,000 more than the typical U.S. household. Also, about 10.1% of state residents live below the poverty line, compared to 12.3% of all Americans.

24. Wyoming
> Population change; 2010-2019: +2.5% (16th smallest increase)
> 2019 unemployment: 3.6% (20th highest)
> Poverty rate: 10.1% (14th lowest)
> Life expectancy at birth: 79.0 years (24th shortest)
Based on an index comprising educational attainment, life expectancy, and poverty, Wyoming ranks near the middle of all states. Much like the U.S. as a whole, life expectancy at birth in Wyoming is about 79 years.
Wyoming residents, however, are less likely to live below the poverty line than the typical American, as the state’s 10.1% poverty rate is lower than the comparable 12.3% rate.
[in-text-ad-2]

25. Delaware
> Population change; 2010-2019: +8.2% (15th largest increase)
> 2019 unemployment: 3.8% (17th highest)
> Poverty rate: 11.3% (22nd lowest)
> Life expectancy at birth: 78.4 years (18th shortest)
By several key socioeconomic measures, Delaware closely resembles the U.S. as a whole. For example, life expectancy at birth in the state is 78.4 years — only slightly below the comparable 79.1 year national average. The state’s 11.3% poverty rate is also only slightly lower than the 12.3% U.S. rate. Adults in Delaware are nearly equally likely to have a bachelor’s degree as the typical American, as 33.2% of state adult residents have a four-year degree, compared with 33.1% of the U.S. population in the same age group.

26. Florida
> Population change; 2010-2019: +14.0% (4th largest increase)
> 2019 unemployment: 3.1% (15th lowest)
> Poverty rate: 12.7% (19th highest)
> Life expectancy at birth: 80.0 years (10th longest)
Florida is one of only 10 states nationwide with an average life expectancy at birth of 80 years or higher. Nationwide, the average life expectancy is 79.1 years at birth.
In other important measures, however, Florida trails the rest of the country. For example, 12.7% of residents of the state live below the poverty line, compared to 12.3% of Americans nationwide. Additionally, only 30.7% of Floridians age 25 and up have a bachelor’s degree, compared to 33.1% of Americans in the same age group.
[in-text-ad]

27. Iowa
> Population change; 2010-2019: +3.4% (20th smallest increase)
> 2019 unemployment: 2.7% (6th lowest)
> Poverty rate: 11.2% (21st lowest)
> Life expectancy at birth: 79.4 years (21st longest)
In Iowa, average life expectancy at birth is 79.4 years, closely in line with the overall national average. Iowa residents are also somewhat less likely than the typical American to face serious financial hardship, as the poverty rate in the state stands at 11.2%, compared to the 12.3% national rate.
One important area in which Iowa lags behind the country as a whole, however, is in educational attainment. Just 29.3% of the 25 and older population in the state have a bachelor’s degree or higher, compared to nearly one-third of adults nationwide.
[recirclink id=804955]

28. Montana
> Population change; 2010-2019: +7.9% (16th largest increase)
> 2019 unemployment: 3.5% (24th highest)
> Poverty rate: 12.6% (20th highest)
> Life expectancy at birth: 78.8 years (23rd shortest)
The median annual household income in Montana is roughly $8,500 lower than the U.S. median of $65,712. However, goods and services tend to be less expensive in the state than they are on average nationwide. Montana’s poverty rate of 12.6% is slightly higher than the nationwide 12.3% rate.
Montana has the second highest share of adults 25 and older with a high school diploma, at 94.2%, well above the national 88.6% rate. Yet 33.6% of adult residents have a college degree, just slightly higher than the national 33.1% college degree attainment rate.

29. Idaho
> Population change; 2010-2019: +13.7% (6th largest increase)
> 2019 unemployment: 2.9% (11th lowest)
> Poverty rate: 11.2% (21st lowest)
> Life expectancy at birth: 79.3 years (22nd longest)
Idaho is growing more than twice as fast as the typical state, with its population increasing by 13.7% from 2010 to 2019. The state’s median annual household income is just under $61,000 — $4,000 lower than the U.S. median, its poverty rate is 11.2% — 1.1 percentage points lower than the national poverty rate. In 2019, Idaho’s unemployment rate was lower than all but 10 other states, as 2.9% of the labor force was looking for work.
Idaho also ranks as one of the 10 safest states in the nation, with a violent crime rate of 224 incidents per 100,000 residents. The U.S. violent crime rate is 367 incidents per 100,000.
[in-text-ad-2]

30. Arizona
> Population change; 2010-2019: +13.5% (7th largest increase)
> 2019 unemployment: 4.7% (6th highest)
> Poverty rate: 13.5% (13th highest)
> Life expectancy at birth: 79.9 years (12th longest)
Arizona is one of the fastest growing states in the country, yet it lags behind much of the country in a number of key economic indicators. The typical household in the state earns $62,055, or about $3,700 less than the nationwide median.
Arizona’s poverty rate of 13.5% is higher than the national rate and higher than all but a dozen other states. The state had the sixth highest unemployment rate in 2019, at 4.7%.

31. Pennsylvania
> Population change; 2010-2019: +0.7% (4th smallest increase)
> 2019 unemployment: 4.4% (7th highest)
> Poverty rate: 12.0% (22nd highest)
> Life expectancy at birth: 78.3 years (17th shortest)
Though Pennsylvania’s median household income is about $2,300 lower than the U.S. median of $65,712, the state’s poverty rate of 12.0% is lower than most states and just under the 12.3% national rate. Goods and services tend to be 2.5% cheaper in Pennsylvania than they are on average nationwide.
However, the state struggles in several economic measures. An estimated 13.5% of residents rely on food stamps, the sixth highest share among states, and the 2019 unemployment rate of 4.4% ranked seventh highest that year. Also, Pennsylvania’s life expectancy at birth of 78.3 years is nearly a full year shorter than the average nationwide.
[in-text-ad]

32. South Dakota
> Population change; 2010-2019: +8.4% (14th largest increase)
> 2019 unemployment: 3.3% (22nd lowest)
> Poverty rate: 11.9% (23rd highest)
> Life expectancy at birth: 79.1 years (25th shortest)
By some key socioeconomic measures, South Dakota is in-line with, or better than, the U.S. as a whole. For example, the state’s 11.9% poverty rate is slightly lower than the 12.3% national rate. Additionally, life expectancy at birth in the state is 79.1 years — the same as it is across the United States.
One area in which South Dakota lags, however, is in educational attainment. Only 29.7% of state residents aged 25 and older have a bachelor’s degree or higher, compared to 33.1% of U.S. adults.
[recirclink id=802426]

33. Texas
> Population change; 2010-2019: +14.8% (2nd largest increase)
> 2019 unemployment: 3.5% (24th highest)
> Poverty rate: 13.6% (11th highest)
> Life expectancy at birth: 79.1 years (25th longest)
Texans are more likely than residents in most other states to face serious financial hardship. An estimated 13.6% of the state population lives below the poverty line, a larger share than the 12.3% national poverty rate.
Incomes tend to go up with educational attainment, and in Texas, adults are less likely to have a four-year college degree than adults in much of the rest of the country. Just 30.8% of the 25 and older residents in the state have a bachelor’s degree, compared to 33.1% of adults nationwide.

34. North Carolina
> Population change; 2010-2019: +9.7% (12th largest increase)
> 2019 unemployment: 3.9% (15th highest)
> Poverty rate: 13.6% (11th highest)
> Life expectancy at birth: 78.0 years (15th shortest)
North Carolina’s median household income is $57,341 annually, over $8,000 less than the U.S. median. However, goods and services are more than 8% cheaper in the state than what they cost on average nationwide.
Income is closely tied with education, and North Carolina lags behind much of the rest of the country in educational attainment. Though the state’s high school attainment rate of 88.6% is the same as the national rate, it ranks just 33rd among states. North Carolina also has a 32.3% bachelor’s degree attainment rate for adults 25 and over, compared to the national rate of 33.1%.
[in-text-ad-2]

35. Georgia
> Population change; 2010-2019: +9.3% (13th largest increase)
> 2019 unemployment: 3.4% (24th lowest)
> Poverty rate: 13.3% (14th highest)
> Life expectancy at birth: 77.8 years (13th shortest)
Georgia’s population has one of the lower life expectancies at birth among states. On average, Americans born in Georgia live 77.8 years, over a year below the average life expectancy at birth nationwide of 79.1 years.
Georgians are also more likely than the typical American to struggle economically. An estimated 13.3% of the state population live below the line, compared to 12.3% of the U.S. population.

36. Michigan
> Population change; 2010-2019: +1.1% (6th smallest increase)
> 2019 unemployment: 4.1% (10th highest)
> Poverty rate: 13.0% (16th highest)
> Life expectancy at birth: 78.0 years (14th shortest)
Incomes in Michigan are relatively low. The typical household in the state earns $59,584 a year, over $6,000 below the national median household income. Michigan residents are also more likely than most Americans to face serious financial hardship, as 13.0% of the population lives below the poverty line, compared to 12.3% of the U.S. population.
Michigan residents are also less likely to live long, healthy lives than the typical American. Average life expectancy at birth in the state is 78 years — about one-year below the comparable national average.
[in-text-ad]

37. Nevada
> Population change; 2010-2019: +13.9% (5th largest increase)
> 2019 unemployment: 3.9% (15th highest)
> Poverty rate: 12.5% (21st highest)
> Life expectancy at birth: 78.5 years (19th shortest)
Nevada ranks sixth from the bottom in both high school and bachelor’s degree attainment rates. Of Nevada adults 25 and older, 86.9% have at least a high school diploma, and 25.7% hold at least a bachelor’s degree. The state’s life expectancy at birth is 78.5 years, compared to the 79.1 year expectancy nationwide.
Nevada’s median household income of $63,276 is roughly $2,500 lower than the national median. It also has a slightly higher poverty rate, at 12.5%, than the national poverty rate.
[recirclink id=801221]

38. Missouri
> Population change; 2010-2019: +2.4% (13th smallest increase)
> 2019 unemployment: 3.3% (22nd lowest)
> Poverty rate: 12.9% (18th highest)
> Life expectancy at birth: 77.3 years (12th shortest)
Missouri is one of the least expensive states to live in. Goods and services in the state are about 11% less expensive than they are nationwide. Still, many in the state are likely struggling financially, as 12.9% of the population lives below the poverty line, and 6.3% of households earn less than $10,000 annually. Nationwide, the poverty rate stands at 12.3%, and 5.8% of households earn less than $10,000 annually.
Higher-income individuals often have greater access to health care and can afford a greater range of healthy options related to diet and lifestyle, and partially as a result, are more likely to live longer, healthier lives. The low incomes and more pervasive financial hardship in Missouri may explain, in part, why average life expectancy at birth in the state, at 77.3 years, is nearly two years shy of the national average.

39. Indiana
> Population change; 2010-2019: +3.7% (21st smallest increase)
> 2019 unemployment: 3.3% (22nd lowest)
> Poverty rate: 11.9% (23rd highest)
> Life expectancy at birth: 77.0 years (11th shortest)
Of the dozen worst-ranking states on this list, Indiana is the only one with a lower than average poverty rate. Just 11.9% of Indiana residents live below the poverty line, compared to 12.3% of Americans nationwide.
In other important measures, however, Indiana lags behind much of the rest of the nation. For example, average life expectancy at birth in the state is just 77 years, lower than in all but 10 other states and about two years shy of the comparable national average.
[in-text-ad-2]
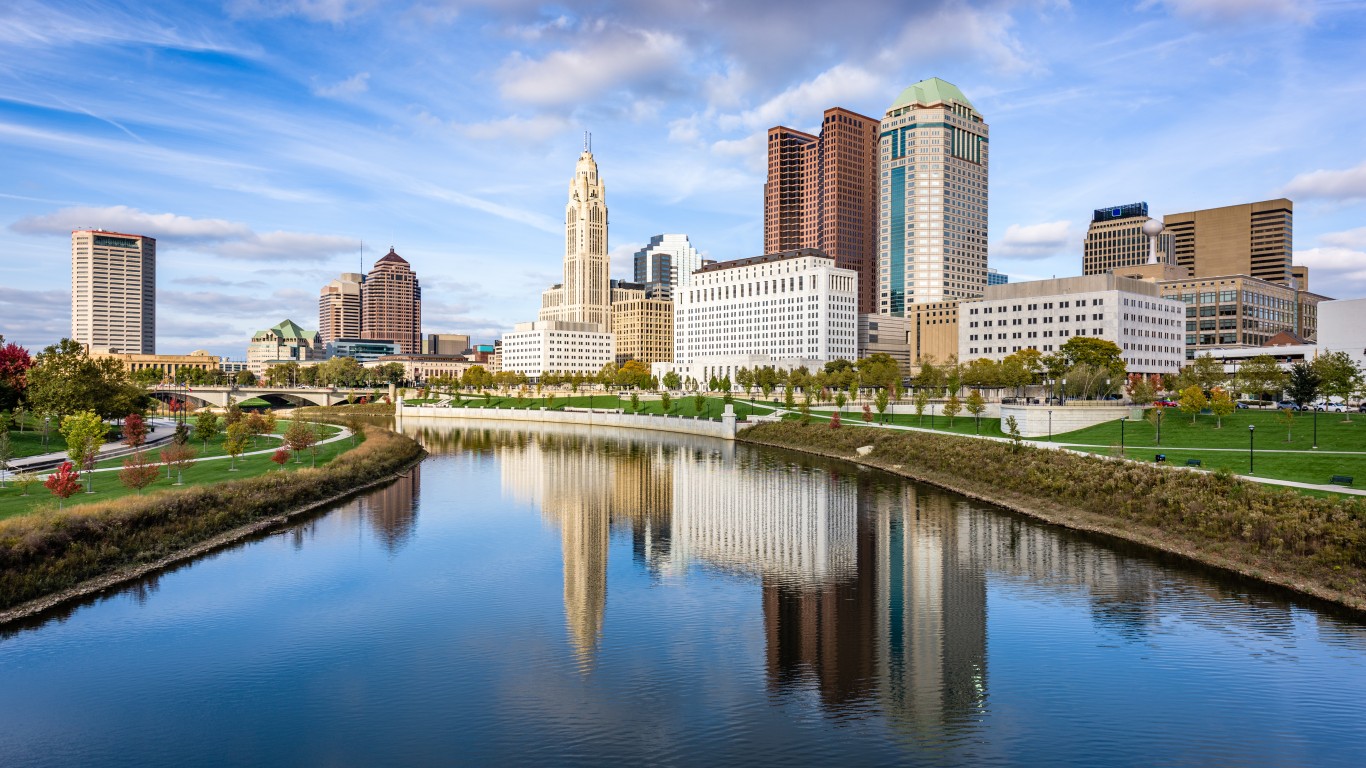
40. Ohio
> Population change; 2010-2019: +1.3% (8th smallest increase)
> 2019 unemployment: 4.1% (10th highest)
> Poverty rate: 13.1% (15th highest)
> Life expectancy at birth: 76.9 years (9th shortest)
Before the COVID-19 recession, Ohio’s economy was lagging behind most other state economies. An average of 4.1% of the labor force in the state was unemployed in 2019, and 13.1% of the population lived below the poverty line — compared to the national 3.7% unemployment rate and 12.3% poverty rate that year.
Ohio also trails the U.S. as a whole in a key measure of public health. The state is one of only nine where life expectancy at birth is below 77 years. Nationwide, life expectancy at birth is just over 79 years.

41. South Carolina
> Population change; 2010-2019: +11.1% (10th largest increase)
> 2019 unemployment: 2.8% (9th lowest)
> Poverty rate: 13.8% (10th highest)
> Life expectancy at birth: 77.0 years (10th shortest)
Despite a relatively low pre-COVID-19 recession unemployment rate of 2.8% in 2019, Americans living in South Carolina are more likely than most to struggle financially. An estimated 7.2% of households in the state earn less than $10,000 a year, and 13.8% of the population lives below the poverty line — compared to 5.8% of all American households and a 12.3% U.S. poverty rate.
Incomes tend to rise with educational attainment, and a relatively small share of adults in South Carolina have a four-year, post-secondary education. Just 29.6% of the 25 and older population has a bachelor’s degree, compared to 33.1% of Americans nationwide in the same age group.
[in-text-ad]

42. Tennessee
> Population change; 2010-2019: +7.4% (17th largest increase)
> 2019 unemployment: 3.4% (24th lowest)
> Poverty rate: 13.9% (9th highest)
> Life expectancy at birth: 76.0 years (7th shortest)
Based on life expectancy, Tennessee has one of the least healthy populations of any state. Average life expectancy at birth in the state is just 76 years — lower than in all but six other states and about three years below average life expectancy at birth in the U.S.
Tennessee is also one of the least educated states in the country. It is one of only a dozen states in which fewer than 29% of the 25 and older population have a bachelor’s degree or higher. For context, 33.1% of adults nationwide have a four-year college degree.
[recirclink id=804981]

43. New Mexico
> Population change; 2010-2019: +1.5% (9th smallest increase)
> 2019 unemployment: 4.9% (3rd highest)
> Poverty rate: 18.2% (3rd highest)
> Life expectancy at birth: 78.1 years (16th shortest)
New Mexico has one of the poorest populations of any state in the country. An estimated 18.2% of the population lives below the poverty line, and 8.3% of all households in the state earn less than $10,000 a year. The widespread financial insecurity is likely due in part to a weak job market. In 2019, before the COVID-19 recession, 4.9% of the labor force in New Mexico was out of work, the third highest unemployment rate of any state that year.
College-educated adults are less likely to face serious financial hardship than those with lower levels of education, and in New Mexico, just 27.7% of adults have a bachelor’s degree, well below the comparable share of 33.1% of adults nationwide.

44. Oklahoma
> Population change; 2010-2019: +5.2% (22nd largest increase)
> 2019 unemployment: 3.3% (22nd lowest)
> Poverty rate: 15.2% (8th highest)
> Life expectancy at birth: 76.0 years (6th shortest)
Oklahoma residents are far more likely to struggle financially than the typical American. An estimated 15.2% of the population lives below the poverty line, and 6.9% of households in the state earn less than $10,000 a year — compared to a 12.3% U.S. poverty rate and 5.8% of all American households earning less than $10,000 a year.
Higher-income individuals often have greater access to health care and can afford a greater range of healthy options related to diet and lifestyle, and partially as a result, are more likely to live longer, healthier lives. The low incomes and more pervasive financial hardship in Oklahoma may explain, in part, why average life expectancy at birth in the state, at 76 years, is over three years shy of the national average.
[in-text-ad-2]

45. Alabama
> Population change; 2010-2019: +2.5% (15th smallest increase)
> 2019 unemployment: 3% (14th lowest)
> Poverty rate: 15.5% (7th highest)
> Life expectancy at birth: 75.4 years (3rd shortest)
Alabama ranks as one of the worst states to live in in large part because of the high poverty rate in the state, which at 15.5% is seventh highest in the nation. Alabama also has the fifth highest share in the nation of households earning less than $10,000, at 8.1%. Its median household income is also $14,000 lower than the national median. However, goods and services are more than 13% cheaper in Alabama than they are on average nationwide.
The state’s 75.4 year life expectancy at birth is lower than all but two other states.

46. Kentucky
> Population change; 2010-2019: +2.8% (17th smallest increase)
> 2019 unemployment: 4.3% (8th highest)
> Poverty rate: 16.3% (4th highest)
> Life expectancy at birth: 75.4 years (4th shortest)
The poverty rate in Kentucky is 16.3% — 4 full percentage points higher than the national poverty rate. Those without a college degree are more likely to live below the poverty line, and Kentucky has the fifth lowest bachelor’s degree attainment rate in the nation, at 25.1%. The high school attainment rate is also relatively low in the state, at 87.2%. Those without college degrees are also less likely to be employed, and the state’s 2019 unemployment rate of 4.3% was the eighth highest in the country.
Kentuckians have the fourth shortest life expectancy at birth of any state, at just 75.4 years.
[in-text-ad]

47. Arkansas
> Population change; 2010-2019: +3.3% (19th smallest increase)
> 2019 unemployment: 3.5% (24th highest)
> Poverty rate: 16.2% (5th highest)
> Life expectancy at birth: 75.9 years (5th shortest)
Arkansas is one of just three states in which less than a quarter of adults 25 and older hold at least a bachelor’s degree, at 23.3%. Incomes are in large part tied to educational attainment, and Arkansas has the third lowest median household income of any state, at just under $49,000. Somewhat offsetting the low incomes in the state is the low cost of living. Goods and services are 14.7% less expensive than the nationwide average, giving it the lowest cost of living of any state.
Arkansas has one of the five lowest life expectancies in the country, at 75.9 years. The national average life expectancy at birth is 79.1 years.
[recirclink id=804955]

48. Louisiana
> Population change; 2010-2019: +2.3% (11th smallest increase)
> 2019 unemployment: 4.8% (5th highest)
> Poverty rate: 19.0% (2nd highest)
> Life expectancy at birth: 76.1 years (8th shortest)
Nationwide, 12.3% of Americans live in poverty. Yet in Louisiana, 19.0% of residents live below the poverty line, the second highest share of all states. Louisiana is the only state in which more than 10% of households earn less than $10,000 annually. The state’s median household income of about $51,000 is nearly $15,000 lower than the national median.
Incomes are closely tied to educational attainment, and just 25% of Louisiana residents 25 and older hold a bachelor’s degree, compared to nearly a third of Americans in that age group. Louisiana’s life expectancy at birth is 76.1 years, three years lower than the nationwide expectancy.

49. West Virginia
> Population change; 2010-2019: -3.3% (largest decrease)
> 2019 unemployment: 4.9% (3rd highest)
> Poverty rate: 16.0% (6th highest)
> Life expectancy at birth: 74.8 years (the shortest)
West Virginia has the lowest life expectancy at birth of any state in the country, at 74.8 years, more than four years shorter than the national average life expectancy. West Virginia also has the lowest educational attainment rate of any state, as just 21.1% of residents 25 and older hold at least a bachelor’s degree.
Even as the U.S. population overall increased by 6.1% from 2010 to 2019, West Virginia’s population during that time. The 3.3% population decline was by far the largest of any state, accounting for over 60,000 people.
[in-text-ad-2]

50. Mississippi
> Population change; 2010-2019: +0.2% (smallest increase)
> 2019 unemployment: 5.4% (2nd highest)
> Poverty rate: 19.6% (the highest)
> Life expectancy at birth: 74.9 years (2nd shortest)
Because of Mississippi’s comparatively poor socioeconomic and health conditions, the state ranks as the worst to live. No state has a higher share of residents living in poverty than Mississippi, at 19.6%. It also has the lowest median household income of any state by thousands of dollars, as the typical household earns less than $46,000 annually. Nationwide, the typical household earns $65,712 annually.
Health and economic status are closely linked, and Mississippians have some of the worst health outcomes in the country. The life expectancy at birth in the state is 74.9 years — lower than all states but West Virginia. The American life expectancy at birth is 79.1 years. Mississippi is also one of just three states in which fewer than one-quarter of its adult residents 25 and older hold at least a bachelor’s degree.
Methodology
To identify the best and worst states to live in, 24/7 Wall St. constructed an index comprising three socioeconomic measures for each state: poverty rate, the percentage of adults (25 and older) who have at least a bachelor’s degree, and life expectancy at birth. The selection of these three measures was modeled on the United Nations’ Human Development Index.
Poverty rates and bachelor’s degree attainment rates came from the U.S. Census Bureau’s 2019 American Community Survey. Life expectancy at birth is from the 2020 County Health Rankings & Roadmaps, a Robert Wood Johnson Foundation and the University of Wisconsin Population Health Institute joint program, and is based on data from the years 2016-2018.
Additional data was also reviewed. Unemployment rates are from the Bureau of Labor Statistics and are annual for 2019. Crime data came from the FBI’s 2019 Uniform Crime Report. Uninsured rates, median household incomes, high school diploma attainment rates, and median home values also came from the ACS. Other data on health behaviors and outcomes came from County Health Rankings & Roadmaps.
Contact [email protected] for any questions or corrections.