
Total overall student debt in the United States reached $1.6 trillion in June 2019, six times higher than in 2004. While students are having a hard time paying for college, getting a degree can still be a worthwhile investment, depending a great deal on where one goes to school.
Some colleges are better known for their graduates’ high earning potential and low debt — attendees at these schools tend to earn relatively high incomes 10 years after enrollment without taking on an inordinate amount of debt. Acceptance to these schools has become highly sought after and typically only a small share of applicants are accepted. This exclusivity further cements their reputation as one of the top colleges in the country.
To determine the best colleges in America, 24/7 Wall St. created an index of three measures — acceptance rate, average earnings of past students 10 years after enrollment, and median debt at graduation.
While a degree from one of the universities on this list is likely to bring better job opportunities to graduates, choice of major also significantly affects employment and earning potential. Students who study in technological and scientific fields, are much less likely to be unemployed and much more likely to have relatively higher incomes. Graduates with degrees in other fields such as education and communications are more likely to be unemployed and likely to earn relatively lower incomes. These are the college majors that will pay off the least.
Like virtually every other part of life, the U.S. college system now looks very differently than it did last year as a result of the COVID-19 pandemic. Many colleges opted to offer only online instruction for the fall 2020 semester. Others decided to offer in-person classes in spite of the outbreak, only to report hundreds and even thousands of coronavirus cases among staff and students shortly after reopening the school. These are the colleges that reported spikes in COVID-19 cases after reopening.
Click here to see the 20 best colleges in America
Click here to read our methodology

20. Vanderbilt University
> Admission rate for 2018-2019: 9.6% (applicants: 34,313, accepted: 3,298)
> Avg. annual earnings of students 10 years after enrollment: $86,200
> Median debt at graduation: $15,000
> Annual net cost of attendance: $25,855
> Avg. SAT score: 1514 out of 1600
> Location: Nashville, TN
[in-text-ad]

19. Amherst College
> Admission rate for 2018-2019: 12.8% (applicants: 9,723, accepted: 1,246)
> Avg. annual earnings of students 10 years after enrollment: $83,300
> Median debt at graduation: $12,896
> Annual net cost of attendance: $16,339
> Avg. SAT score: 1449 out of 1600
> Location: Amherst, MA
[recirclink id=732226]

18. Columbia University in the City of New York
> Admission rate for 2018-2019: 5.9% (applicants: 40,572, accepted: 2,399)
> Avg. annual earnings of students 10 years after enrollment: $115,600
> Median debt at graduation: $21,979
> Annual net cost of attendance: $21,828
> Avg. SAT score: 1512 out of 1600
> Location: New York, NY
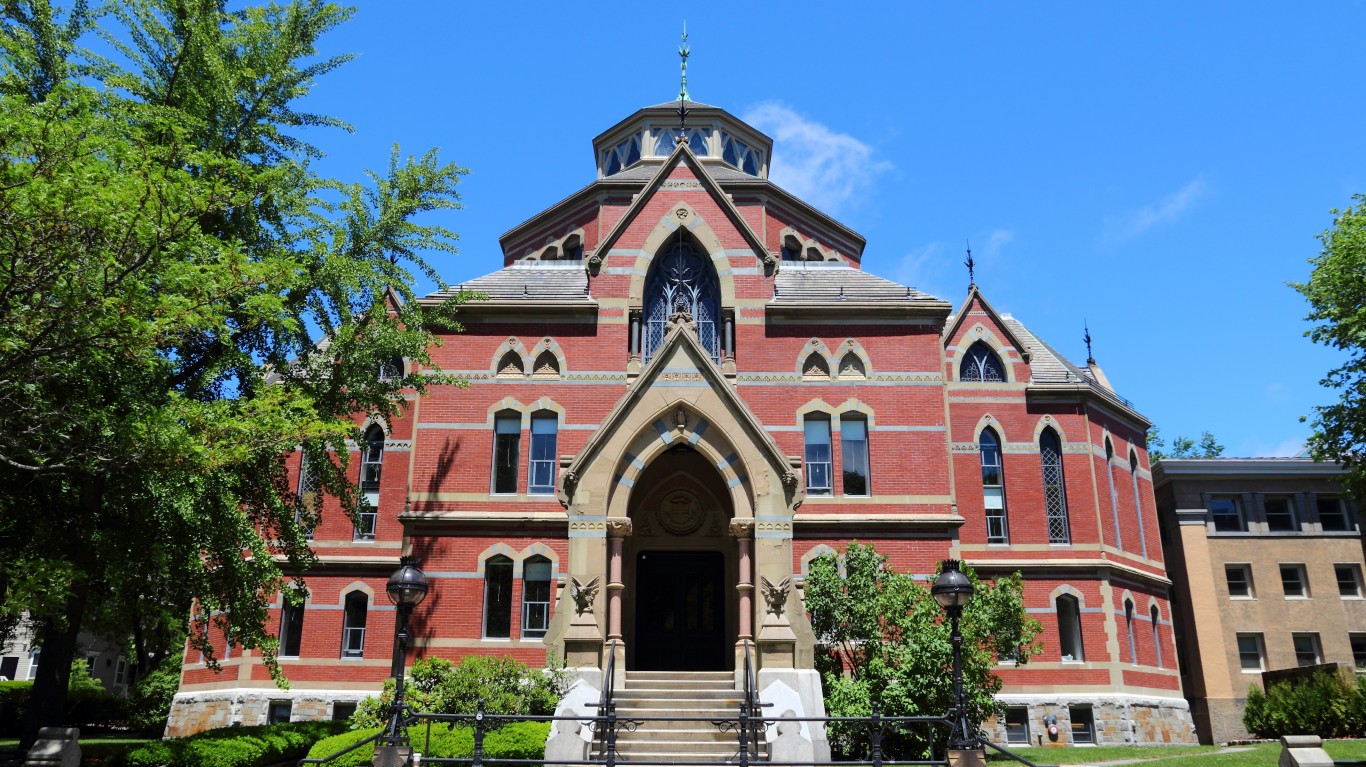
17. Brown University
> Admission rate for 2018-2019: 7.7% (applicants: 35,437, accepted: 2,718)
> Avg. annual earnings of students 10 years after enrollment: $89,100
> Median debt at graduation: $15,500
> Annual net cost of attendance: $27,218
> Avg. SAT score: 1492 out of 1600
> Location: Providence, RI
[in-text-ad-2]
16. Williams College
> Admission rate for 2018-2019: 13.0% (applicants: 9,560, accepted: 1,240)
> Avg. annual earnings of students 10 years after enrollment: $89,800
> Median debt at graduation: $12,702
> Annual net cost of attendance: $17,303
> Avg. SAT score: 1490 out of 1600
> Location: Williamstown, MA

15. Northwestern University
> Admission rate for 2018-2019: 8.5% (applicants: 40,425, accepted: 3,422)
> Avg. annual earnings of students 10 years after enrollment: $93,400
> Median debt at graduation: $15,000
> Annual net cost of attendance: $26,196
> Avg. SAT score: 1508 out of 1600
> Location: Evanston, IL
[in-text-ad]

14. Claremont McKenna College
> Admission rate for 2018-2019: 9.3% (applicants: 6,272, accepted: 584)
> Avg. annual earnings of students 10 years after enrollment: $93,200
> Median debt at graduation: $14,250
> Annual net cost of attendance: $24,456
> Avg. SAT score: 1446 out of 1600
> Location: Claremont, CA
[recirclink id=715644]

13. University of Chicago
> Admission rate for 2018-2019: 7.3% (applicants: 32,283, accepted: 2,345)
> Avg. annual earnings of students 10 years after enrollment: $103,000
> Median debt at graduation: $17,000
> Annual net cost of attendance: $34,719
> Avg. SAT score: 1520 out of 1600
> Location: Chicago, IL

12. Rice University
> Admission rate for 2018-2019: 11.1% (applicants: 20,923, accepted: 2,328)
> Avg. annual earnings of students 10 years after enrollment: $91,600
> Median debt at graduation: $11,989
> Annual net cost of attendance: $20,335
> Avg. SAT score: 1513 out of 1600
> Location: Houston, TX
[in-text-ad-2]

11. Cornell University
> Admission rate for 2018-2019: 10.6% (applicants: 51,324, accepted: 5,448)
> Avg. annual earnings of students 10 years after enrollment: $101,200
> Median debt at graduation: $14,000
> Annual net cost of attendance: $28,921
> Avg. SAT score: 1471 out of 1600
> Location: Ithaca, NY

10. Pomona College
> Admission rate for 2018-2019: 7.6% (applicants: 10,245, accepted: 780)
> Avg. annual earnings of students 10 years after enrollment: $77,300
> Median debt at graduation: $10,040
> Annual net cost of attendance: $18,500
> Avg. SAT score: 1468 out of 1600
> Location: Claremont, CA
[in-text-ad]

9. University of Pennsylvania
> Admission rate for 2018-2019: 8.4% (applicants: 44,491, accepted: 3,740)
> Avg. annual earnings of students 10 years after enrollment: $131,600
> Median debt at graduation: $19,500
> Annual net cost of attendance: $24,771
> Avg. SAT score: 1492 out of 1600
> Location: Philadelphia, PA
[recirclink id=636223]

8. Dartmouth College
> Admission rate for 2018-2019: 8.7% (applicants: 22,033, accepted: 1,925)
> Avg. annual earnings of students 10 years after enrollment: $110,200
> Median debt at graduation: $12,500
> Annual net cost of attendance: $23,869
> Avg. SAT score: 1488 out of 1600
> Location: Hanover, NH
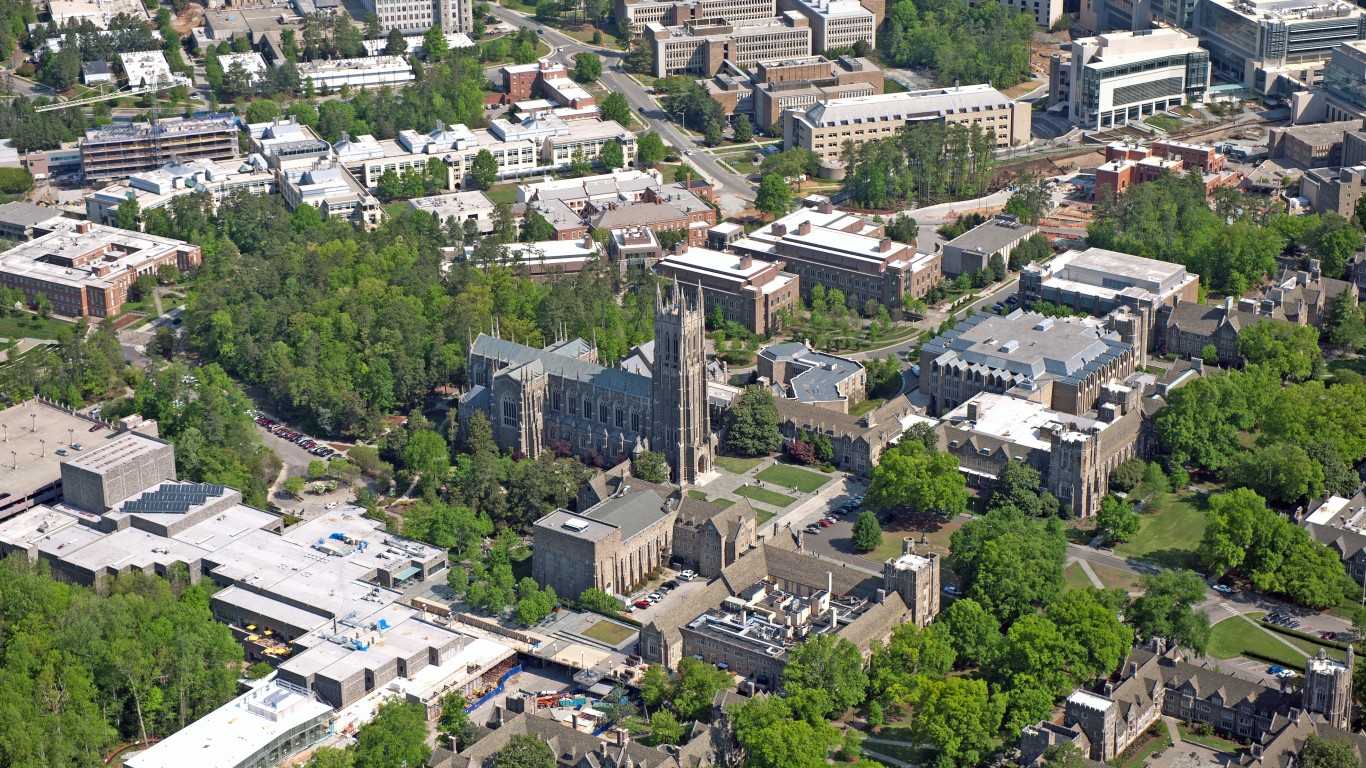
7. Duke University
> Admission rate for 2018-2019: 8.9% (applicants: 35,786, accepted: 3,189)
> Avg. annual earnings of students 10 years after enrollment: $114,500
> Median debt at graduation: $11,500
> Annual net cost of attendance: $24,386
> Avg. SAT score: 1516 out of 1600
> Location: Durham, NC
[in-text-ad-2]

6. Yale University
> Admission rate for 2018-2019: 6.3% (applicants: 35,301, accepted: 2,240)
> Avg. annual earnings of students 10 years after enrollment: $124,400
> Median debt at graduation: $13,000
> Annual net cost of attendance: $18,073
> Avg. SAT score: 1517 out of 1600
> Location: New Haven, CT
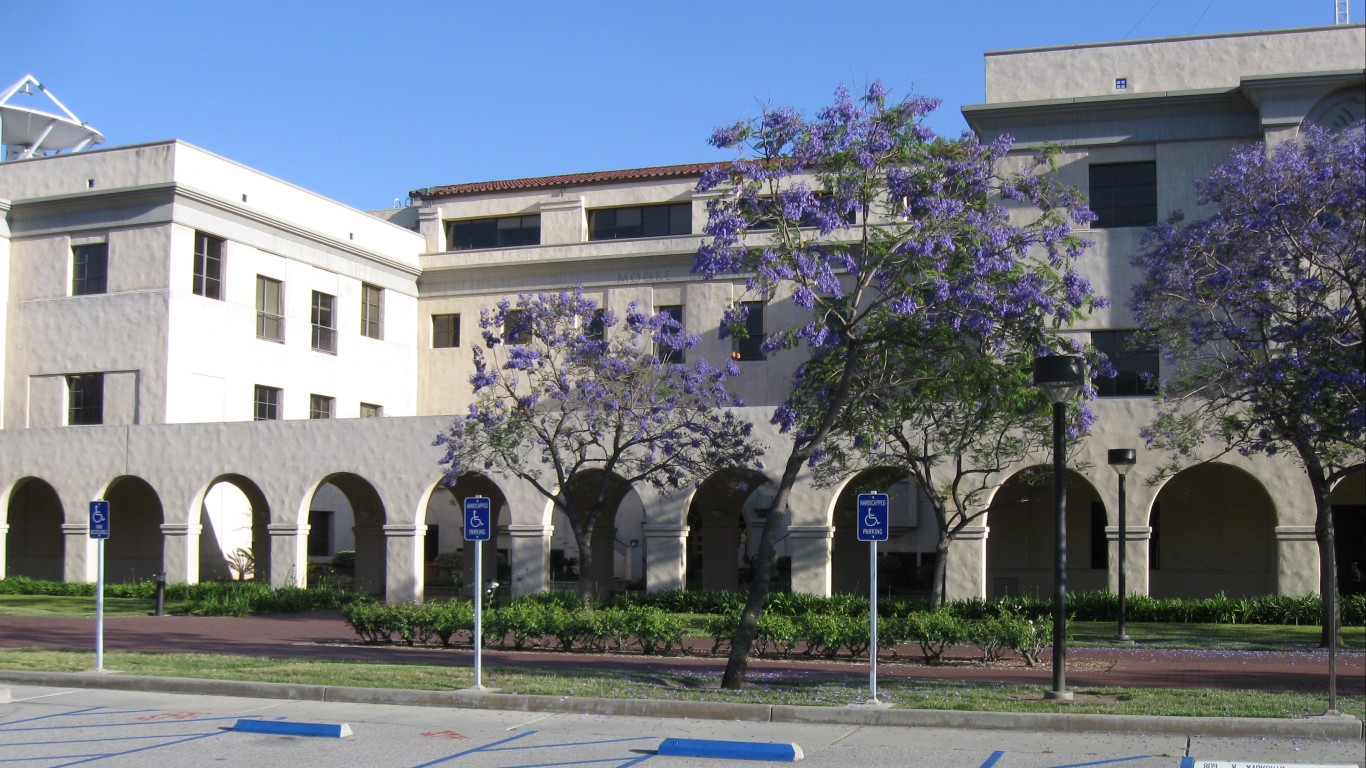
5. California Institute of Technology
> Admission rate for 2018-2019: 6.6% (applicants: 8,208, accepted: 543)
> Avg. annual earnings of students 10 years after enrollment: $106,300
> Median debt at graduation: $8,700
> Annual net cost of attendance: $27,438
> Avg. SAT score: 1566 out of 1600
> Location: Pasadena, CA
[in-text-ad]

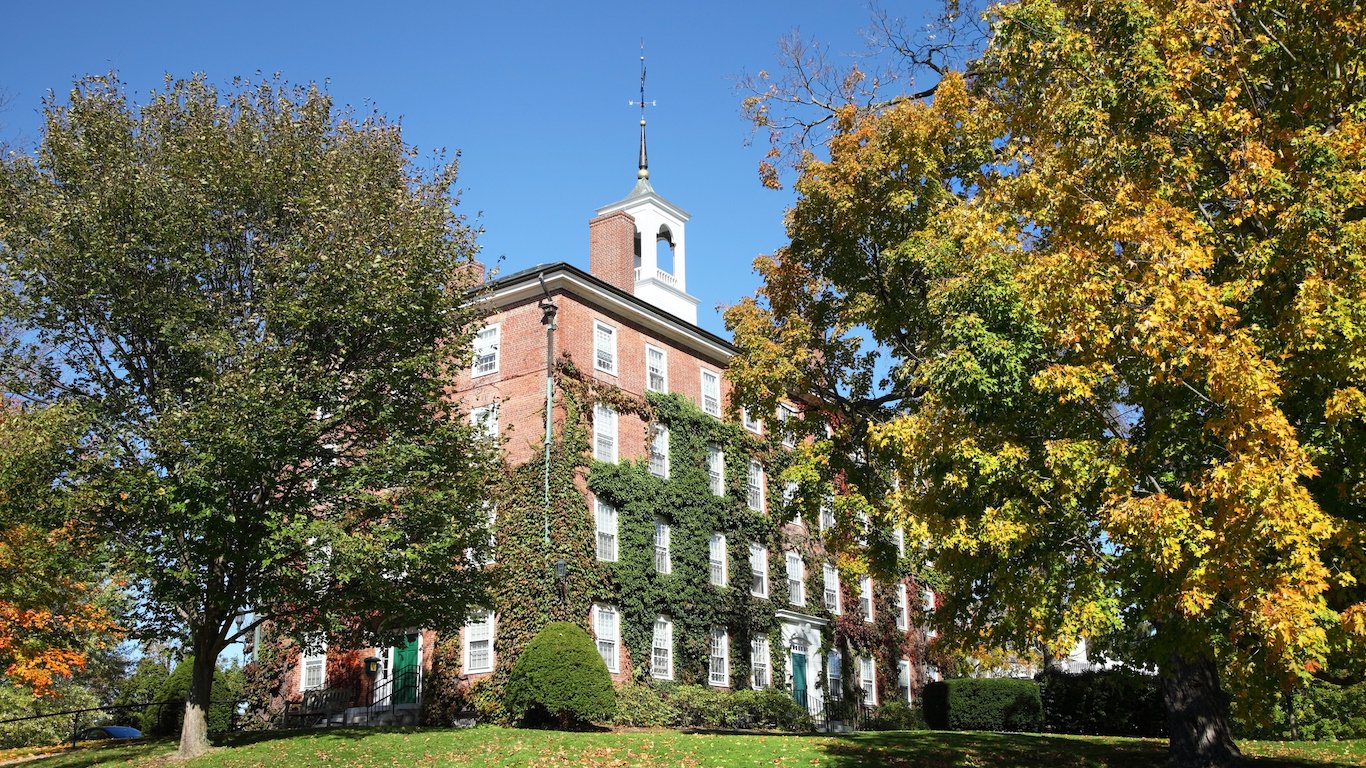
4. Princeton University
> Admission rate for 2018-2019: 5.5% (applicants: 35,370, accepted: 1,940)
> Avg. annual earnings of students 10 years after enrollment: $116,300
> Median debt at graduation: $9,850
> Annual net cost of attendance: $18,712
> Avg. SAT score: 1503 out of 1600
> Location: Princeton, NJ
[recirclink id=554263]

3. Harvard University
> Admission rate for 2018-2019: 4.7% (applicants: 42,749, accepted: 2,024)
> Avg. annual earnings of students 10 years after enrollment: $139,100
> Median debt at graduation: $13,875
> Annual net cost of attendance: $18,030
> Avg. SAT score: 1520 out of 1600
> Location: Cambridge, MA

2. Stanford University
> Admission rate for 2018-2019: 4.4% (applicants: 47,452, accepted: 2,071)
> Avg. annual earnings of students 10 years after enrollment: $141,300
> Median debt at graduation: $11,341
> Annual net cost of attendance: $16,779
> Avg. SAT score: 1497 out of 1600
> Location: Stanford, CA
[in-text-ad-2]

1. Massachusetts Institute of Technology
> Admission rate for 2018-2019: 6.7% (applicants: 21,706, accepted: 1,464)
> Avg. annual earnings of students 10 years after enrollment: $153,600
> Median debt at graduation: $12,500
> Annual net cost of attendance: $20,465
> Avg. SAT score: 1545 out of 1600
> Location: Cambridge, MA
Methodology
To determine the best colleges in America, 24/7 Wall St. created an index of three measures: acceptance rate, average earnings 10 years after enrollment, and median debt at graduation. We normalized the measure using min-max normalization and each was given equal weighting. We only considered four-year, degree-granting postsecondary U.S. institutions.
1. Acceptance rate: the percentage of applicants admitted to each institution. This was calculated using admission and application data from the National Center for Education Statistics (NCES) Integrated Postsecondary Education Data System (IPEDS) for the 2018-2019 school year. Schools with a lower acceptance rate were ranked higher in our index.
2. Average earnings are for students working and not enrolled 10 years after entry. Higher earnings were scored higher in our index. Earnings after attendance data came from the U.S. Department of Education’s (USDE) College Scorecard program for the most recent year and includes those who graduated from these institutions as well as those who did not.
3. Median debt for those who have completed their degrees at a particular institution. Data came from the U.S Department of Education’s College Scorecard and is for fiscal years 2017 and 2018. Higher debt was penalized in our index.
We also looked at total attendance (undergraduate and graduate), net price, graduation rate, and geographic information from the NCES College Navigator program. Net Price refers to the total annual cost of attendance as calculated by the NCES, based on tuition, housing and other fees, likelihood of receiving financial aid, etc. Each figure is for the most recent available for each institution. Tuition prices for various situations (in- or out-of-state, housing or commuting, etc.), as well as SAT / ACT percentiles, were also included from IPEDS for the 2018-2019 school year.
Contact [email protected] for any questions or corrections.