Per capita income in the United States has more than doubled in the last 60 years. In 1959, Americans’ average per capita income was about $15,000. As of 2019, the average per capita income in the United States was $35,672.
Incomes, however, have not risen equally nationwide. In many major metropolitan areas, incomes have increased far less. Many of these cities were relatively wealthy areas in the mid-20th century, but broad economic trends hampered growth and led to stagnant wages over the decades since.
To determine the American cities that went from rich to poor, 24/7 Wall St. calculated per capita income for all U.S. metropolitan areas and metro area equivalents in both 1959 and in 2019. We ranked cities based on their change in rank relative to all metro areas over that 60 year period. Income figures for 1959 have been adjusted for inflation.
Many of the metro areas on this list are Rust Belt communities — former manufacturing hubs that have undergone considerable economic decline in recent decades. Beginning in the 1970s, American manufacturers began outsourcing jobs to cheaper labor abroad, and more recently, automation has taken a toll on employment in the manufacturing sector. Since peaking in June, 1979, the number of Americans working in manufacturing has fallen by over 37%.
In other cases, manufacturers left the towns on this list in favor or areas where workers were not protected by collective bargaining agreements. Unionized workers are typically paid more than workers who are not in a union, and falling wages in these cities are likely attributable in part to a reduction in labor union participation. Here is a look at the states with the strongest and weakest unions.
Closures of major manufacturing operations that once served as an economic backbone in the metro areas on this list often triggered a long-term, downward economic spiral.
Click here to see the American Cities that went from rich to poor.
Click here to read our detailed methodology.

20. Springfield, OH
> Inflation adj. per capita income; 1959: $14,612 (138 of 381)
> Per capita income; 2019: $27,212 (312 of 381)
> Population change; 1959-2019: +2.0% (131,440 to 134,083)
> Unemployment rate; 2019: 4.3%
In 1959, Springfield, Ohio, had an income per capita of $14,612, when adjusted for inflation. Nationwide, the inflation-adjusted income per capita was just less than $15,000 that year. While Springfield’s income was slightly lower, it still ranked 138th out of the 381 metro areas across the country. But 60 years later, Springfield’s income per capita of $27,212 ranked outside the top 300 and was well lower than the U.S. per capita income of $35,672.
Like many other cities on this list, Springfield is located in the Rust Belt region, comprising parts of the Midwest and the Northeast that historically was home to thousands of manufacturing jobs. Over time, these jobs were outsourced or lost to automation, leading to long-standing economic challenges for the region and the people who live there.
[in-text-ad]
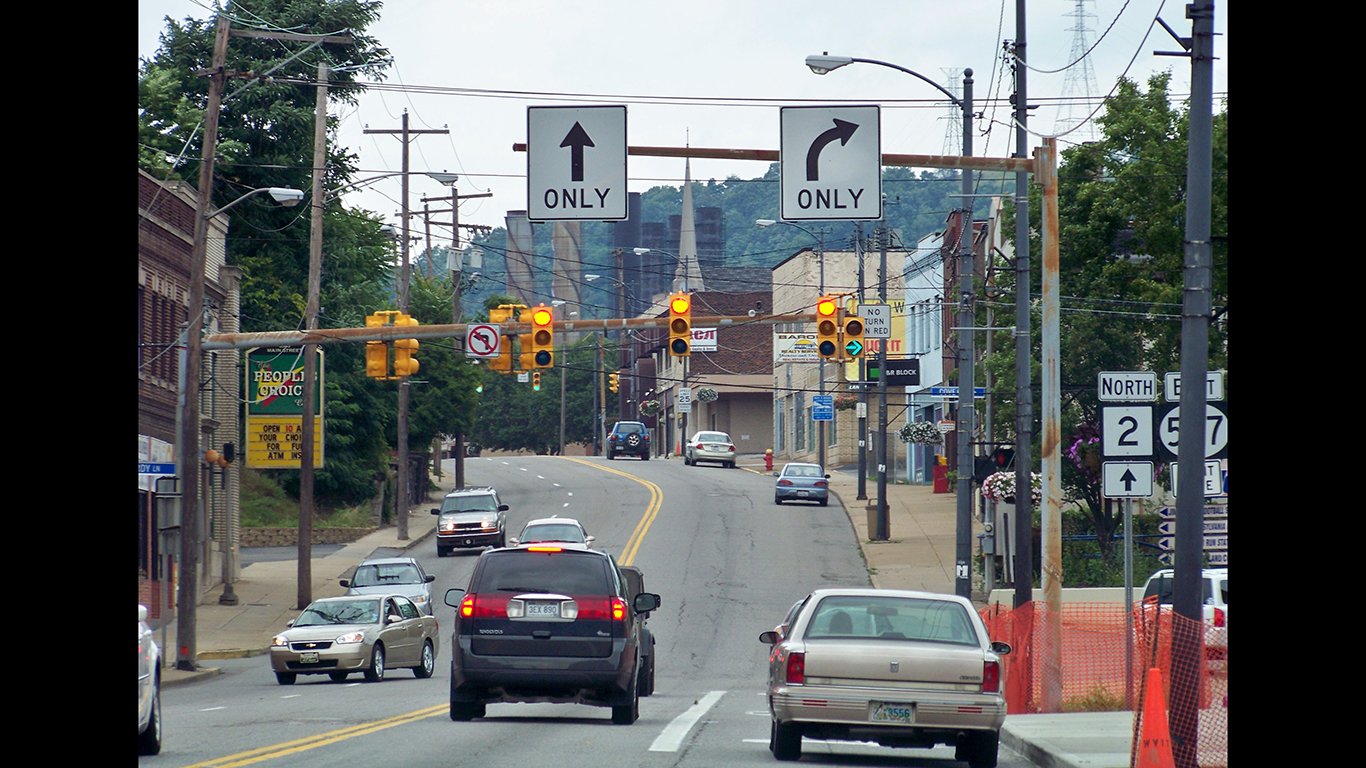
19. Weirton-Steubenville, WV-OH
> Inflation adj. per capita income; 1959: $14,801 (134 of 381)
> Per capita income; 2019: $27,264 (309 of 381)
> Population change; 1959-2019: -31.0% (167,756 to 115,816)
> Unemployment rate; 2019: 5.6%
In 1959, the Weirton-Steubenville metro area, on the West Virginia-Ohio border, had an inflation-adjusted income per capita of $14,801, roughly in line with the nationwide income per capita. As the coal and steel industries in the area contracted and jobs became harder to find, the area’s income no longer compared favorably to the rest of the country. With a $27,264 income per capita as of 2019, Weirton-Steubenville ranks 309th of the country’s 381 metro areas.
Like several other metro areas on this list, the Weirton area’s population has significantly declined over the past few decades. There were more than 50,000 fewer people living in the area in 2019 than there were in 1959 — a decline of 31%. As incomes have stagnated in the region, many people likely sought work elsewhere.
[recirclink id=823478]

18. Decatur, IL
> Inflation adj. per capita income; 1959: $15,995 (53 of 381)
> Per capita income; 2019: $29,772 (229 of 381)
> Population change; 1959-2019: -12.0% (118,257 to 104,009)
> Unemployment rate; 2019: 5.3%
Decatur, Illinois, had one of the highest inflation-adjusted per capita income in 1959, at nearly $16,000 — over $1,000 higher than the national income per capita. This income the city ranked ahead of over 300 other metro areas in the country.
While per capita income more than doubled nationwide over the past 60 years, Decatur’s grew by just 86.1%. While the 2019 national income per capita was $35,672, Decatur’s was less than $30,000 — well behind the per capita incomes of most other metro areas in the country.

17. Muskegon, MI
> Inflation adj. per capita income; 1959: $14,335 (150 of 381)
> Per capita income; 2019: $26,697 (326 of 381)
> Population change; 1959-2019: +15.8% (149,943 to 173,566)
> Unemployment rate; 2019: 4.3%
In 1959, Muskegon, Michigan’s income per capita of $14,335 was slightly lower than the national per capita income of $14,966 but still higher than that of most other U.S. metro areas. In 2019, the metro area’s per capita income of $26,697 was lower than over 300 other U.S. metro areas.
In addition to the gradual decline in manufacturing seen across the Rust Belt, cities like Muskegon were impacted by the Great Recession following the financial crisis in 2008. Job losses were common in many Michigan cities as automakers struggled and other long-standing companies closed after decades of providing jobs in the area.
[in-text-ad-2]

16. Jackson, MI
> Inflation adj. per capita income; 1959: $15,752 (70 of 381)
> Per capita income; 2019: $29,209 (247 of 381)
> Population change; 1959-2019: +20.1% (131,994 to 158,510)
> Unemployment rate; 2019: 3.8%
In 1959, Jackson, Michigan, had the 70th highest inflation-adjusted income per capita out of the 381 major metropolitan areas in the country, at $15,752. In 2019, its ranking had fallen 177 spots to 247, with an income of $29,209 per resident — well behind the national per capita income of $35,672.
Like most cities on this list, Jackson is located in the region of the country known as the Rust Belt — where manufacturing jobs were commonly available in the middle of the last century, providing people without college degrees with relatively high-paying jobs. As manufacturing has been increasingly automated and outsourced, jobs have become more scarce in this region that has increasingly struggled financially.

15. Grants Pass, OR
> Inflation adj. per capita income; 1959: $14,191 (157 of 381)
> Per capita income; 2019: $25,958 (338 of 381)
> Population change; 1959-2019: +192.4% (29,917 to 87,487)
> Unemployment rate; 2019: 5.0%
In 1959, income per capita in Grants Pass was $14,191, higher than per capita income in most other metro areas across the country. By 2019, the area had a per capita income of less than $26,000, ranking the Grants Pass area 338th out of the 381 U.S. metro areas.
Despite the fact that the metro area now has one of the lowest income per capita figures in the country, Grants Pass has grown steadily since 1959. The area’s population has nearly tripled in the past 60 years, from just under 30,000 to over 87,000.
[in-text-ad]

14. Youngstown-Warren-Boardman, OH-PA
> Inflation adj. per capita income; 1959: $15,157 (109 of 381)
> Per capita income; 2019: $28,064 (291 of 381)
> Population change; 1959-2019: -15.8% (636,525 to 536,081)
> Unemployment rate; 2019: 5.7%
Located on the Ohio-Pennsylvania border, the Youngstown metro area used to be home to a thriving steel industry. The industry began declining in 1977, when Youngstown Sheet and Tube closed. Many other steel mills shuttered their doors soon after.
In 1959, before the mills closed, the Youngstown metro area had a per capita income of $15,157, slightly higher than the national average. Sixty years later, the metro area had a median of just $28,000 — $7,500 lower than the U.S. per capita income. The metro area’s population declined by more than 100,000 people during that time, equivalent to 15.8% of its 1959 population.
[recirclink id=823069]
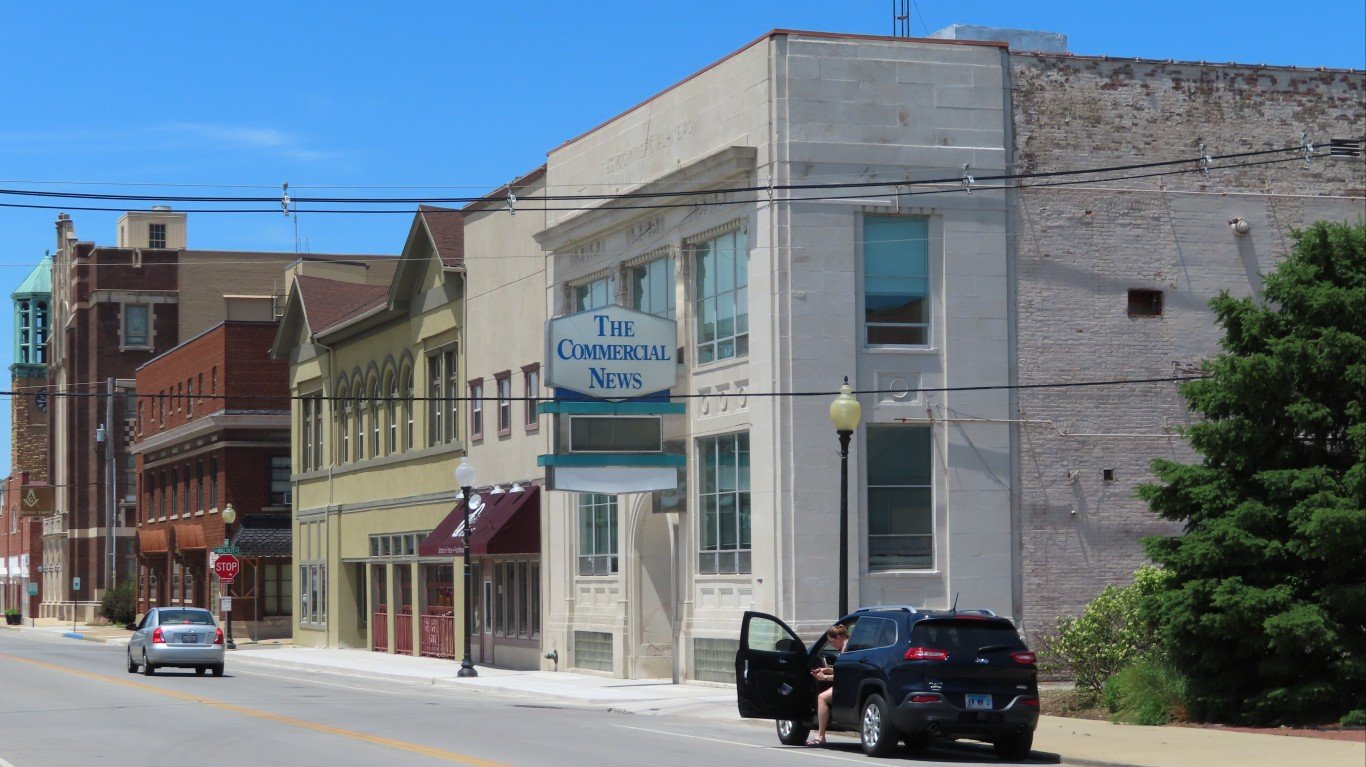
13. Danville, IL
> Inflation adj. per capita income; 1959: $14,117 (158 of 381)
> Per capita income; 2019: $25,592 (343 of 381)
> Population change; 1959-2019: -21.2% (96,176 to 75,758)
> Unemployment rate; 2019: 5.1%
In 1959, Danville’s per capita income of $14,117 was higher than the income in most metro areas. In 2019, the metro area’s per capita income of $25,592 ranked among the 40 poorest out of the 381 major metro areas in the country.
As the Danville area has struggled economically, its population has declined significantly. The area’s population fell by over 21% from 1959 to 2019, with the area now home to more than 20,000 fewer residents. Only three other metro areas in the country saw greater population declines over that time period.

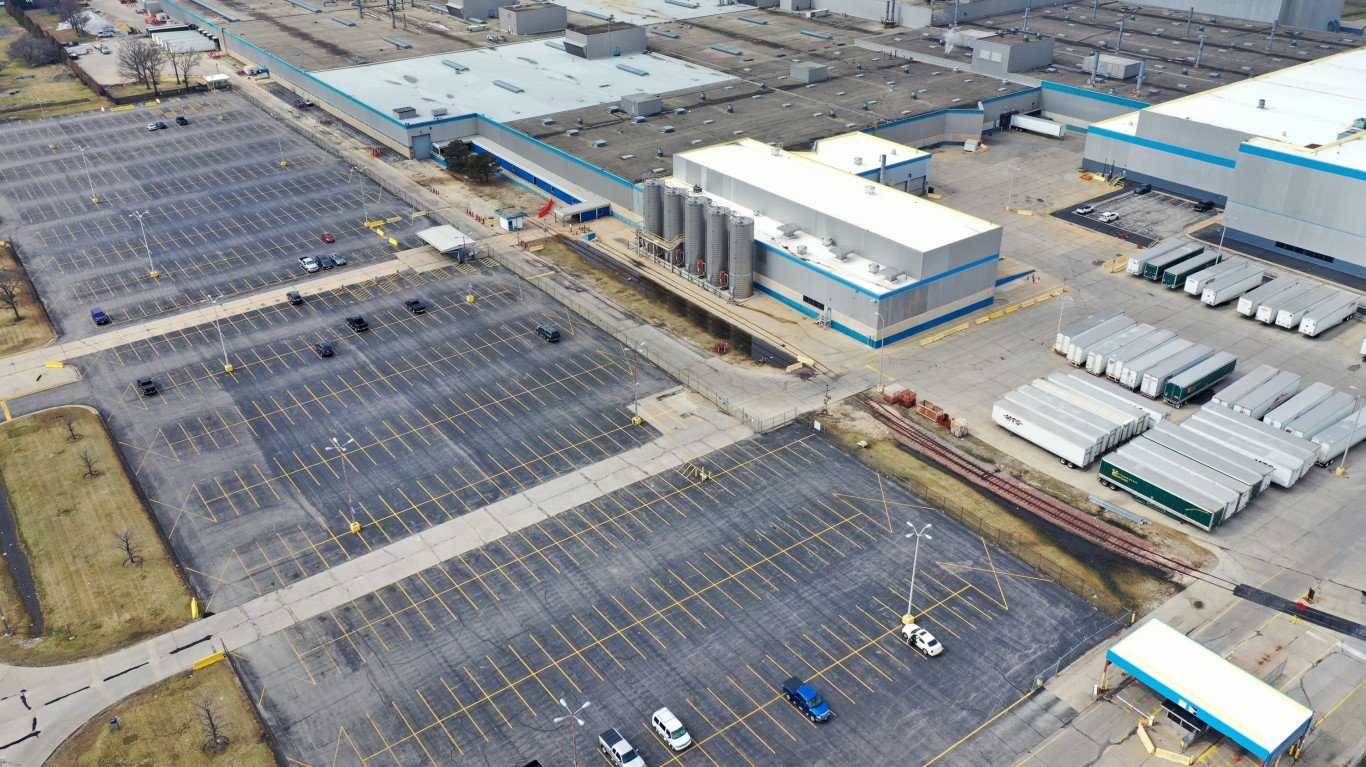
12. Flint, MI
> Inflation adj. per capita income; 1959: $15,486 (87 of 381)
> Per capita income; 2019: $28,503 (276 of 381)
> Population change; 1959-2019: +8.4% (374,313 to 405,813)
> Unemployment rate; 2019: 4.9%
Flint has faced a number of challenges in recent decades, including issues with violent crime, and the 2014 water crisis that contaminated the area’s drinking water. It has also faced economic decline in recent decades, similar to a number of other Michigan metro areas.
In 1959, Flint residents had an inflation-adjusted per capita income of nearly $15,500 — about $500 higher than the national average. In 2019, Flint’s income per capita was $28,503, about $3,000 below the national income per capita of $35,672.
[in-text-ad-2]

11. Binghamton, NY
> Inflation adj. per capita income; 1959: $15,852 (62 of 381)
> Per capita income; 2019: $29,133 (253 of 381)
> Population change; 1959-2019: -4.7% (250,463 to 238,691)
> Unemployment rate; 2019: 4.6%
Binghamton, New York, located at the eastern edge of the Rust Belt, was once a manufacturing hub, with companies like IBM and Endicott-Johnson Shoe Company employing tens of thousands of locals. Like many other Rust Belt Cities, however, the area’s manufacturing sector contracted and today is smaller than it used to be.
The Binghamton area’s population was nearly 5% smaller in 2019 than it was in 1959, when more than a quarter million people lived there. In 1959, the metro area had one of the 100 highest per capita incomes in America and nearly $900 higher than the national average. In 2019, Binghamton’s per capita income of $29,133 was one of the 100 lowest and about $6,500 lower than the national per capita income.

10. South Bend-Mishawaka, IN-MI
> Inflation adj. per capita income; 1959: $16,122 (48 of 381)
> Per capita income; 2019: $29,148 (250 of 381)
> Population change; 1959-2019: +17.4% (275,546 to 323,613)
> Unemployment rate; 2019: 3.7%
In 1959, the average income in the South Bend, Indiana metro area was $16,122, in the top 50 of all U.S. metro areas and about $1,200 more than the national average. Back then, Studebaker Corporation, one of the largest motor companies in the United States, was headquartered in the area and provided thousands of well-paying jobs. Ultimately, Studebaker went out of business in 1963, triggering a downward economic spiral that lasted decades. As of 2019, the average income in the metro area was just $29,148, about $6,500 below the national average.
[in-text-ad]

9. Fresno, CA
> Inflation adj. per capita income; 1959: $14,579 (140 of 381)
> Per capita income; 2019: $25,260 (348 of 381)
> Population change; 1959-2019: +173.0% (365,945 to 999,101)
> Unemployment rate; 2019: 7.2%
Fresno, California, is an agricultural hub. The farming, fishing, and forestry industry employs an estimated 45,000 people in the metro area, making such workers much more concentrated in Fresno than they are nationwide. But agriculture is also one of the lowest paying industries. Partially as a result, the average income in Fresno of just $25,260 is in the lowest 10% of all U.S. metro areas.
Only six decades ago, average income in the area was $14,579, closely in line with the national average.
[recirclink id=823036]

8. Muncie, IN
> Inflation adj. per capita income; 1959: $14,919 (125 of 381)
> Per capita income; 2019: $25,737 (341 of 381)
> Population change; 1959-2019: +2.9% (110,938 to 114,135)
> Unemployment rate; 2019: 3.9%
Six decades ago, Muncie, Indiana’s per capita income of $14,919 was closely in line with the per capita income across the U.S. as a whole. Now, the metro area ranks among the poorest in the country. Per capita income in Muncie is about $10,000 below the national average, and 22.8% of the population lives below the poverty line, compared to 12.3% of the U.S. population.
Muncie, a former economic powerhouse, was home to a number of manufacturing plants operated by companies such as Dayton-Walther Corporation, Delco Remy, General Motors, Hemingray Glass Company, Indiana Steel and Wire, and Westinghouse. Most of these and other facilities closed in in recent decades, and those that survived generally had smaller, non-union operations that generally pay less than unionized facilities.

7. Battle Creek, MI
> Inflation adj. per capita income; 1959: $15,785 (67 of 381)
> Per capita income; 2019: $28,175 (288 of 381)
> Population change; 1959-2019: -3.4% (138,858 to 134,159)
> Unemployment rate; 2019: 4.1%
As little as 60 years ago, the per capita income in Battle Creek, Michigan, was $15,785, nearly $1,000 more than the average nationwide. Today, per capita income in the metro area is just $28,175 — or about $7,500 less than the national average.
Battle Creek is home to the headquarters of Kellog’s. Breakfast cereal was a major industry in the area as early as 1900, and the city thrived economically until the 1960s. Industrial plants that had formerly been an economic pillar were bought out and closed or relocated to parts of the country without labor unions — and both people and jobs left Battle Creek. The metro area is one of only 25 nationwide that is home to fewer people now than 60 years ago.
[in-text-ad-2]

6. Amarillo, TX
> Inflation adj. per capita income; 1959: $15,936 (57 of 381)
> Per capita income; 2019: $28,233 (287 of 381)
> Population change; 1959-2019: +67.2% (161,168 to 269,447)
> Unemployment rate; 2019: 2.6%
Amarillo, Texas, was one of the busiest cattle shipping hubs in the world when it was incorporated in 1892. The city solidified itself as a regional economic powerhouse following the discovery of oil and natural gas in the 1920s and expanded its agricultural production after the Great Depression.
In recent decades, however, economic growth in the Panhandle city has not kept pace with much of the rest of the country. Over the past 60 years, the average annual income in the city increased by 77% — slower than most U.S. metro areas and far slower than the 138% income growth nationwide over the same time.

5. Kokomo, IN
> Inflation adj. per capita income; 1959: $15,744 (71 of 381)
> Per capita income; 2019: $27,393 (304 of 381)
> Population change; 1959-2019: +18.8% (69,509 to 82,544)
> Unemployment rate; 2019: 4.0%
Kokomo, Indiana, is one of several Midwestern Rust Belt cities to rank on this list. An early pioneer in metal alloy manufacturing, Kokomo established itself as a manufacturing hub by the mid-20th century with plants churning out electronics, machinery, automotive parts, and aluminium die castings. As American manufacturing declined across the United States, however, Kokomo residents felt the pinch.
The average annual income in the city in 1959 was $15,744 — well within the top 20% highest earning U.S. metro areas. As of 2019, the average annual income was $27,393 — near the bottom 20% of U.S. metro areas.
[in-text-ad]

4. Great Falls, MT
> Inflation adj. per capita income; 1959: $15,638 (78 of 381)
> Per capita income; 2019: $27,116 (315 of 381)
> Population change; 1959-2019: +10.8% (73,418 to 81,366)
> Unemployment rate; 2019: 3.4%
Throughout the first half of the 20th century, Great Falls, Montana, benefitted from steady economic growth. It was home to a railway, manufacturing companies, agricultural production, and, during WWII, an air force base. However, during the 1970s and 1980s, high-paying jobs in manufacturing and resource extraction left Great Falls, and the economic pinch pushed thousands out of the city.
Like many metro areas on this list that fell victim to similar economic trends, Great Falls has yet to return to its previous strength. Ranking among the 80 richest metro areas in 1959, Great Falls now ranks among the 80 poorest. At $27,116, per capita income in the metro area is about $8,500 below the national figure.
[recirclink id=822556]

3. Bakersfield, CA
> Inflation adj. per capita income; 1959: $15,121 (110 of 381)
> Per capita income; 2019: $24,524 (363 of 381)
> Population change; 1959-2019: +208.3% (291,984 to 900,202)
> Unemployment rate; 2019: 7.7%
Soon after it was founded in 1869, Bakersfield, California, became a center for agricultural trade and, decades later, a center for petroleum-related industries . Though industrial production has continued to grow in the metro area, economic expansion has not kept pace with population growth.
Over the last 60 years, Bakersfield’s population more than tripled — and over the same period, income per capita in the city plummeted. In 1959, income per capita in the metro area was $15,121, closely in line with the national average of $14,966. Today, at $24,524, income per capita in the area is well below the $35,672 national average. Bakersfield’s annual unemployment rate stands at 7.7%, well above the 3.7% national rate, and nearly one in every five metro area residents live below the poverty line.

2. Mansfield, OH
> Inflation adj. per capita income; 1959: $15,865 (61 of 381)
> Per capita income; 2019: $26,583 (331 of 381)
> Population change; 1959-2019: +2.9% (117,761 to 121,154)
> Unemployment rate; 2019: 4.5%
Just 60 years ago, adjusted income per capita in Mansfield, Ohio, was $15,865 — higher than in the vast majority of U.S. metro areas and the national per capita income of $14,966 at the time. Today, Mansfield is one of the poorest cities in the country. The metro area’s income per capita is just $26,583, about $9,000 below the comparable national figure of $35,672.
Like many metro areas on this list, Mansfield is a Rust Belt community that declined alongside American manufacturing. Over the past 50 years, as major local employers — including Ohio Brass, Mansfield Plastics, and General Motors — outsourced labor, high-paying blue collar jobs in the city all but evaporated.
[in-text-ad-2]

1. Elkhart-Goshen, IN
> Inflation adj. per capita income; 1959: $16,844 (32 of 381)
> Per capita income; 2019: $26,745 (323 of 381)
> Population change; 1959-2019: +93.2% (106,790 to 206,341)
> Unemployment rate; 2019: 3.1%
In 1959, only 31 of all 381 U.S. metro areas had a higher income per capita than Elkhart-Goshen, Indiana. As of 2019, 322 U.S. metro areas did. The area, which is known as the “RV Capital of the World,” has suffered in recent years due to declining demand for RVs, which are manufactured largely in the Elkhart area. RV shipments fell by about 16% in 2019 from the previous year, prompting local RV maker Thor Industries to reduce production — along with employee hours. Elkhart’s critical RV industry was also slammed during the Great Recession following the 2008 financial crisis, which sent the local unemployment rate to 22%.
Methodology
To determine the American cities that went from rich to poor, 24/7 Wall St. calculated the relative change in real per capita income for all U.S. metropolitan areas from 1959 to 2019. Using historical county-level data from the Census Bureau, we calculated the per capita income for metropolitan statistical areas using boundary definitions for September 2018, also from the Census Bureau. We then adjusted the 1959 per capita figures to 2019 dollars using CPI data from the Bureau of Labor Statistics. Data on per capita income for metropolitan statistical areas for 2019 came from Census Bureau’s American Community Survey. Metropolitan areas whose boundaries changed from 1959 to 2018 were excluded from consideration. Additional data on unemployment for 2019 came from the Bureau of Labor Statistics.
Contact [email protected] for any questions or corrections.