Although robbery is a crime that can happen anywhere, your chances of becoming a victim go up depending on which city, town, village or Census designated place you may be in.
Robbery is “taking or attempting to take anything of value from the care, custody, or control of a person or persons by force or threat of force or violence and/or putting the victim in fear,” according to the FBI. This crime can occur in a person’s home or anyplace a person might go, like stores, bus stops, sidewalks, schools, parks or offices.
Often, but not always, robbery can be a “crime of opportunity” — a matter of the victim being at the wrong place at the wrong time. The New York Times reports that during the pandemic police have seen an increase in armed robberies of delivery workers and that the robbers often make off with the worker’s bicycle.
Baltimore is the U.S. city with the highest robbery rate, according to FBI statistics for 2019. Rounding out the top five riskiest cities for this crime are Oakland, Calif.; Cleveland; St. Louis; and Atlantic City, N.J. (These are the American cities with the most property crime in every state.)
California is the state with the most cities on the list of the top 50 places where you are most at risk of being robbed, with 15. New Jersey is second with 7 cities on the list. Florida and Pennsylvania have 3 each.
Click here to see the American cities with the most robberies.
To determine the cities with the most robberies, 24/7 Wall St. reviewed property crime data from the FBI’s 2019 Uniform Crime Report. We ranked cities based on the number of property crimes reported per 100,000 residents. We considered all cities, towns, villages, and Census designated places home to at least 20,000 people in our analysis. Alabama and Hawaii did not have sufficient crime data at the city level and were excluded from our analysis. Data on poverty rate came from the U.S. Census Bureau’s American Community Survey and are five-year averages for 2019.

50. Cincinnati, Ohio
> Robberies in 2019: 287 per 100,000 people (total: 872)
> Share of total robberies in Ohio: 9.9% of 7,889
> Poverty rate in 2019: 26.3% — 112 out of 1,898 cities
> Median household income in 2019: $40,640 — 1,504 out of 1,898 cities
> Unemployment rate in 2019: 4.2% — 341 out of 1,898 cities
[in-text-ad]
49. Norristown, Pennsylvania
> Robberies in 2019: 290 per 100,000 people (total: 100)
> Share of total robberies in Pennsylvania: 1.0% of 1,378
> Poverty rate in 2019: 19.5% — 328 out of 1,898 cities
> Median household income in 2019: $48,414 — 1,263 out of 1,898 cities
> Unemployment rate in 2019: 4.5% — 276 out of 1,898 cities
[recirclink id=844081]

48. Kansas City, Missouri
> Robberies in 2019: 291 per 100,000 people (total: 1,443)
> Share of total robberies in Missouri: 29.1% of 4,165
> Poverty rate in 2019: 16.1% — 526 out of 1,898 cities
> Median household income in 2019: $54,194 — 1,062 out of 1,898 cities
> Unemployment rate in 2019: 3.6% — 575 out of 1,898 cities

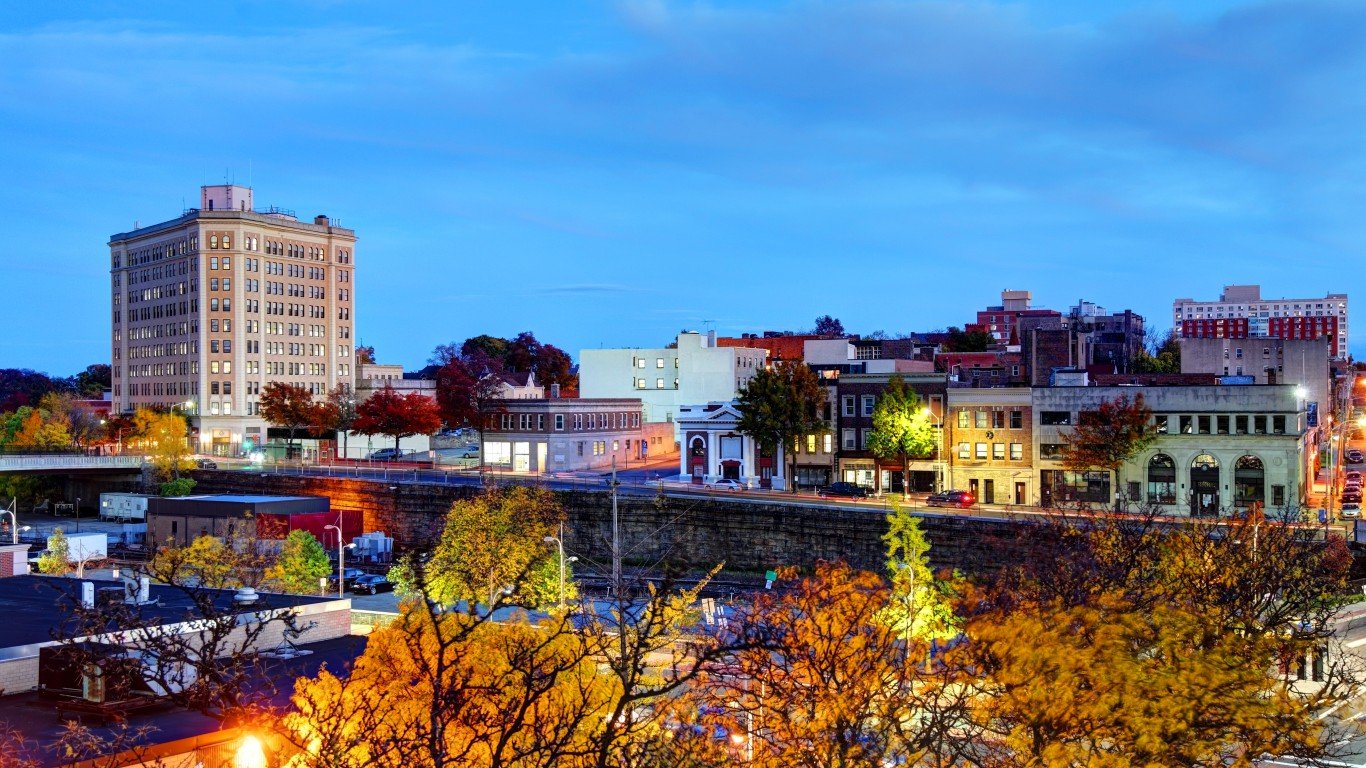
47. Newburgh, New York
> Robberies in 2019: 292 per 100,000 people (total: 82)
> Share of total robberies in New York: 0.5% of 17,017
> Poverty rate in 2019: 25.4% — 134 out of 1,898 cities
> Median household income in 2019: $41,769 — 1,471 out of 1,898 cities
> Unemployment rate in 2019: 5.1% — 167 out of 1,898 cities
[in-text-ad-2]
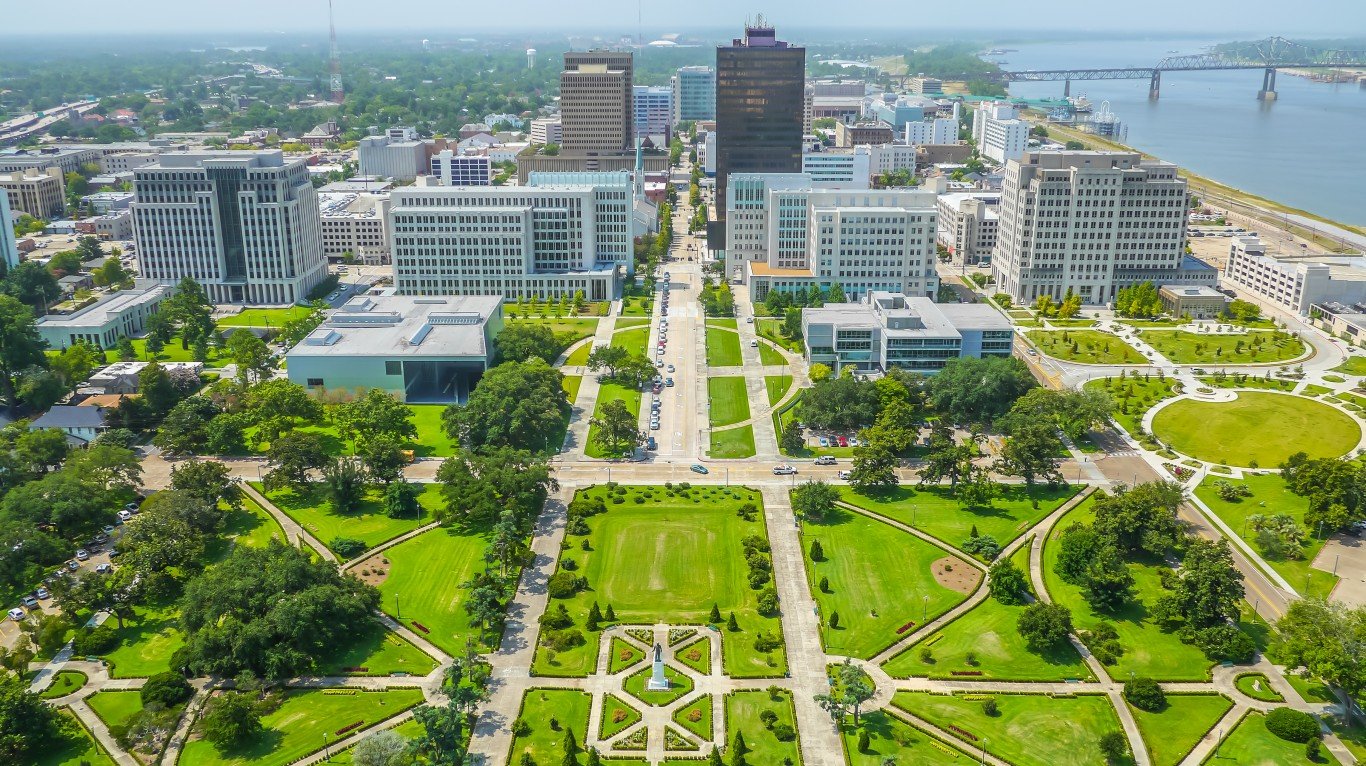
46. Baton Rouge, Louisiana
> Robberies in 2019: 292 per 100,000 people (total: 645)
> Share of total robberies in Louisiana: 16.0% of 2,962
> Poverty rate in 2019: 24.8% — 146 out of 1,898 cities
> Median household income in 2019: $44,470 — 1,394 out of 1,898 cities
> Unemployment rate in 2019: 4.8% — 228 out of 1,898 cities

45. Jackson, Mississippi
> Robberies in 2019: 293 per 100,000 people (total: 478)
> Share of total robberies in Mississippi: 28.1% of 898
> Poverty rate in 2019: 25.4% — 134 out of 1,898 cities
> Median household income in 2019: $38,888 — 1,543 out of 1,898 cities
> Unemployment rate in 2019: 5.4% — 127 out of 1,898 cities
[in-text-ad]

44. Chicago, Illinois
> Robberies in 2019: 295 per 100,000 people (total: 7,983)
> Share of total robberies in Illinois: 64.0% of 12,010
> Poverty rate in 2019: 18.4% — 393 out of 1,898 cities
> Median household income in 2019: $58,247 — 948 out of 1,898 cities
> Unemployment rate in 2019: 4.0% — 417 out of 1,898 cities
[recirclink id=843016]
43. Elizabeth, New Jersey
> Robberies in 2019: 298 per 100,000 people (total: 384)
> Share of total robberies in New Jersey: 6.7% of 5,611
> Poverty rate in 2019: 17.6% — 433 out of 1,898 cities
> Median household income in 2019: $48,407 — 1,264 out of 1,898 cities
> Unemployment rate in 2019: 4.4% — 294 out of 1,898 cities
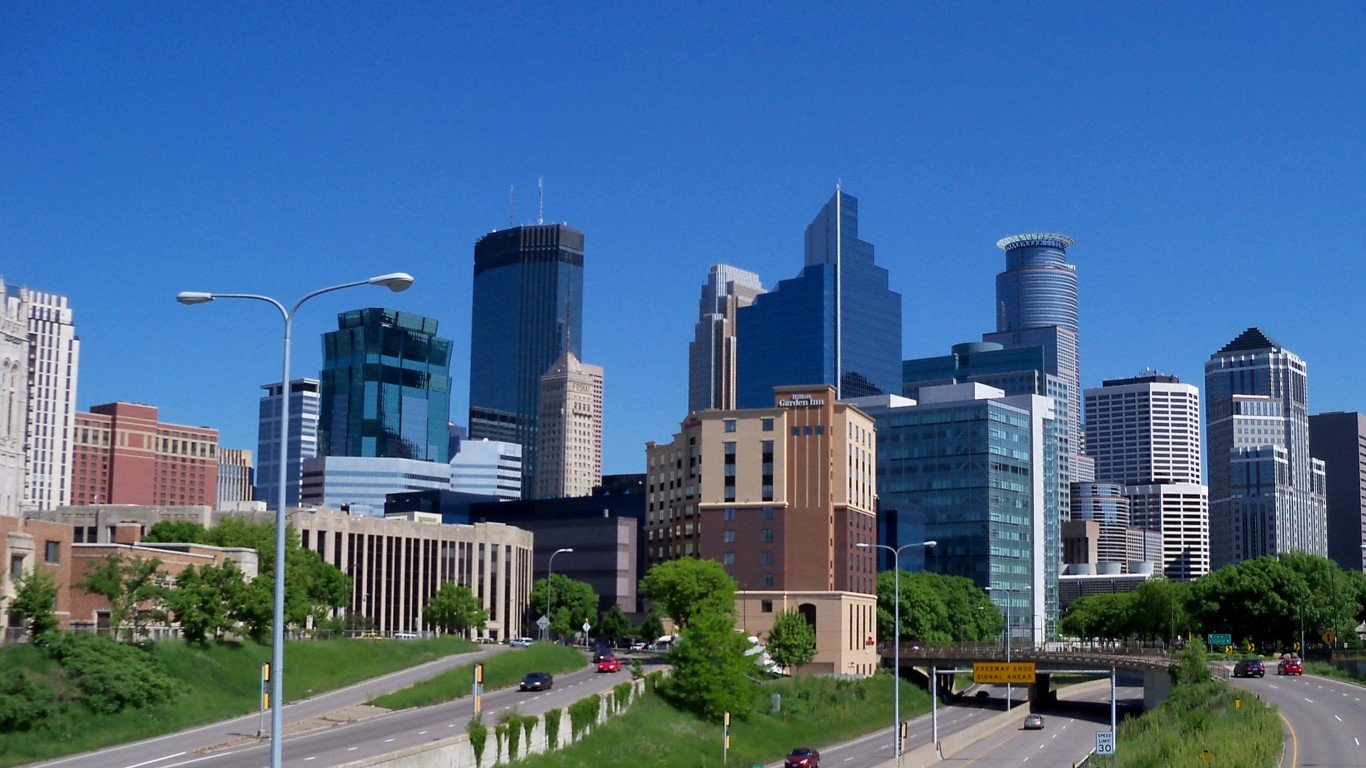
42. Minneapolis, Minnesota
> Robberies in 2019: 299 per 100,000 people (total:1,289)
> Share of total robberies in Minnesota: 40.9% of 2,788
> Poverty rate in 2019: 19.1% — 354 out of 1,898 cities
> Median household income in 2019: $62,583 — 835 out of 1,898 cities
> Unemployment rate in 2019: 2.8% — 1,096 out of 1,898 cities
[in-text-ad-2]

41. Berkeley, California
> Robberies in 2019: 301 per 100,000 people (total: 369)
> Share of total robberies in California: 0.7% of 45,873
> Poverty rate in 2019: 19.2% — 346 out of 1,898 cities
> Median household income in 2019: $85,530 — 377 out of 1,898 cities
> Unemployment rate in 2019: 2.8% — 1,096 out of 1,898 cities
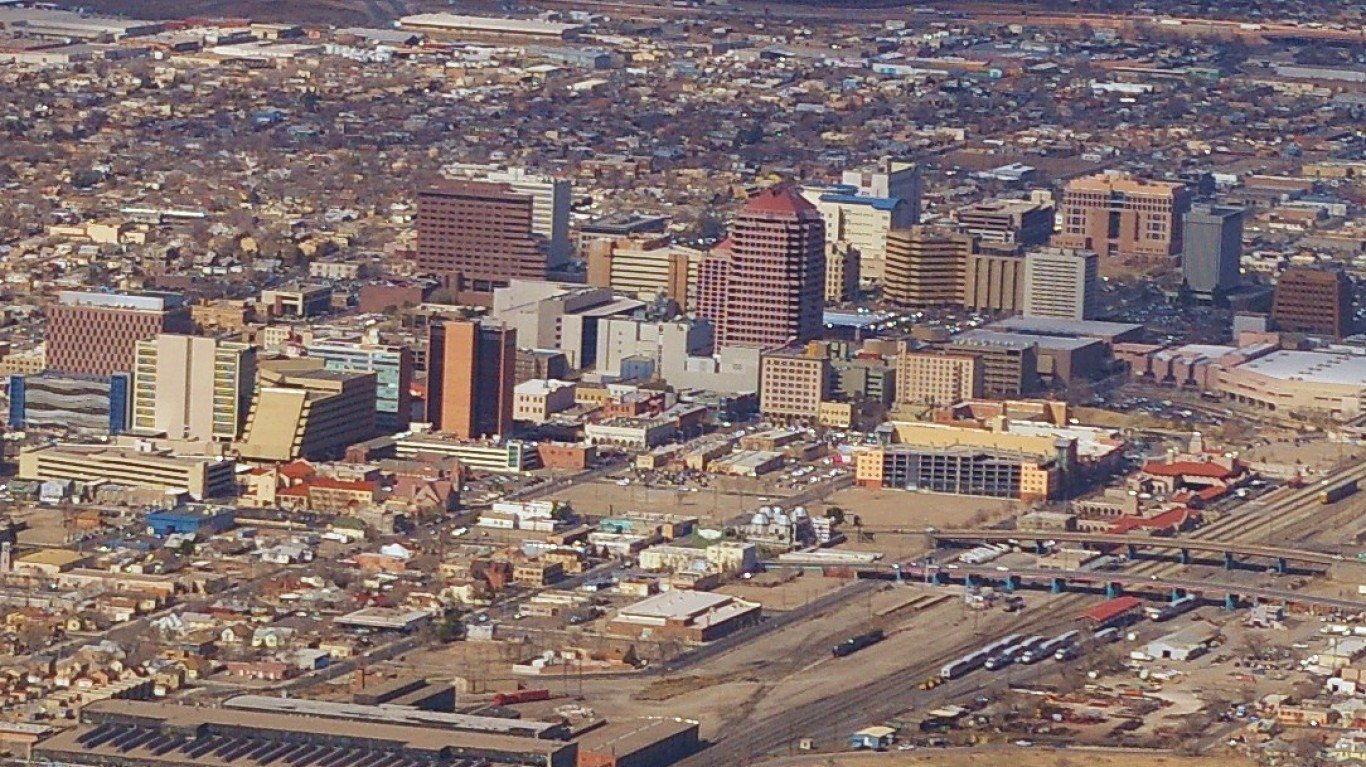
40. Albuquerque, New Mexico
> Robberies in 2019: 302 per 100,000 people (total: 1,699)
> Share of total robberies in New Mexico: 72.6% of 2,012
> Poverty rate in 2019: 16.9% — 472 out of 1,898 cities
> Median household income in 2019: $52,911 — 1,107 out of 1,898 cities
> Unemployment rate in 2019: 4.4% — 294 out of 1,898 cities
[in-text-ad]

39. Miami Beach, Florida
> Robberies in 2019: 308 per 100,000 people (total: 284)
> Share of total robberies in Florida: 1.8% of 10,543
> Poverty rate in 2019: 14.0% — 666 out of 1,898 cities
> Median household income in 2019: $53,971 — 1,069 out of 1,898 cities
> Unemployment rate in 2019: 1.8% — 1,444 out of 1,898 cities
[recirclink id=844073]

38. Lynwood, California
> Robberies in 2019: 309 per 100,000 people (total: 218)
> Share of total robberies in California: 0.4% of 45,873
> Poverty rate in 2019: 17.8% — 425 out of 1,898 cities
> Median household income in 2019: $52,213 — 1,137 out of 1,898 cities
> Unemployment rate in 2019: 5.1% — 167 out of 1,898 cities

37. San Leandro, California
> Robberies in 2019: 313 per 100,000 people (total: 283)
> Share of total robberies in California: 0.5% of 45,873
> Poverty rate in 2019: 9.6% — 1,033 out of 1,898 cities
> Median household income in 2019: $78,003 — 493 out of 1,898 cities
> Unemployment rate in 2019: 3.1% — 861 out of 1,898 cities
[in-text-ad-2]

36. Buffalo, New York
> Robberies in 2019: 314 per 100,000 people (total: 802)
> Share of total robberies in New York: 4.4% of 17,017
> Poverty rate in 2019: 30.1% — 56 out of 1,898 cities
> Median household income in 2019: $37,354 — 1,567 out of 1,898 cities
> Unemployment rate in 2019: 5.5% — 105 out of 1,898 cities

35. Orange City, New Jersey
> Robberies in 2019: 314 per 100,000 people (total: 96)
> Share of total robberies in New Jersey: 1.7% of 5,611
> Poverty rate in 2019: Not applicable
> Median household income in 2019: Not applicable
> Unemployment rate in 2019: Not applicable
[in-text-ad]
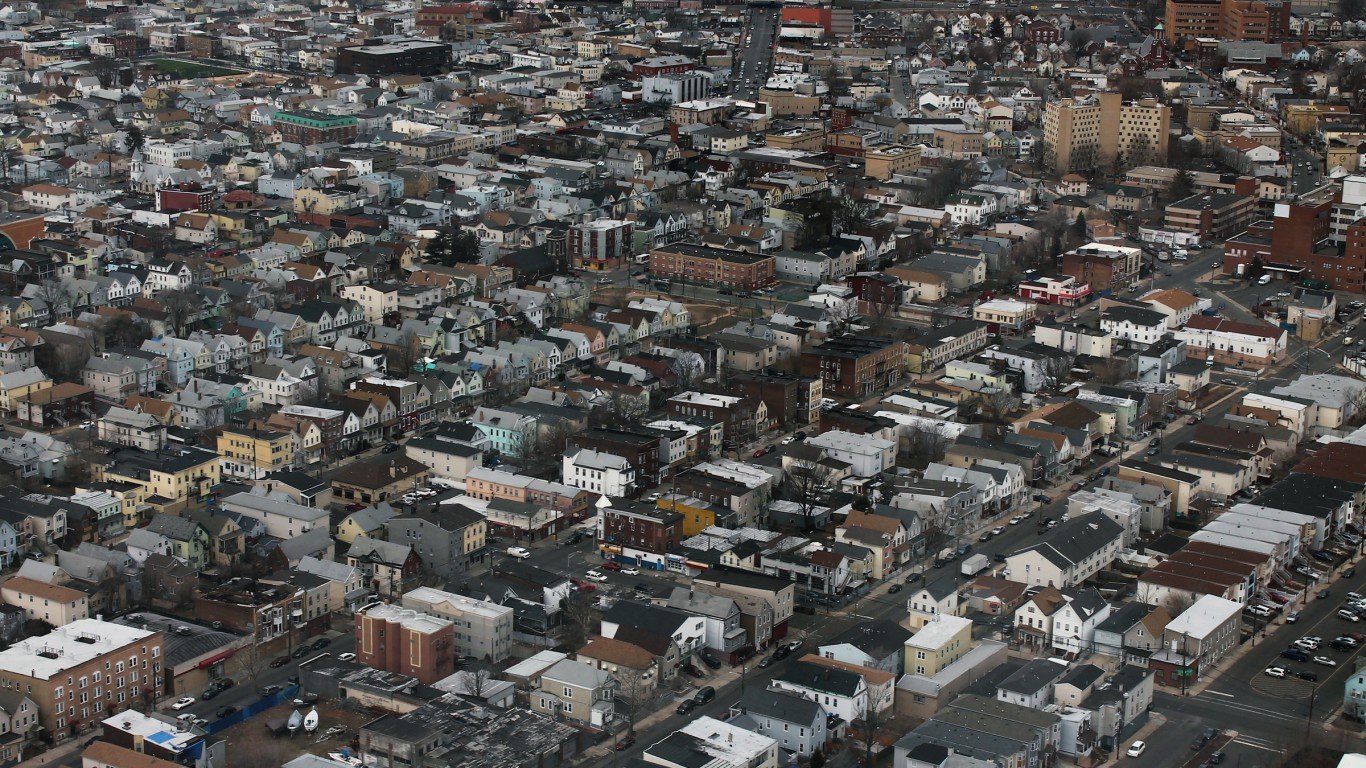
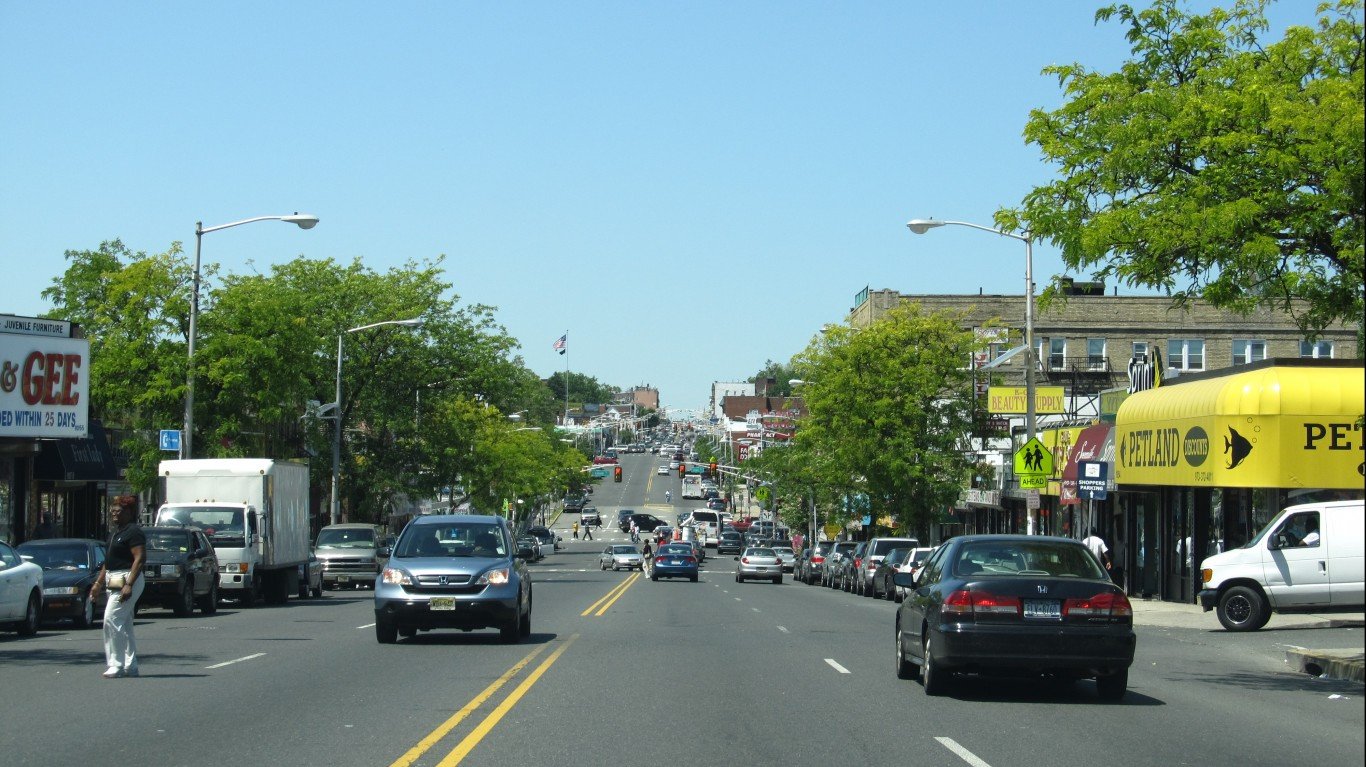
34. Paterson, New Jersey
> Robberies in 2019: 320 per 100,000 people (total: 464)
> Share of total robberies in New Jersey: 8.1% of 5,611
> Poverty rate in 2019: 26.6% — 104 out of 1,898 cities
> Median household income in 2019: $41,360 — 1,485 out of 1,898 cities
> Unemployment rate in 2019: 6.6% — 46 out of 1,898 cities
[recirclink id=843553]

33. Dallas, Texas
> Robberies in 2019: 323 per 100,000 people (total: 4,400)
> Share of total robberies in Texas: 15.2% of 25,162
> Poverty rate in 2019: 18.9% — 366 out of 1,898 cities
> Median household income in 2019: $52,580 — 1,122 out of 1,898 cities
> Unemployment rate in 2019: 3.4% — 669 out of 1,898 cities
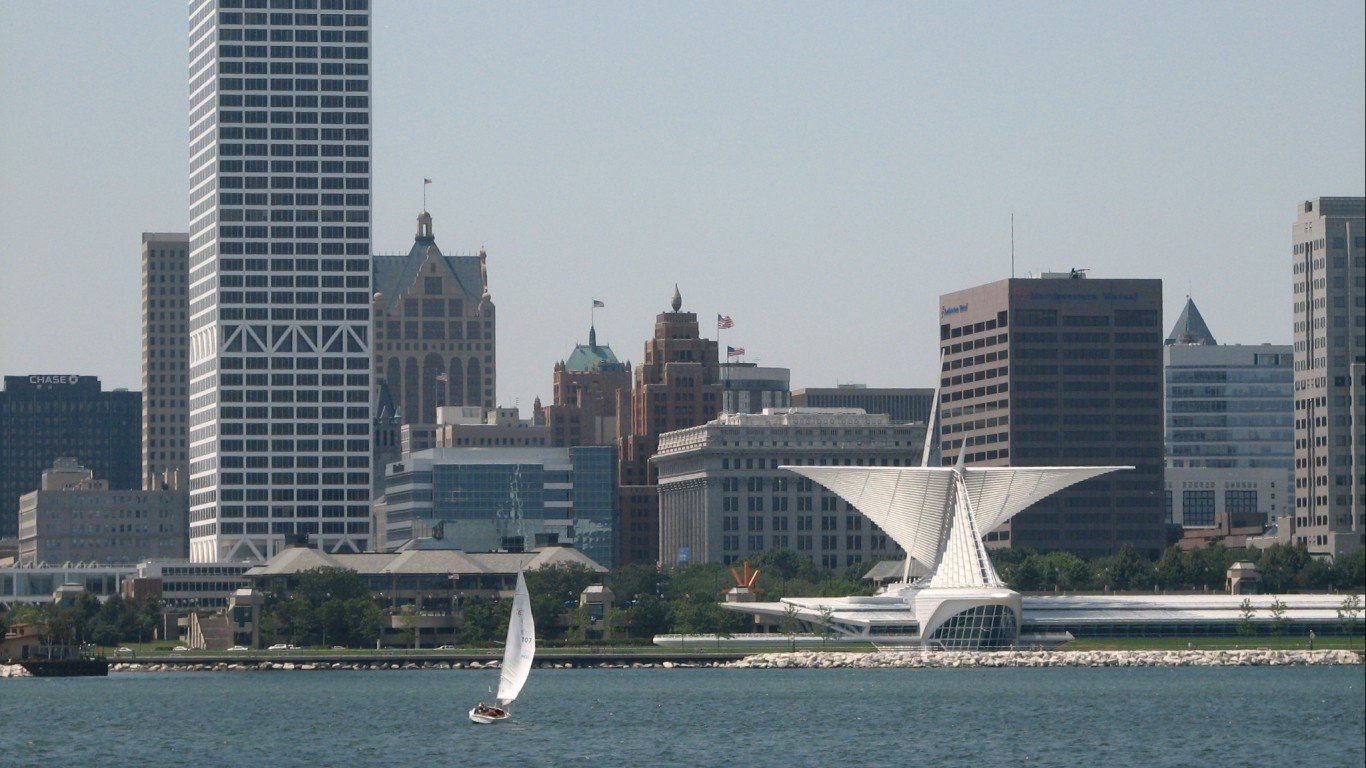
32. Milwaukee, Wisconsin
> Robberies in 2019: 323 per 100,000 people (total: 1,911)
> Share of total robberies in Wisconsin: 63.9% of 2,832
> Poverty rate in 2019: 25.4% — 134 out of 1,898 cities
> Median household income in 2019: $41,838 — 1,468 out of 1,898 cities
> Unemployment rate in 2019: 4.5% — 276 out of 1,898 cities
[in-text-ad-2]
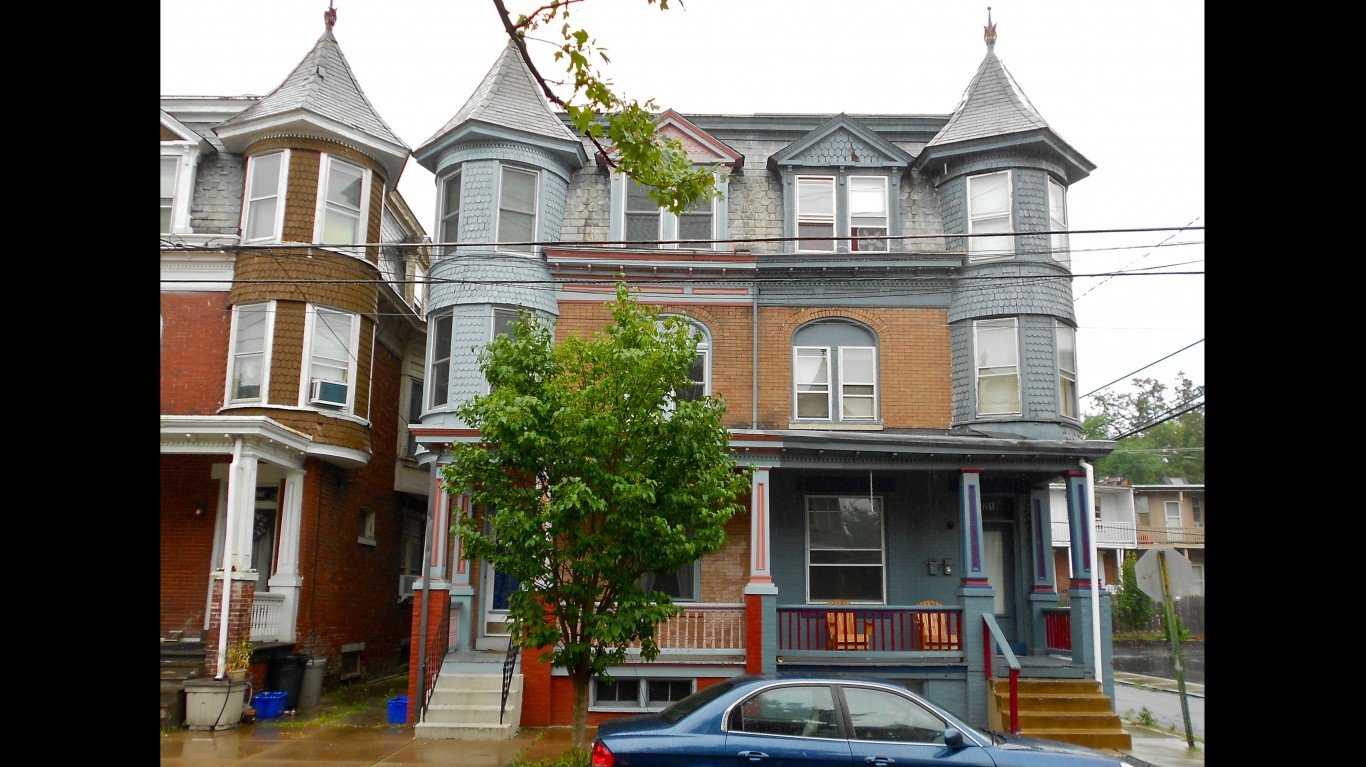
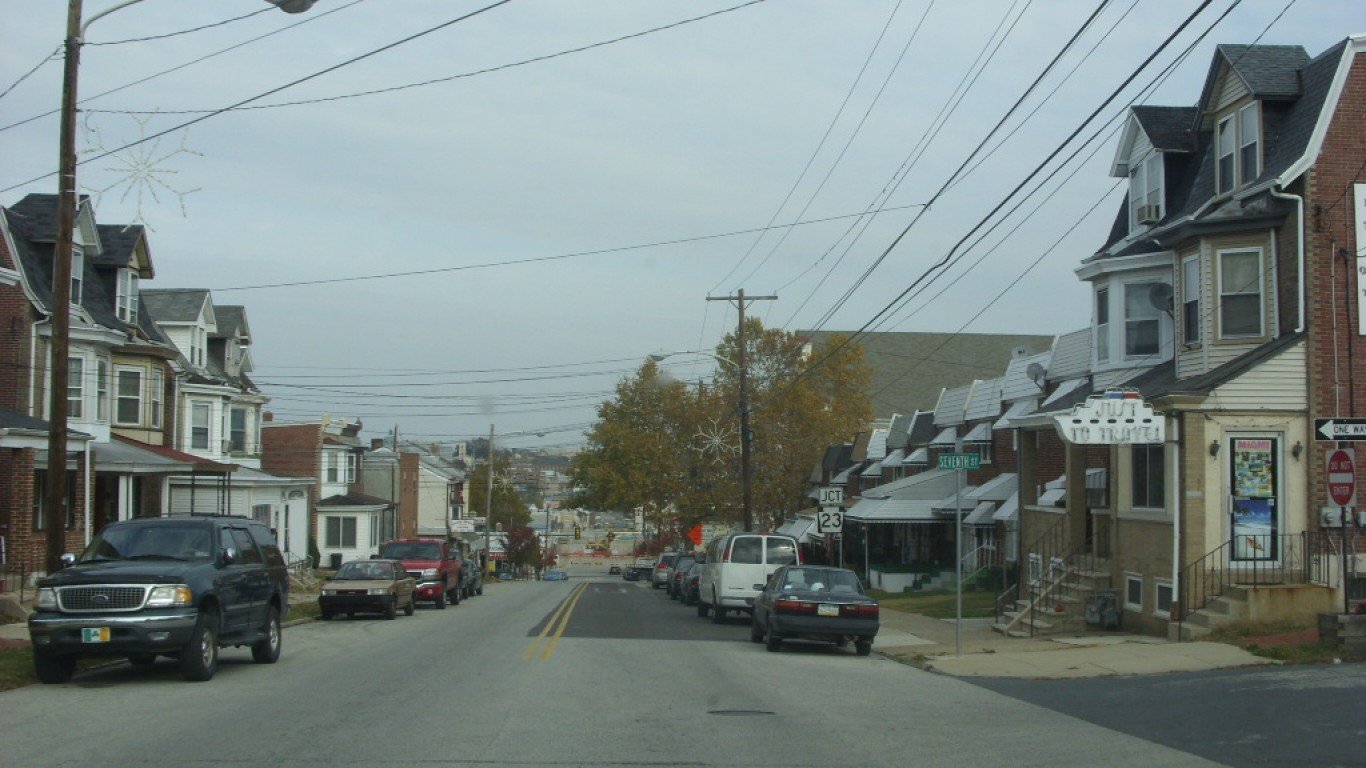
31. Harrisburg, Pennsylvania
> Robberies in 2019: 325 per 100,000 people (total: 160)
> Share of total robberies in Pennsylvania: 1.6% of 1,378
> Poverty rate in 2019: 26.2% — 116 out of 1,898 cities
> Median household income in 2019: $39,685 — 1,530 out of 1,898 cities
> Unemployment rate in 2019: 6.1% — 66 out of 1,898 cities

30. San Pablo, California
> Robberies in 2019: 326 per 100,000 people (total: 102)
> Share of total robberies in California: 0.2% of 45,873
> Poverty rate in 2019: 16.3% — 510 out of 1,898 cities
> Median household income in 2019: $53,198 — 1,102 out of 1,898 cities
> Unemployment rate in 2019: 3.4% — 669 out of 1,898 cities
[in-text-ad]

29. Forest Park, Georgia
> Robberies in 2019: 326 per 100,000 people (total: 66)
> Share of total robberies in Georgia: 0.8% of 949
> Poverty rate in 2019: 26.2% — 116 out of 1,898 cities
> Median household income in 2019: $36,792 — 1,577 out of 1,898 cities
> Unemployment rate in 2019: Not applicable
[recirclink id=844081]
28. Inglewood, California
> Robberies in 2019: 327 per 100,000 people (total: 358)
> Share of total robberies in California: 0.7% of 45,873
> Poverty rate in 2019: 16.8% — 476 out of 1,898 cities
> Median household income in 2019: $54,400 — 1,050 out of 1,898 cities
> Unemployment rate in 2019: 5.3% — 137 out of 1,898 cities

27. Washington, District Of Columbia
> Robberies in 2019: 334 per 100,000 people (total: 2,359)
> Share of total robberies in District Of Columbia: Not applicable
> Poverty rate in 2019: 16.2% — 516 out of 1,898 cities
> Median household income in 2019: $86,420 — 365 out of 1,898 cities
> Unemployment rate in 2019: 5.5% — 105 out of 1,898 cities
[in-text-ad-2]

26. Barstow, California
> Robberies in 2019: 340 per 100,000 people (total: 82)
> Share of total robberies in California: 0.2% of 45,873
> Poverty rate in 2019: 35.3% — 16 out of 1,898 cities
> Median household income in 2019: $40,633 — 1,505 out of 1,898 cities
> Unemployment rate in 2019: Not applicable

25. San Francisco, California
> Robberies in 2019: 345 per 100,000 people (total: 3,055)
> Share of total robberies in California: 5.8% of 45,873
> Poverty rate in 2019: 10.3% — 963 out of 1,898 cities
> Median household income in 2019: $112,449 — 119 out of 1,898 cities
> Unemployment rate in 2019: 2.2% — 1,392 out of 1,898 cities
[in-text-ad]
24. Irvington, New Jersey
> Robberies in 2019: 352 per 100,000 people (total: 190)
> Share of total robberies in New Jersey: 3.3% of 5,611
> Poverty rate in 2019: Not applicable
> Median household income in 2019: Not applicable
> Unemployment rate in 2019: Not applicable
[recirclink id=843016]

23. El Cerrito, California
> Robberies in 2019: 352 per 100,000 people (total: 91)
> Share of total robberies in California: 0.2% of 45,873
> Poverty rate in 2019: 8.5% — 1,122 out of 1,898 cities
> Median household income in 2019: $108,298 — 157 out of 1,898 cities
> Unemployment rate in 2019: 2.4% — 1,330 out of 1,898 cities

22. Detroit, Michigan
> Robberies in 2019: 354 per 100,000 people (total: 2,346)
> Share of total robberies in Michigan: 43.9% of 4,963
> Poverty rate in 2019: 35.0% — 18 out of 1,898 cities
> Median household income in 2019: $30,894 — 1,632 out of 1,898 cities
> Unemployment rate in 2019: 8.8% — 15 out of 1,898 cities
[in-text-ad-2]
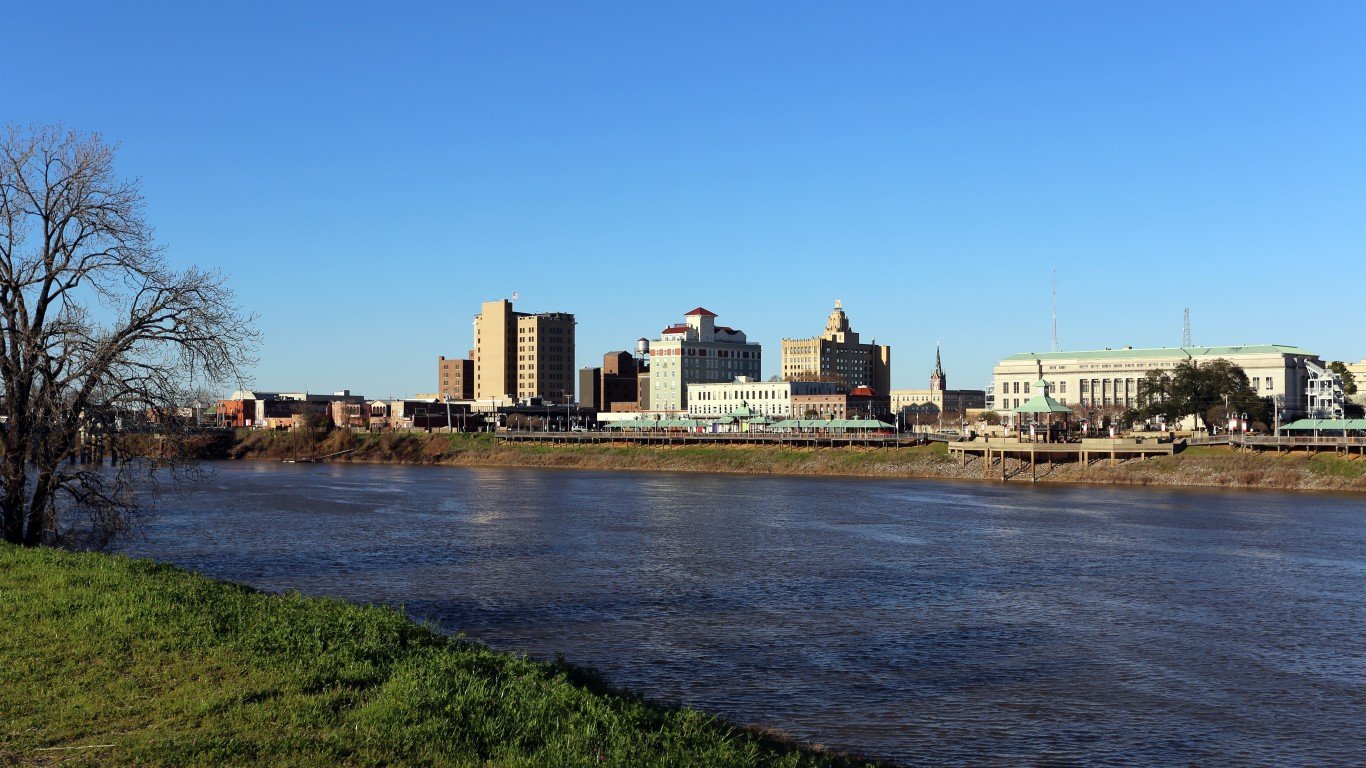
21. Monroe, Louisiana
> Robberies in 2019: 358 per 100,000 people (total: 171)
> Share of total robberies in Louisiana: 4.2% of 2,962
> Poverty rate in 2019: 36.8% — 14 out of 1,898 cities
> Median household income in 2019: $30,438 — 1,633 out of 1,898 cities
> Unemployment rate in 2019: 6.4% — 54 out of 1,898 cities

20. Trenton, New Jersey
> Robberies in 2019: 359 per 100,000 people (total: 300)
> Share of total robberies in New Jersey: 5.2% of 5,611
> Poverty rate in 2019: 28.7% — 76 out of 1,898 cities
> Median household income in 2019: $35,402 — 1,595 out of 1,898 cities
> Unemployment rate in 2019: 5.5% — 105 out of 1,898 cities
[in-text-ad]

19. Tukwila, Washington
> Robberies in 2019: 362 per 100,000 people (total: 74)
> Share of total robberies in Washington: 1.4% of 4,259
> Poverty rate in 2019: 17.2% — 458 out of 1,898 cities
> Median household income in 2019: $58,097 — 957 out of 1,898 cities
> Unemployment rate in 2019: Not applicable
[recirclink id=844073]

18. Stockton, California
> Robberies in 2019: 369 per 100,000 people (total: 1,158)
> Share of total robberies in California: 2.2% of 45,873
> Poverty rate in 2019: 17.9% — 419 out of 1,898 cities
> Median household income in 2019: $54,614 — 1,043 out of 1,898 cities
> Unemployment rate in 2019: 6.8% — 40 out of 1,898 cities
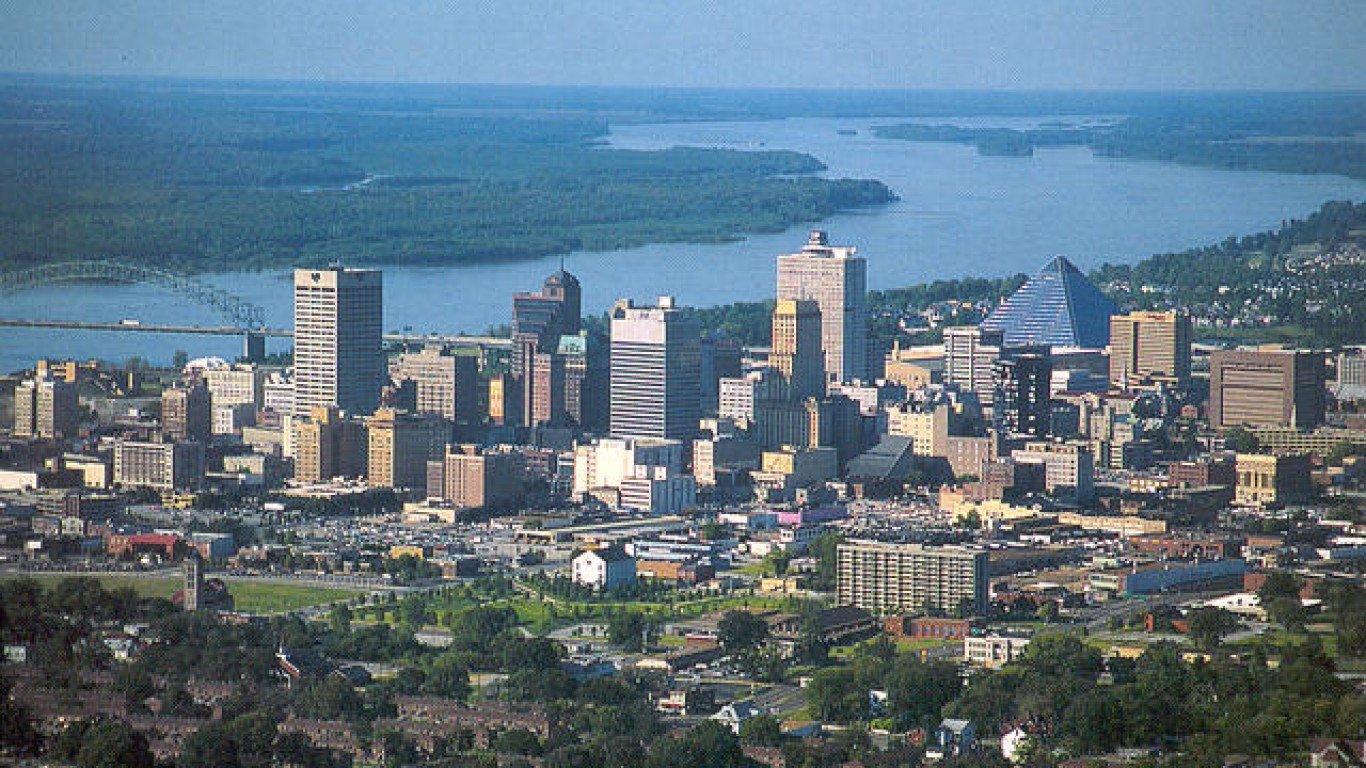
17. Memphis, Tennessee
> Robberies in 2019: 374 per 100,000 people (total: 2,432)
> Share of total robberies in Tennessee: 39.5% of 5,818
> Poverty rate in 2019: 25.1% — 140 out of 1,898 cities
> Median household income in 2019: $41,228 — 1,489 out of 1,898 cities
> Unemployment rate in 2019: 4.4% — 294 out of 1,898 cities
[in-text-ad-2]
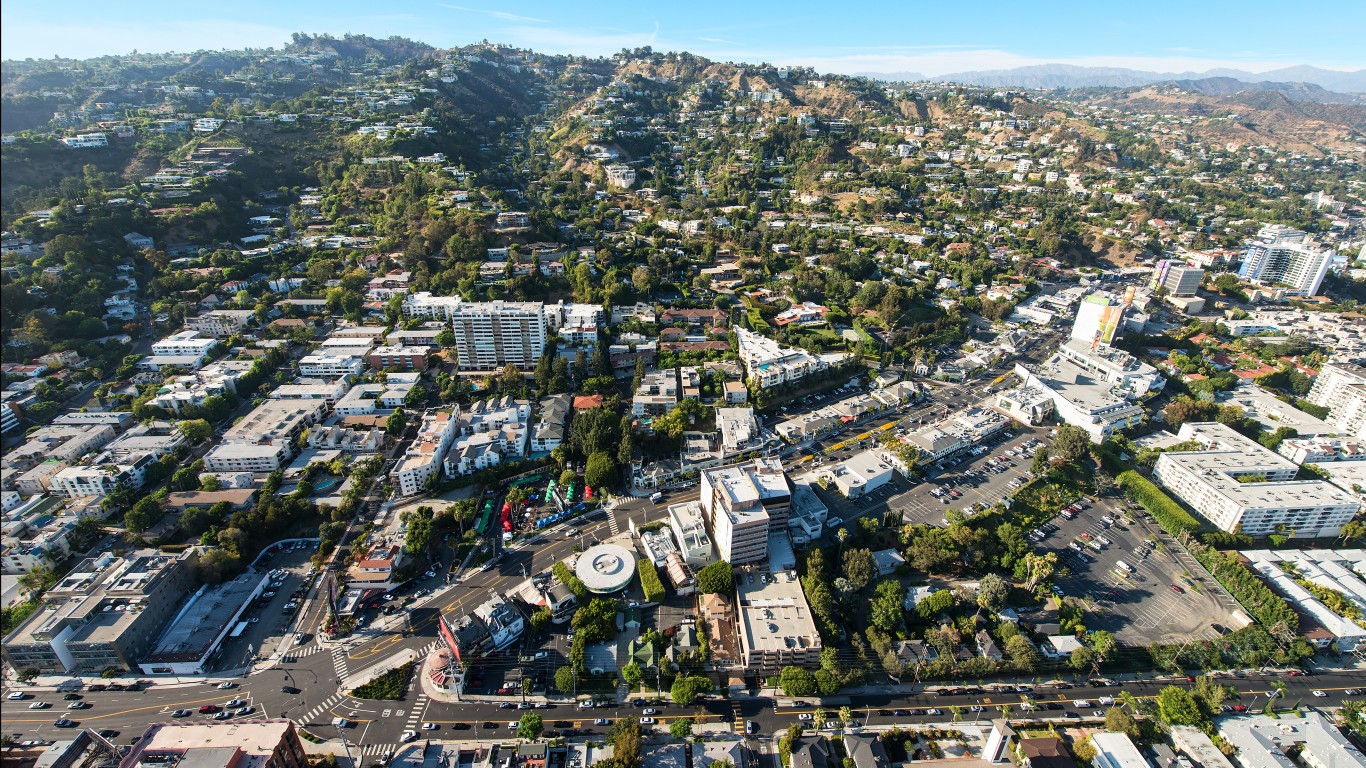
16. West Hollywood, California
> Robberies in 2019: 374 per 100,000 people (total: 139)
> Share of total robberies in California: 0.3% of 45,873
> Poverty rate in 2019: 11.7% — 853 out of 1,898 cities
> Median household income in 2019: $74,044 — 568 out of 1,898 cities
> Unemployment rate in 2019: 4.9% — 210 out of 1,898 cities
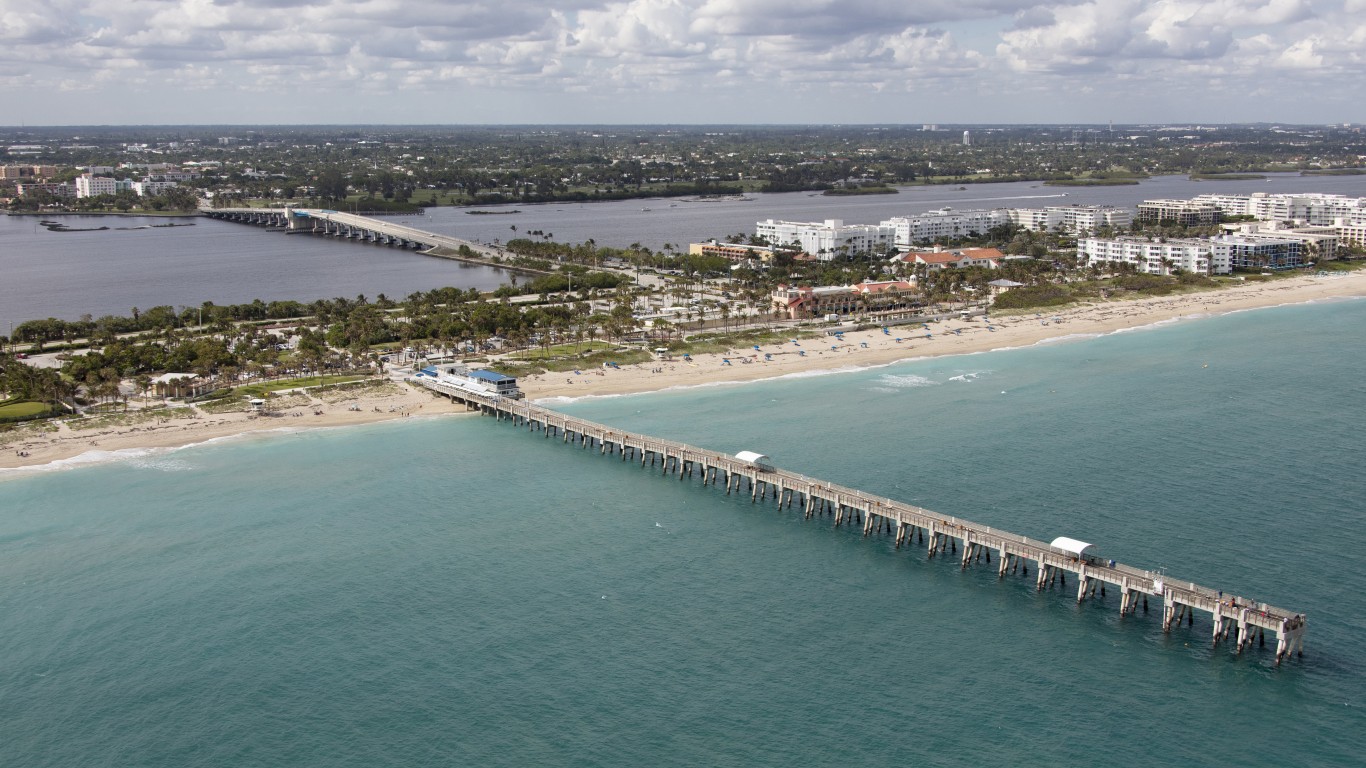
15. Lake Worth, Florida
> Robberies in 2019: 375 per 100,000 people (total: 145)
> Share of total robberies in Florida: 0.9% of 10,543
> Poverty rate in 2019: 24.4% — 155 out of 1,898 cities
> Median household income in 2019: $42,500 — 1,451 out of 1,898 cities
> Unemployment rate in 2019: 3.3% — 730 out of 1,898 cities
[in-text-ad]

14. Gallup, New Mexico
> Robberies in 2019: 383 per 100,000 people (total: 84)
> Share of total robberies in New Mexico: 3.6% of 2,012
> Poverty rate in 2019: 28.4% — 81 out of 1,898 cities
> Median household income in 2019: $48,065 — 1,277 out of 1,898 cities
> Unemployment rate in 2019: Not applicable
[recirclink id=843553]

13. Houston, Texas
> Robberies in 2019: 388 per 100,000 people (total: 9,147)
> Share of total robberies in Texas: 31.6% of 25,162
> Poverty rate in 2019: 20.1% — 306 out of 1,898 cities
> Median household income in 2019: $52,338 — 1,131 out of 1,898 cities
> Unemployment rate in 2019: 3.7% — 526 out of 1,898 cities

12. San Bernardino, California
> Robberies in 2019: 418 per 100,000 people (total: 906)
> Share of total robberies in California: 1.7% of 45,873
> Poverty rate in 2019: 26.0% — 124 out of 1,898 cities
> Median household income in 2019: $45,834 — 1,352 out of 1,898 cities
> Unemployment rate in 2019: 4.8% — 228 out of 1,898 cities
[in-text-ad-2]
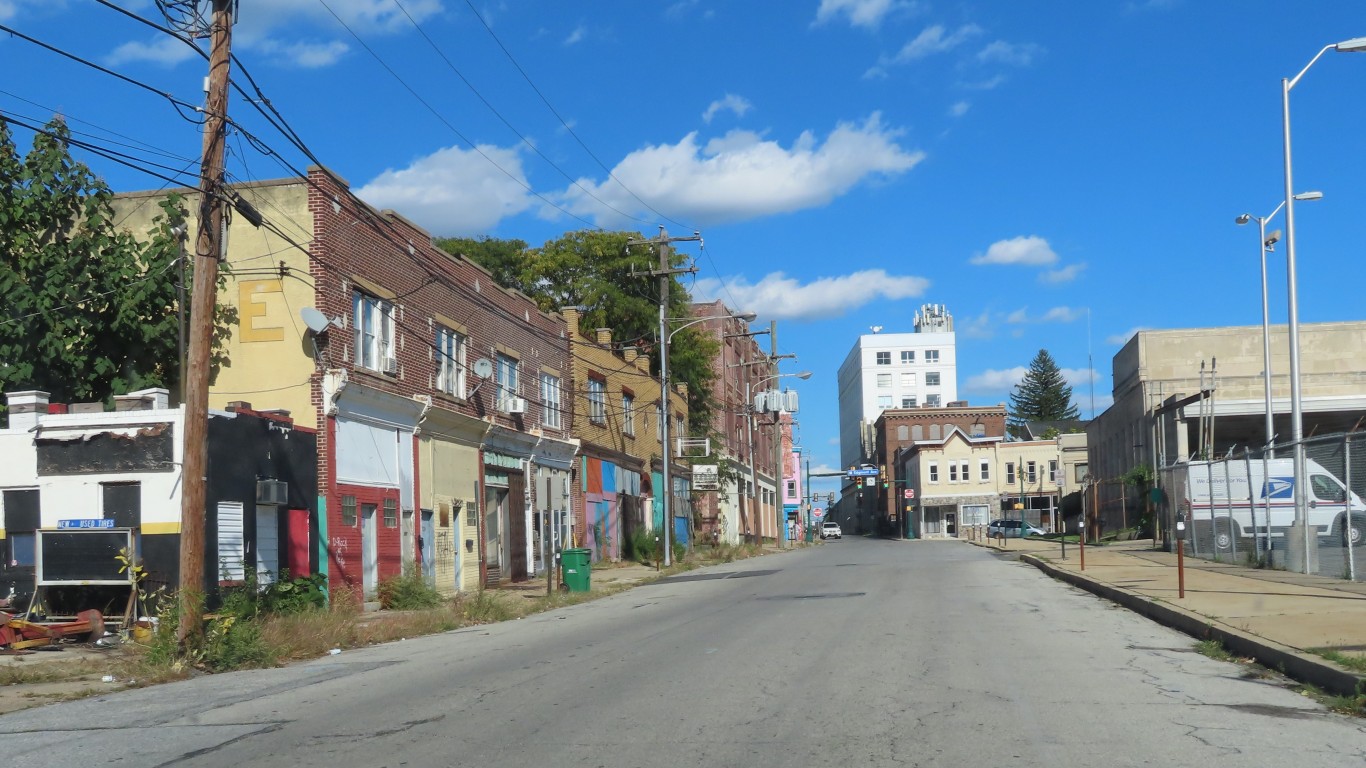
11. Chester, Pennsylvania
> Robberies in 2019: 419 per 100,000 people (total: 142)
> Share of total robberies in Pennsylvania: 1.5% of 1,378
> Poverty rate in 2019: 31.4% — 36 out of 1,898 cities
> Median household income in 2019: $32,403 — 1,621 out of 1,898 cities
> Unemployment rate in 2019: 7.6% — 25 out of 1,898 cities
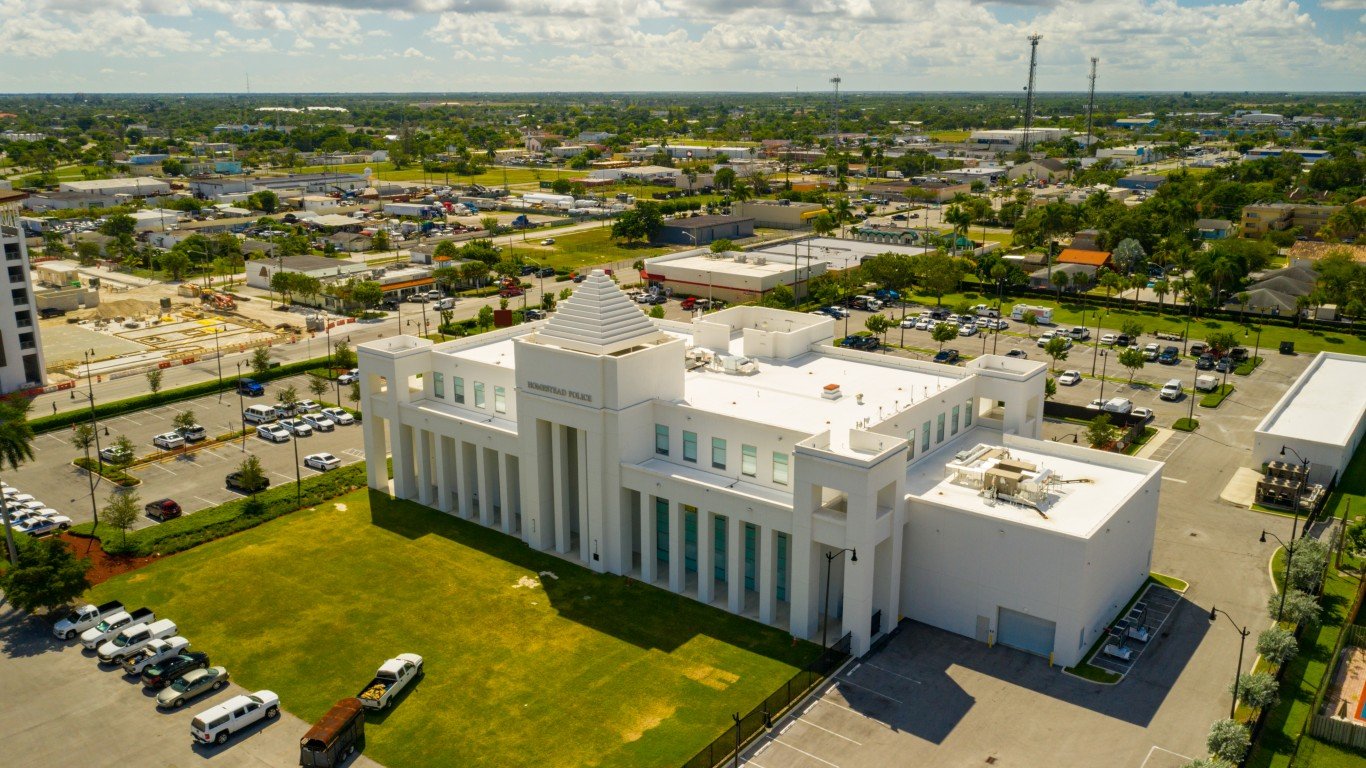
10. Homestead, Florida
> Robberies in 2019: 422 per 100,000 people (total: 303)
> Share of total robberies in Florida: 1.9% of 10,543
> Poverty rate in 2019: 23.8% — 178 out of 1,898 cities
> Median household income in 2019: $47,508 — 1,300 out of 1,898 cities
> Unemployment rate in 2019: 2.9% — 1,021 out of 1,898 cities
[in-text-ad]
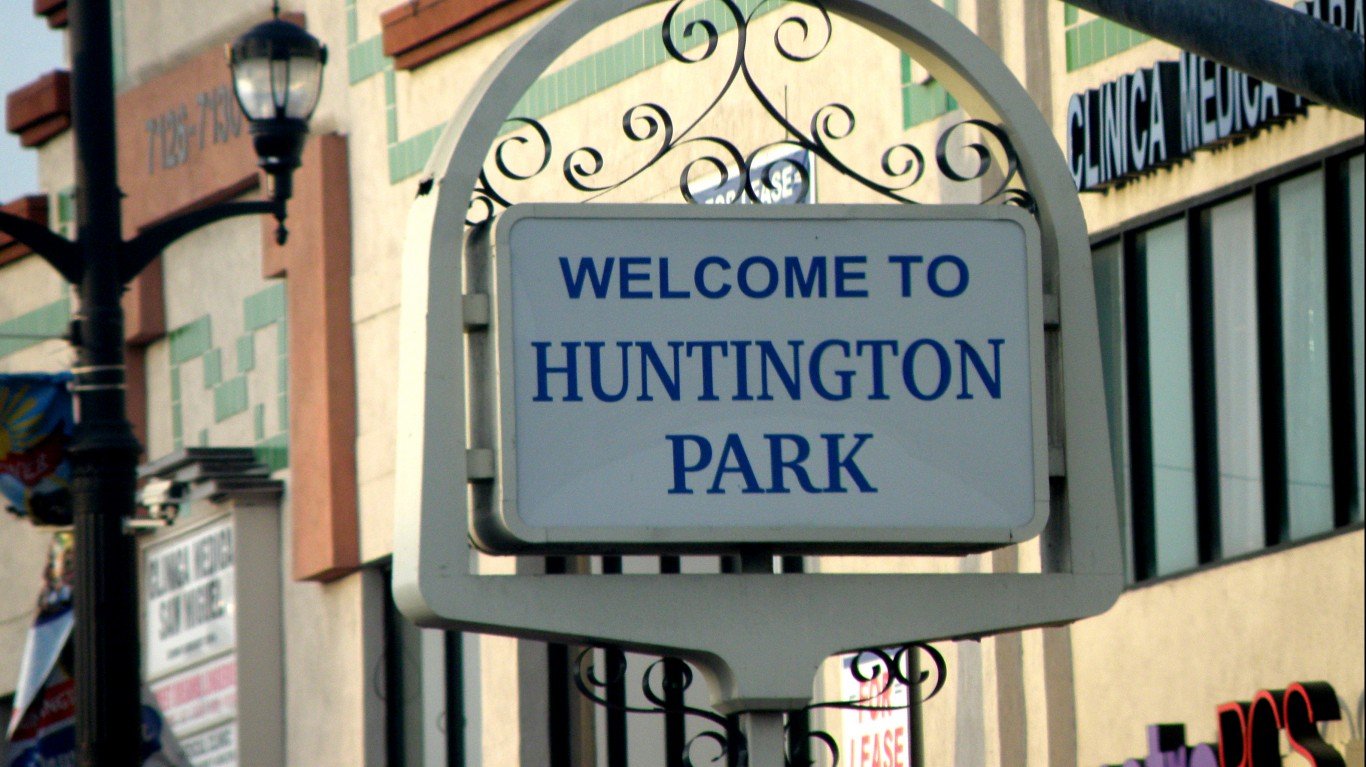
9. Huntington Park, California
> Robberies in 2019: 428 per 100,000 people (total: 249)
> Share of total robberies in California: 0.5% of 45,873
> Poverty rate in 2019: 23.6% — 185 out of 1,898 cities
> Median household income in 2019: $42,447 — 1,453 out of 1,898 cities
> Unemployment rate in 2019: 4.4% — 294 out of 1,898 cities
[recirclink id=844081]
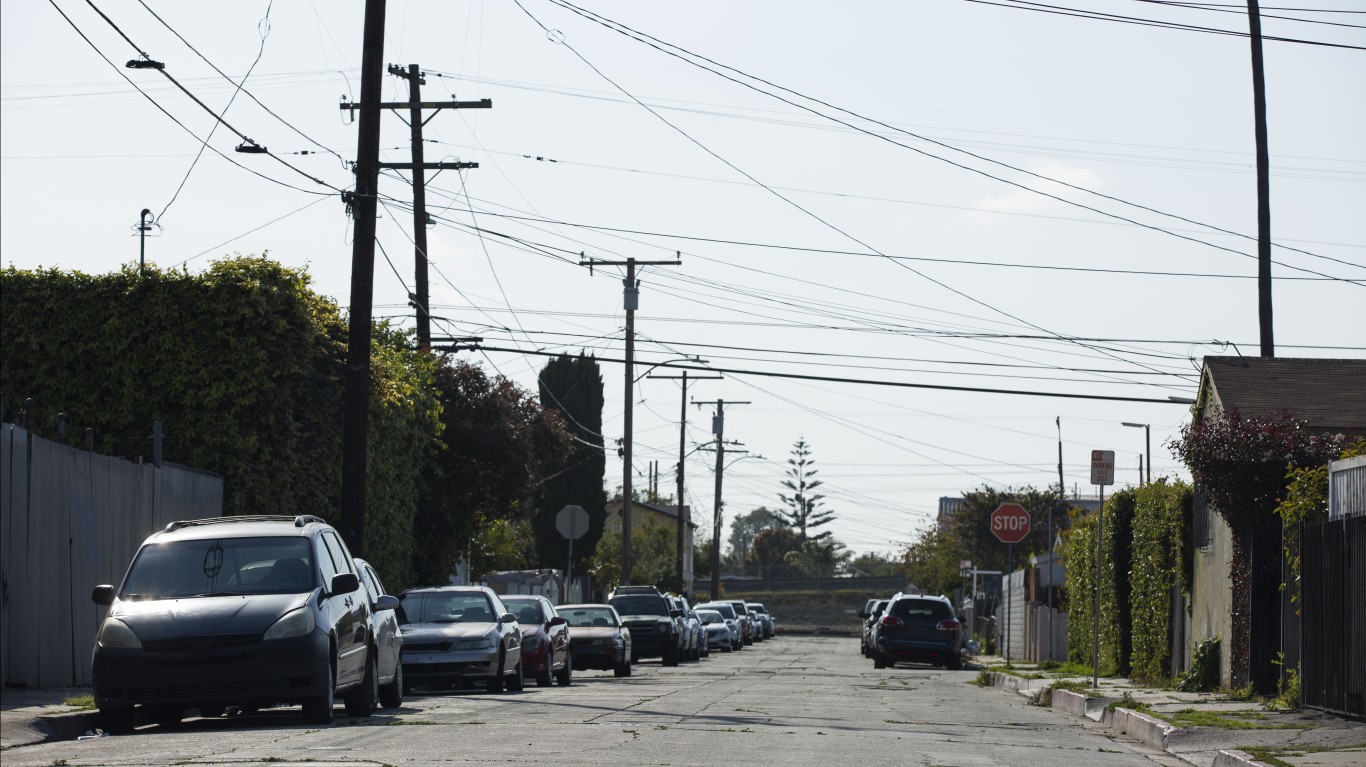
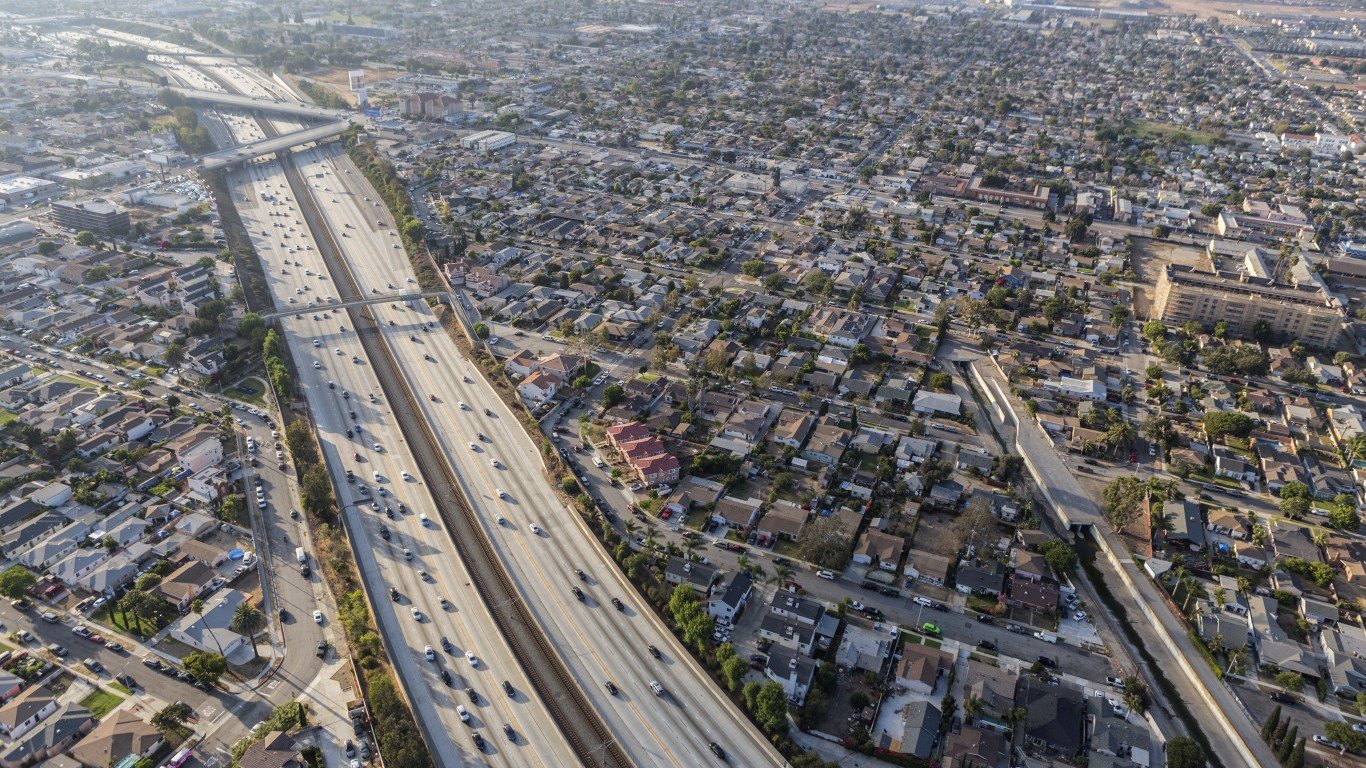
8. Compton, California
> Robberies in 2019: 442 per 100,000 people (total: 427)
> Share of total robberies in California: 0.8% of 45,873
> Poverty rate in 2019: 20.5% — 289 out of 1,898 cities
> Median household income in 2019: $52,883 — 1,109 out of 1,898 cities
> Unemployment rate in 2019: 6.1% — 66 out of 1,898 cities

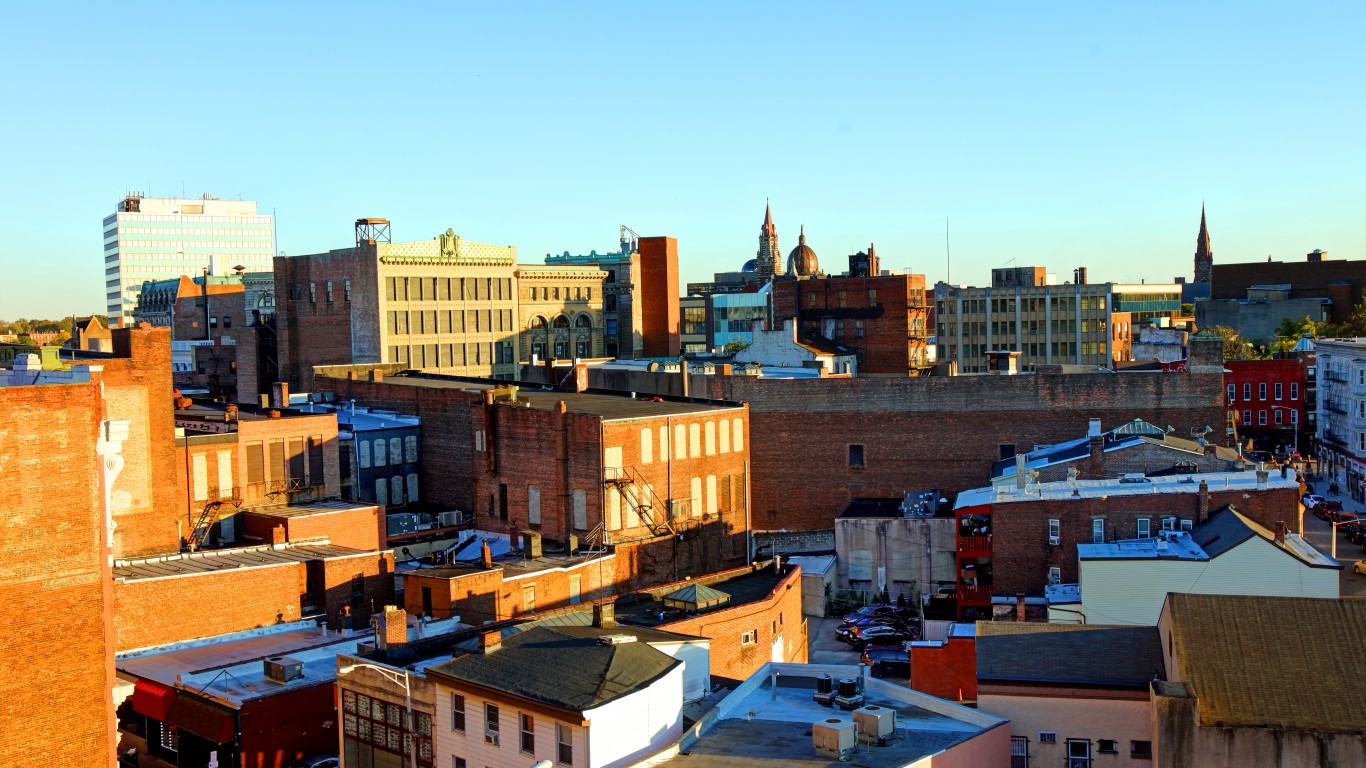
7. Wilmington, Delaware
> Robberies in 2019: 462 per 100,000 people (total: 326)
> Share of total robberies in Delaware: 41.3% of 493
> Poverty rate in 2019: 26.0% — 124 out of 1,898 cities
> Median household income in 2019: $45,032 — 1,380 out of 1,898 cities
> Unemployment rate in 2019: 5.5% — 105 out of 1,898 cities
[in-text-ad-2]
6. Bridgeton, New Jersey
> Robberies in 2019: 469 per 100,000 people (total: 114)
> Share of total robberies in New Jersey: 2.0% of 5,611
> Poverty rate in 2019: 31.2% — 39 out of 1,898 cities
> Median household income in 2019: $37,804 — 1,560 out of 1,898 cities
> Unemployment rate in 2019: 6.4% — 54 out of 1,898 cities
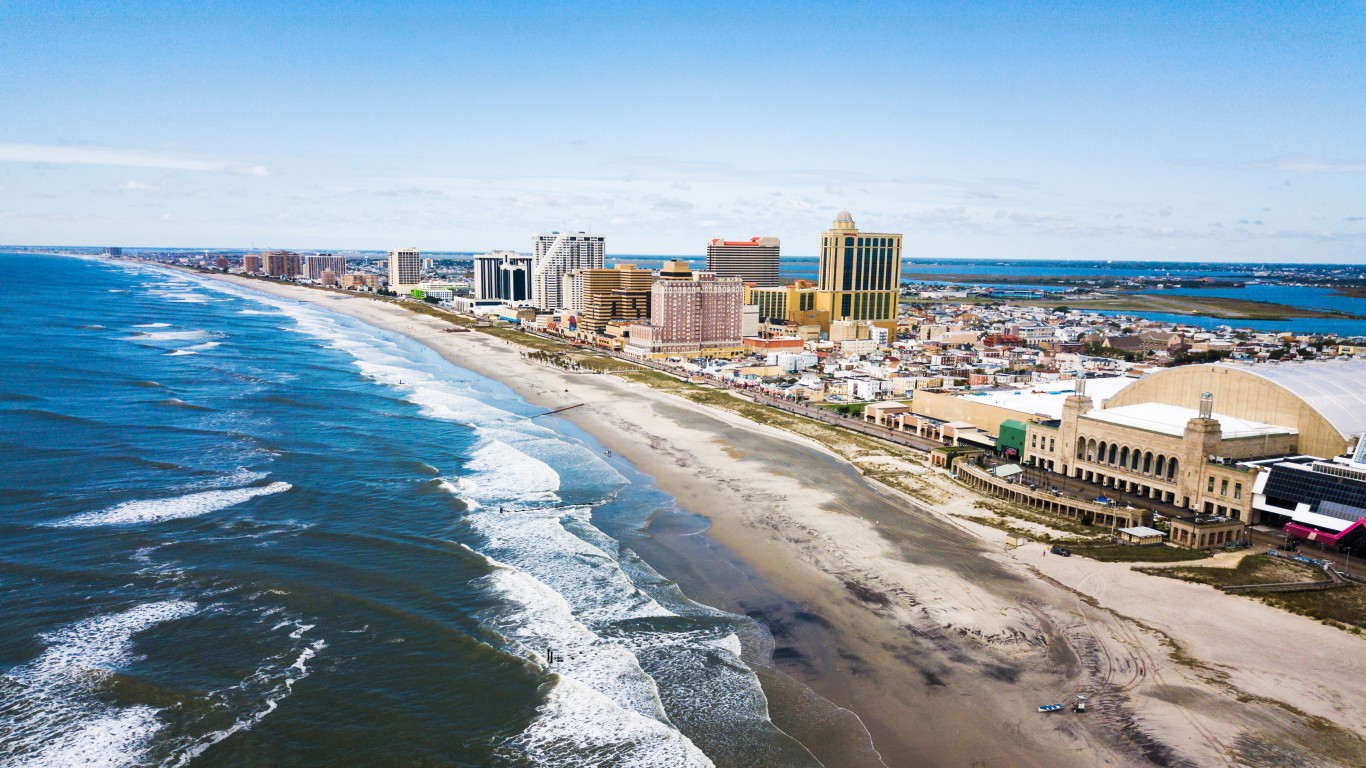
5. Atlantic City, New Jersey
> Robberies in 2019: 484 per 100,000 people (total: 182)
> Share of total robberies in New Jersey: 3.2% of 5,611
> Poverty rate in 2019: 37.1% — 13 out of 1,898 cities
> Median household income in 2019: $29,232 — 1,637 out of 1,898 cities
> Unemployment rate in 2019: 7.1% — 35 out of 1,898 cities
[in-text-ad]

4. St. Louis, Missouri
> Robberies in 2019: 491 per 100,000 people (total: 1,475)
> Share of total robberies in Missouri: 29.7% of 4,165
> Poverty rate in 2019: 21.8% — 246 out of 1,898 cities
> Median household income in 2019: $43,896 — 1,415 out of 1,898 cities
> Unemployment rate in 2019: 3.9% — 453 out of 1,898 cities
[recirclink id=843016]

3. Cleveland, Ohio
> Robberies in 2019: 496 per 100,000 people (total: 1,895)
> Share of total robberies in Ohio: 21.4% of 7,889
> Poverty rate in 2019: 32.7% — 28 out of 1,898 cities
> Median household income in 2019: $30,907 — 1,631 out of 1,898 cities
> Unemployment rate in 2019: 5.2% — 152 out of 1,898 cities

2. Oakland, California
> Robberies in 2019: 659 per 100,000 people (total: 2,859)
> Share of total robberies in California: 5.5% of 45,873
> Poverty rate in 2019: 16.7% — 486 out of 1,898 cities
> Median household income in 2019: $73,692 — 573 out of 1,898 cities
> Unemployment rate in 2019: 3.4% — 669 out of 1,898 cities
[in-text-ad-2]

1. Baltimore, Maryland
> Robberies in 2019: 813 per 100,000 people (total: 4,856)
> Share of total robberies in Maryland: 52.8% of 5,681
> Poverty rate in 2019: 21.2% — 267 out of 1,898 cities
> Median household income in 2019: $50,379 — 1,195 out of 1,898 cities
> Unemployment rate in 2019: 5.1% — 167 out of 1,898 cities
Contact [email protected] for any questions or corrections.