
Population growth has slowed in the U.S. in recent years. The U.S. population increased by just 0.48% from 2018 to 328.2 million people in 2019, the slowest growth in a century. While the U.S. grew, many parts of the country actually shrank, losing a significant share of their population mostly to residents moving away.
There are dozens of major metro areas across the country whose population contracted by at least 4%. While some of the population decline was through natural changes — births minus deaths — the majority was through net migration as many more residents packed up their belongings and moved away than moved to the area.
To determine America’s fastest shrinking cities, 24/7 Wall St. reviewed data from the U.S. Census Bureau’s Population and Housing Estimates Program to find the metropolitan statistical areas that lost the largest percentage of their total population from July 1, 2010, to July 1, 2019.
Shrinking metro areas tend to struggle economically. Of the 26 metro areas on this list, just one has a 2019 median household income greater than the U.S. median of $65,712, and just three have a 2019 poverty rate lower than the U.S. rate of 12.3%. Residents often leave economically depressed areas in search of places with better jobs and higher incomes. These are the cities with the lowest poverty rates.
Most of the metro areas on this list are in the Rust Belt region — part of the Midwest in which the economy once relied on manufacturing, but that have struggled as those jobs have dwindled. Many people have abandoned the region, moving south to areas with lower taxes, friendlier business climates, and more economic opportunities. These are the best and worst run states in America.
Click here to see America’s fastest shrinking cities.
Click here to see our methodology.
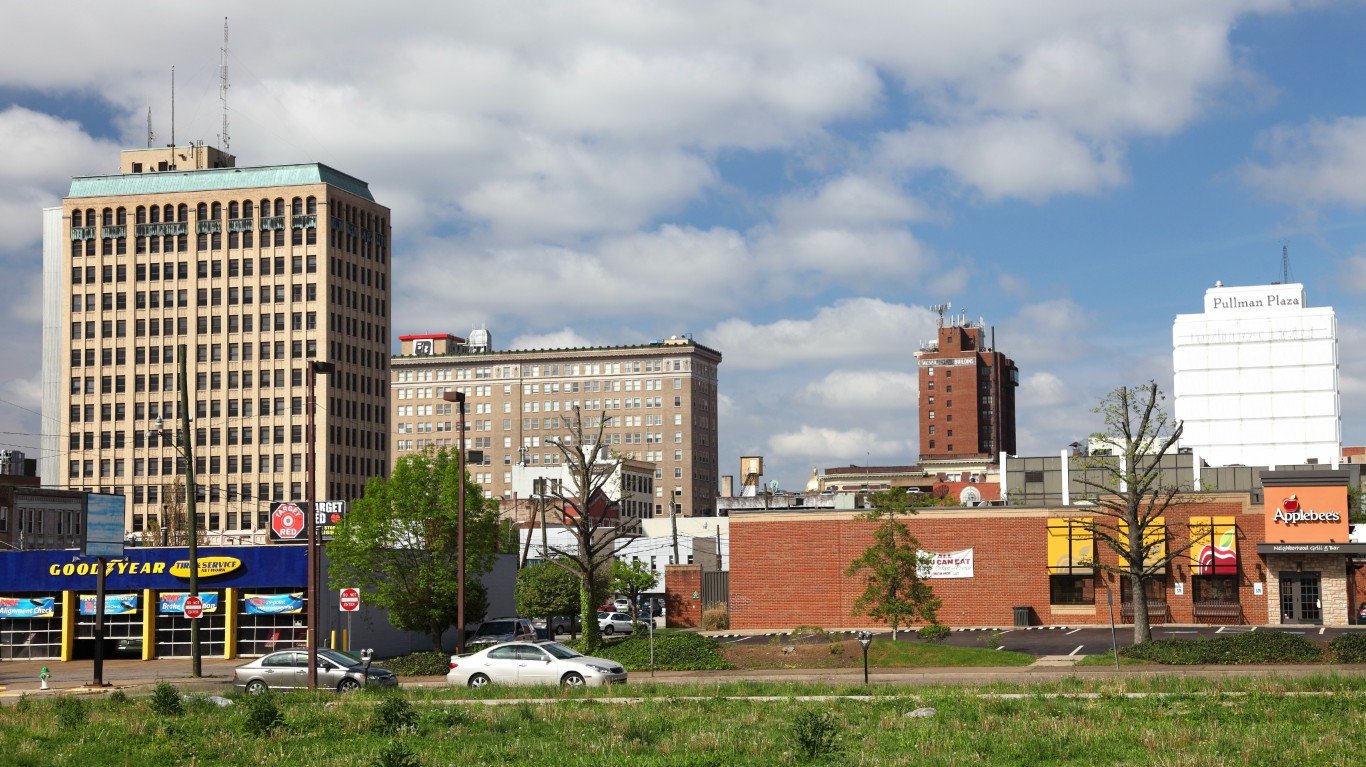
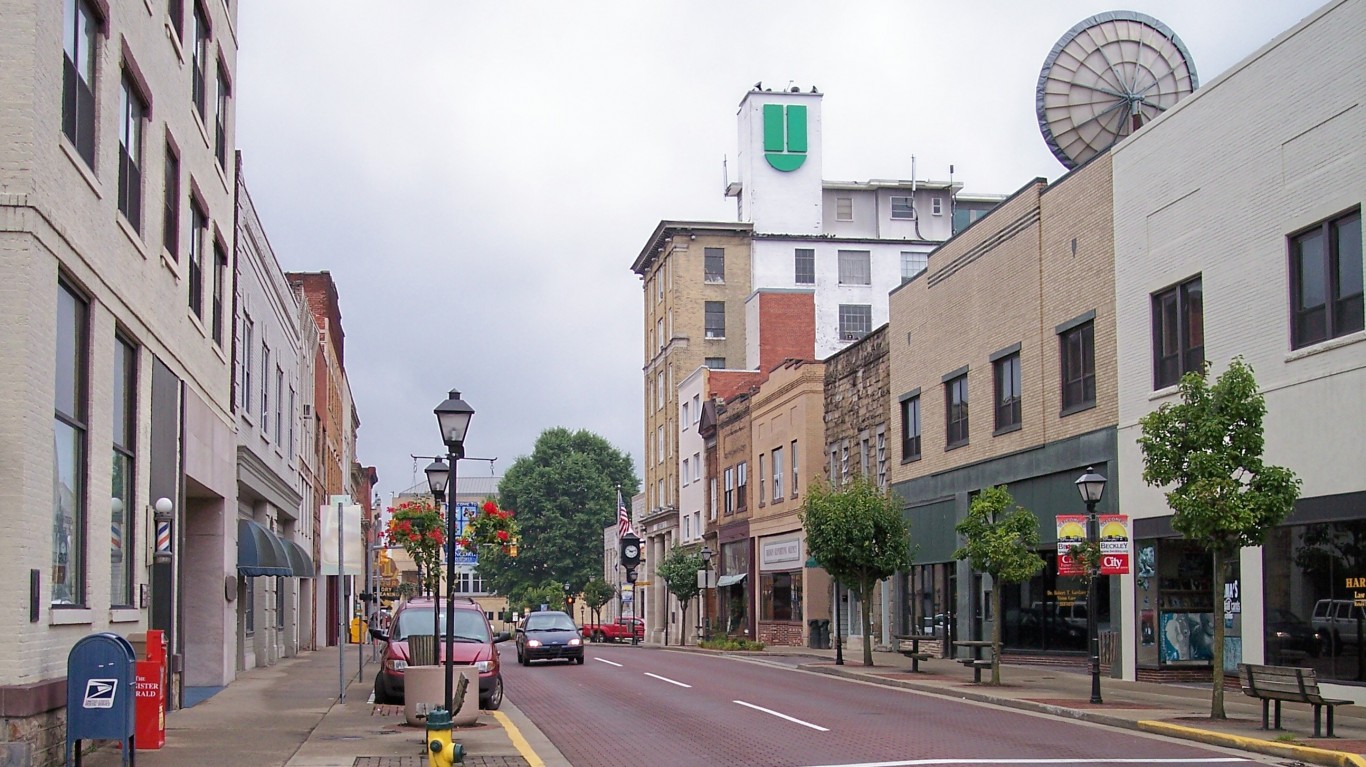
26. Huntington-Ashland, WV-KY-OH
> 2010-2019 pop. change: -4.1% (-15,026)
> 2019 unemployment: 5.0% — 53rd highest out of 383 MSAs
> 2010-2019 employment change: -3.2% — 359th highest out of 383 MSAs
> 2019 median household income: $48,329 — 26.5% below national median
The Huntington-Ashland metro area spans several counties in three states — West Virginia, Kentucky, and Ohio — around the Ohio River. It is one of just 26 major metropolitan areas in the U.S. in which the population fell by more than 4% from 2010 to 2019. Throughout the same decade, the U.S. population grew by 6.3%.
Among the 383 major metro areas in the U.S., just 58 had a negative natural population change during that decade — meaning there were more deaths than births in the area. The Huntington area was one such place, with a natural population decline of almost 3,300 over the decade. When combined with nearly 12,000 residents moving away during that time, the population of Huntington-Ashland fell by more than 15,000 people, or 4.1%.
[in-text-ad]

25. Sierra Vista-Douglas, AZ
> 2010-2019 pop. change: -4.1% (-5,437)
> 2019 unemployment: 5.7% — 17th highest out of 383 MSAs
> 2010-2019 employment change: -7.7% — 377th highest out of 383 MSAs
> 2019 median household income: $48,484 — 26.2% below national median
Population change is often a reflection of economic conditions in a given area as people may go to seek jobs in other locations. The number of people working in the U.S. grew from 139.1 million in 2010 to 157.5 million in 2019 — a 13.3% increase. Yet in the Sierra Vista area in Arizona, the number of workers declined 7.7%, one of the 10 largest decreases in employment out of nearly 400 U.S. metropolitan areas.
The Sierra Vista area consistently had one of the higher unemployment rates throughout the 2010s, and its 2019 median household income of $48,484 was well below the U.S. median that year of $65,712. Its poverty rate of 16.3% in 2019 was also 4 percentage points higher than the U.S. poverty rate.
[recirclink id=840694]
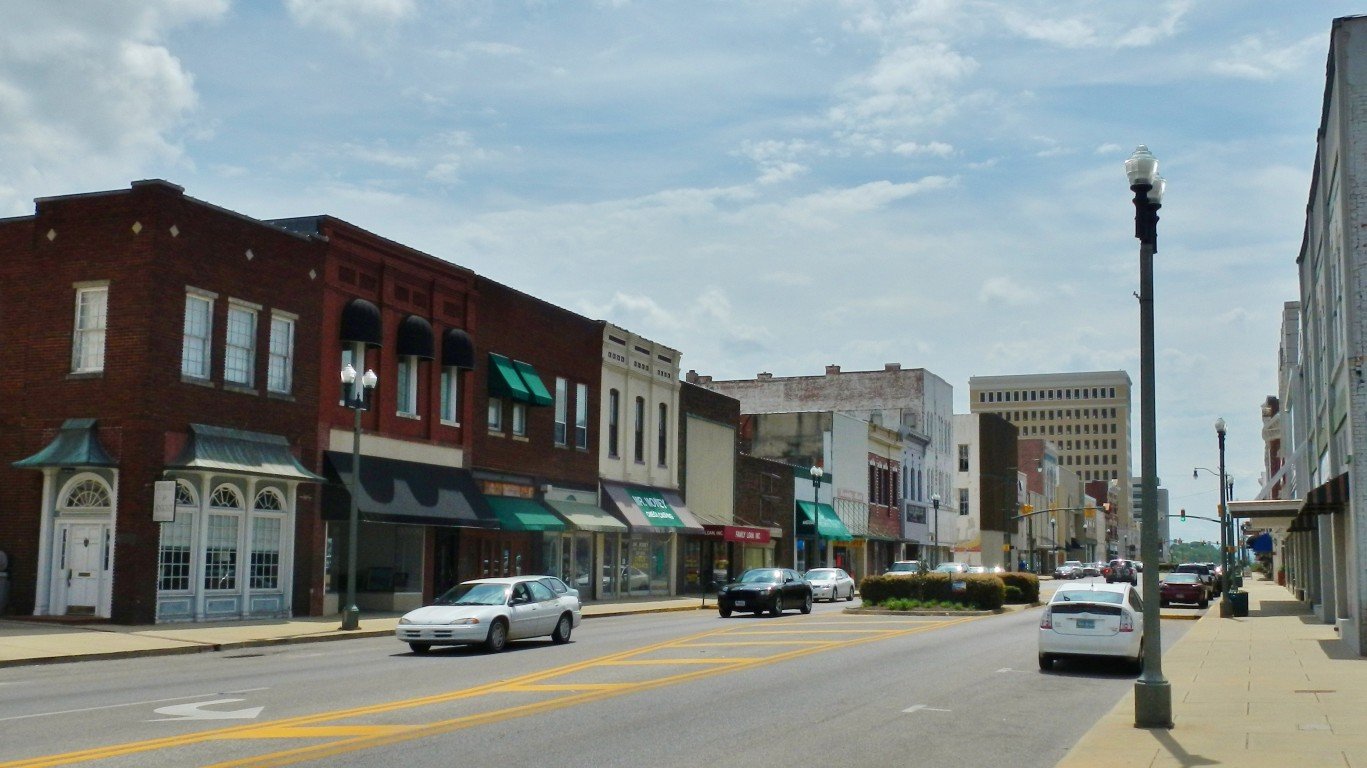
24. Anniston-Oxford, AL
> 2010-2019 pop. change: -4.2% (-4,921)
> 2019 unemployment: 3.5% — 210th highest out of 383 MSAs
> 2010-2019 employment change: -2.5% — 355th highest out of 383 MSAs
> 2019 median household income: $48,156 — 26.7% below national median
There were nearly 5,000 fewer people living in the Anniston-Oxford, Alabama, metro area in 2019 than there were in 2010, a population decline of 4.2%. Like nearly every other metro area on this list, the Anniston area had a relatively low 2019 median household income, at $48,156 — 26.7% lower than the U.S. median. Additionally, 9.6% of households in the area earn less than $10,000 per year, compared to 5.8% of U.S. households overall.
However, even as many residents left the Anniston area, the financial situation has improved significantly over the last decade. While the U.S. poverty rate declined by 3 percentage points from 2010 to 2019, it declined by 7.7 percentage points in the Anniston area. In most cities on this list, the poverty rate either did not decline as much as it did nationwide or increased.

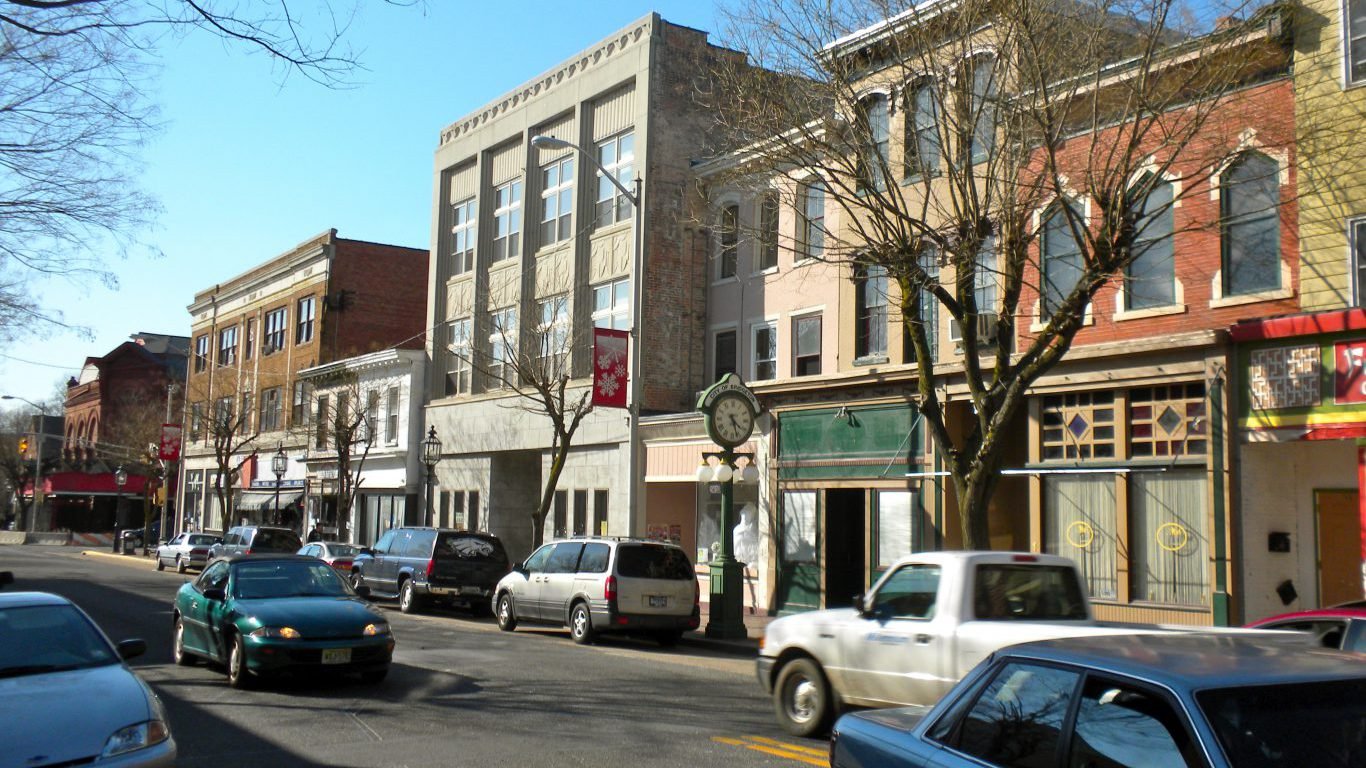
23. Altoona, PA
> 2010-2019 pop. change: -4.2% (-5,288)
> 2019 unemployment: 4.5% — 81st highest out of 383 MSAs
> 2010-2019 employment change: 0.0% — 330th highest out of 383 MSAs
> 2019 median household income: $51,004 — 22.4% below national median
Altoona is one of three metro areas at least partially in Pennsylvania to rank among the fastest shrinking places in America. Unlike nearly every other area on this list, the number of jobs stayed relatively consistent in Altoona over the last decade, even as the population fell by 4.2%.
As the population has declined in the Altoona area, the poverty rate has increased — up 3.3 percentage points from 2010 to 2019, to 15.6%. During that time, the U.S. poverty rate declined from 15.3% to 12.3%. Only five other metro areas had larger poverty rate increases during the decade.
[in-text-ad-2]

22. Bay City, MI
> 2010-2019 pop. change: -4.3% (-4,647)
> 2019 unemployment: 4.7% — 68th highest out of 383 MSAs
> 2010-2019 employment change: -1.3% — 344th highest out of 383 MSAs
> 2019 median household income: $49,610 — 24.5% below national median
Bay City, which gets its name from its proximity to Saginaw Bay, is one of three Michigan metro areas in which the population fell by near nation-leading levels from 2010 to 2019. The area’s natural population decline exceeded 1,400 during that time, and over 3,000 more people left the area than moved to it.
As the U.S. recovered from the 2008 recession, incomes nationwide increased significantly over the last decade, but in Bay City, incomes increased at a far slower pace as did other economic improvements. The U.S. median household income increased 31.3% from 2010 to 2019 to $65,712. In Bay City, incomes increased less than 10% and remained under $50,000.

21. Rocky Mount, NC
> 2010-2019 pop. change: -4.3% (-6,598)
> 2019 unemployment: 5.2% — 44th highest out of 383 MSAs
> 2010-2019 employment change: -2.0% — 351st highest out of 383 MSAs
> 2019 median household income: $46,466 — 29.3% below national median
Each year from 2010 to 2019, Rocky Mount, North Carolina, has consistently had one of the highest unemployment rates in the country, likely prompting some residents to seek economic opportunities elsewhere. The number of people living in the Rocky Mount area fell by nearly 6,600 during the decade, a 4.3% decline.
Factors driving the population decline in Rocky Mount and the surrounding northeastern North Carolina area include a population that skews older and a lack of economic opportunities for younger people, according to demographic analysts.
[in-text-ad]
20. Vineland-Bridgeton, NJ
> 2010-2019 pop. change: -4.5% (-7,100)
> 2019 unemployment: 5.5% — 26th highest out of 383 MSAs
> 2010-2019 employment change: -2.8% — 358th highest out of 383 MSAs
> 2019 median household income: $54,587 — 16.9% below national median
The Vineland-Bridgeton area in southern New Jersey is one of just 11 U.S. metro areas in which home values actually declined over the past decade, from $177,600 in 2010 to $164,900 in 2019. For context, home values nationwide increased 33.7% during that time. The local decline in home values likely reflects both the drop in demand for housing as the area’s population declined as well as the relatively stagnant local incomes growth. Throughout the last decade, incomes grew by only 5.7% in Vineland, compared to a 31.3% increase nationwide. The area’s median annual household income of $54,587 is over $11,000 lower than the U.S. median.
Difficult economic circumstances in an area can often drive residents to seek out opportunities elsewhere. The Vineland-Bridgeton metro area is one of 20 places in the country in which the population fell by at least 4.5% from 2010 to 2019.
[recirclink id=839813]

19. Farmington, NM
> 2010-2019 pop. change: -4.7% (-6,087)
> 2019 unemployment: 5.7% — 17th highest out of 383 MSAs
> 2010-2019 employment change: -1.5% — 347th highest out of 383 MSAs
> 2019 median household income: $44,321 — 32.6% below national median
Farmington, New Mexico, reported a relatively high natural population increase from 2010 to 2019 of nearly 7,000 more births than deaths in the area. Yet this was not enough to offset the roughly 13,000 more people that left the area than moved to it. It is one of just five major metropolitan areas in America in which more than 10% of the population moved away during the 2010s.
Shrinking places like Farmington tend to struggle economically. The northwest New Mexico metro area had one of the 10 lowest 2019 median household incomes out of the 383 metro areas reviewed, at $44,321 — about $21,000 lower than the U.S. median. It is the only metro area in America where incomes actually declined during the decade, falling 1.8% from 2010 to 2019. Incomes in every other metro area increased by at least 3.5%, and the U.S. median annual household income grew over 31%.

18. Flint, MI
> 2010-2019 pop. change: -4.7% (-19,974)
> 2019 unemployment: 4.9% — 59th highest out of 383 MSAs
> 2010-2019 employment change: 7.4% — 232nd highest out of 383 MSAs
> 2019 median household income: $50,389 — 23.3% below national median
From 2010 to 2019, over 24,000 more people left the Flint, Michigan, area than moved to it. Natural growth offset some of that decline as the population fell by more than 4.7%. Flint made national headlines when a botched changeover of the city’s water supply in 2014 caused lead from pipes to leach into the water being sent to area homes.
Though this undoubtedly drove some residents away, Flint’s population contraction was already underway as the area faced similar struggles to many other parts of the Rust Belt. Flint’s unemployment rate has consistently been one of the highest in the nation, and its 2019 poverty rate was 16.5%, well above the U.S. poverty rate of 12.3% for that year.
[in-text-ad-2]

17. Albany, GA
> 2010-2019 pop. change: -4.7% (-7,307)
> 2019 unemployment: 4.3% — 95th highest out of 383 MSAs
> 2010-2019 employment change: 2.1% — 310th highest out of 383 MSAs
> 2019 median household income: $40,625 — 38.2% below national median
The population of the Albany, Georgia, area grew 3.5% due to natural population growth (births minus deaths) from 2010 to 2019. This was roughly in line with the overall U.S. natural population growth, which was 3.8% for the decade. Yet Albany had one of the largest population outflows of any place in the country — nearly 13,000 more people left the area than moved to it during the 2010s, accounting for 8.3% of the population. Overall, the population declined by over 7,300 people during that time, or 4.7%.
Like nearly every other metro area on this list, Albany faces serious economic challenges. It has the 10th highest 2019 poverty rate out of 383 U.S. major metropolitan areas reviewed, as 22.6% of residents live below the poverty line. Nationwide, the poverty rate is 12.3%. Albany also has the second lowest median household income of any metro area, at $40,625 — over $25,000 less than the U.S. median.

16. Saginaw, MI
> 2010-2019 pop. change: -4.8% (-9,630)
> 2019 unemployment: 4.8% — 60th highest out of 383 MSAs
> 2010-2019 employment change: 3.7% — 297th highest out of 383 MSAs
> 2019 median household income: $48,303 — 26.5% below national median
More than 200,000 people lived in the Saginaw, Michigan, metro area in 2010. By 2019, the population dwindled to less than 191,000. This decline of over 9,600 people represents a 4.8% population decrease. For context, the overall U.S. population grew 6.3% during that same timeframe.
Even as the number of Saginaw area residents fell, the number of people working there increased, by 3.7% — up from 79,625 in 2010 to 82,533 in 2019. Despite the increase in jobs, the area is still struggling economically. From 2010 to 2019, Saginaw’s median household income increased 15.2%, less than half of the comparable U.S. increase. Also, the area’s poverty rate increased 2.1 percentage points, the 12th largest increase of any area. Nationwide, the poverty rate decreased by 3.0 percentage points during that decade.
[in-text-ad]

15. Pittsfield, MA
> 2010-2019 pop. change: -4.8% (-6,330)
> 2019 unemployment: 3.7% — 169th highest out of 383 MSAs
> 2010-2019 employment change: 1.9% — 315th highest out of 383 MSAs
> 2019 median household income: $58,895 — 10.4% below national median
The Pittsfield metro area is the only part of Massachusetts, or even the broader New England region, to rank among the fastest shrinking places in America. From 2010 to 2019, the Pittsfield area population fell by over 6,300, or 4.8%.
The Pittsfield area stands out among other places with rapidly declining populations because it has many positive economic indicators. Each year throughout the 2010s, the area’s unemployment rate has been lower than the U.S. rate, and its 2019 poverty rate of 10.8% is below the U.S. rate of 12.3%. Pittsfield’s median household income also increased more than the U.S. increase during that decade, yet the typical household still earns under $59,000 a year, well below the U.S. median of $65,712.
[recirclink id=839643]

14. Binghamton, NY
> 2010-2019 pop. change: -5.2% (-13,033)
> 2019 unemployment: 4.6% — 72nd highest out of 383 MSAs
> 2010-2019 employment change: -11.0% — 381st highest out of 383 MSAs
> 2019 median household income: $53,768 — 18.2% below national median
The Binghamton area of New York is one of just 14 major metro areas in the country in which the population declined by more than 5% from 2010 to 2019. During that time, the nationwide population grew 6.3%. The population decline hastened in the second half of the decade, with the area losing almost twice as many people from 2014 to 2019 as from 2010 to 2014.
Few job markets in the country have struggled quite as severely as Binghamton’s has in the last decade. The number of workers dropped by about 12,500 from 2010 to 2019, or 11%. Only two other metro areas lost a larger share of their jobs.

13. Youngstown-Warren-Boardman, OH-PA
> 2010-2019 pop. change: -5.2% (-29,701)
> 2019 unemployment: 5.7% — 17th highest out of 383 MSAs
> 2010-2019 employment change: -4.7% — 365th highest out of 383 MSAs
> 2019 median household income: $48,558 — 26.1% below national median
With over 500,000 people, the Youngstown-Warren-Boardman area around the Ohio-Pennsylvania border is the largest metro area to appear on this list. The area’s population fell from just under 566,000 in 2010 to about 536,000 in 2019. The nearly 30,000 population drop is the largest total decline of any U.S. metro area over that time. Unlike many other cities on this list, the decline was somewhat evenly split between natural population decline and net migration.
While incomes increased nationwide by 31.3% during the 2010s, the Youngstown area did not experience the economic progress the rest of the country did. The area’s median household income actually declined by 4.7%, down to $48,558.
[in-text-ad-2]

12. Ocean City, NJ
> 2010-2019 pop. change: -5.4% (-5,218)
> 2019 unemployment: 7.2% — 7th highest out of 383 MSAs
> 2010-2019 employment change: -1.2% — 342nd highest out of 383 MSAs
> 2019 median household income: $69,980 — 6.5% above national median
Ocean City is one of three New Jersey metro areas to rank among the fastest shrinking places in the country. From 2010 to 2019, Ocean City’s population fell from over 97,257 to roughly 92,039, a 5.4% decline. During each of those years, the area has had one of the very highest unemployment rates in the country, likely prompting residents to move elsewhere to look for economic opportunities.
The Ocean City metro area stands out from other rapidly shrinking places as relatively affluent. With a 2019 median household income at nearly $70,000, the area is the only one on this list with a median household income higher than the U.S. median of $65,712. Ocean City also had a 2019 poverty rate of 8.8%, well below the 12.3% U.S. median.

11. Watertown-Fort Drum, NY
> 2010-2019 pop. change: -5.5% (-6,398)
> 2019 unemployment: 5.6% — 23rd highest out of 383 MSAs
> 2010-2019 employment change: -9.1% — 380th highest out of 383 MSAs
> 2019 median household income: $53,917 — 17.9% below national median
The populations of most cities on this list declined in similar fashion in both halves of the last decade. The population in the Watertown-Fort Drum, New York, metro area, however, actually grew by 1.5% from 2010 to 2014, before declining by 6.9% from 2015 to 2019. The result was a 5.5% overall population decline during the decade.
The northern New York metro area has faced economic challenges similar to many other cities on this list. Officials also say the population decline is, at least partially, attributable to the Fort Drum military base reducing personnel, which could have a domino effect on the number of spouses and dependents as well as support workers leaving the area.
[in-text-ad]

10. Cumberland, MD-WV
> 2010-2019 pop. change: -5.8% (-5,988)
> 2019 unemployment: 5.3% — 40th highest out of 383 MSAs
> 2010-2019 employment change: 0.9% — 326th highest out of 383 MSAs
> 2019 median household income: $49,729 — 24.3% below national median
The Cumberland metro area is one of four places at least partially located in West Virginia to rank among the nation’s 10 fastest shrinking cities. From 2010 to 2019, the area’s population decreased by 5.8%, or nearly 6,000 people.
While incomes in the Cumberland area increased sharply during the decade, climbing by 42.7%, the typical area household still earned less than $50,000 in 2019, about $16,000 less than the U.S. median. Similarly, while the number of jobs in the area increased slightly, by 0.9%, during the 2010s, the unemployment rate declined much more gradually during the decade than it did nationwide. Though in 2010 the area’s 9.3% unemployment rate was lower than the U.S. rate of 9.6%, by 2019 the jobless rate dropped to just 5.3%, higher than the 3.7% U.S. rate and 40th highest out of nearly 400 metro areas reviewed.
[recirclink id=838966]

9. Elmira, NY
> 2010-2019 pop. change: -6.1% (-5,391)
> 2019 unemployment: 4.2% — 109th highest out of 383 MSAs
> 2010-2019 employment change: -12.0% — 382nd highest out of 383 MSAs
> 2019 median household income: $60,782 — 7.5% below national median
Unlike many other cities on this list, the population of the Elmira, New York, area was actually on the upswing at the beginning of the 2010s, increasing from 2010 to 2011 and 2011 to 2012. After that, the area’s population shrank by hundreds each year, with Elmira eventually losing 6.1% of the 2010 population by 2019.
Even before the population of Elmira started shrinking, total employment in the metro area was on the decline. Elmira had the second-highest drop in total employment of any U.S. metro area from 2010 to 2019, as 12% of the jobs available at the beginning of the decade were gone by the end. Difficult economic circumstances often coincide with population decline, as people search elsewhere for jobs.

8. Wheeling, WV-OH
> 2010-2019 pop. change: -6.1% (-9,009)
> 2019 unemployment: 5.4% — 33rd highest out of 383 MSAs
> 2010-2019 employment change: -1.3% — 343rd highest out of 383 MSAs
> 2019 median household income: $50,440 — 23.2% below national median
In the decade from 2010 to 2019, the Wheeling metro area around the West Virginia-Ohio border lost over 9,000 people, or 6.1% of the population. There were over 4,000 more deaths in the area than births throughout the 2010s, and nearly 5,000 more people moved away from Wheeling than moved to it.
Housing prices typically reflect the demand for living in an area, as well as what residents can afford. The Wheeling area has some of the least expensive homes of any metro area in the U.S., with the typical home worth $115,500, less than half the price of the typical U.S. home, which is $240,500.
[in-text-ad-2]

7. Decatur, IL
> 2010-2019 pop. change: -6.1% (-6,768)
> 2019 unemployment: 5.3% — 40th highest out of 383 MSAs
> 2010-2019 employment change: -6.2% — 371st highest out of 383 MSAs
> 2019 median household income: $50,839 — 22.6% below national median
The Decatur metro area of Central Illinois is one of just nine areas in the U.S. in which the population declined by more than 6% from 2010 to 2019. There were over 1,000 more births than deaths in the Decatur area throughout that decade, and over 7,800 more people moved away from the area than moved to it.
Even as nationwide economic indicators improved throughout the 2010s, many cities like Decatur were left behind. For instance, the number of households living on less than $10,000 a year in the U.S. declined from 7.6% in 2010 to 5.8% in 2019. Yet in Decatur, such households became more common, increasing from 8.4% to 11.7% during that time. No other metro area had such a dramatic increase.
6. Weirton-Steubenville, WV-OH
> 2010-2019 pop. change: -6.7% (-8,381)
> 2019 unemployment: 5.6% — 23rd highest out of 383 MSAs
> 2010-2019 employment change: -5.2% — 367th highest out of 383 MSAs
> 2019 median household income: $49,510 — 24.7% below national median
The Weirton-Steubenville area is one of two metro areas along the West Virginia-Ohio border to rank as one of the fastest shrinking places in America, as the 2019 population was 6.7% smaller than the population in 2010. The area is one of just a handful of places on this list in which the natural population change accounted for more of the population loss than did migration.
Throughout the 2010s, the opioid epidemic has impacted this part of the country especially profoundly, as West Virginia and Ohio have the highest and second-highest rates of overdose among states, respectively. Just as a lack of economic opportunities can lead people to leave an area, experts say it can also push people towards substance abuse, leading to high instances of overdose deaths.
[in-text-ad]

5. Danville, IL
> 2010-2019 pop. change: -7.2% (-5,867)
> 2019 unemployment: 5.1% — 47th highest out of 383 MSAs
> 2010-2019 employment change: -5.8% — 370th highest out of 383 MSAs
> 2019 median household income: $43,111 — 34.4% below national median
Danville is one of many Illinois metro areas losing residents and one of two in the state to rank among the fastest shrinking places in the country. It is one of just five metro areas in the country in which the population declined by over 7% from 2010 to 2019. Researchers at the Illinois Policy Institute found that those leaving Danville and areas like it are working-age people, typically 25-54, striking out in search of places to earn higher wages and start a family.
There are few high-paying jobs available in Danville — the area has one of the 10-lowest median household incomes in the country, at $43,111. People with college degrees tend to earn higher incomes, yet Danville is the least educated metro area in the country. Just 12.1% of residents 25 and older hold at least a bachelor’s degree, compared to 33.1% of Americans that age overall.
[recirclink id=838620]
4. Beckley, WV
> 2010-2019 pop. change: -7.3% (-9,147)
> 2019 unemployment: 5.0% — 53rd highest out of 383 MSAs
> 2010-2019 employment change: -2.6% — 357th highest out of 383 MSAs
> 2019 median household income: $44,785 — 31.8% below national median
Like many other parts of West Virginia, the Beckley metro area has contracted in population over the past decade. From 2010 to 2019, the population has shrunk by over 9,000, or 7.3%.
During the 2010s, the typical American home increased in value by 33.7%. Yet in Beckley, homes in 2019 were worth just 2.9% more than they were in 2010, one of the lowest growth in home value in the U.S. Incomes also increased at a much slower pace, and the typical Beckley household earned about $21,000 less per year in 2019 than the typical U.S. home.

3. Charleston, WV
> 2010-2019 pop. change: -7.5% (-20,911)
> 2019 unemployment: 4.8% — 60th highest out of 383 MSAs
> 2010-2019 employment change: -8.6% — 378th highest out of 383 MSAs
> 2019 median household income: $47,500 — 27.7% below national median
The Charleston, West Virginia, area is one of just four metro areas in the U.S. in which the population declined by more than 20,000 people from 2010 to 2019. In nine of those 10 years, the population declined by over 1,000, compared to the year before. Nearly 16,000 more people moved away from the area than moved to it during the 2010s, and the area also reported over 5,000 more deaths than births.
Many people left the Charleston area as job opportunities became scarce. The number of people working in the area declined by 8.6% from 2010 to 2019, as the number of workers nationwide grew by 13.3%. As jobs have declined, poverty has increased — Charleston’s poverty rate grew by 2.5 percentage points from 2010 to 17.1% in 2019, even as the U.S. poverty rate declined by 3.0 percentage points to 12.3%.
[in-text-ad-2]
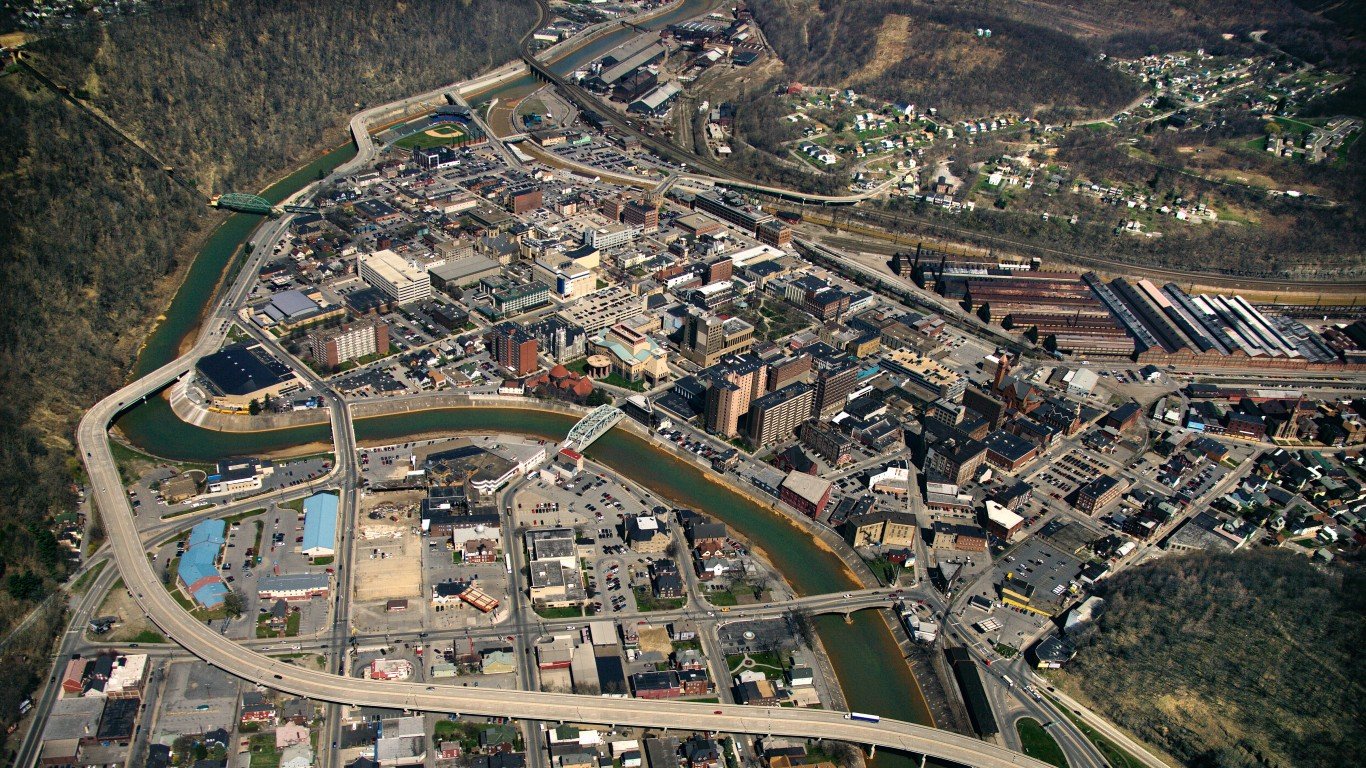
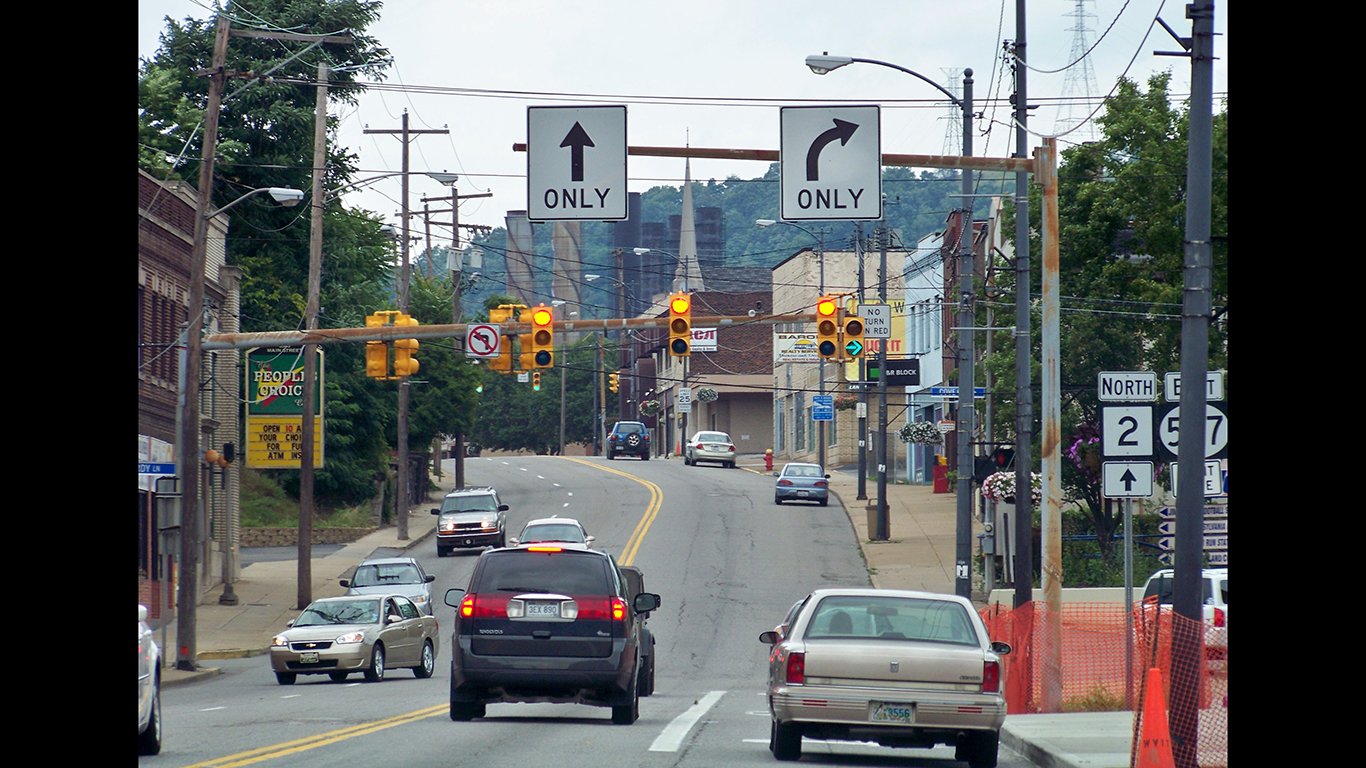
2. Johnstown, PA
> 2010-2019 pop. change: -9.4% (-13,503)
> 2019 unemployment: 5.3% — 40th highest out of 383 MSAs
> 2010-2019 employment change: -9.1% — 379th highest out of 383 MSAs
> 2019 median household income: $49,076 — 25.3% below national median
Each year from 2010 to 2019, the Johnstown, Pennsylvania, area lost over 1,000 people, eventually totaling over 13,500 people, or 9.4% of the 2010 population. The 9.4% population decline is the second largest decrease of any U.S. metro area.
By many metrics, the Johnstown area is struggling economically, facing conditions that often prompt residents to move elsewhere. The median household income in the Johnstown area was just over $49,000 in 2019, well below the $65,712 U.S. median household income that year. Most homes in the area are worth less than $100,000, well below the $240,500 median home value nationwide.

1. Pine Bluff, AR
> 2010-2019 pop. change: -12.4% (-12,485)
> 2019 unemployment: 5.2% — 44th highest out of 383 MSAs
> 2010-2019 employment change: -13.4% — 383rd highest out of 383 MSAs
> 2019 median household income: $41,541 — 36.8% below national median
The Pine Bluff, Arkansas, metro area is by far the fastest shrinking place in America, losing 12.4% of its population from 2010 to 2019. No other places lost even a 10th of its population in that decade. Even though the area had more births than deaths during the decade, Pine Bluff’s population declined from over 100,000 to less than 88,000, as many more people moved away from the area than moved to it.
As is the case in virtually every other city on this list, Pine Bluff is struggling economically — its median household income for 2019 was just $41,541, about $24,000 lower than the U.S. median. Its poverty rate of 23.6% is also the sixth highest in the nation. Even though incomes increased by 24.2% from 2010 to 2019, the poverty rate climbed — up by 1.2 percentage points even as the U.S. rate declined by 3 percentage points.
Methodology:
To determine America’s fastest shrinking cities, 24/7 Wall St. reviewed data from the U.S. Census Bureau’s Population and Housing Estimates Program. Metropolitan statistical areas were ranked based on the percentage change in total population from July 1, 2010, to July 1, 2019. Data on population change due to natural change — the net difference between births and deaths — and due to net migration also came from the Census Bureau. Supplemental data on median household income came from the Census Bureau’s 2019 American Community Survey. Data on annual unemployment rate and employment changes came from the Bureau of Labor Statistics. These data are pre the COVID-19 pandemic.
Contact [email protected] for any questions or corrections.