Labor unions — an organized group of workers in a given trade — have changed the nature of labor relations in the United States. Through collective bargaining, unions have fought to earn many workers’ rights that many of us take for granted, including weekends off, a 40-hour work week, and paid vacations.
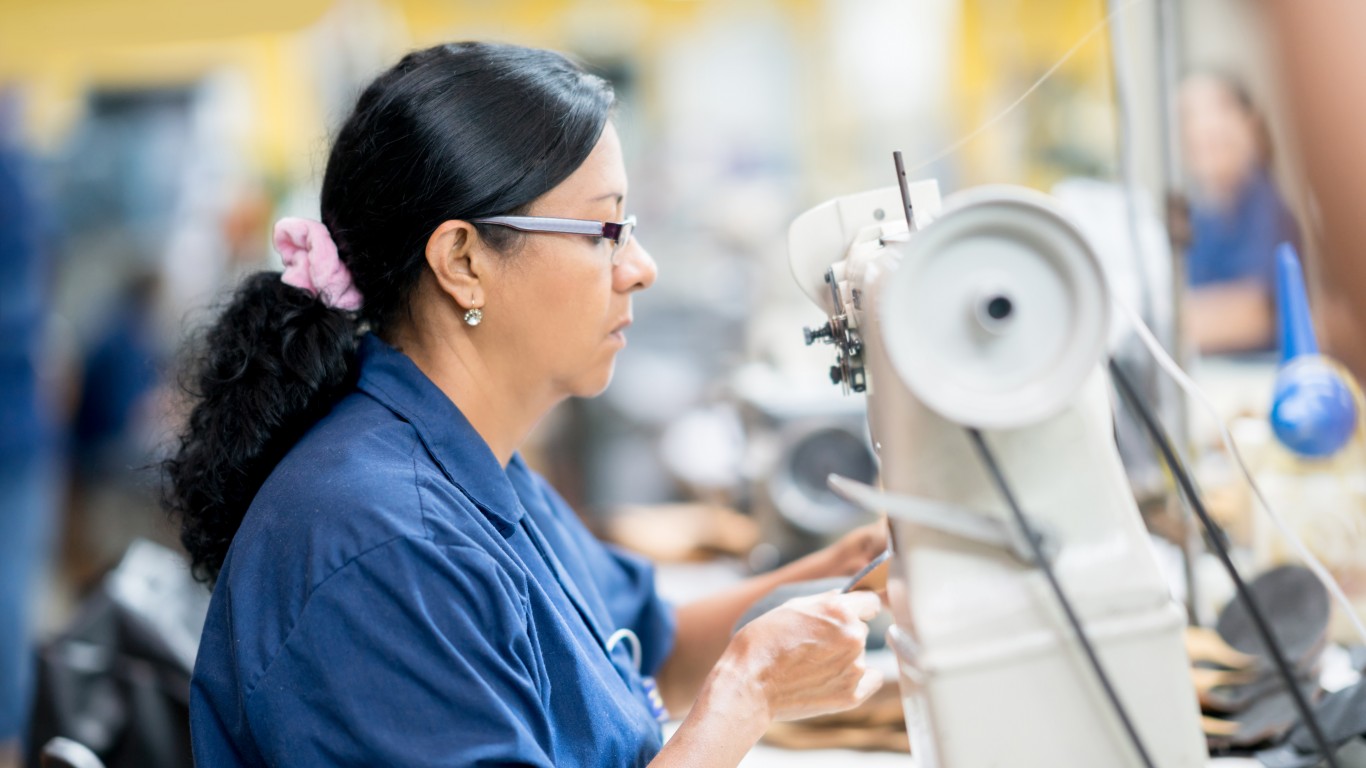
As the global economy has become increasingly interconnected, however, foreign competition has resulted in weakening union power in much of the country. Traditional union demands for better working conditions, benefits, and pay have made it more difficult for American companies to compete in an international market, where labor is cheap. This has been especially true for the manufacturing sector — American automakers in particular. Here are five countries manufacturing more cars than America.
With plants closing amid global competition and companies demanding more leeway, the share of U.S. workers who were union members has been on the decline since the 1980s. Union membership rate nationwide declined by 1.1 percentage points in the last decade, from 11.9% in 2010 to 10.8% in 2020.
Union participation is anything but uniform across all states, and in some parts of the country union membership remains at levels not seen nationally since the 1980s. Using state- level data on the share of workforces that belong to a labor union, 24/7 Wall St. identified the states with the strongest and weakest unions.
Generally, the states with where labor union participation is weakest, are those that have strong anti-union laws. Perhaps the most common and effective anti-union measures are so-called “right-to-work” laws, which prohibit companies from requiring employees to join a union or pay dues. The term “right-to-work” itself is misleading, as in no way do these laws guarantee employment for those seeking it. Instead, they erode the strength of unions, diminishing their collective bargaining power.
Nationwide, the typical union member earns about 19% more than the typical worker with no union affiliation. Not surprisingly, states with greater union participation also tend to have higher average annual wages. Here is a look at the 25 highest paying jobs in America.
Click here to see states with the strongest and weakest unions.
Click here to see our methodology.
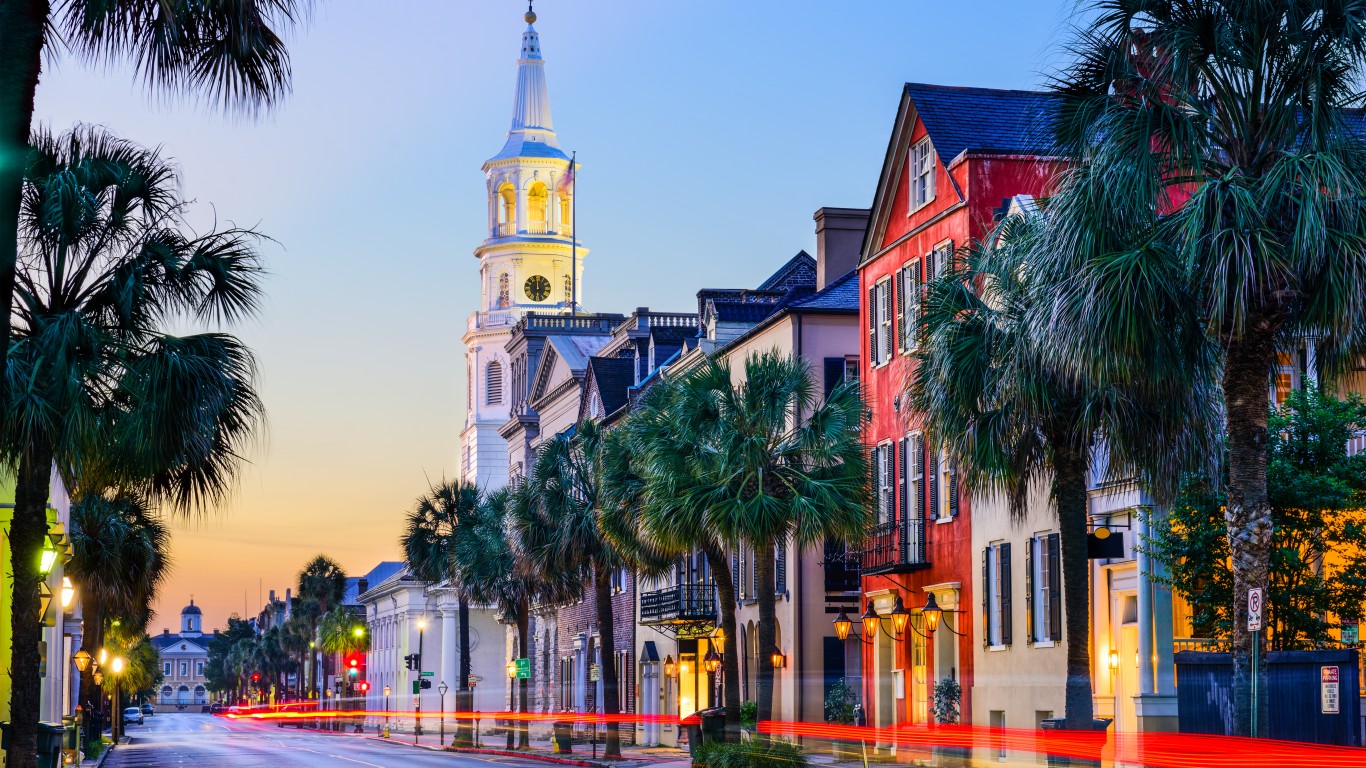
50. South Carolina
> Workers in a labor union: 2.9% (total: 59,149)
> Change in union membership (2010-2020): -1.7 ppt. (11th lowest)
> Avg. annual wage: $44,380 (7th lowest)
> Most unionized occupational group: Production occupations
South Carolina is the only state where less than 3% of workers are union members. As is the case in many other states, production occupations, such as manufacturing, have the highest concentration of union membership in South Carolina.
Union membership has fallen in South Carolina over the last decade. The share of unionized workers in the state fell by 1.7 percentage points between 2010 and 2020. South Carolina is a so-called right-to-work state.
[in-text-ad]
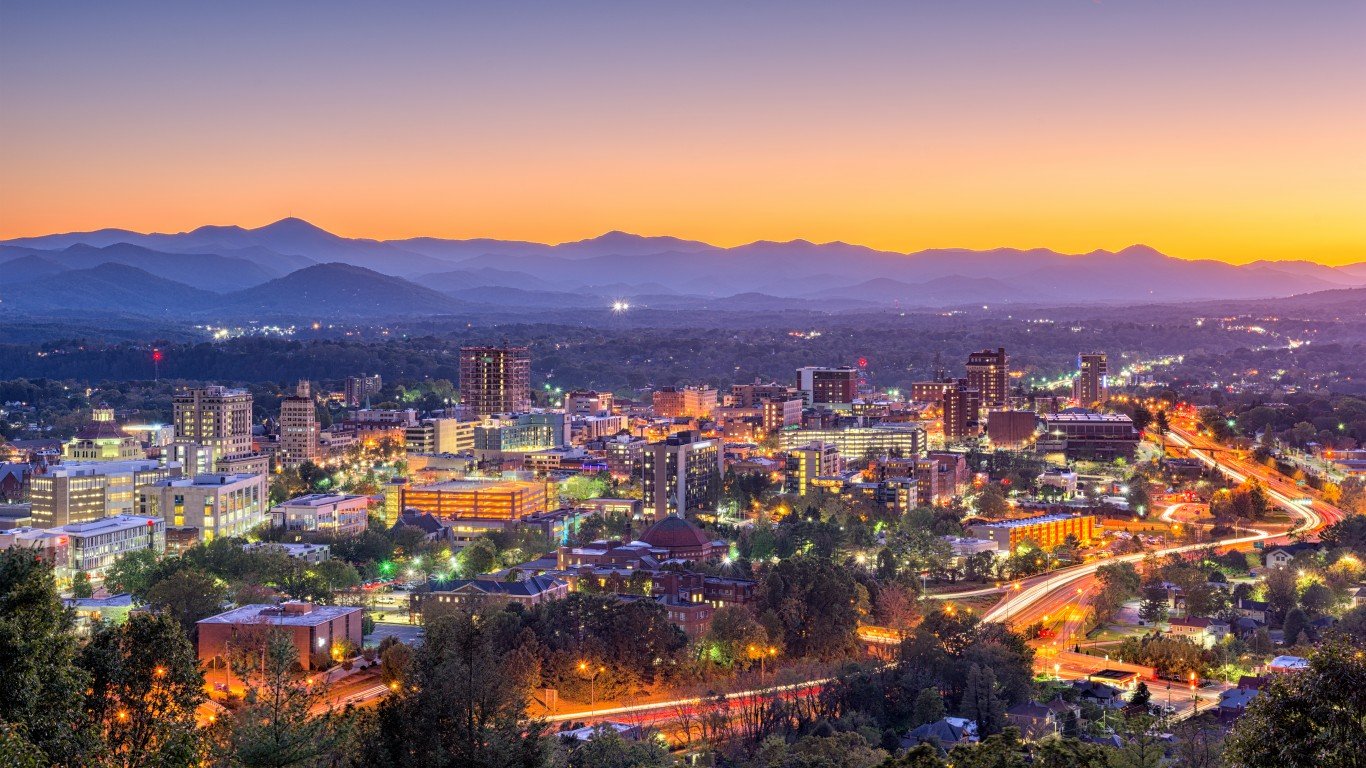
49. North Carolina
> Workers in a labor union: 3.1% (total: 130,078)
> Change in union membership (2010-2020): 0.0 ppt. (19th highest)
> Avg. annual wage: $48,550 (22nd lowest)
> Most unionized occupational group: Production occupations
Only about 130,100 workers in North Carolina are in a labor union, or just 3.1% of the total work force. In many of the states with the weakest labor unions, membership has fallen in the last decade. In North Carolina, however, union members make up effectively the same share of the labor force as they did one decade ago.
As is the case nationwide, union membership is split evenly between the public and private sectors in North Carolina. Like other states with relatively low union membership, North Carolina is a right-to-work state.
[recirclink id=488456]
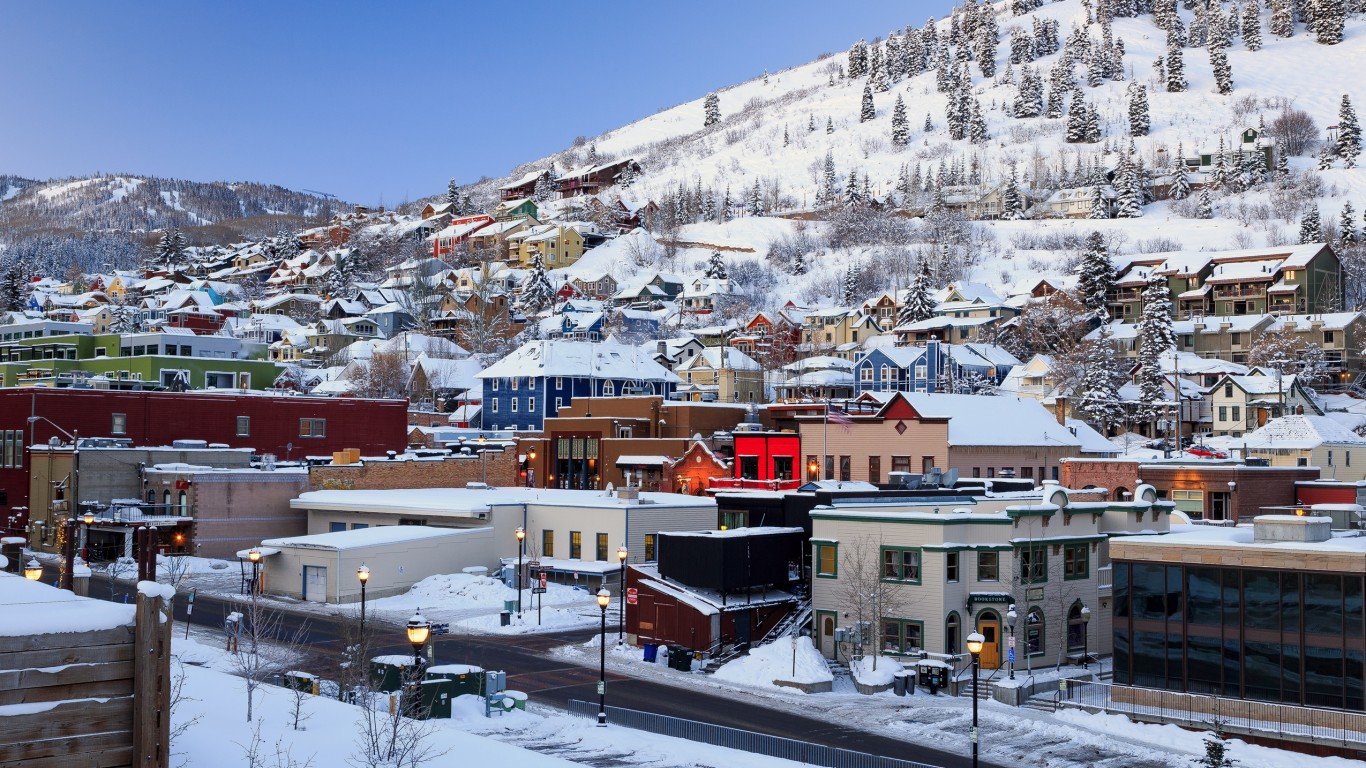
48. Utah
> Workers in a labor union: 3.6% (total: 51,075)
> Change in union membership (2010-2020): -2.9 ppt. (5th lowest)
> Avg. annual wage: $49,420 (24th lowest)
> Most unionized occupational group: Construction and extraction occupations
As recently as 2010, 6.5% of all workers in Utah were union members. As of 2020, that share dropped to just 3.6%. The 10-year decline in union membership is one of the largest of any state.
Jobs in construction and extraction have the highest concentration of unionized workers in the state. Major labor unions in Utah include the International Brotherhood of Electrical Workers and the Utah Education Association.

47. South Dakota
> Workers in a labor union: 4.3% (total: 16,515)
> Change in union membership (2010-2020): -1.3 ppt. (16th lowest)
> Avg. annual wage: $42,920 (3rd lowest)
> Most unionized occupational group: Building and grounds cleaning and maintenance occupations
There are over 384,700 people working in South Dakota — and only 16,515, or 4.3% of them, are members of a labor union. One decade ago, over 20,000 workers in the state were union members — 5.6% of the labor force.
Eroding union membership has been underway for a long time in South Dakota. The state enacted “right-to-work” laws in 1947, and union membership has been below 10% of the workforce since at least 1989, when records began.
[in-text-ad-2]
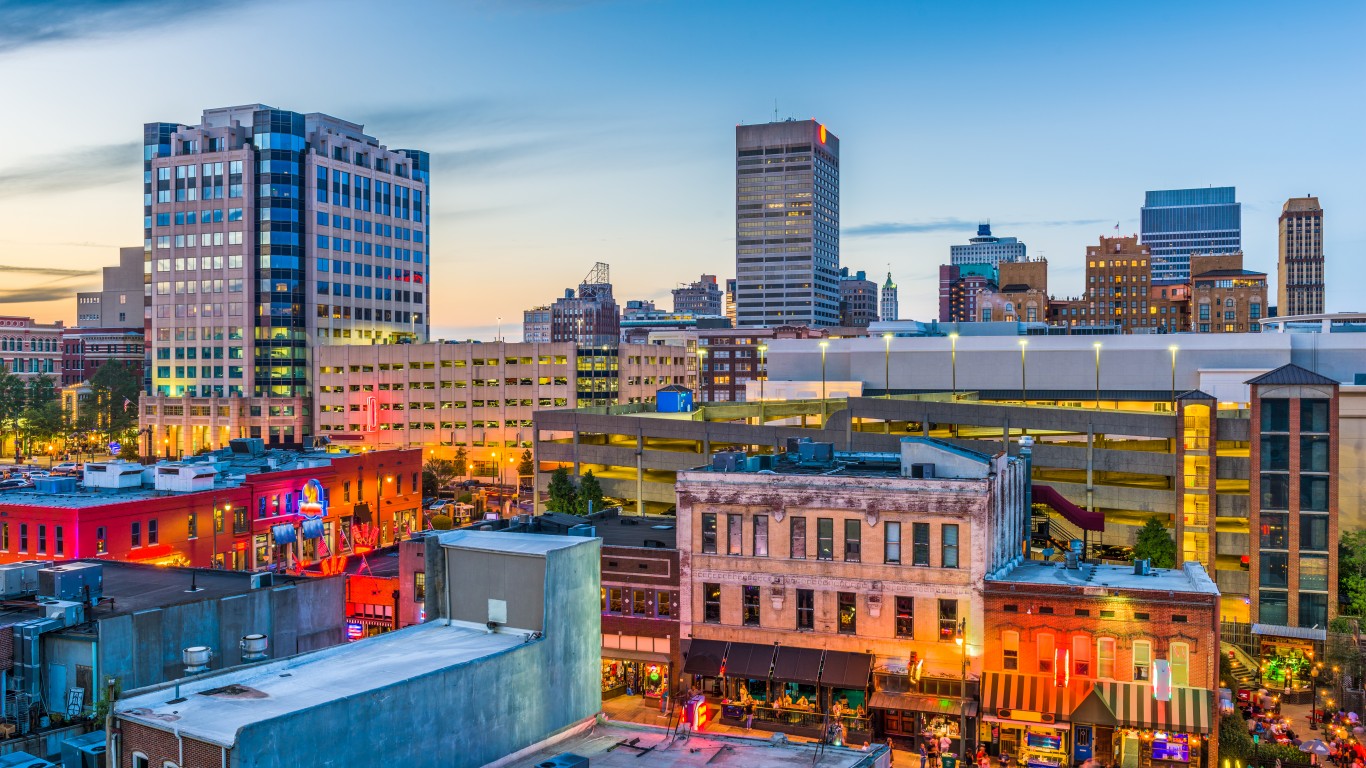
46. Tennessee
> Workers in a labor union: 4.3% (total: 116,387)
> Change in union membership (2010-2020): -0.3 ppt. (22nd highest)
> Avg. annual wage: $45,650 (12th lowest)
> Most unionized occupational group: Production occupations
There are 116,387 unionized workers in Tennessee, or 4.3% of the total workforce. Over the last decade, the share of the workforce in organized labor unions declined by 0.3 percentage points in the state.
Labor unions empower workers to negotiate higher wages, and partially as a result, states with low union membership rates typically have low average annual wages. In Tennessee, the average annual age is $45,650, 12th lowest among states.

45. Virginia
> Workers in a labor union: 4.4% (total: 163,842)
> Change in union membership (2010-2020): -0.2 ppt. (21st highest)
> Avg. annual wage: $56,740 (11th highest)
> Most unionized occupational group: Computer and mathematical occupations
Only 163,842 people, or 4.4% of workers, in Virginia are unionized. Nationwide, union membership is split evenly between the public and private sectors. In Virginia, however, likely due in part to the large government presence in the Washington D.C. metro area, union membership is concentrated in the public sector.
Along with Colorado, Virginia is one of only two states where computer and mathematical occupations have the highest concentration of unionized workers.
[in-text-ad]

44. Georgia
> Workers in a labor union: 4.7% (total: 194,261)
> Change in union membership (2010-2020): +0.6 ppt. (11th highest)
> Avg. annual wage: $49,620 (25th highest)
> Most unionized occupational group: Transportation and material moving occupations
There are nearly 4.2 million workers in Georgia, more than the vast majority of states. Yet, only 4.7% of them are in an organized labor union. As a result, many states with much smaller workforces than Georgia are home to far more unionized workers. There are over 400 active labor unions in the state, the majority located in and around Atlanta.
Unlike many other so-called right-to-work states with low union membership, unions are gaining power in Georgia. The share of workers in a union increased by over half a percentage point between 2010 and 2020.
[recirclink id=488594]

43. Arkansas
> Workers in a labor union: 4.7% (total: 54,306)
> Change in union membership (2010-2020): +0.7 ppt. (10th highest)
> Avg. annual wage: $42,690 (2nd lowest)
> Most unionized occupational group: Production occupations
Just 4.7% of all workers in Arkansas are members of an organized labor union. Though Arkansas is a right-to-work state, local labor unions appear to be growing stronger. As recently as 2010, only 4.0% of the labor force were union members.
Still, the state is one of only nine nationwide where fewer than 5% of the workforce are unionized. With limited union membership, workers in the state are at a disadvantage in contract negotiations, and partially as a result, incomes are generally low. The average annual wage in Arkansas is just $42,690, nearly the lowest of any state.

42. Texas
> Workers in a labor union: 4.9% (total: 565,634)
> Change in union membership (2010-2020): -0.6 ppt. (25th lowest)
> Avg. annual wage: $50,490 (22nd highest)
> Most unionized occupational group: Construction and extraction occupations
As is the case nationwide, union membership in Texas is declining. Just 4.9% of the workforce in the Lone Star State are members of a labor union, down over half a percentage point from 2010.
Union membership in Texas peaked in 1993, when 7.5% of workers were union members. That same year, Texas became a so-called right-to-work state and membership has been declining since. Though membership has fluctuated slightly in recent years, current membership is near an all time low.
[in-text-ad-2]

41. Arizona
> Workers in a labor union: 5.3% (total: 154,524)
> Change in union membership (2010-2020): -1.1 ppt. (22nd lowest)
> Avg. annual wage: $50,930 (20th highest)
> Most unionized occupational group: Farming, fishing, and forestry occupations
Only 5.3% of the 2.9 million people working in Arizona are members of a labor union — the 10th smallest share among states. Though the number of union members in the state employed in the public sector is similar to the number of private sector workers, they account for a much larger share of union members. Nearly one in every five public sector workers in Arizona are union members, compared to only 3% of private workers.
Over the last decade, the share of union members as a percentage of the total Arizona workforce dropped 1.1 percentage points. There are currently only 154,500 union members in the state, compared to 161,000 in 2010.
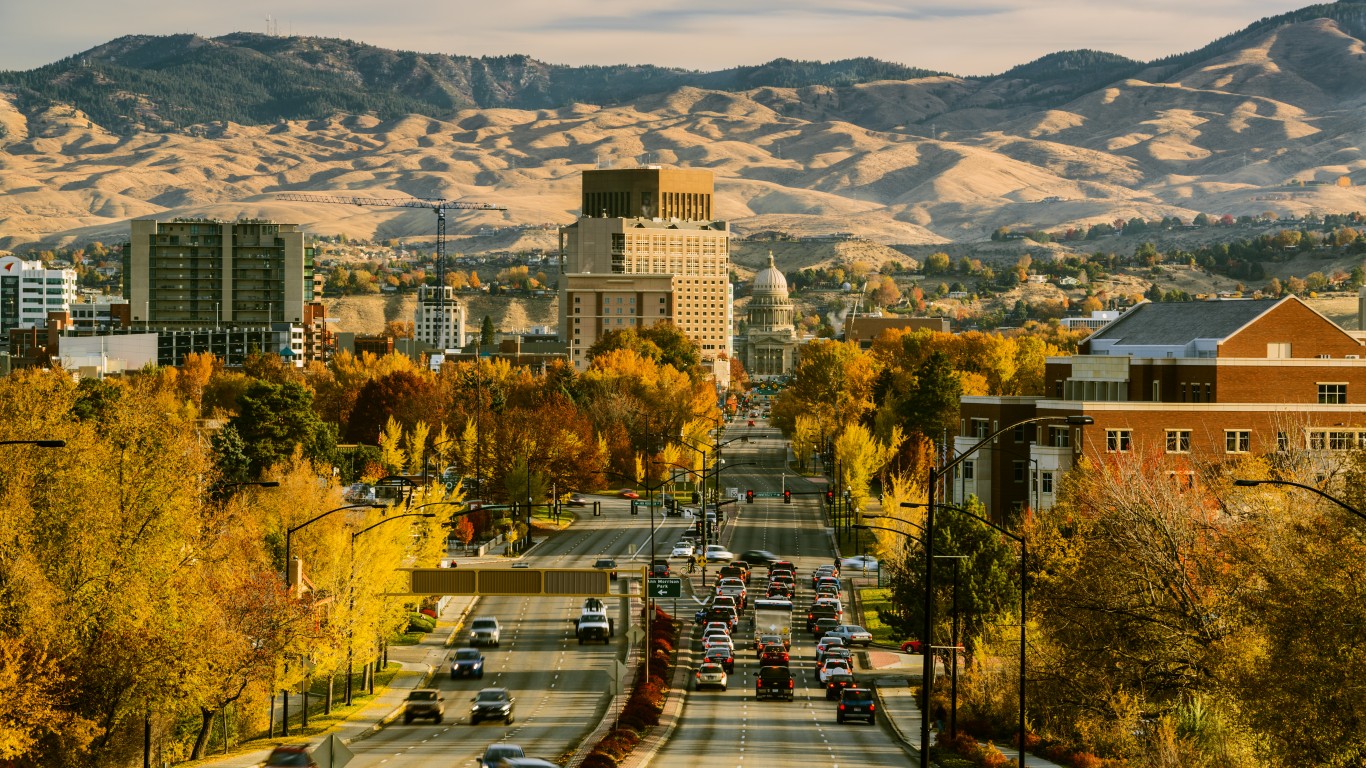
40. Idaho
> Workers in a labor union: 5.6% (total: 41,054)
> Change in union membership (2010-2020): -1.5 ppt. (14th lowest)
> Avg. annual wage: $44,890 (8th lowest)
> Most unionized occupational group: Farming, fishing, and forestry occupations
Only 5.6% of the more than three-quarters of a million people working in Idaho are union members. Idaho became a “right-to-work” state in 1985 and union membership in the state peaked in 1993, when 10.7% of workers were in a labor union.
Though the share of workers in a labor union is 1.5 percentage points below where it was in 2010, membership has fluctuated in the last decade. As it stands, union membership is stronger now in Idaho than it was in 2013 and 2018 when it bottomed out at 4.7%.
[in-text-ad]

39. Louisiana
> Workers in a labor union: 5.9% (total: 98,966)
> Change in union membership (2010-2020): +1.5 ppt. (5th highest)
> Avg. annual wage: $44,170 (6th lowest)
> Most unionized occupational group: Construction and extraction occupations
Just under 100,000 workers in Louisiana are members of a labor union — equal to 5.9% of the state’s total workforce. Like other states with lower than average labor union membership, Louisiana is a so-called right-to-work state.
Unlike other states with low membership, however, unions appear to be gaining strength in Louisiana. Since 2010, the share of workers in a union has increased by 1.5 percentage points, more than in all but four other states. Union membership peaked in 1993, when union members accounted for nearly 10% of workers. Membership hit an all time low in 2016, when only 4.2% of workers were unionized.
[recirclink id=488561]
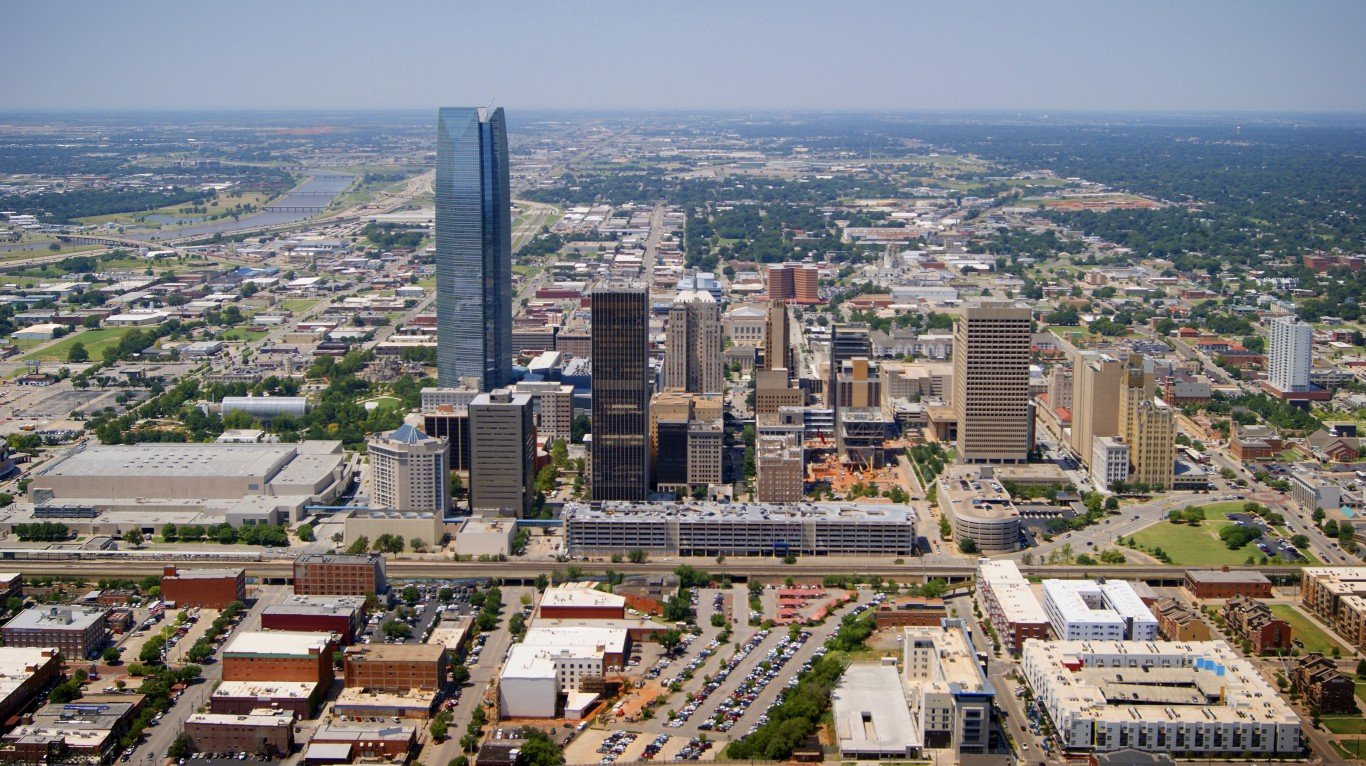
38. Oklahoma
> Workers in a labor union: 6.0% (total: 89,848)
> Change in union membership (2010-2020): +0.5 ppt. (12th highest)
> Avg. annual wage: $45,620 (11th lowest)
> Most unionized occupational group: Construction and extraction occupations
Only 6.0% of workers in Oklahoma are members of a labor union, a smaller share than in all but a dozen other states.
Labor unions have a storied history in Oklahoma. A multi-year strike organized by the United Mine Workers of America resulted in an eight-hour workday and higher wages for Oklahoma miners in 1903. Unions, including United Auto Workers, which reported surging membership in the state in the 1970s, continued to play a major role in the state labor market throughout the 20th century. However, Oklahoma became a “right-to-work” state in 2001, and membership has not topped the high of 10.6% reached in 1990 since.

37. North Dakota
> Workers in a labor union: 6.2% (total: 21,153)
> Change in union membership (2010-2020): -1.1 ppt. (21st lowest)
> Avg. annual wage: $50,430 (23rd highest)
> Most unionized occupational group: Construction and extraction occupations
Only 21,000 workers in North Dakota are union members — equal to 6.2% of the state’s total workforce. As is the case in much of the country, the power of organized labor in the state has been eroding for decades. Union membership peaked in North Dakota in 1990, when 11.9% of workers were unionized. In the last decade alone, the share of union membership has fallen by 1.1 percentage points.
However, due in part to a boom in natural gas extraction in the state in the last 10 years, the share of workers who are labor union members is now well above the all time low of 5.0% reached in 2014.
[in-text-ad-2]
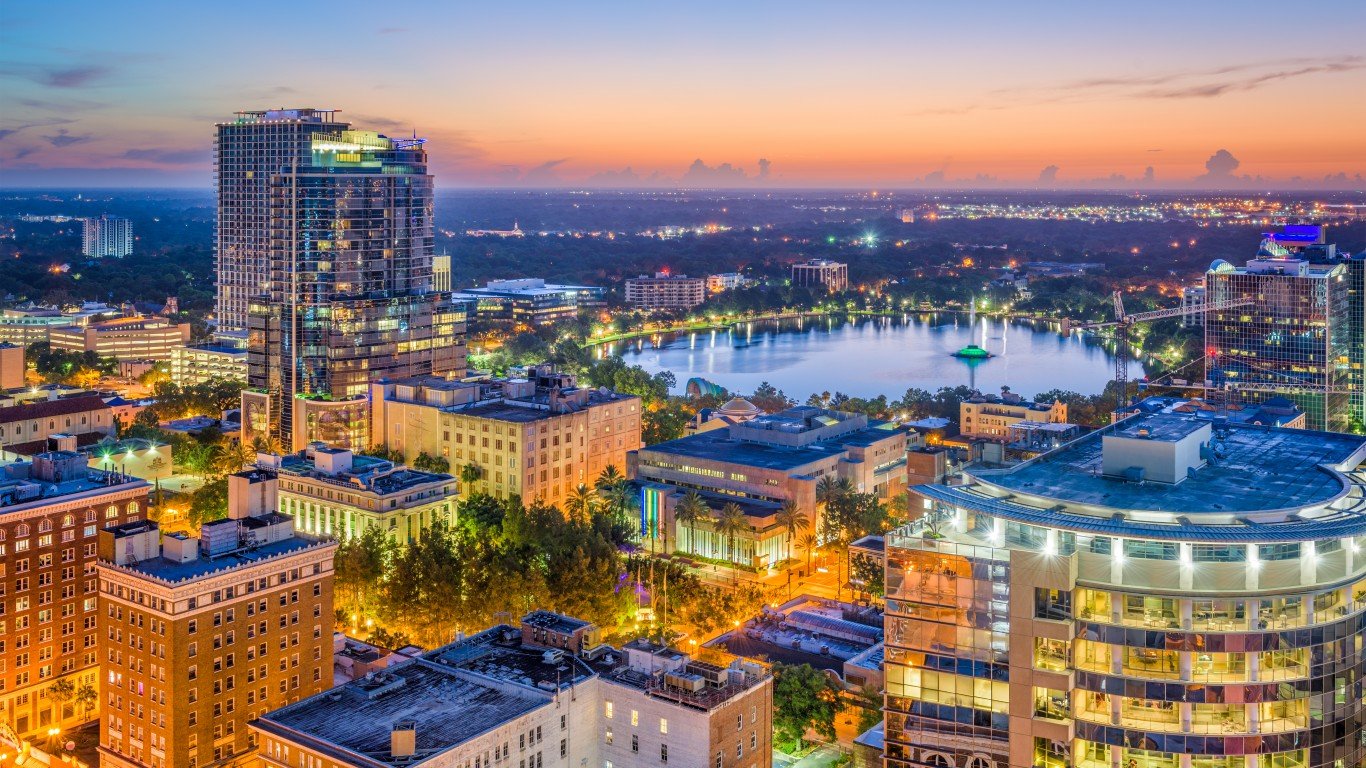
36. Florida
> Workers in a labor union: 6.4% (total: 525,490)
> Change in union membership (2010-2020): +0.9 ppt. (8th highest)
> Avg. annual wage: $47,750 (18th lowest)
> Most unionized occupational group: Legal occupations
Just over half a million people — or 6.4% of all workers — in Florida are members of a labor union. While union membership is eroding nationwide, in Florida, it is increasing. The share of workers in a union in the state increased by nearly a full percentage point between 2010 and 2020.
Some lawmakers in Florida are taking aim at teachers unions. In March 2021, a bill was introduced in the state legislature that would prohibit teachers from having their dues taken directly out of their paychecks. Critics claim the proposal is a thinly veiled attempt to weaken teacher’s unions.

35. Iowa
> Workers in a labor union: 6.6% (total: 92,036)
> Change in union membership (2010-2020): -4.8 ppt. (3rd lowest)
> Avg. annual wage: $47,330 (17th lowest)
> Most unionized occupational group: Production occupations
In Iowa, a so-called right-to-work state since 1947, just 6.6% of the 1.4 million strong workforce are union members. As is the case in many other states, production or manufacturing occupations have the highest union membership rates.
Union membership has declined precipitously in Iowa in recent years. As recently as 2000, the share of workers in a union in the state was double what it is now. Some attribute the decline to new laws that reduced the collective bargaining power of public sector unions in the state. There were over 77,200 public sector union members in Iowa in 2010, compared to less than 48,000 in 2020.
[in-text-ad]

34. New Mexico
> Workers in a labor union: 7.2% (total: 53,134)
> Change in union membership (2010-2020): -0.2 ppt. (20th highest)
> Avg. annual wage: $47,040 (15th lowest)
> Most unionized occupational group: Life, physical, and social science occupations
Just over 53,000 workers in New Mexico are members of a labor union — equal to 7.2% of the state’s total workforce. Overall employment was hit hard in New Mexico during the Great Recession, and so too were labor unions. In the years since, however, union membership has come back slightly, and as a result, the share of workers in a union is only 0.2 percentage points lower now than it was in 2010.
With limited union membership, workers in the state are at a disadvantage in contract negotiations, and partially as a result, incomes are generally low in the state. The average annual wage in New Mexico is just $47,040, well below the national average of $53,490.
[recirclink id=488514]

33. Mississippi
> Workers in a labor union: 7.2% (total: 74,080)
> Change in union membership (2010-2020): +2.7 ppt. (2nd highest)
> Avg. annual wage: $40,090 (the lowest)
> Most unionized occupational group: Production occupations
There are just over 74,000 union members in Mississippi, or 7.2% of the state’s total workforce. Unlike many other states with lower than average union membership, unions are gaining strength in Mississippi. The share of unionized workers in the state is 2.7 percentage points higher now than in 2010.
The increase came despite at least one major setback for organized labor in 2017. Workers at a Nissan plant were fighting for the right to unionize but were ultimately defeated following an anti-union campaign spearheaded by the automaker.

32. Colorado
> Workers in a labor union: 7.4% (total: 182,645)
> Change in union membership (2010-2020): +0.8 ppt. (9th highest)
> Avg. annual wage: $57,690 (9th highest)
> Most unionized occupational group: Computer and mathematical occupations
Just 7.4% of workers in Colorado belong to a labor union, a smaller share than in most other states. Labor union strength in the state has been volatile in recent years. Since 1989, as far back as comparable data is available, labor union participation peaked in Colorado in 2018, when 11% of the labor force were unionized. Participation in organized labor in the state bottomed out in 2010, when only 6.6% of workers were unionized.
Along with Virginia, Colorado is one of only two states where computer and mathematical occupations have the strongest union participation.
[in-text-ad-2]

31. Kentucky
> Workers in a labor union: 7.5% (total: 126,138)
> Change in union membership (2010-2020): -1.5 ppt. (15th lowest)
> Avg. annual wage: $44,020 (5th lowest)
> Most unionized occupational group: Production occupations
Kentucky is the most recent state to enact so-called right-to-work laws, joining 26 other states in 2017 — and those laws appear to be having a meaningful impact on organized labor. As recently as 2016, the share of workers in a labor union in Kentucky was 11.1%. As of 2020, unionized workers comprised only 7.5% of the workforce.
In 2018, the Kentucky American Federation of Labor and Congress of Industrial Organizations challenged the state’s right-to-work laws. However, the challenge was denied in a 4-3 decision in the state Supreme Court.
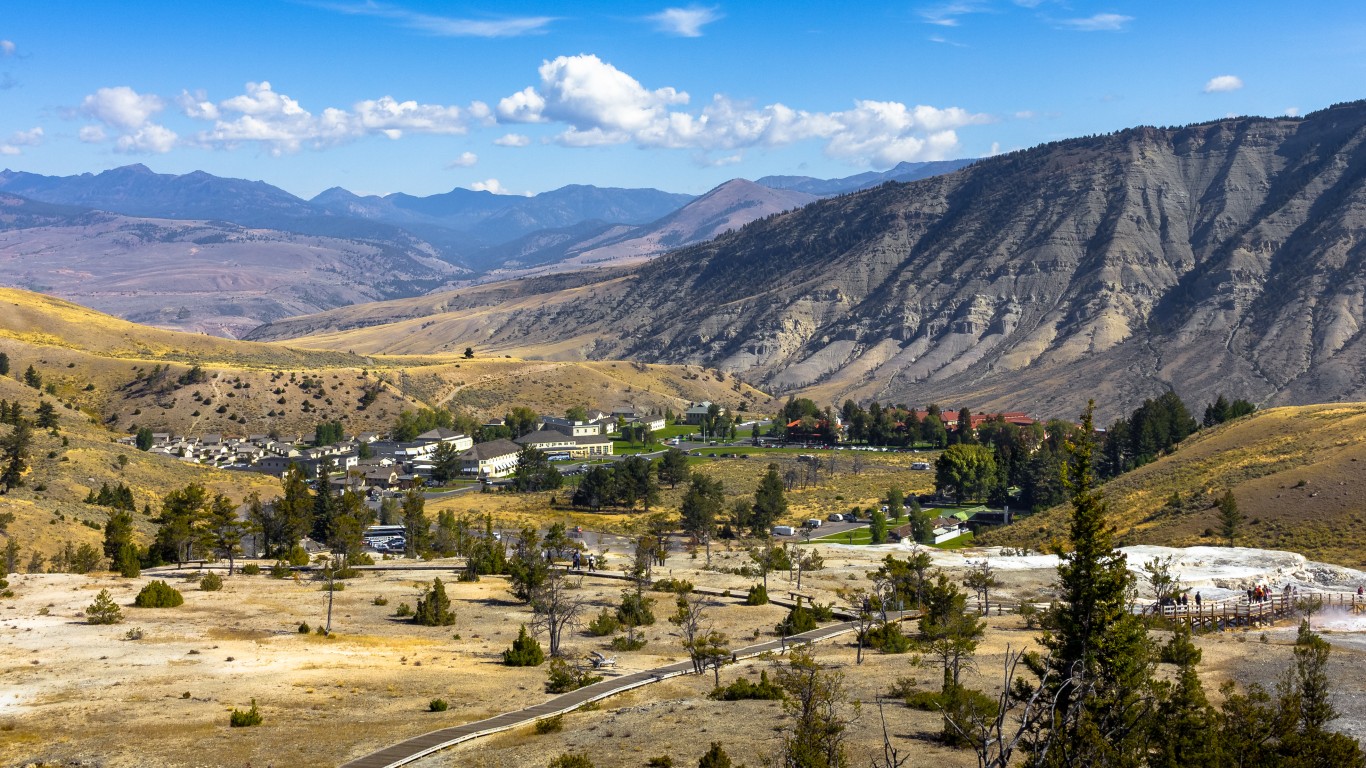
30. Wyoming
> Workers in a labor union: 7.6% (total: 18,111)
> Change in union membership (2010-2020): +0.2 ppt. (16th highest)
> Avg. annual wage: $49,760 (24th highest)
> Most unionized occupational group: Construction and extraction occupations
With a relatively small workforce, and lower than average union membership of 7.6%, Wyoming is one of only two states where fewer than 20,000 workers are in a labor union. Union membership in the state is up slightly from 7.4% a decade ago.
Construction and extraction occupations are the most likely to have a unionized workforce in Wyoming. Some of the state’s largest unions include the International Brotherhood of Electrical Workers, Utility Workers Union of America, and Service Employees International Union.
[in-text-ad]

29. Alabama
> Workers in a labor union: 8.0% (total: 150,824)
> Change in union membership (2010-2020): -2.2 ppt. (9th lowest)
> Avg. annual wage: $44,930 (9th lowest)
> Most unionized occupational group: Production occupations
In Alabama, 8% of the workforce are in a labor union, a larger share than in most other southern states but below the share in most states nationwide. Membership rates have fluctuated considerably in the state in recent years. Though the share of Alabama workers in a union is 2.2 percentage points below what it was a decade ago, it is still above the all-time low of 7.4% reached in 2017.
Since record keeping began, union membership in Alabama peaked in 1993, when 14.3% of workers were in a union.
[recirclink id=488498]

28. Indiana
> Workers in a labor union: 8.2% (total: 234,064)
> Change in union membership (2010-2020): -2.7 ppt. (6th lowest)
> Avg. annual wage: $46,770 (14th lowest)
> Most unionized occupational group: Production occupations
Along with Wisconsin and Iowa, Indiana is one of several states in the Midwest to recently enact so-called right-to-work laws. When the law went into effect in 2012, 9.1% of the workforce were in a union. Though union membership hit 10.7% in the state in 2014, it declined nearly every year after that and now stands at just 8.2%.
Manufacturing is a big economic driver in Indiana, and though union membership has declined by 9.4 percentage points in private sector manufacturing in the last decade, production occupations still have the highest concentration of union workers in the state.

27. Wisconsin
> Workers in a labor union: 8.7% (total: 227,077)
> Change in union membership (2010-2020): -5.4 ppt. (the lowest)
> Avg. annual wage: $48,850 (23rd lowest)
> Most unionized occupational group: Production occupations
Once a stronghold of organized labor, Wisconsin now has relatively weak labor unions. Just 8.7% of workers in the state are unionized, a smaller share than in most of the rest of the country.
Wisconsin was thrust into the national spotlight over a bitter political fight that resulted in the enactment of so-called right-to-work legislation in 2011, and the state expanded those laws again in 2015. That year, union membership fell to 8.3% from 11.7% in 2014. The shift came after a long and steady decline of union power in the state. As recently as 1989, nearly 21% of workers in Wisconsin were union members.
[in-text-ad-2]

26. Kansas
> Workers in a labor union: 8.8% (total: 113,273)
> Change in union membership (2010-2020): +2.0 ppt. (3rd highest)
> Avg. annual wage: $46,520 (13th lowest)
> Most unionized occupational group: Production occupations
In Kansas, 8.8% of workers are union members, up from just 6.8% in 2010. The increase was due in part to an unusual increase in private sector union membership. Over the last decade, private sector union membership nationwide fell by half a percentage point. In Kansas, however, it increased by 1.8 percentage points, more than in every other state.
Major labor unions in the state include International Association of Machinists and Aerospace Workers and United Steelworkers.

25. Missouri
> Workers in a labor union: 9.4% (total: 237,238)
> Change in union membership (2010-2020): -0.5 ppt. (25th highest)
> Avg. annual wage: $47,820 (19th lowest)
> Most unionized occupational group: Production occupations
Of the 2.5 million people working in Missouri, only 9.4% are members of a labor union. Though Missouri does not have “right-to-work” laws on the books, union membership is lower in the state than it is in several so-called right-to-work states, including Nebraska, Nevada, and West Virginia.
Since record keeping began, union membership peaked in Missouri in 1989, when 15.5% of workers were unionized. Membership in the state bottomed out in 2014, when just 8.4% of workers were in a union.
[in-text-ad]

24. Nebraska
> Workers in a labor union: 9.6% (total: 85,248)
> Change in union membership (2010-2020): +0.3 ppt. (14th highest)
> Avg. annual wage: $48,250 (20th lowest)
> Most unionized occupational group: Production occupations
In Nebraska, just 9.6% of workers are union members. Though organized labor is less powerful in Nebraska than it is nationwide on average, membership in the state is relatively strong compared to most other so-called right-to-work states. Nebraska first enacted so-ca;;ed right-to-work laws in 1947.
Though Nebraska has lower union membership than the U.S. as a whole, public sector workers in the state are slightly more likely to be unionized than most public workers nationwide. An estimated 35.1% of government employees in Nebraska are union members, compared to 34.8% of government workers nationwide.
[recirclink id=488094]

23. New Hampshire
> Workers in a labor union: 9.8% (total: 61,398)
> Change in union membership (2010-2020): -0.4 ppt. (23rd highest)
> Avg. annual wage: $53,950 (16th highest)
> Most unionized occupational group: Architecture and engineering occupations
Of all states in New England, New Hampshire has the lowest union participation rate. Just 9.8% of workers in the state are union members, a full percentage point below the comparable share of workers nationwide.
The lower than average union participation in the state is largely attributable to the private sector. Just 4.3% of private sector workers in New Hampshire are unionized, 2 percentage points below the national average. Meanwhile, 44.1% of the state’s public sector workers are in a union, nearly 10 percentage points higher than the U.S. average.

22. Delaware
> Workers in a labor union: 9.9% (total: 42,012)
> Change in union membership (2010-2020): -1.5 ppt. (13th lowest)
> Avg. annual wage: $54,370 (15th highest)
> Most unionized occupational group: Life, physical, and social science occupations
About one in every 10 workers in Delaware are members of a labor union, a slightly smaller share than the national average. As is the case nationwide, government workers are far more likely to be in a union than workers in the private sector. Less than 5% of the 356,000 private sector workers in Delaware are unionized, compared to well over a third of the state’s 68,000 public sector employees.
As is the case nationwide, the power of unions has eroded in Delaware over the last decade. As recently as 2010, 11.4% of workers in the state were union members.
[in-text-ad-2]
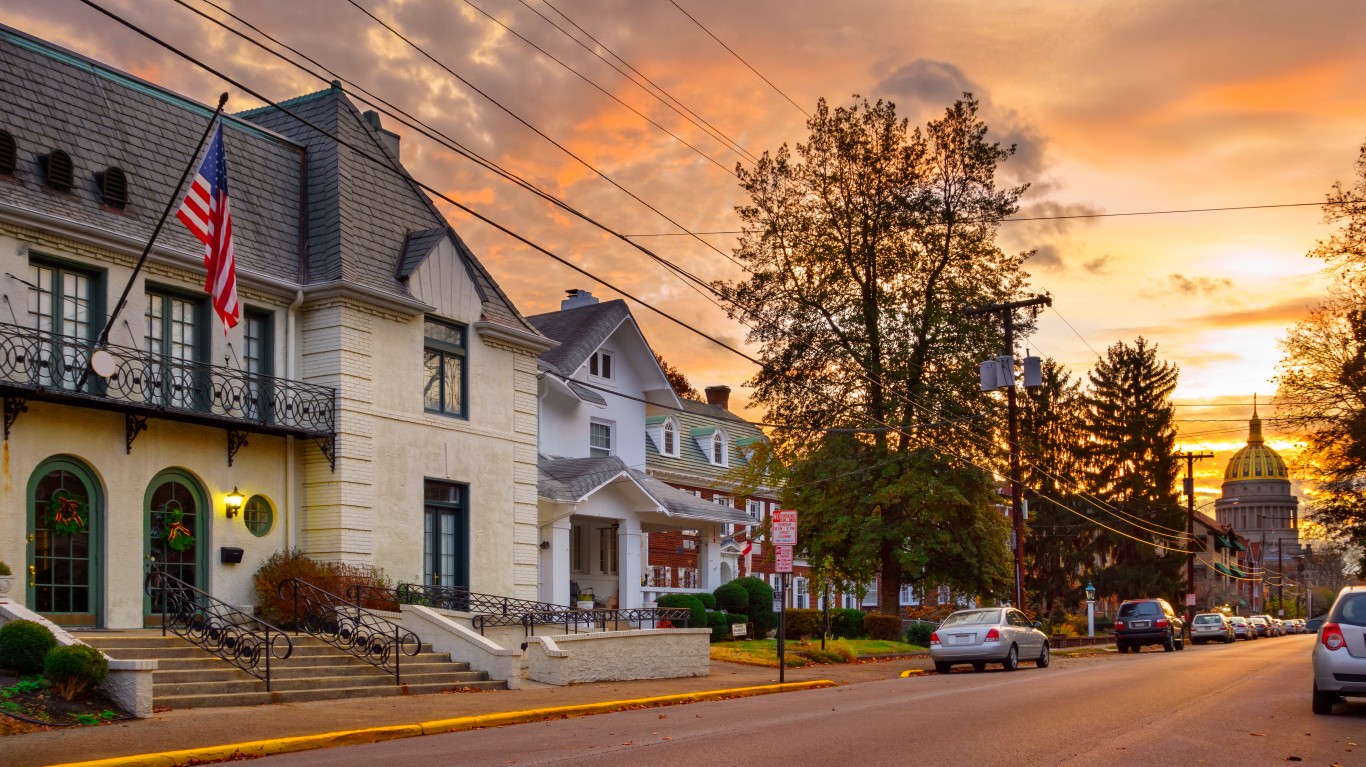
21. West Virginia
> Workers in a labor union: 10.6% (total: 70,962)
> Change in union membership (2010-2020): -4.1 ppt. (4th lowest)
> Avg. annual wage: $43,420 (4th lowest)
> Most unionized occupational group: Construction and extraction occupations
In West Virginia, 10.6% of workers are members of a labor union, just slightly below the national average. Though union membership is lower in the state than it is nationwide, unions are stronger in West Virginia than they are in nearly every other state with “right-to-work” laws.
West Virginia became a so-called right-to-work state in 2016 — and those relatively new laws appear to have had a meaningful impact on union membership. The share of workers in a union fell in the state by a near nation-leading 4.1 percentage points from 2010 to 2020.

20. Vermont
> Workers in a labor union: 11.8% (total: 31,331)
> Change in union membership (2010-2020): +0.0 ppt. (18th highest)
> Avg. annual wage: $51,120 (19th highest)
> Most unionized occupational group: Community and social service occupations
There are 264,700 people working in Vermont, and 11.8% of them are in a labor union — a larger share than in most other states. As is typically the case, public sector workers in the state are far more likely to be members of a union than their private sector workers. As recently as 2020, a new law made it easier for public sector workers to form unions in the state.
While union membership has been declining in most of the country over the last decade, in Vermont, it has remained unchanged. Some of the most powerful unions in the state include the Vermont State Employees Association and the American Federation of Teachers.
[in-text-ad]
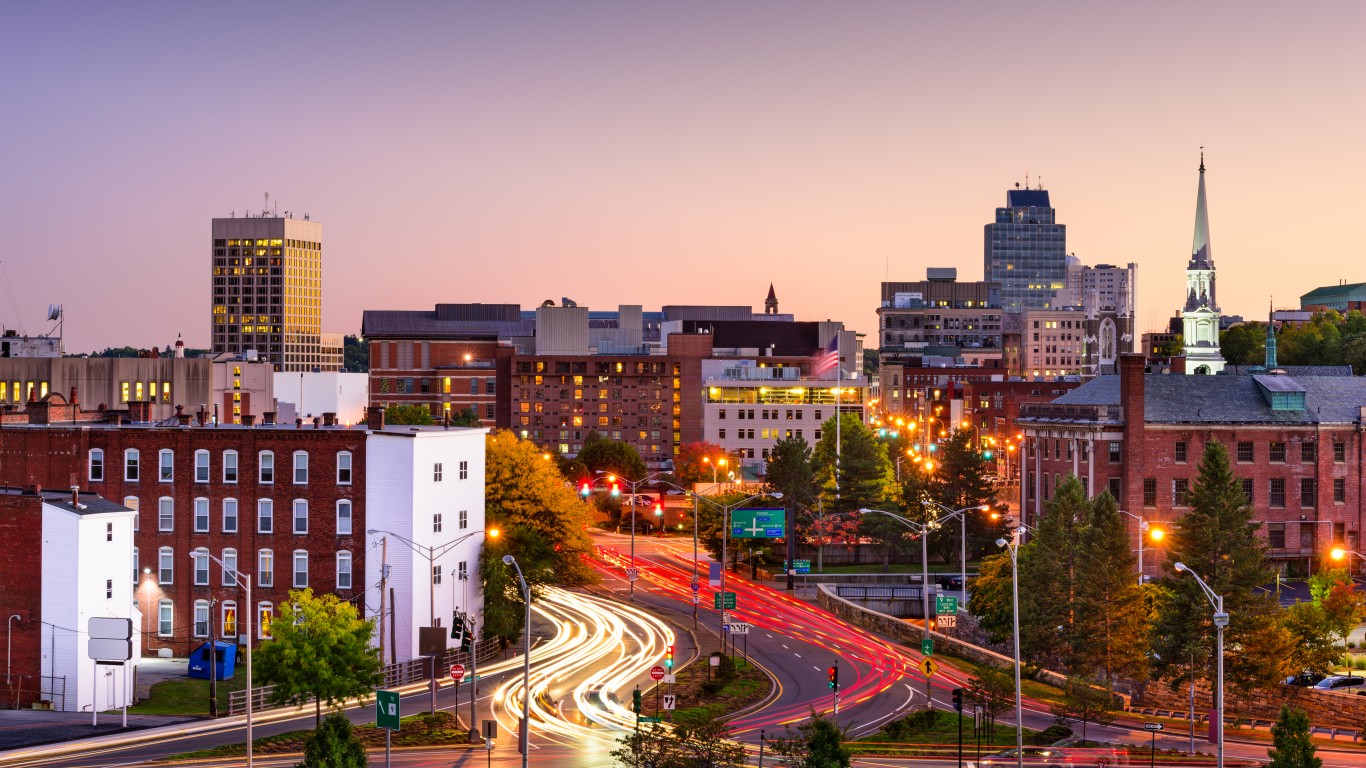
19. Massachusetts
> Workers in a labor union: 12.0% (total: 357,740)
> Change in union membership (2010-2020): -2.5 ppt. (7th lowest)
> Avg. annual wage: $65,680 (the highest)
> Most unionized occupational group: Life, physical, and social science occupations
There are over 357,700 union members working in Massachusetts, or 12.0% of the state’s total workforce. Union members include over half of the state’s 349,500 public sector workers — many of whom are members of the Massachusetts Teachers Association.
Despite the relative strength of organized labor in Massachusetts, the power of unions in the state is diminishing. Just a decade ago, 14.5% of workers in the state were union members.
[recirclink id=488247]

18. Montana
> Workers in a labor union: 12.0% (total: 50,324)
> Change in union membership (2010-2020): -0.7 ppt. (24th lowest)
> Avg. annual wage: $45,370 (10th lowest)
> Most unionized occupational group: Life, physical, and social science occupations
In Montana, a higher than average 12.0% share of workers are members of a union. That share is down from 12.7% a decade ago, and soon, union membership in the state may decline even even further.
This year, the Montana state legislature will consider a legislation that would make it a so-called right-to-work state. Though similar proposals have been shot down in the past, this year, the balance of political power appears favorable for passage of the new anti-union law.
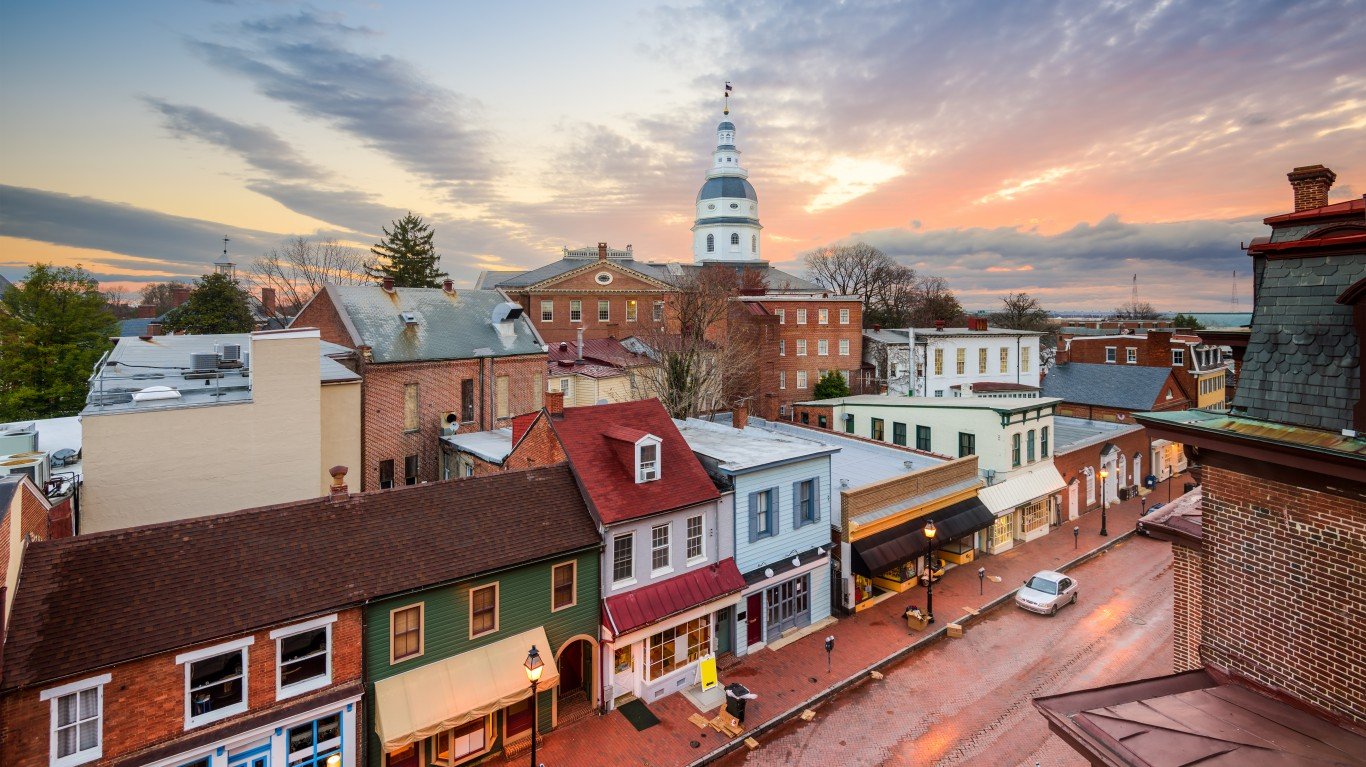
17. Maryland
> Workers in a labor union: 13.1% (total: 352,668)
> Change in union membership (2010-2020): +1.5 ppt. (6th highest)
> Avg. annual wage: $60,230 (6th highest)
> Most unionized occupational group: Life, physical, and social science occupations
Maryland has the highest union participation rate of any state in the South. Of the nearly 2.7 million people working in the state, 13.1% are members of a labor union.
Union membership peaked in Maryland in 1989, when 16.1% of workers were unionized. In the last decade, membership has fluctuated considerably in the state. Membership fell to an all-time low of 10.4% in 2015. Still, membership has picked back up in the years since, and the current union membership rate is 1.5 percentage points higher than it was in 2010.
[in-text-ad-2]
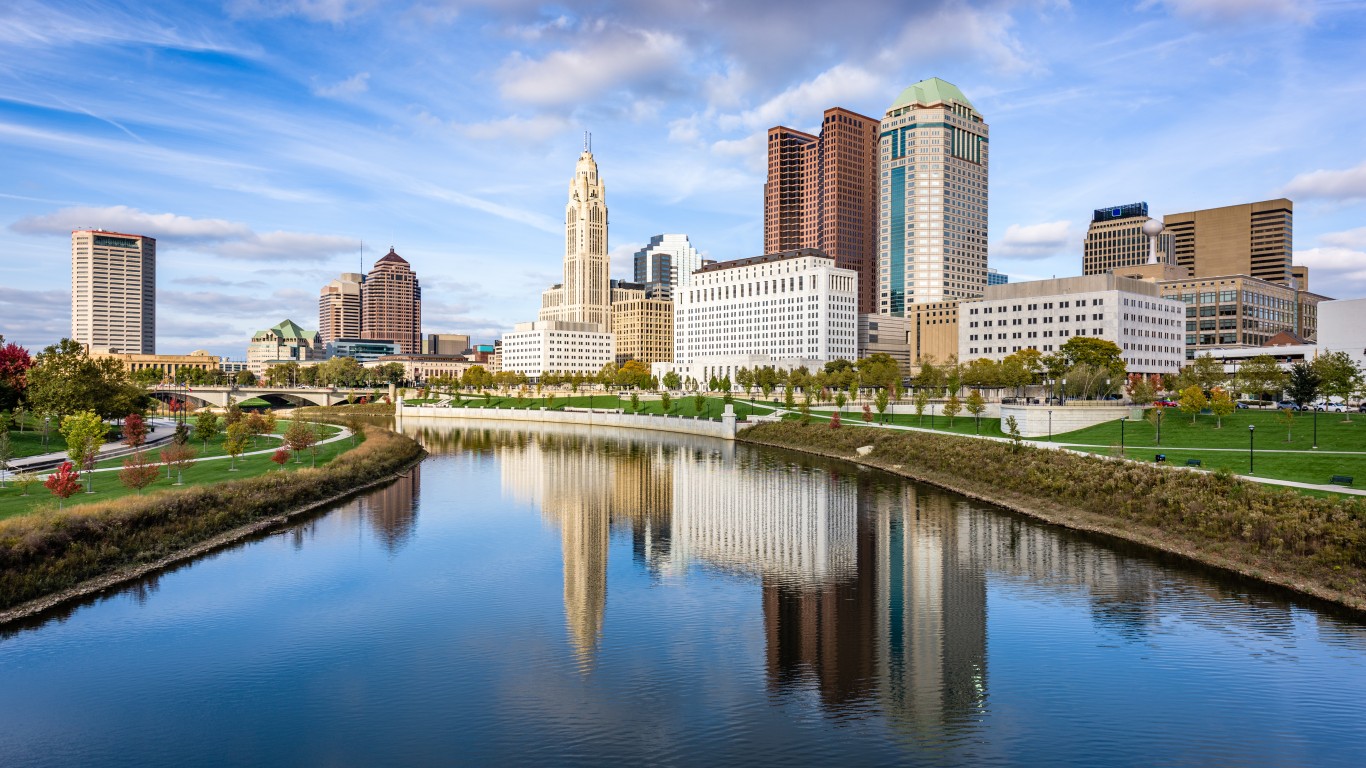
16. Ohio
> Workers in a labor union: 13.2% (total: 634,645)
> Change in union membership (2010-2020): -0.5 ppt. (24th highest)
> Avg. annual wage: $49,430 (25th lowest)
> Most unionized occupational group: Production occupations
In Ohio, 13.2% of workers are members of labor unions. Though union participation in the Buckeye State is down half a percentage point from a decade ago and is nearly half of what it was in the early 1990s, unions have been strengthening recently. In 2019, just 11.9% of workers in the state were unionized.
Ohio is home to a high concentration of manufacturing companies, and over the last decade, the share of union membership in private sector manufacturing in the state fell by 6.2 percentage points. Despite the decline, jobs in production have the highest union participation rate of any other occupational category in the state.
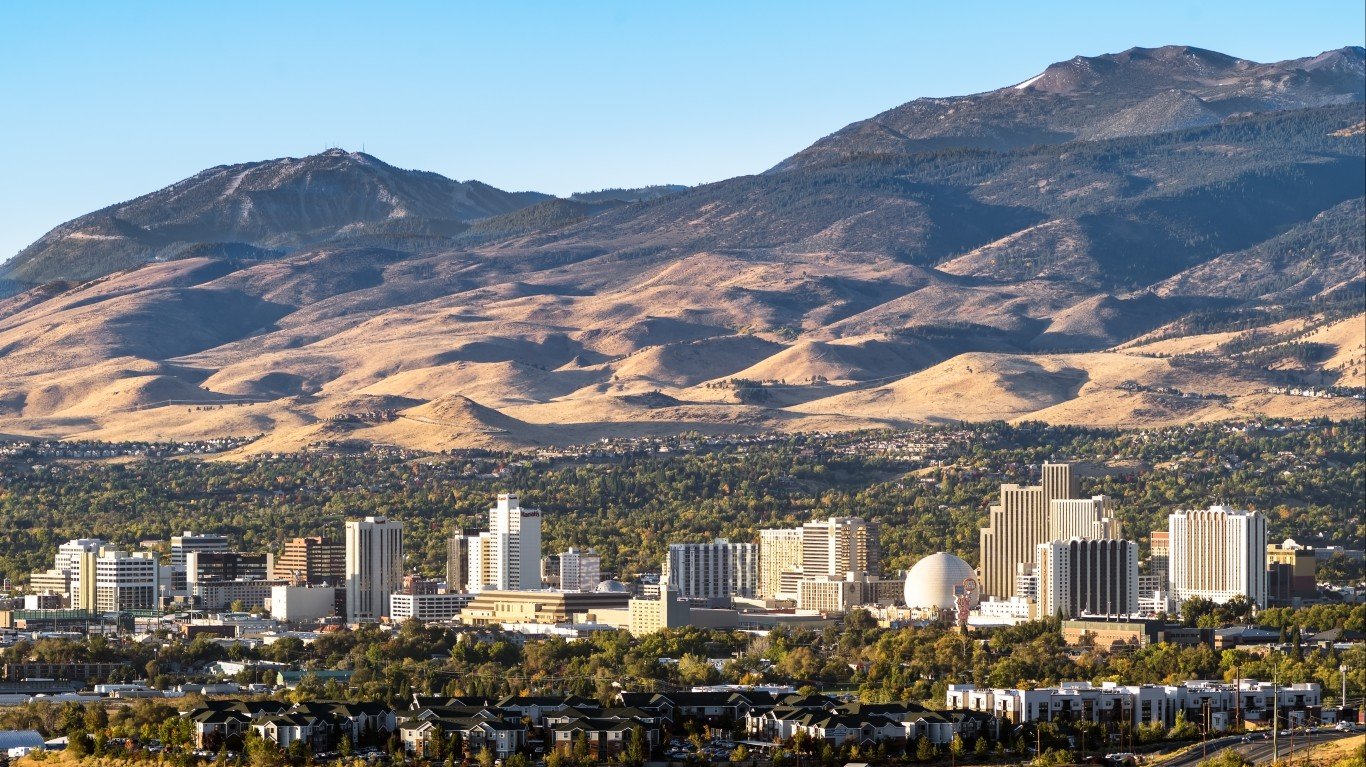
15. Nevada
> Workers in a labor union: 13.4% (total: 161,575)
> Change in union membership (2010-2020): -1.6 ppt. (12th lowest)
> Avg. annual wage: $47,210 (16th lowest)
> Most unionized occupational group: Personal care and service occupations
Nevada is one of the few states with so-called right-to-work laws where unions are stronger than they are in most of the rest of the country. Though “right-to-work” laws were enacted in 1952, the share of workers who are in a union in the state stands at 13.4% — 2.6 percentage points more than the national share.
The state’s largest union is the powerful and politically active Culinary Union. The 85-year-old organization counts 60,000 people who work primarily in Las Vegas restaurants, hotels, and casinos among its current members — well over a third of all union members in the state.
[in-text-ad]

14. Pennsylvania
> Workers in a labor union: 13.5% (total: 718,996)
> Change in union membership (2010-2020): -1.2 ppt. (20th lowest)
> Avg. annual wage: $51,340 (18th highest)
> Most unionized occupational group: Healthcare support occupations
Of the 5.3 million people working in Pennsylvania, 13.5% are members of a labor union. Participation in organized labor peaked in the state in 1989, when 20.9% of workers were unionized, and bottomed out in 2017 and again in 2019, when only 12.0% of workers were in a union.
Powerful unions in the Keystone State include United Steelworkers and Pennsylvania State Education Association.
[recirclink id=488174]

13. Illinois
> Workers in a labor union: 14.2% (total: 736,186)
> Change in union membership (2010-2020): -1.3 ppt. (18th lowest)
> Avg. annual wage: $55,130 (13th highest)
> Most unionized occupational group: Management occupations
In Illinois, 14.2% of workers are in a labor union, up from a multi-decade low of 13.6% in 2019. Unions in the state were at their strongest in 1993, when 21.0% of workers were unionized.
As is the case nationwide, unions are strongest in Illinois’ public sector. Over half of the state’s 636,700 government workers are in a union. Large unions with local chapters in the state include the Service Employees International Union, International Union of Operating Engineers, and the International Brotherhood of Electrical Workers.

12. Maine
> Workers in a labor union: 14.6% (total: 81,185)
> Change in union membership (2010-2020): +3.0 ppt. (the highest)
> Avg. annual wage: $48,470 (21st lowest)
> Most unionized occupational group: Healthcare support occupations
In Maine, 14.6% of workers are union members. While union participation has been eroding nationwide over the last decade, Maine is bucking that trend. The share of workers in the state who belong to a union increased by 3 percentage points in the last decade, the largest such increase of any state.
Currently, jobs in health care support have the highest unionization rate in Maine — and their numbers may soon grow. At the end of March 2021, nearly 2,000 nurses from Maine Medical Center, a network of hospitals in the state headquartered in Portland, will vote to decide whether or not to unionize.
[in-text-ad-2]

11. Michigan
> Workers in a labor union: 15.2% (total: 605,090)
> Change in union membership (2010-2020): -1.3 ppt. (19th lowest)
> Avg. annual wage: $50,780 (21st highest)
> Most unionized occupational group: Architecture and engineering occupations
Despite being a so-called right-to-work state since 2012, Michigan has nearly the highest union participation rate in the Midwest and the 11th highest of all states nationwide. Of the nearly 4 million workers in Michigan, 15.2% are members of a labor union.
Membership peaked in the state in 1989, when 26% of workers were in a union. Union membership in Michigan hit a low point in 2019, when only 13.6% of workers were unionized. United Auto Workers is one of the strongest unions in the state.
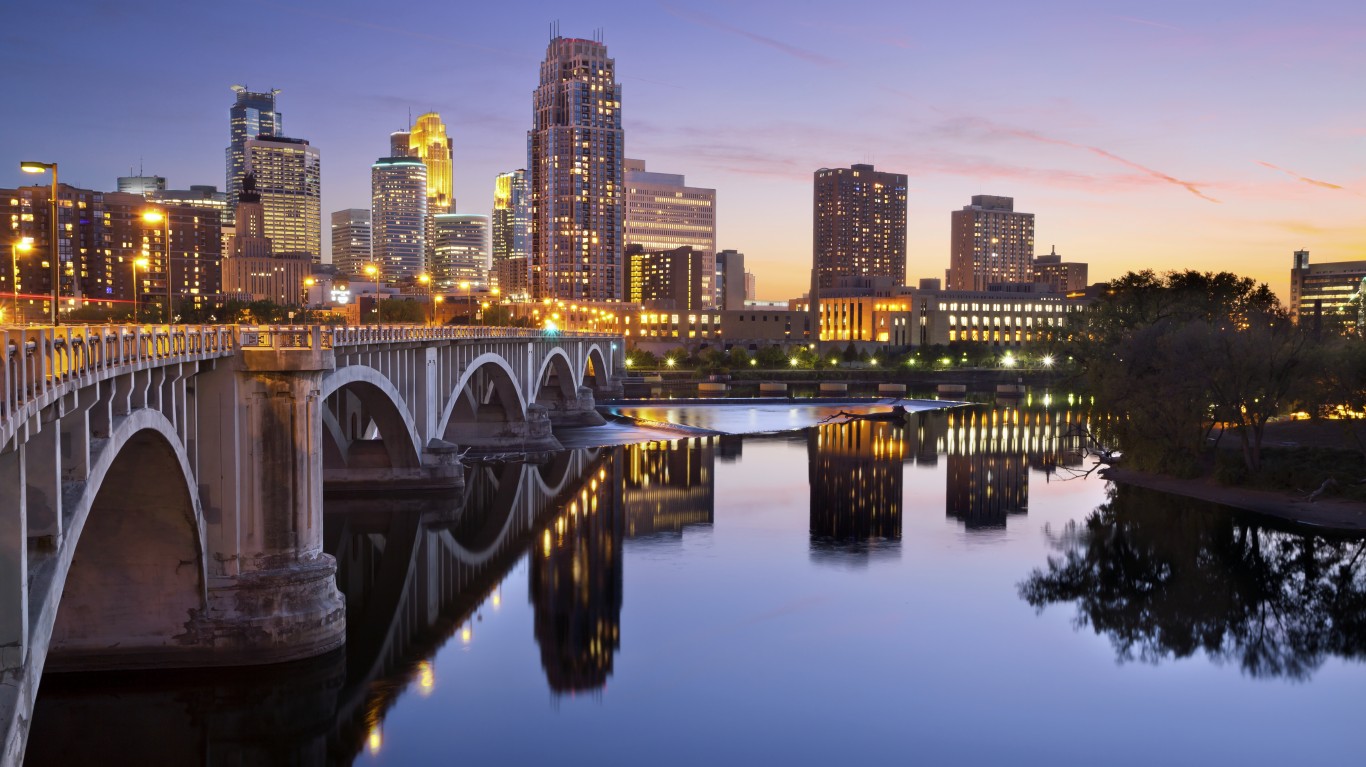
10. Minnesota
> Workers in a labor union: 15.8% (total: 398,607)
> Change in union membership (2010-2020): +0.2 ppt. (15th highest)
> Avg. annual wage: $55,890 (12th highest)
> Most unionized occupational group: Community and social service occupations
Minnesota has the highest union membership rate in the Midwest and 10th highest among all states. Some 15.8% or workers in the state are union members, 5 percentage points higher than the share of workers nationwide.
Unlike most states, union membership is currently at a 10-year high in Minnesota. The all-time high union participation rate was recorded in 1992, when 22% of workers in the state were unionized. Relatively strong unions in Minnesota are due in part to the state’s concentration of industries that have historically had organized labor such as mining and manufacturing.
[in-text-ad]

9. New Jersey
> Workers in a labor union: 16.1% (total: 598,811)
> Change in union membership (2010-2020): -1.0 ppt. (23rd lowest)
> Avg. annual wage: $59,980 (7th highest)
> Most unionized occupational group: Transportation and material moving occupations
Nearly 600,000 of the 3.7 million people working in New Jersey are union members — or 16.1% of the state’s workforce. The state’s high unionization rate is largely attributable to the public sector, where 59.2% of workers are in a union.
Union membership in the Garden State is down 1 percentage point from 2010 but up considerably from 2018, when membership hit a decade low of 14.9%. Some of the largest unions in the state include the New Jersey Education Association and the Northeast Regional Council of Carpenters.
[recirclink id=487977]
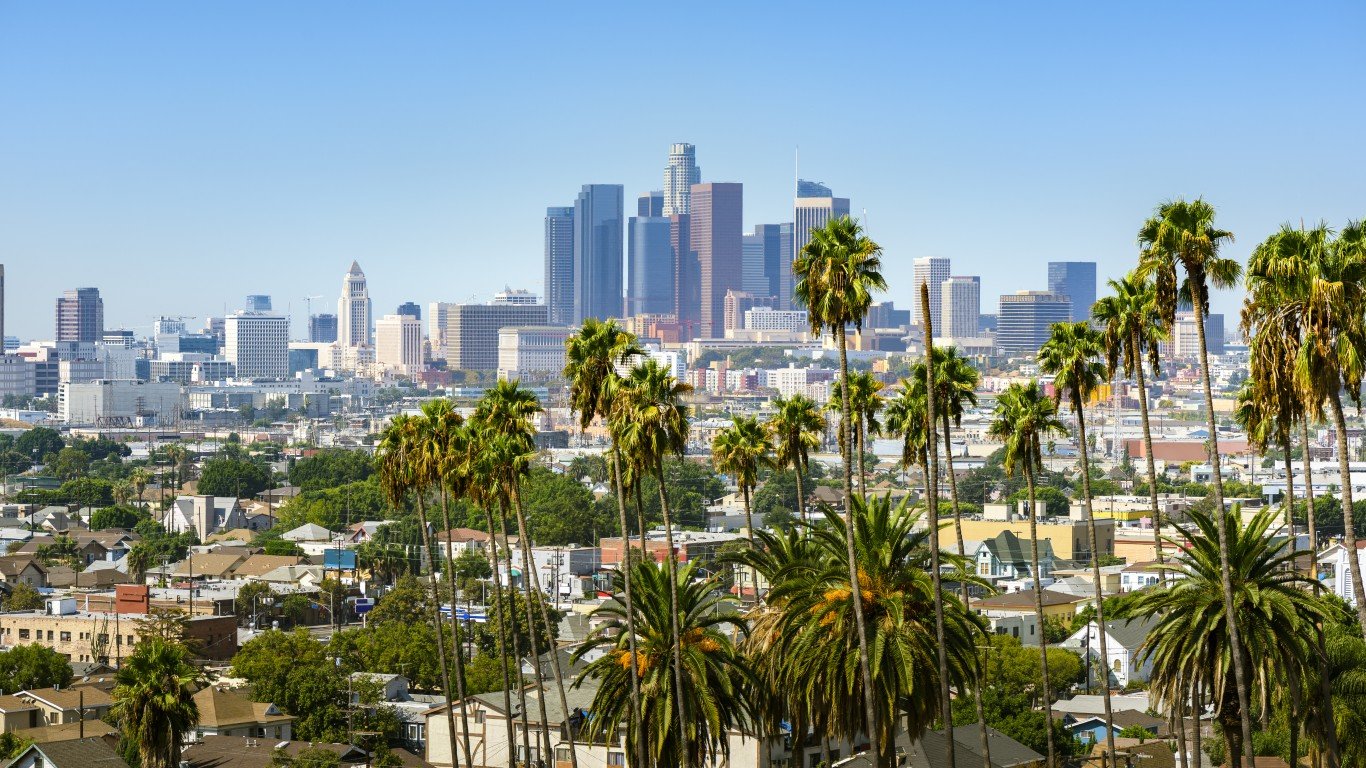
8. California
> Workers in a labor union: 16.2% (total: 2,438,451)
> Change in union membership (2010-2020): -1.3 ppt. (17th lowest)
> Avg. annual wage: $61,290 (5th highest)
> Most unionized occupational group: Farming, fishing, and forestry occupations
Nearly one in every 10 private sector workers in California, and over half of the state’s public sector workforce, are union members. The 2.4 million workers in the state who are unionized comprise 16.2% of the total workforce.
One of the largest and most powerful labor unions in the state is the California Teachers Association. The CTA alone has 310,000 members throughout 1,100 local chapters in school districts across the state. The CTA, along with other public sector unions in the state, including the California School Employees Association and the California Federation of Teachers, are influential forces in state politics.

7. Oregon
> Workers in a labor union: 16.2% (total: 274,075)
> Change in union membership (2010-2020): +0.0 ppt. (17th highest)
> Avg. annual wage: $53,890 (17th highest)
> Most unionized occupational group: Farming, fishing, and forestry occupations
Over a quarter of a million people in Oregon are members of a labor union, or 16.2% of the state’s total workforce. Union membership in Oregon peaked in 1989, when 21.6% of workers were in a union, and bottomed out in 2016, when just 13.5% were.
Private sector construction in Oregon has seen a surge in unionization in the last decade, as the share of union members in the workforce increased by nearly 10 percentage points, more than in any other state. Over that same period, employment in construction in the state also increased considerably.
[in-text-ad-2]
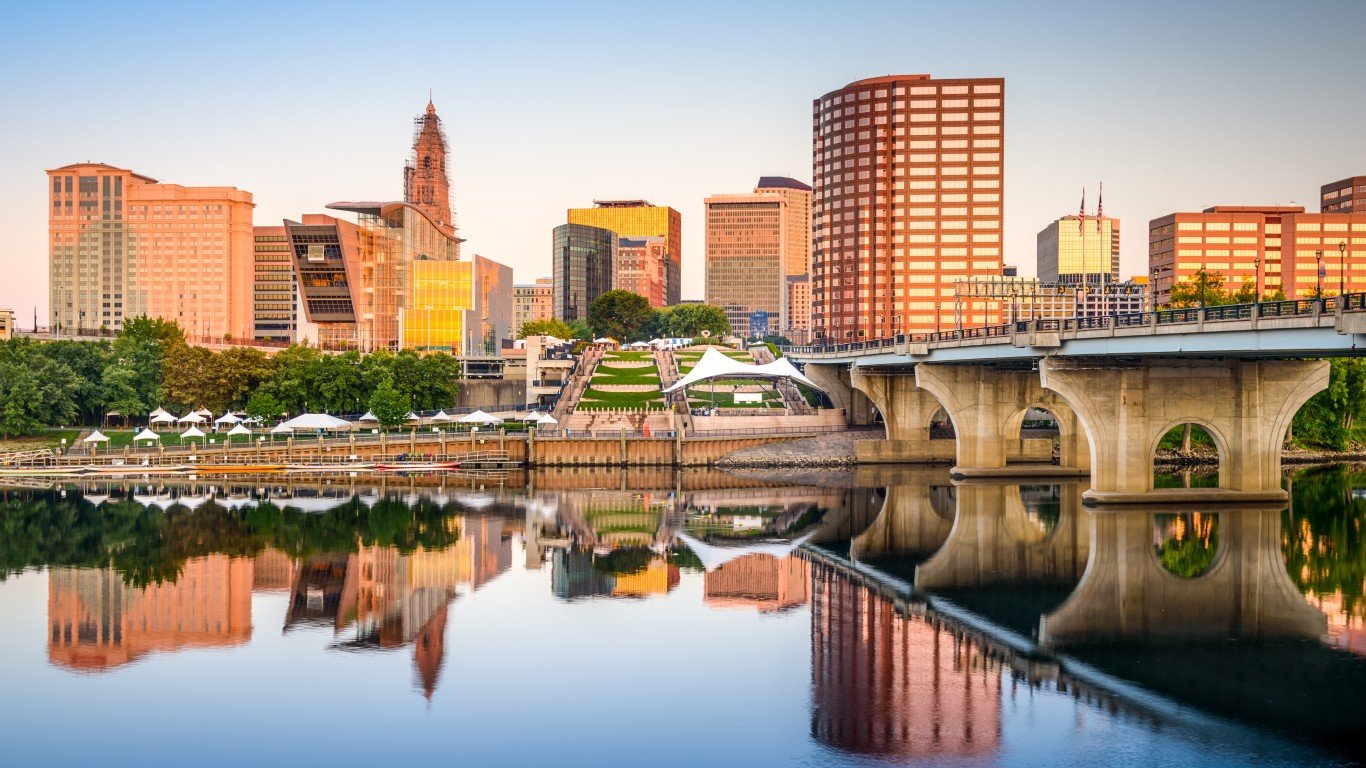
6. Connecticut
> Workers in a labor union: 17.1% (total: 260,510)
> Change in union membership (2010-2020): +0.4 ppt. (13th highest)
> Avg. annual wage: $62,350 (3rd highest)
> Most unionized occupational group: Community and social service occupations
Connecticut is one of several states in the Northeast with near nation-leading union participation. There are over a quarter of a million union members working in the state, or 17.1% of the total workforce. Nationwide, union membership has not been that high since the 1980s.
Organized labor is especially concentrated in Connecticut’s public sector. Nearly two-thirds of government workers in Connecticut are union members, the second largest such share of any state. One of the most influential public sector unions in the state is the American Federation of State, County and Municipal Employees Council.

5. Washington
> Workers in a labor union: 17.4% (total: 557,128)
> Change in union membership (2010-2020): -2.1 ppt. (10th lowest)
> Avg. annual wage: $62,020 (4th highest)
> Most unionized occupational group: Farming, fishing, and forestry occupations
In Washington state, 17.4% of the workforce are members of a labor union, the fifth largest share of any state. As is often the case in states with high union membership, wages are relatively high in Washington. The average annual wage in the state of $62,020 is higher than in all but three other states.
Though overall union membership in the state is down slightly since 2010, private sector construction in Washington has seen a surge in unionization in the last decade, as the share of union members working in construction increased by 7.3 percentage points, more than in any other state except Oregon. Over that same period, employment in construction in the state also increased considerably.
[in-text-ad]
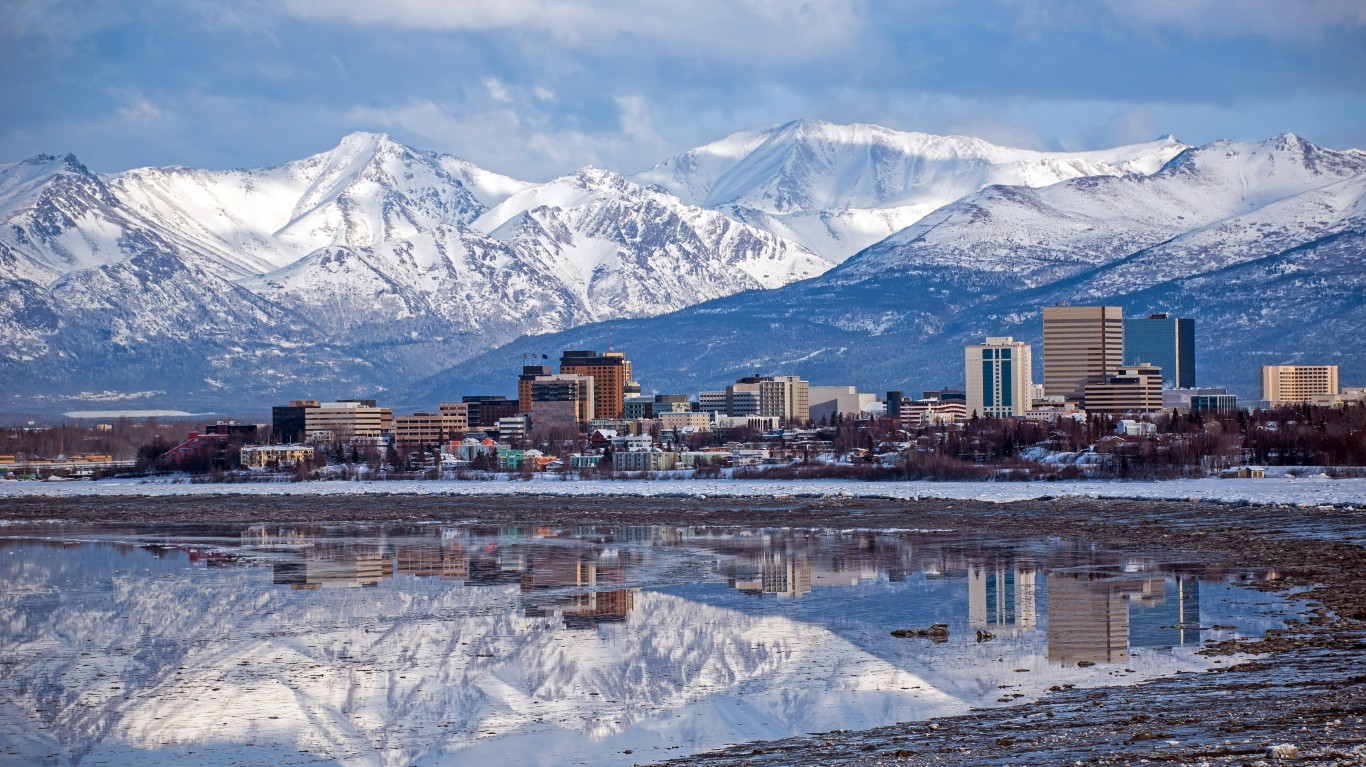
4. Alaska
> Workers in a labor union: 17.6% (total: 49,281)
> Change in union membership (2010-2020): -5.3 ppt. (2nd lowest)
> Avg. annual wage: $59,290 (8th highest)
> Most unionized occupational group: Life, physical, and social science occupations
In Alaska, 17.6% of workers are union members. As is often the case in states with high union membership, over half of all public sector workers are unionized in the state. Alaska is also one of only eight states where more than 9% workers in the private sector are in a union.
In the last 20 years, union membership has fluctuated considerably in Alaska. As recently as 2002, nearly one-quarter of all workers in the state were part of a union. Union membership also hit a multi-decade low of 17.1% in 2019.
[recirclink id=487572]

3. Rhode Island
> Workers in a labor union: 17.8% (total: 81,098)
> Change in union membership (2010-2020): +1.4 ppt. (7th highest)
> Avg. annual wage: $57,220 (10th highest)
> Most unionized occupational group: Community and social service occupations
Rhode Island’s 17.8% union membership rate is the highest in the New England region and third highest of any state nationwide. Over the last decade, as the power of labor unions has been diminished in much of the country, unions in Rhode Island gained strength. The share of workers who are union members in the state is 1.4 percentage points higher now than it was in 2010.
States where union members comprise larger shares of the workforce typically also report higher than average wages. In Rhode Island, the average annual wage of $57,220 is the 10th highest among states.

2. New York
> Workers in a labor union: 22.0% (total: 1,662,696)
> Change in union membership (2010-2020): -2.2 ppt. (8th lowest)
> Avg. annual wage: $63,970 (2nd highest)
> Most unionized occupational group: Arts, design, entertainment, sports, and media occupations
New York is one of only two states where more than one in five workers are members of a labor union. The 22% share of workers in the state who are unionized is the largest of any state in the Northeast and second largest of any state nationwide. As is the case nationwide, unions in New York have weakened in the last decade. The share of union members in the state’s workforce fell by 2.2 percentage points since 2010 and 2.7 percentage points from the decade’s peak in 2015.
Of the nearly 1.7 million union workers in the state, about 874,000 hold jobs in the public sector. New York is one of only three states where more than two-thirds of government employees belong to unions.
[in-text-ad-2]

1. Hawaii
> Workers in a labor union: 23.6% (total: 119,843)
> Change in union membership (2010-2020): +1.9 ppt. (4th highest)
> Avg. annual wage: $54,930 (14th highest)
> Most unionized occupational group: Building and grounds cleaning and maintenance occupations
In Hawaii, 23.6% of the workforce are members of a labor union, the largest share of any state in the country. Union membership peaked in the state in 1989, when 29.9% of workers were in a union — and bottomed out in 2016, when 19.9% of workers were. Though well below the all-time high, union membership is 1.9 percentage points higher in Hawaii now than a decade ago.
Hawaii’s largest union is the Hawaii Government Employees Association — tens of thousands of workers in the state government, as well as local governments, are members. Few state economies have been hit as hard as Hawaii’s by the COVID-19 recession, and some speculate that the spiking unemployment of the recent months may have also resulted in diminished union membership in the state.
Methodology:
To determine the states with the strongest and weakest unions, 24/7 Wall St. reviewed union membership statistics from UnionStats, a database powered by the U.S. Census Bureau’s Current Population Survey. States were ranked based on the number of workers in unions as a percentage of total employment. Additional data on historical union membership and union membership by sector also came from UnionStats. Supplemental data on annual median wage came from the Bureau of Labor Statistics’ Occupational Employment Statistics program and is for 2019.
Contact [email protected] for any questions or corrections.