
Nearly half of all Americans with health insurance receive coverage through their employer. When the COVID-19 pandemic hit, however, millions of Americans lost their jobs, and nearly 30% of U.S. residents lost their health insurance coverage. While many have returned to employment, health insurance coverage levels are likely still far from the pre-pandemic normal.
It remains to be seen how much of an impact the pandemic has truly had on health coverage in the United States, but there are a number of American cities where even a substantial loss of insurance coverage would not have driven coverage levels below the national figure.
According to the five-year average through 2019, the most recent year for which data is available through the U.S. Census, as many as 10.3% of Americans did not have health insurance coverage. In a number of American cities, the uninsured rate was far below this, in many cases less than 5%.
To determine the cities with the best health insurance coverage in every state, 24/7 Wall St. reviewed five-year estimates of the percentage of the noninstitutionalized civilian population under 65 without health insurance from the U.S. Census Bureau’s 2019 American Community Survey. We looked at the population under 65 because Americans 65 and older are automatically entitled to Medicare benefits.
The city with the highest health insurance coverage rate in the state has a lower share of uninsured residents than the national 10.3% share in all cases but one. Fairbanks, Alaska, has the lowest uninsured rate among the state’s three qualifying cities, at 10.8%.
Among the other cities to make this list, generally it is the case that in states with higher insurance coverage of the under 65 population, there is at least one city where less than 5% of the under 65 population lacks health insurance. Massachusetts has the lowest uninsured rate in the country, at just 3.2% of the population under 65. The Wellesley, Massachusetts, census designated place has the lowest uninsured rate of any place to qualify for this ranking, at 1.2%.
Click here to see the city with the best health insurance coverage in every state.
Click here to see our detailed methodology.

Alabama: Vestavia Hills
> Adults under 65, no health insurance: 4.0% (Alabama: 11.3%)
> Adults under 65, Medicare coverage (or multiple types): 0.9% (Alabama: 4.9%)
> Adults under 65, Medicaid coverage (or multiple types): 3.5% (Alabama: 20.9%)
> Adults under 65, VA coverage (or multiple types): 0.4% (Alabama: 1.7%)
> Adults under 65, employer-based insurance (or multiple types): 81.4% (Alabama: 57.8%)
> Adults under 65, direct-purchase insurance (or multiple types): 14.0% (Alabama: 10.5%)
> Adults under 65, Tricare/military insurance (or many types): 1.0% (Alabama: 3.3%)
[in-text-ad]
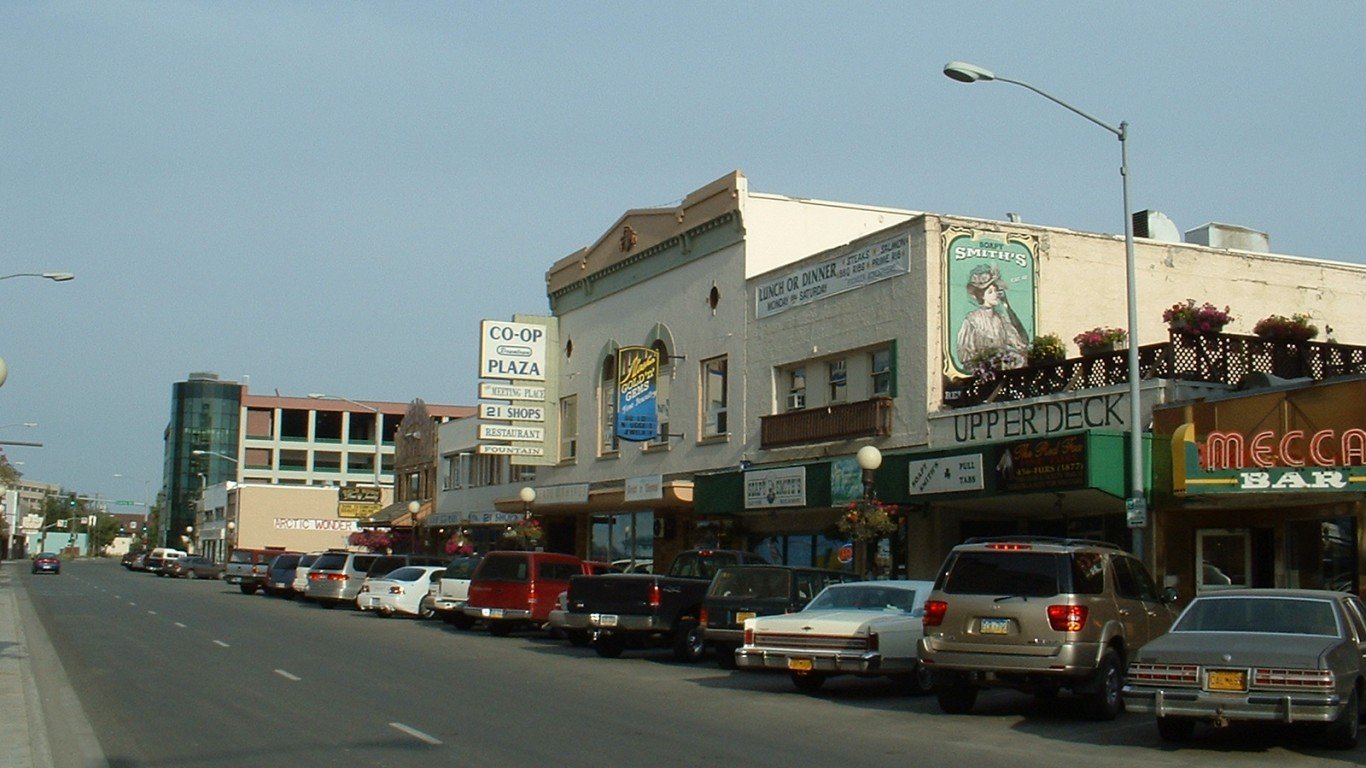
Alaska: Fairbanks
> Adults under 65, no health insurance: 10.8% (Alaska: 15.3%)
> Adults under 65, Medicare coverage (or multiple types): 2.1% (Alaska: 1.9%)
> Adults under 65, Medicaid coverage (or multiple types): 18.0% (Alaska: 21.1%)
> Adults under 65, VA coverage (or multiple types): 2.9% (Alaska: 3.0%)
> Adults under 65, employer-based insurance (or multiple types): 45.7% (Alaska: 54.4%)
> Adults under 65, direct-purchase insurance (or multiple types): 5.3% (Alaska: 6.9%)
> Adults under 65, Tricare/military insurance (or many types): 30.4% (Alaska: 9.6%)
[recirclink id=824405]

Arizona: Oro Valley
> Adults under 65, no health insurance: 4.0% (Arizona: 12.4%)
> Adults under 65, Medicare coverage (or multiple types): 1.9% (Arizona: 2.6%)
> Adults under 65, Medicaid coverage (or multiple types): 9.4% (Arizona: 24.1%)
> Adults under 65, VA coverage (or multiple types): 1.4% (Arizona: 1.5%)
> Adults under 65, employer-based insurance (or multiple types): 75.0% (Arizona: 55.1%)
> Adults under 65, direct-purchase insurance (or multiple types): 12.4% (Arizona: 9.7%)
> Adults under 65, Tricare/military insurance (or many types): 4.2% (Arizona: 2.4%)

Arkansas: Bella Vista
> Adults under 65, no health insurance: 5.3% (Arkansas: 10.1%)
> Adults under 65, Medicare coverage (or multiple types): 3.2% (Arkansas: 5.1%)
> Adults under 65, Medicaid coverage (or multiple types): 7.8% (Arkansas: 28.6%)
> Adults under 65, VA coverage (or multiple types): 2.4% (Arkansas: 1.8%)
> Adults under 65, employer-based insurance (or multiple types): 76.8% (Arkansas: 51.8%)
> Adults under 65, direct-purchase insurance (or multiple types): 11.4% (Arkansas: 10.2%)
> Adults under 65, Tricare/military insurance (or many types): 1.8% (Arkansas: 2.3%)
[in-text-ad-2]

California: San Carlos
> Adults under 65, no health insurance: 1.7% (California: 8.6%)
> Adults under 65, Medicare coverage (or multiple types): 0.9% (California: 2.2%)
> Adults under 65, Medicaid coverage (or multiple types): 4.9% (California: 27.1%)
> Adults under 65, VA coverage (or multiple types): 0.3% (California: 0.9%)
> Adults under 65, employer-based insurance (or multiple types): 84.1% (California: 55.7%)
> Adults under 65, direct-purchase insurance (or multiple types): 12.1% (California: 10.9%)
> Adults under 65, Tricare/military insurance (or many types): 0.0% reported (California: 1.4%)
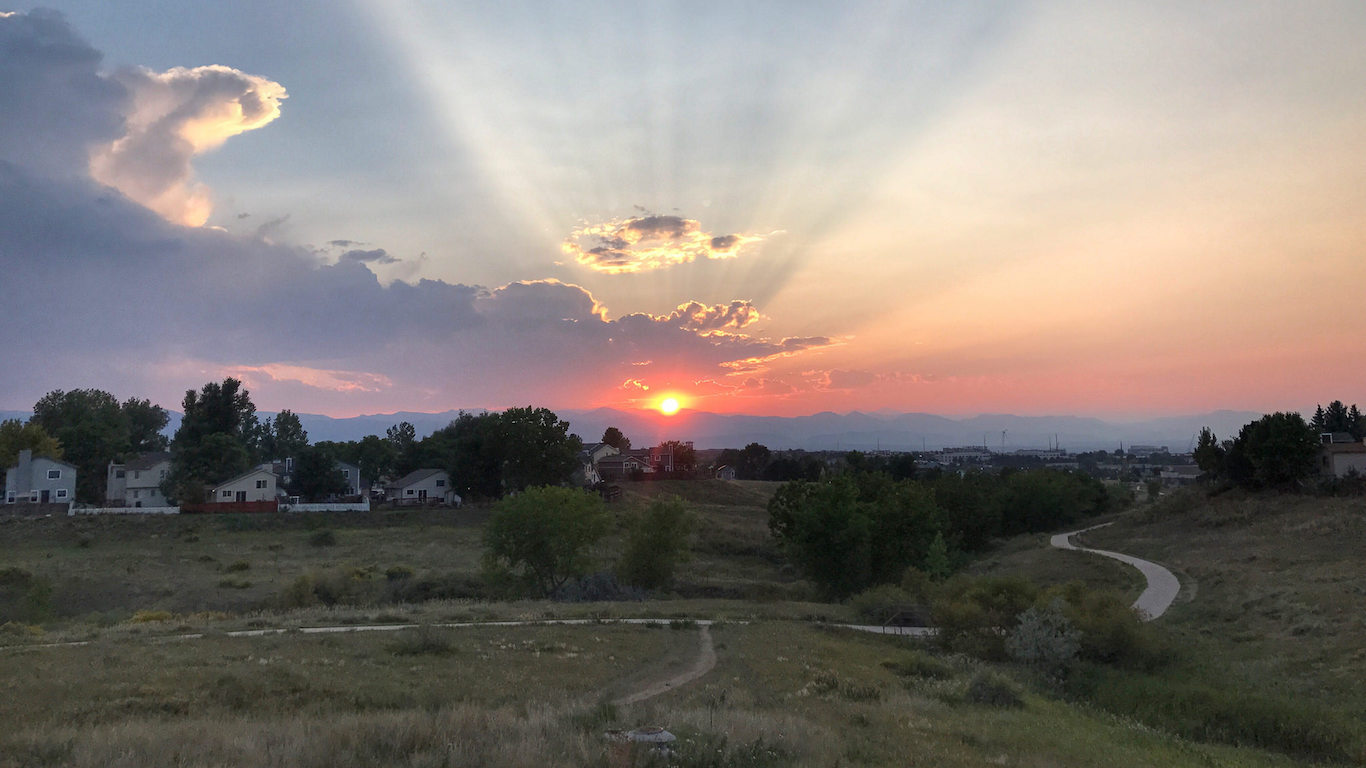
Colorado: Highlands Ranch
> Adults under 65, no health insurance: 2.0% (Colorado: 8.7%)
> Adults under 65, Medicare coverage (or multiple types): 0.8% (Colorado: 2.1%)
> Adults under 65, Medicaid coverage (or multiple types): 6.1% (Colorado: 19.8%)
> Adults under 65, VA coverage (or multiple types): 0.7% (Colorado: 1.5%)
> Adults under 65, employer-based insurance (or multiple types): 83.5% (Colorado: 60.5%)
> Adults under 65, direct-purchase insurance (or multiple types): 11.0% (Colorado: 11.4%)
> Adults under 65, Tricare/military insurance (or many types): 1.4% (Colorado: 3.5%)
[in-text-ad]

Connecticut: Westport
> Adults under 65, no health insurance: 2.2% (Connecticut: 6.3%)
> Adults under 65, Medicare coverage (or multiple types): 0.3% (Connecticut: 2.4%)
> Adults under 65, Medicaid coverage (or multiple types): 5.9% (Connecticut: 21.6%)
> Adults under 65, VA coverage (or multiple types): 0.1% (Connecticut: 0.7%)
> Adults under 65, employer-based insurance (or multiple types): 79.1% (Connecticut: 65.1%)
> Adults under 65, direct-purchase insurance (or multiple types): 15.9% (Connecticut: 9.4%)
> Adults under 65, Tricare/military insurance (or many types): 0.2% (Connecticut: 1.0%)
[recirclink id=880865]

Delaware: Newark
> Adults under 65, no health insurance: 3.5% (Delaware: 6.8%)
> Adults under 65, Medicare coverage (or multiple types): 1.5% (Delaware: 3.3%)
> Adults under 65, Medicaid coverage (or multiple types): 9.0% (Delaware: 22.5%)
> Adults under 65, VA coverage (or multiple types): 0.5% (Delaware: 1.0%)
> Adults under 65, employer-based insurance (or multiple types): 72.6% (Delaware: 64.4%)
> Adults under 65, direct-purchase insurance (or multiple types): 19.5% (Delaware: 8.6%)
> Adults under 65, Tricare/military insurance (or many types): 1.6% (Delaware: 2.6%)

Florida: Keystone
> Adults under 65, no health insurance: 4.4% (Florida: 15.7%)
> Adults under 65, Medicare coverage (or multiple types): 0.8% (Florida: 3.1%)
> Adults under 65, Medicaid coverage (or multiple types): 4.2% (Florida: 19.2%)
> Adults under 65, VA coverage (or multiple types): 1.0% (Florida: 1.6%)
> Adults under 65, employer-based insurance (or multiple types): 73.9% (Florida: 50.6%)
> Adults under 65, direct-purchase insurance (or multiple types): 19.6% (Florida: 14.5%)
> Adults under 65, Tricare/military insurance (or many types): 2.3% (Florida: 2.7%)
[in-text-ad-2]

Georgia: Evans
> Adults under 65, no health insurance: 6.4% (Georgia: 15.2%)
> Adults under 65, Medicare coverage (or multiple types): 2.3% (Georgia: 3.0%)
> Adults under 65, Medicaid coverage (or multiple types): 4.9% (Georgia: 17.9%)
> Adults under 65, VA coverage (or multiple types): 2.9% (Georgia: 1.5%)
> Adults under 65, employer-based insurance (or multiple types): 69.1% (Georgia: 56.9%)
> Adults under 65, direct-purchase insurance (or multiple types): 10.3% (Georgia: 10.2%)
> Adults under 65, Tricare/military insurance (or many types): 17.0% (Georgia: 3.4%)

Hawaii: East Honolulu
> Adults under 65, no health insurance: 1.8% (Hawaii: 4.6%)
> Adults under 65, Medicare coverage (or multiple types): 1.2% (Hawaii: 1.8%)
> Adults under 65, Medicaid coverage (or multiple types): 6.8% (Hawaii: 19.0%)
> Adults under 65, VA coverage (or multiple types): 1.2% (Hawaii: 1.5%)
> Adults under 65, employer-based insurance (or multiple types): 79.3% (Hawaii: 66.3%)
> Adults under 65, direct-purchase insurance (or multiple types): 14.4% (Hawaii: 9.5%)
> Adults under 65, Tricare/military insurance (or many types): 3.3% (Hawaii: 8.8%)
[in-text-ad]

Idaho: Eagle
> Adults under 65, no health insurance: 4.4% (Idaho: 12.4%)
> Adults under 65, Medicare coverage (or multiple types): 1.7% (Idaho: 2.8%)
> Adults under 65, Medicaid coverage (or multiple types): 7.6% (Idaho: 18.2%)
> Adults under 65, VA coverage (or multiple types): 1.3% (Idaho: 1.6%)
> Adults under 65, employer-based insurance (or multiple types): 72.5% (Idaho: 57.4%)
> Adults under 65, direct-purchase insurance (or multiple types): 18.7% (Idaho: 13.8%)
> Adults under 65, Tricare/military insurance (or many types): 2.2% (Idaho: 2.5%)
[recirclink id=880688]

Illinois: Northbrook
> Adults under 65, no health insurance: 1.6% (Illinois: 7.9%)
> Adults under 65, Medicare coverage (or multiple types): 0.7% (Illinois: 2.4%)
> Adults under 65, Medicaid coverage (or multiple types): 2.7% (Illinois: 21.0%)
> Adults under 65, VA coverage (or multiple types): 0.0% reported (Illinois: 0.8%)
> Adults under 65, employer-based insurance (or multiple types): 82.9% (Illinois: 63.6%)
> Adults under 65, direct-purchase insurance (or multiple types): 14.4% (Illinois: 9.5%)
> Adults under 65, Tricare/military insurance (or many types): 0.2% (Illinois: 0.9%)

Indiana: Fishers
> Adults under 65, no health insurance: 3.2% (Indiana: 9.8%)
> Adults under 65, Medicare coverage (or multiple types): 0.9% (Indiana: 3.2%)
> Adults under 65, Medicaid coverage (or multiple types): 3.9% (Indiana: 19.1%)
> Adults under 65, VA coverage (or multiple types): 0.8% (Indiana: 1.2%)
> Adults under 65, employer-based insurance (or multiple types): 84.6% (Indiana: 64.2%)
> Adults under 65, direct-purchase insurance (or multiple types): 11.0% (Indiana: 8.8%)
> Adults under 65, Tricare/military insurance (or many types): 2.3% (Indiana: 1.2%)
[in-text-ad-2]

Iowa: West Des Moines
> Adults under 65, no health insurance: 3.3% (Iowa: 5.5%)
> Adults under 65, Medicare coverage (or multiple types): 1.5% (Iowa: 2.5%)
> Adults under 65, Medicaid coverage (or multiple types): 12.1% (Iowa: 20.4%)
> Adults under 65, VA coverage (or multiple types): 1.1% (Iowa: 1.1%)
> Adults under 65, employer-based insurance (or multiple types): 78.9% (Iowa: 67.4%)
> Adults under 65, direct-purchase insurance (or multiple types): 8.9% (Iowa: 10.6%)
> Adults under 65, Tricare/military insurance (or many types): 1.4% (Iowa: 1.3%)

Kansas: Manhattan
> Adults under 65, no health insurance: 6.1% (Kansas: 10.3%)
> Adults under 65, Medicare coverage (or multiple types): 1.5% (Kansas: 2.7%)
> Adults under 65, Medicaid coverage (or multiple types): 9.5% (Kansas: 14.5%)
> Adults under 65, VA coverage (or multiple types): 2.3% (Kansas: 1.4%)
> Adults under 65, employer-based insurance (or multiple types): 64.9% (Kansas: 65.2%)
> Adults under 65, direct-purchase insurance (or multiple types): 19.9% (Kansas: 11.4%)
> Adults under 65, Tricare/military insurance (or many types): 8.1% (Kansas: 3.4%)
[in-text-ad]

Kentucky: Independence
> Adults under 65, no health insurance: 4.6% (Kentucky: 6.7%)
> Adults under 65, Medicare coverage (or multiple types): 2.2% (Kentucky: 5.0%)
> Adults under 65, Medicaid coverage (or multiple types): 13.0% (Kentucky: 28.5%)
> Adults under 65, VA coverage (or multiple types): 1.6% (Kentucky: 1.5%)
> Adults under 65, employer-based insurance (or multiple types): 79.1% (Kentucky: 57.3%)
> Adults under 65, direct-purchase insurance (or multiple types): 5.3% (Kentucky: 8.2%)
> Adults under 65, Tricare/military insurance (or many types): 1.0% (Kentucky: 2.3%)
[recirclink id=824405]
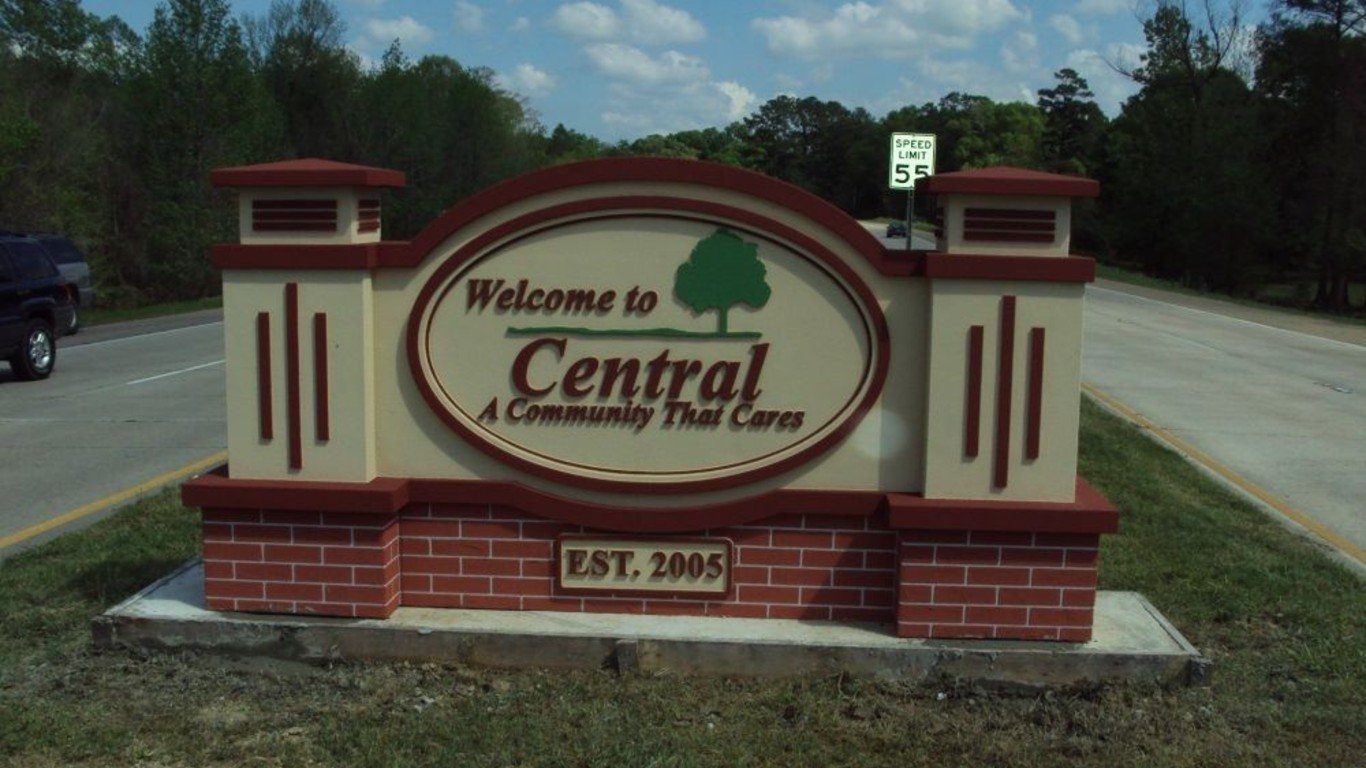
Louisiana: Central
> Adults under 65, no health insurance: 5.8% (Louisiana: 11.0%)
> Adults under 65, Medicare coverage (or multiple types): 3.3% (Louisiana: 4.0%)
> Adults under 65, Medicaid coverage (or multiple types): 13.8% (Louisiana: 28.4%)
> Adults under 65, VA coverage (or multiple types): 1.2% (Louisiana: 1.3%)
> Adults under 65, employer-based insurance (or multiple types): 74.2% (Louisiana: 52.3%)
> Adults under 65, direct-purchase insurance (or multiple types): 8.8% (Louisiana: 9.6%)
> Adults under 65, Tricare/military insurance (or many types): 2.3% (Louisiana: 2.2%)

Maine: South Portland
> Adults under 65, no health insurance: 7.3% (Maine: 9.8%)
> Adults under 65, Medicare coverage (or multiple types): 3.6% (Maine: 4.5%)
> Adults under 65, Medicaid coverage (or multiple types): 14.2% (Maine: 19.3%)
> Adults under 65, VA coverage (or multiple types): 0.5% (Maine: 1.8%)
> Adults under 65, employer-based insurance (or multiple types): 68.5% (Maine: 61.5%)
> Adults under 65, direct-purchase insurance (or multiple types): 13.2% (Maine: 11.0%)
> Adults under 65, Tricare/military insurance (or many types): 0.4% (Maine: 2.3%)
[in-text-ad-2]

Maryland: Eldersburg
> Adults under 65, no health insurance: 1.7% (Maryland: 6.9%)
> Adults under 65, Medicare coverage (or multiple types): 1.6% (Maryland: 2.6%)
> Adults under 65, Medicaid coverage (or multiple types): 8.1% (Maryland: 19.1%)
> Adults under 65, VA coverage (or multiple types): 1.0% (Maryland: 1.2%)
> Adults under 65, employer-based insurance (or multiple types): 83.4% (Maryland: 65.7%)
> Adults under 65, direct-purchase insurance (or multiple types): 8.3% (Maryland: 9.6%)
> Adults under 65, Tricare/military insurance (or many types): 4.2% (Maryland: 3.1%)

Massachusetts: Wellesley
> Adults under 65, no health insurance: 1.2% (Massachusetts: 3.2%)
> Adults under 65, Medicare coverage (or multiple types): 0.7% (Massachusetts: 2.5%)
> Adults under 65, Medicaid coverage (or multiple types): 4.3% (Massachusetts: 24.0%)
> Adults under 65, VA coverage (or multiple types): 0.2% (Massachusetts: 0.6%)
> Adults under 65, employer-based insurance (or multiple types): 81.1% (Massachusetts: 67.5%)
> Adults under 65, direct-purchase insurance (or multiple types): 16.8% (Massachusetts: 9.9%)
> Adults under 65, Tricare/military insurance (or many types): 0.2% (Massachusetts: 0.8%)
[in-text-ad]

Michigan: Ann Arbor
> Adults under 65, no health insurance: 3.0% (Michigan: 6.5%)
> Adults under 65, Medicare coverage (or multiple types): 1.4% (Michigan: 3.7%)
> Adults under 65, Medicaid coverage (or multiple types): 9.0% (Michigan: 24.2%)
> Adults under 65, VA coverage (or multiple types): 0.5% (Michigan: 1.0%)
> Adults under 65, employer-based insurance (or multiple types): 73.4% (Michigan: 63.3%)
> Adults under 65, direct-purchase insurance (or multiple types): 17.7% (Michigan: 9.1%)
> Adults under 65, Tricare/military insurance (or many types): 0.7% (Michigan: 0.9%)
[recirclink id=880865]

Minnesota: Lakeville
> Adults under 65, no health insurance: 1.8% (Minnesota: 5.2%)
> Adults under 65, Medicare coverage (or multiple types): 1.3% (Minnesota: 2.1%)
> Adults under 65, Medicaid coverage (or multiple types): 9.6% (Minnesota: 19.4%)
> Adults under 65, VA coverage (or multiple types): 0.7% (Minnesota: 1.0%)
> Adults under 65, employer-based insurance (or multiple types): 82.6% (Minnesota: 68.6%)
> Adults under 65, direct-purchase insurance (or multiple types): 8.7% (Minnesota: 9.9%)
> Adults under 65, Tricare/military insurance (or many types): 1.0% (Minnesota: 1.0%)

Mississippi: Madison
> Adults under 65, no health insurance: 2.3% (Mississippi: 14.5%)
> Adults under 65, Medicare coverage (or multiple types): 0.9% (Mississippi: 4.7%)
> Adults under 65, Medicaid coverage (or multiple types): 4.3% (Mississippi: 25.1%)
> Adults under 65, VA coverage (or multiple types): 1.3% (Mississippi: 1.4%)
> Adults under 65, employer-based insurance (or multiple types): 79.1% (Mississippi: 51.2%)
> Adults under 65, direct-purchase insurance (or multiple types): 16.6% (Mississippi: 9.5%)
> Adults under 65, Tricare/military insurance (or many types): 2.5% (Mississippi: 3.0%)
[in-text-ad-2]
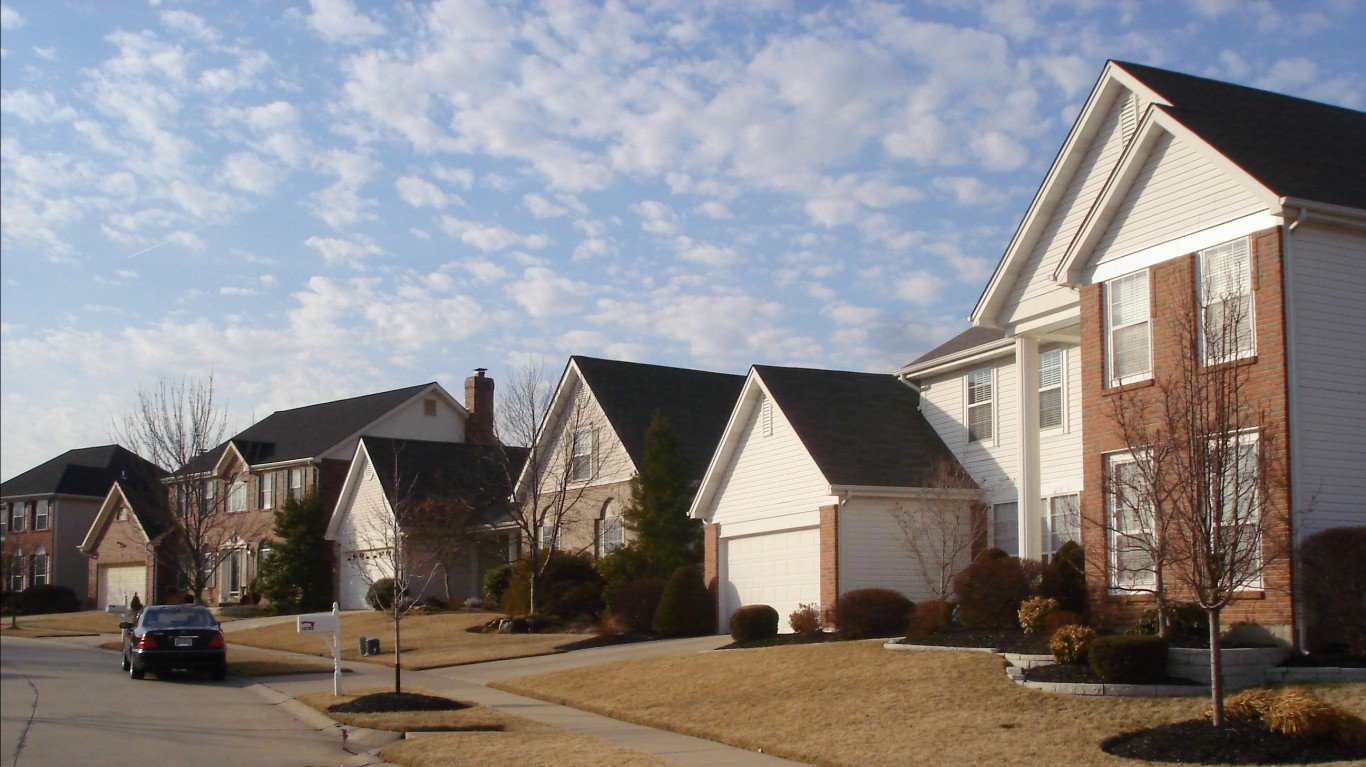
Missouri: Chesterfield
> Adults under 65, no health insurance: 2.8% (Missouri: 11.1%)
> Adults under 65, Medicare coverage (or multiple types): 0.7% (Missouri: 3.8%)
> Adults under 65, Medicaid coverage (or multiple types): 2.5% (Missouri: 15.8%)
> Adults under 65, VA coverage (or multiple types): 0.5% (Missouri: 1.4%)
> Adults under 65, employer-based insurance (or multiple types): 83.4% (Missouri: 62.9%)
> Adults under 65, direct-purchase insurance (or multiple types): 13.1% (Missouri: 10.5%)
> Adults under 65, Tricare/military insurance (or many types): 0.8% (Missouri: 2.0%)

Montana: Helena
> Adults under 65, no health insurance: 5.5% (Montana: 10.9%)
> Adults under 65, Medicare coverage (or multiple types): 4.1% (Montana: 3.0%)
> Adults under 65, Medicaid coverage (or multiple types): 18.4% (Montana: 21.4%)
> Adults under 65, VA coverage (or multiple types): 2.3% (Montana: 2.1%)
> Adults under 65, employer-based insurance (or multiple types): 66.6% (Montana: 54.9%)
> Adults under 65, direct-purchase insurance (or multiple types): 10.3% (Montana: 13.9%)
> Adults under 65, Tricare/military insurance (or many types): 2.6% (Montana: 3.0%)
[in-text-ad]

Nebraska: Lincoln
> Adults under 65, no health insurance: 8.8% (Nebraska: 9.5%)
> Adults under 65, Medicare coverage (or multiple types): 2.0% (Nebraska: 2.2%)
> Adults under 65, Medicaid coverage (or multiple types): 12.8% (Nebraska: 13.4%)
> Adults under 65, VA coverage (or multiple types): 1.1% (Nebraska: 1.4%)
> Adults under 65, employer-based insurance (or multiple types): 69.2% (Nebraska: 66.1%)
> Adults under 65, direct-purchase insurance (or multiple types): 14.3% (Nebraska: 12.9%)
> Adults under 65, Tricare/military insurance (or many types): 1.7% (Nebraska: 2.7%)
[recirclink id=880688]

Nevada: Henderson
> Adults under 65, no health insurance: 7.9% (Nevada: 12.9%)
> Adults under 65, Medicare coverage (or multiple types): 2.0% (Nevada: 2.5%)
> Adults under 65, Medicaid coverage (or multiple types): 12.8% (Nevada: 20.0%)
> Adults under 65, VA coverage (or multiple types): 1.6% (Nevada: 1.7%)
> Adults under 65, employer-based insurance (or multiple types): 69.0% (Nevada: 58.7%)
> Adults under 65, direct-purchase insurance (or multiple types): 11.1% (Nevada: 9.1%)
> Adults under 65, Tricare/military insurance (or many types): 2.7% (Nevada: 2.7%)

New Hampshire: Concord
> Adults under 65, no health insurance: 6.9% (New Hampshire: 7.1%)
> Adults under 65, Medicare coverage (or multiple types): 4.5% (New Hampshire: 3.2%)
> Adults under 65, Medicaid coverage (or multiple types): 17.8% (New Hampshire: 14.6%)
> Adults under 65, VA coverage (or multiple types): 1.0% (New Hampshire: 1.3%)
> Adults under 65, employer-based insurance (or multiple types): 69.1% (New Hampshire: 69.8%)
> Adults under 65, direct-purchase insurance (or multiple types): 8.4% (New Hampshire: 9.3%)
> Adults under 65, Tricare/military insurance (or many types): 1.0% (New Hampshire: 1.5%)
[in-text-ad-2]

New Jersey: Hoboken
> Adults under 65, no health insurance: 2.3% (New Jersey: 9.0%)
> Adults under 65, Medicare coverage (or multiple types): 0.9% (New Jersey: 2.4%)
> Adults under 65, Medicaid coverage (or multiple types): 6.5% (New Jersey: 17.7%)
> Adults under 65, VA coverage (or multiple types): 0.3% (New Jersey: 0.4%)
> Adults under 65, employer-based insurance (or multiple types): 85.1% (New Jersey: 66.5%)
> Adults under 65, direct-purchase insurance (or multiple types): 7.6% (New Jersey: 8.9%)
> Adults under 65, Tricare/military insurance (or many types): 0.2% (New Jersey: 0.7%)
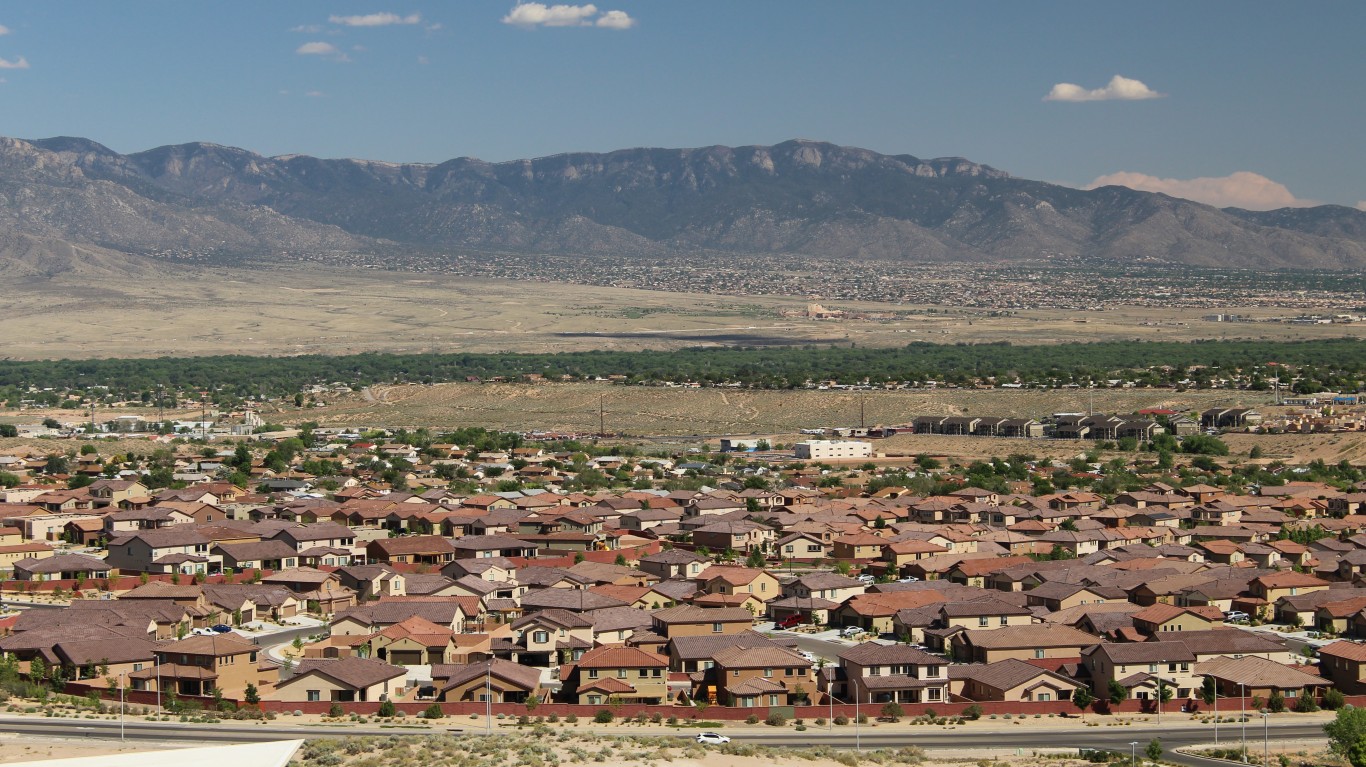
New Mexico: Rio Rancho
> Adults under 65, no health insurance: 6.0% (New Mexico: 11.4%)
> Adults under 65, Medicare coverage (or multiple types): 3.4% (New Mexico: 3.6%)
> Adults under 65, Medicaid coverage (or multiple types): 23.8% (New Mexico: 35.6%)
> Adults under 65, VA coverage (or multiple types): 2.3% (New Mexico: 1.7%)
> Adults under 65, employer-based insurance (or multiple types): 62.8% (New Mexico: 46.4%)
> Adults under 65, direct-purchase insurance (or multiple types): 9.6% (New Mexico: 8.0%)
> Adults under 65, Tricare/military insurance (or many types): 4.7% (New Mexico: 3.3%)
[in-text-ad]

New York: Plainview
> Adults under 65, no health insurance: 1.8% (New York: 6.7%)
> Adults under 65, Medicare coverage (or multiple types): 2.0% (New York: 2.8%)
> Adults under 65, Medicaid coverage (or multiple types): 6.5% (New York: 26.9%)
> Adults under 65, VA coverage (or multiple types): 0.3% (New York: 0.6%)
> Adults under 65, employer-based insurance (or multiple types): 82.6% (New York: 59.7%)
> Adults under 65, direct-purchase insurance (or multiple types): 13.8% (New York: 10.8%)
> Adults under 65, Tricare/military insurance (or many types): 0.2% (New York: 0.7%)
[recirclink id=824405]
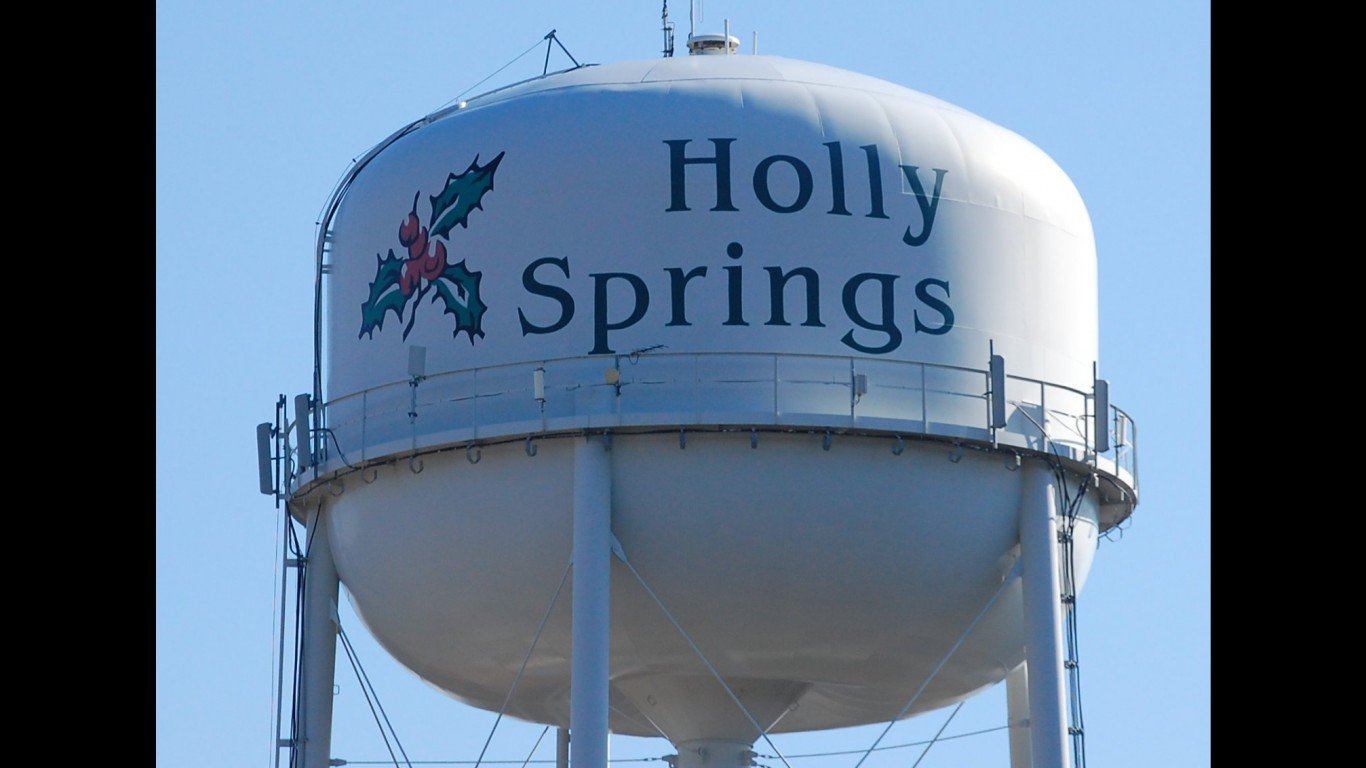
North Carolina: Holly Springs
> Adults under 65, no health insurance: 4.2% (North Carolina: 12.6%)
> Adults under 65, Medicare coverage (or multiple types): 1.0% (North Carolina: 3.5%)
> Adults under 65, Medicaid coverage (or multiple types): 5.6% (North Carolina: 19.4%)
> Adults under 65, VA coverage (or multiple types): 0.7% (North Carolina: 1.7%)
> Adults under 65, employer-based insurance (or multiple types): 81.7% (North Carolina: 55.9%)
> Adults under 65, direct-purchase insurance (or multiple types): 10.7% (North Carolina: 11.7%)
> Adults under 65, Tricare/military insurance (or many types): 1.2% (North Carolina: 3.8%)
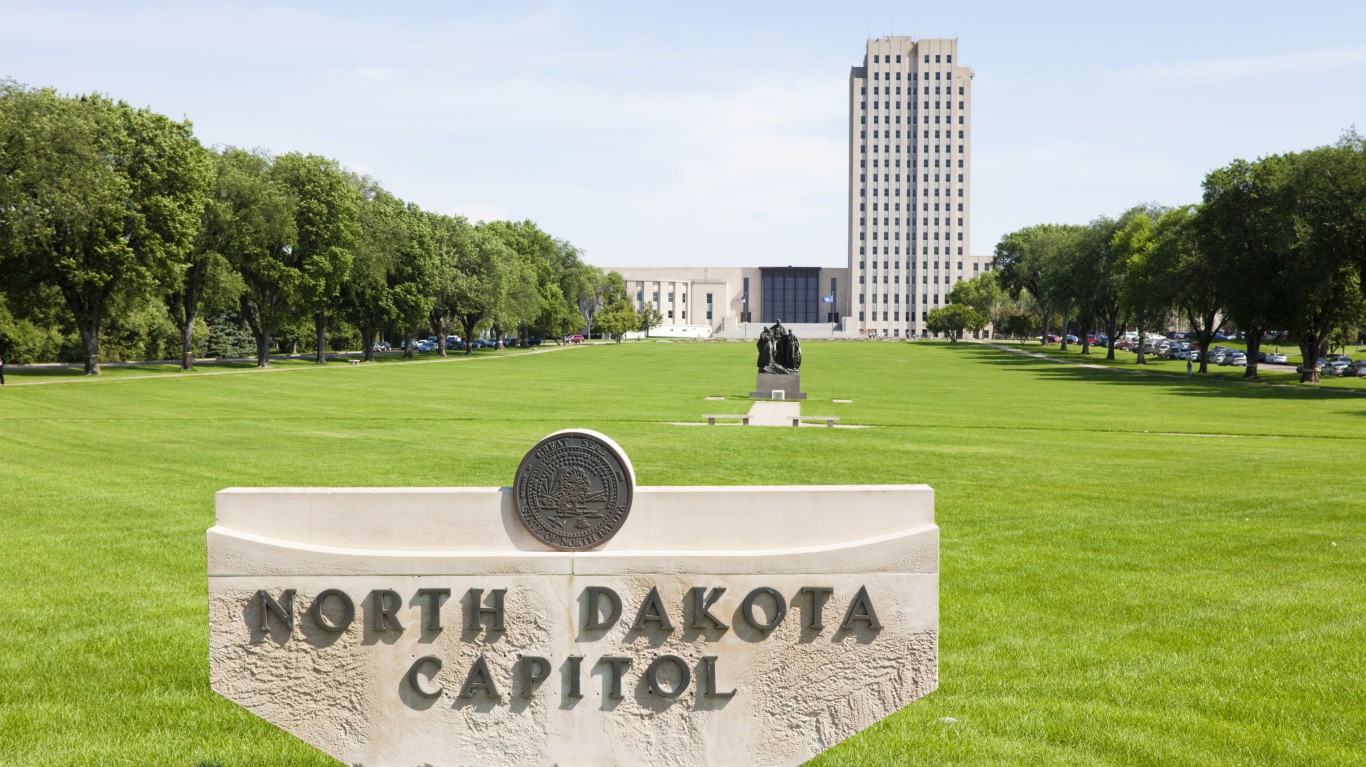
North Dakota: Bismarck
> Adults under 65, no health insurance: 7.1% (North Dakota: 8.5%)
> Adults under 65, Medicare coverage (or multiple types): 2.0% (North Dakota: 2.1%)
> Adults under 65, Medicaid coverage (or multiple types): 10.2% (North Dakota: 11.4%)
> Adults under 65, VA coverage (or multiple types): 1.3% (North Dakota: 1.4%)
> Adults under 65, employer-based insurance (or multiple types): 71.6% (North Dakota: 67.6%)
> Adults under 65, direct-purchase insurance (or multiple types): 13.4% (North Dakota: 14.3%)
> Adults under 65, Tricare/military insurance (or many types): 2.1% (North Dakota: 3.4%)
[in-text-ad-2]

Ohio: Dublin
> Adults under 65, no health insurance: 1.3% (Ohio: 7.2%)
> Adults under 65, Medicare coverage (or multiple types): 0.4% (Ohio: 3.3%)
> Adults under 65, Medicaid coverage (or multiple types): 3.6% (Ohio: 22.8%)
> Adults under 65, VA coverage (or multiple types): 0.5% (Ohio: 1.2%)
> Adults under 65, employer-based insurance (or multiple types): 89.0% (Ohio: 64.0%)
> Adults under 65, direct-purchase insurance (or multiple types): 7.9% (Ohio: 7.8%)
> Adults under 65, Tricare/military insurance (or many types): 0.3% (Ohio: 1.2%)

Oklahoma: Bixby
> Adults under 65, no health insurance: 8.0% (Oklahoma: 16.5%)
> Adults under 65, Medicare coverage (or multiple types): 1.7% (Oklahoma: 3.9%)
> Adults under 65, Medicaid coverage (or multiple types): 8.4% (Oklahoma: 18.8%)
> Adults under 65, VA coverage (or multiple types): 1.0% (Oklahoma: 1.8%)
> Adults under 65, employer-based insurance (or multiple types): 72.7% (Oklahoma: 54.4%)
> Adults under 65, direct-purchase insurance (or multiple types): 12.2% (Oklahoma: 9.9%)
> Adults under 65, Tricare/military insurance (or many types): 1.2% (Oklahoma: 3.1%)
[in-text-ad]

Oregon: Bethany
> Adults under 65, no health insurance: 2.5% (Oregon: 8.0%)
> Adults under 65, Medicare coverage (or multiple types): 0.6% (Oregon: 2.8%)
> Adults under 65, Medicaid coverage (or multiple types): 6.1% (Oregon: 24.7%)
> Adults under 65, VA coverage (or multiple types): 0.4% (Oregon: 1.6%)
> Adults under 65, employer-based insurance (or multiple types): 85.5% (Oregon: 59.2%)
> Adults under 65, direct-purchase insurance (or multiple types): 10.4% (Oregon: 11.0%)
> Adults under 65, Tricare/military insurance (or many types): 0.9% (Oregon: 1.4%)
[recirclink id=880865]

Pennsylvania: Plum
> Adults under 65, no health insurance: 2.5% (Pennsylvania: 6.8%)
> Adults under 65, Medicare coverage (or multiple types): 1.4% (Pennsylvania: 3.2%)
> Adults under 65, Medicaid coverage (or multiple types): 8.6% (Pennsylvania: 21.1%)
> Adults under 65, VA coverage (or multiple types): 0.7% (Pennsylvania: 1.0%)
> Adults under 65, employer-based insurance (or multiple types): 80.2% (Pennsylvania: 65.2%)
> Adults under 65, direct-purchase insurance (or multiple types): 12.8% (Pennsylvania: 10.2%)
> Adults under 65, Tricare/military insurance (or many types): 0.8% (Pennsylvania: 1.0%)

Rhode Island: Cranston
> Adults under 65, no health insurance: 4.0% (Rhode Island: 5.3%)
> Adults under 65, Medicare coverage (or multiple types): 2.2% (Rhode Island: 3.4%)
> Adults under 65, Medicaid coverage (or multiple types): 19.7% (Rhode Island: 23.2%)
> Adults under 65, VA coverage (or multiple types): 0.7% (Rhode Island: 1.0%)
> Adults under 65, employer-based insurance (or multiple types): 70.8% (Rhode Island: 64.1%)
> Adults under 65, direct-purchase insurance (or multiple types): 9.9% (Rhode Island: 10.8%)
> Adults under 65, Tricare/military insurance (or many types): 0.8% (Rhode Island: 1.4%)
[in-text-ad-2]

South Carolina: Mount Pleasant
> Adults under 65, no health insurance: 5.7% (South Carolina: 12.6%)
> Adults under 65, Medicare coverage (or multiple types): 1.1% (South Carolina: 3.8%)
> Adults under 65, Medicaid coverage (or multiple types): 4.8% (South Carolina: 20.7%)
> Adults under 65, VA coverage (or multiple types): 0.7% (South Carolina: 1.8%)
> Adults under 65, employer-based insurance (or multiple types): 74.9% (South Carolina: 56.5%)
> Adults under 65, direct-purchase insurance (or multiple types): 14.8% (South Carolina: 10.4%)
> Adults under 65, Tricare/military insurance (or many types): 3.1% (South Carolina: 3.7%)

South Dakota: Sioux Falls
> Adults under 65, no health insurance: 8.9% (South Dakota: 11.2%)
> Adults under 65, Medicare coverage (or multiple types): 2.4% (South Dakota: 2.7%)
> Adults under 65, Medicaid coverage (or multiple types): 14.2% (South Dakota: 15.3%)
> Adults under 65, VA coverage (or multiple types): 1.6% (South Dakota: 1.9%)
> Adults under 65, employer-based insurance (or multiple types): 69.4% (South Dakota: 61.1%)
> Adults under 65, direct-purchase insurance (or multiple types): 10.1% (South Dakota: 13.7%)
> Adults under 65, Tricare/military insurance (or many types): 2.6% (South Dakota: 3.4%)
[in-text-ad]

Tennessee: Brentwood
> Adults under 65, no health insurance: 1.9% (Tennessee: 11.4%)
> Adults under 65, Medicare coverage (or multiple types): 0.4% (Tennessee: 3.8%)
> Adults under 65, Medicaid coverage (or multiple types): 2.3% (Tennessee: 21.6%)
> Adults under 65, VA coverage (or multiple types): 0.2% (Tennessee: 1.6%)
> Adults under 65, employer-based insurance (or multiple types): 82.1% (Tennessee: 57.8%)
> Adults under 65, direct-purchase insurance (or multiple types): 16.7% (Tennessee: 10.1%)
> Adults under 65, Tricare/military insurance (or many types): 1.0% (Tennessee: 2.7%)
[recirclink id=880688]

Texas: University Park
> Adults under 65, no health insurance: 2.7% (Texas: 19.4%)
> Adults under 65, Medicare coverage (or multiple types): 0.7% (Texas: 2.2%)
> Adults under 65, Medicaid coverage (or multiple types): 1.5% (Texas: 17.2%)
> Adults under 65, VA coverage (or multiple types): 0.1% (Texas: 1.3%)
> Adults under 65, employer-based insurance (or multiple types): 76.0% (Texas: 54.5%)
> Adults under 65, direct-purchase insurance (or multiple types): 22.5% (Texas: 9.4%)
> Adults under 65, Tricare/military insurance (or many types): 0.3% (Texas: 2.3%)

Utah: Saratoga Springs
> Adults under 65, no health insurance: 3.4% (Utah: 10.4%)
> Adults under 65, Medicare coverage (or multiple types): 0.3% (Utah: 1.5%)
> Adults under 65, Medicaid coverage (or multiple types): 7.2% (Utah: 10.7%)
> Adults under 65, VA coverage (or multiple types): 0.6% (Utah: 0.8%)
> Adults under 65, employer-based insurance (or multiple types): 83.6% (Utah: 68.4%)
> Adults under 65, direct-purchase insurance (or multiple types): 8.9% (Utah: 12.5%)
> Adults under 65, Tricare/military insurance (or many types): 2.0% (Utah: 1.8%)
[in-text-ad-2]

Vermont: Burlington*
> Adults under 65, no health insurance: 3.9% (Vermont: 4.8%)
> Adults under 65, Medicare coverage (or multiple types): 3.3% (Vermont: 3.8%)
> Adults under 65, Medicaid coverage (or multiple types): 22.1% (Vermont: 27.1%)
> Adults under 65, VA coverage (or multiple types): 0.6% (Vermont: 1.2%)
> Adults under 65, employer-based insurance (or multiple types): 63.9% (Vermont: 60.5%)
> Adults under 65, direct-purchase insurance (or multiple types): 13.7% (Vermont: 10.1%)
> Adults under 65, Tricare/military insurance (or many types): 0.8% (Vermont: 1.6%)
*Because Burlington is the only eligible city in Vermont, it is the city with the best health insurance coverage by default.

Virginia: South Riding
> Adults under 65, no health insurance: 2.7% (Virginia: 10.0%)
> Adults under 65, Medicare coverage (or multiple types): 0.8% (Virginia: 2.7%)
> Adults under 65, Medicaid coverage (or multiple types): 4.0% (Virginia: 12.6%)
> Adults under 65, VA coverage (or multiple types): 1.1% (Virginia: 2.1%)
> Adults under 65, employer-based insurance (or multiple types): 85.2% (Virginia: 63.9%)
> Adults under 65, direct-purchase insurance (or multiple types): 8.2% (Virginia: 11.0%)
> Adults under 65, Tricare/military insurance (or many types): 4.6% (Virginia: 7.1%)
[in-text-ad]

Washington: Sammamish
> Adults under 65, no health insurance: 1.3% (Washington: 7.3%)
> Adults under 65, Medicare coverage (or multiple types): 0.6% (Washington: 2.5%)
> Adults under 65, Medicaid coverage (or multiple types): 3.5% (Washington: 22.0%)
> Adults under 65, VA coverage (or multiple types): 0.3% (Washington: 1.6%)
> Adults under 65, employer-based insurance (or multiple types): 86.8% (Washington: 62.3%)
> Adults under 65, direct-purchase insurance (or multiple types): 10.4% (Washington: 9.7%)
> Adults under 65, Tricare/military insurance (or many types): 0.7% (Washington: 3.6%)
[recirclink id=824405]

West Virginia: Morgantown
> Adults under 65, no health insurance: 4.7% (West Virginia: 7.4%)
> Adults under 65, Medicare coverage (or multiple types): 1.9% (West Virginia: 5.4%)
> Adults under 65, Medicaid coverage (or multiple types): 16.3% (West Virginia: 30.3%)
> Adults under 65, VA coverage (or multiple types): 1.5% (West Virginia: 1.8%)
> Adults under 65, employer-based insurance (or multiple types): 70.1% (West Virginia: 57.1%)
> Adults under 65, direct-purchase insurance (or multiple types): 12.0% (West Virginia: 6.4%)
> Adults under 65, Tricare/military insurance (or many types): 1.8% (West Virginia: 1.6%)

Wisconsin: Brookfield
> Adults under 65, no health insurance: 1.4% (Wisconsin: 6.4%)
> Adults under 65, Medicare coverage (or multiple types): 1.2% (Wisconsin: 2.7%)
> Adults under 65, Medicaid coverage (or multiple types): 5.2% (Wisconsin: 18.0%)
> Adults under 65, VA coverage (or multiple types): 0.7% (Wisconsin: 1.1%)
> Adults under 65, employer-based insurance (or multiple types): 85.4% (Wisconsin: 69.1%)
> Adults under 65, direct-purchase insurance (or multiple types): 10.4% (Wisconsin: 9.4%)
> Adults under 65, Tricare/military insurance (or many types): 0.7% (Wisconsin: 1.0%)
[in-text-ad-2]

Wyoming: Cheyenne
> Adults under 65, no health insurance: 8.0% (Wyoming: 13.5%)
> Adults under 65, Medicare coverage (or multiple types): 2.8% (Wyoming: 2.3%)
> Adults under 65, Medicaid coverage (or multiple types): 13.6% (Wyoming: 12.1%)
> Adults under 65, VA coverage (or multiple types): 3.0% (Wyoming: 1.8%)
> Adults under 65, employer-based insurance (or multiple types): 66.9% (Wyoming: 64.1%)
> Adults under 65, direct-purchase insurance (or multiple types): 9.1% (Wyoming: 11.4%)
> Adults under 65, Tricare/military insurance (or many types): 10.2% (Wyoming: 3.0%)
Methodology
To determine the city with the best health insurance coverage in every state, 24/7 Wall St. reviewed five-year estimates of the percentage of the noninstitutionalized civilian population under 65 without health insurance from the U.S. Census Bureau’s 2019 American Community Survey.
We used census “place” geographies — a category that includes 29,573 incorporated legal entities and census-designated statistical entities. Of those, 29,319 had boundaries that fell within one of the 50 states, while the rest were in the District of Columbia or Puerto Rico.
We defined cities based on a population threshold — having more than 25,000 people — and 1,774 of the places fell within this threshold.
Cities were excluded if the sampling error associated with a city’s data was deemed too high.
The sampling error was defined as too high if the coefficient of variation — a statistical assessment of how reliable an estimate is — for a city’s under 65 uninsured rate was above 15% and greater than two standard deviations above the mean CV for all cities’ under 65 uninsured rates. We similarly excluded cities that had a sampling error too high for their under 65 noninstitutionalized civilian population, using the same definition.
We selected the under 65 age group because Americans become eligible for Medicare at age 65, and the uninsured rate for the population above this age is less than 1% nationwide. However, because the census does not publish insurance coverage estimates specifically for the under 65 age group, we aggregated the data from more granular age breakouts.
To ensure each aggregate estimate’s sampling error could be assessed using the definition above, we derived a margin of error for each aggregate estimate using the successive differences replication variance estimation methodology recommended and used by the U.S. Census Bureau.
The remaining 1,668 places were ranked within their state based on their under 65 uninsured rates. To break ties, we used the number of uninsured people in the same population group.
The shares of the population covered by each type of insurance — Medicare, Medicaid, VA, employer, direct-purchase, and Tricare/military — are for the same cohort and are also aggregated from five-year ACS estimates. The estimates reflect people who are covered by that type of insurance alone or in combination with other types on the list. So, when a person is covered by more than one type of insurance, they are included in each group.
Contact [email protected] for any questions or corrections.