
The economic uncertainty and health concerns of the COVID-19 pandemic of the last year have had a drastic effect on the way many Americans live their lives — including driving many to move out of big cities into the suburbs or even more remote areas.
One of the main drawbacks to living in major cities is the price. Goods and services are all fairly expensive compared to less densely populated areas. Nearly every state is home to one major metropolitan area in which the cost of living is well above the average for that state.
To determine the most expensive city in every state, 24/7 Wall St. reviewed data on cost of living from the Bureau of Economic Analysis.
Just because a city is the most expensive in its state does not necessarily mean its cost of living is that high when compared to the national average cost of living. In 29 states, the most expensive city has a lower cost of living than is typical nationwide, largely because the prices of goods and services statewide fall well below national prices.
The vast majority of metro areas on the list expanded, with their population increasing well beyond the 2.9% national population growth over the last five years. Costs of living tend to be higher in places where people want to live. These kinds of metro areas typically have abundant economic opportunity, reflected in the areas’ relatively high incomes and low poverty rates, compared to both the state and the country. This is the best city to live in every state.
Click here to see the most expensive city in every state.
To determine the most expensive city in every state, 24/7 Wall St. reviewed data on cost of living from the Bureau of Economic Analysis. Metropolitan areas were ranked based on the regional price parity for all goods and services in 2019. Supplemental data on median household income and poverty rate came from the U.S. Census Bureau’s 2019 American Community Survey.

Alabama: Daphne-Fairhope-Foley
> Cost of living in Daphne-Fairhope-Foley: 9.8% less expensive than U.S. avg.
> Cost of living in Alabama: 14.2% less expensive than U.S. avg.
> Poverty rate: 10.1% (state: 15.5%)
> Median household income: $56,439 (state: $51,734)
[in-text-ad]

Alaska: Fairbanks
> Cost of living in Fairbanks: 6.8% more expensive than U.S. avg.
> Cost of living in Alaska: 5.1% more expensive than U.S. avg.
> Poverty rate: 5.9% (state: 10.1%)
> Median household income: $72,065 (state: $75,463)
[recirclink id=926147]

Arizona: Flagstaff
> Cost of living in Flagstaff: 0.7% less expensive than U.S. avg.
> Cost of living in Arizona: 3.7% less expensive than U.S. avg.
> Poverty rate: 15.8% (state: 13.5%)
> Median household income: $58,085 (state: $62,055)
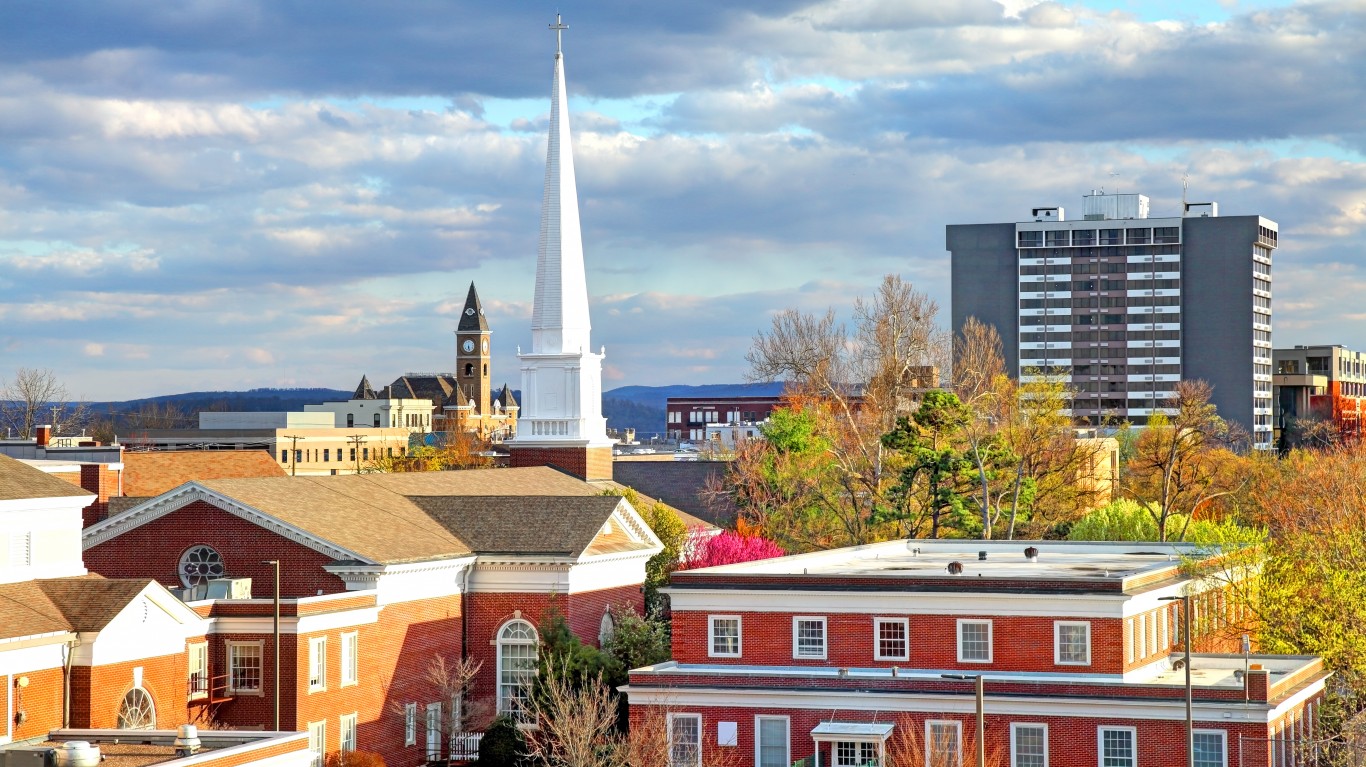
Arkansas: Fayetteville-Springdale-Rogers
> Cost of living in Fayetteville-Springdale-Rogers: 11.8% less expensive than U.S. avg.
> Cost of living in Arkansas: 15.3% less expensive than U.S. avg.
> Poverty rate: 12.6% (state: 16.2%)
> Median household income: $61,674 (state: $48,952)
[in-text-ad-2]

California: San Francisco-Oakland-Berkeley
> Cost of living in San Francisco-Oakland-Berkeley: 34.5% more expensive than U.S. avg.
> Cost of living in California: 16.4% more expensive than U.S. avg.
> Poverty rate: 8.2% (state: 11.8%)
> Median household income: $114,696 (state: $80,440)

Colorado: Boulder
> Cost of living in Boulder: 6.7% more expensive than U.S. avg.
> Cost of living in Colorado: 1.9% more expensive than U.S. avg.
> Poverty rate: 10.9% (state: 9.3%)
> Median household income: $88,535 (state: $77,127)
[in-text-ad]
Connecticut: Bridgeport-Stamford-Norwalk
> Cost of living in Bridgeport-Stamford-Norwalk: 12.4% more expensive than U.S. avg.
> Cost of living in Connecticut: 5.0% more expensive than U.S. avg.
> Poverty rate: 9.1% (state: 10.0%)
> Median household income: $97,053 (state: $78,833)
[recirclink id=915429]

Delaware: Dover
> Cost of living in Dover: 7.5% less expensive than U.S. avg.
> Cost of living in Delaware: 0.6% less expensive than U.S. avg.
> Poverty rate: 13.0% (state: 11.3%)
> Median household income: $58,001 (state: $70,176)
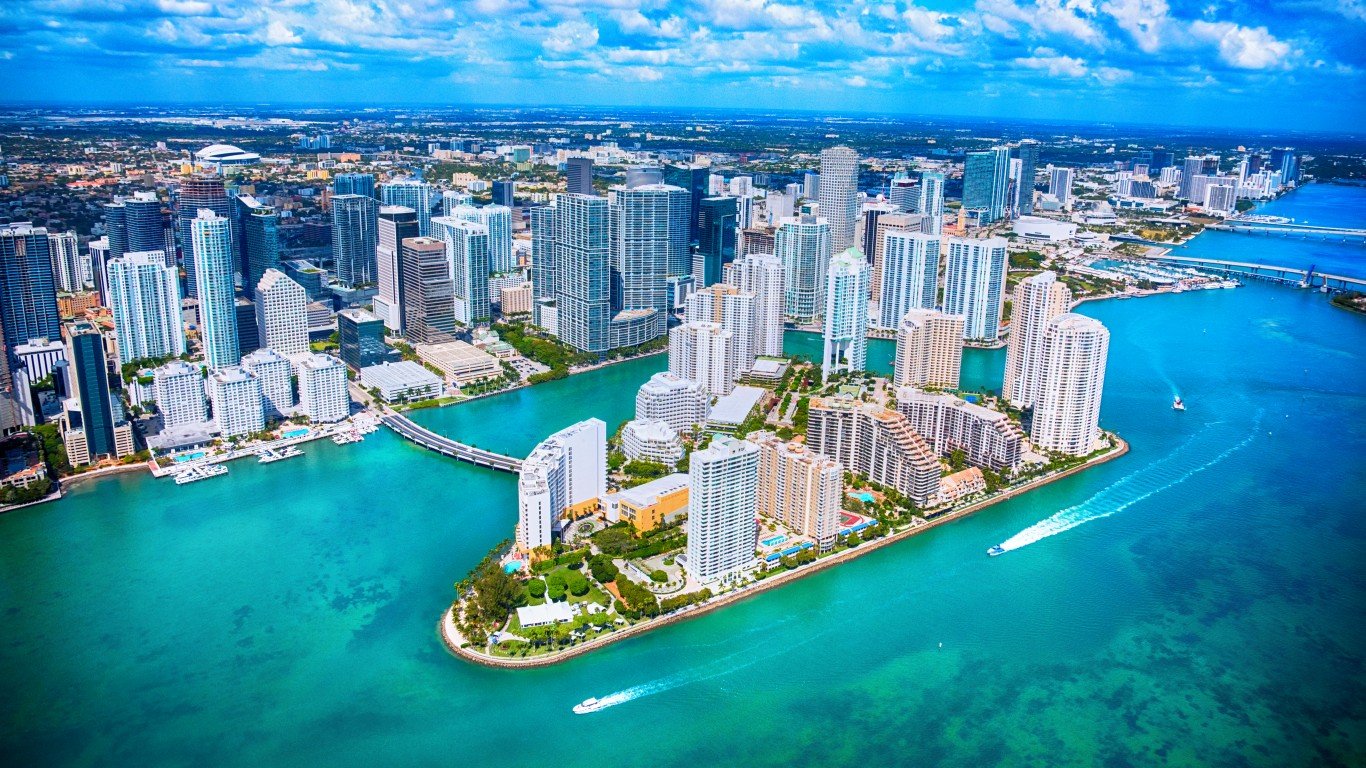
Florida: Miami-Fort Lauderdale-Pompano Beach
> Cost of living in Miami-Fort Lauderdale-Pompano Beach: 11.7% more expensive than U.S. avg.
> Cost of living in Florida: 1.0% more expensive than U.S. avg.
> Poverty rate: 13.5% (state: 12.7%)
> Median household income: $60,141 (state: $59,227)
[in-text-ad-2]

Georgia: Atlanta-Sandy Springs-Alpharetta
> Cost of living in Atlanta-Sandy Springs-Alpharetta: 2.1% less expensive than U.S. avg.
> Cost of living in Georgia: 6.8% less expensive than U.S. avg.
> Poverty rate: 10.5% (state: 13.3%)
> Median household income: $71,742 (state: $61,980)

Hawaii: Urban Honolulu
> Cost of living in Urban Honolulu: 23.8% more expensive than U.S. avg.
> Cost of living in Hawaii: 19.3% more expensive than U.S. avg.
> Poverty rate: 8.1% (state: 9.3%)
> Median household income: $87,470 (state: $83,102)
[in-text-ad]
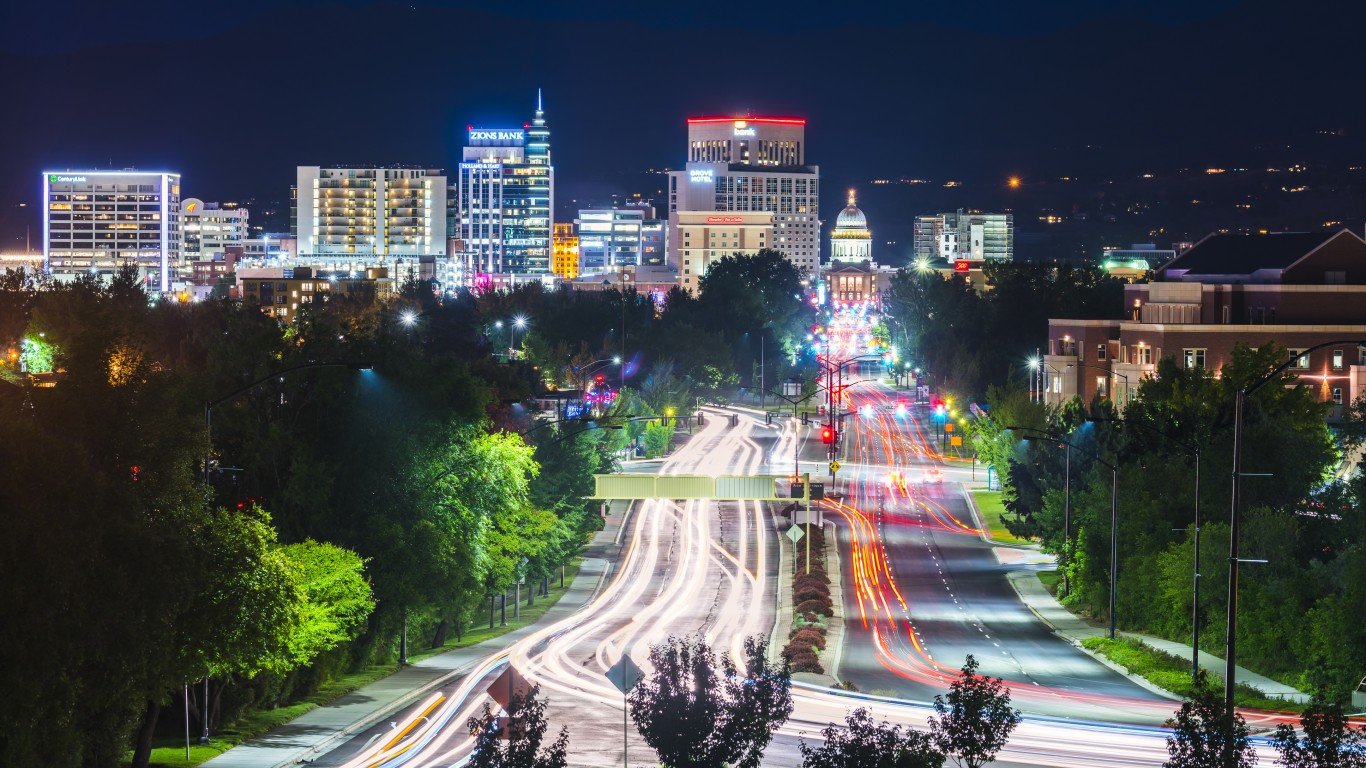
Idaho: Boise City
> Cost of living in Boise City: 6.4% less expensive than U.S. avg.
> Cost of living in Idaho: 7.8% less expensive than U.S. avg.
> Poverty rate: 9.9% (state: 11.2%)
> Median household income: $66,466 (state: $60,999)
[recirclink id=886163]

Illinois: Chicago-Naperville-Elgin
> Cost of living in Chicago-Naperville-Elgin: 2.8% more expensive than U.S. avg.
> Cost of living in Illinois: 2.6% less expensive than U.S. avg.
> Poverty rate: 10.6% (state: 11.5%)
> Median household income: $75,379 (state: $69,187)
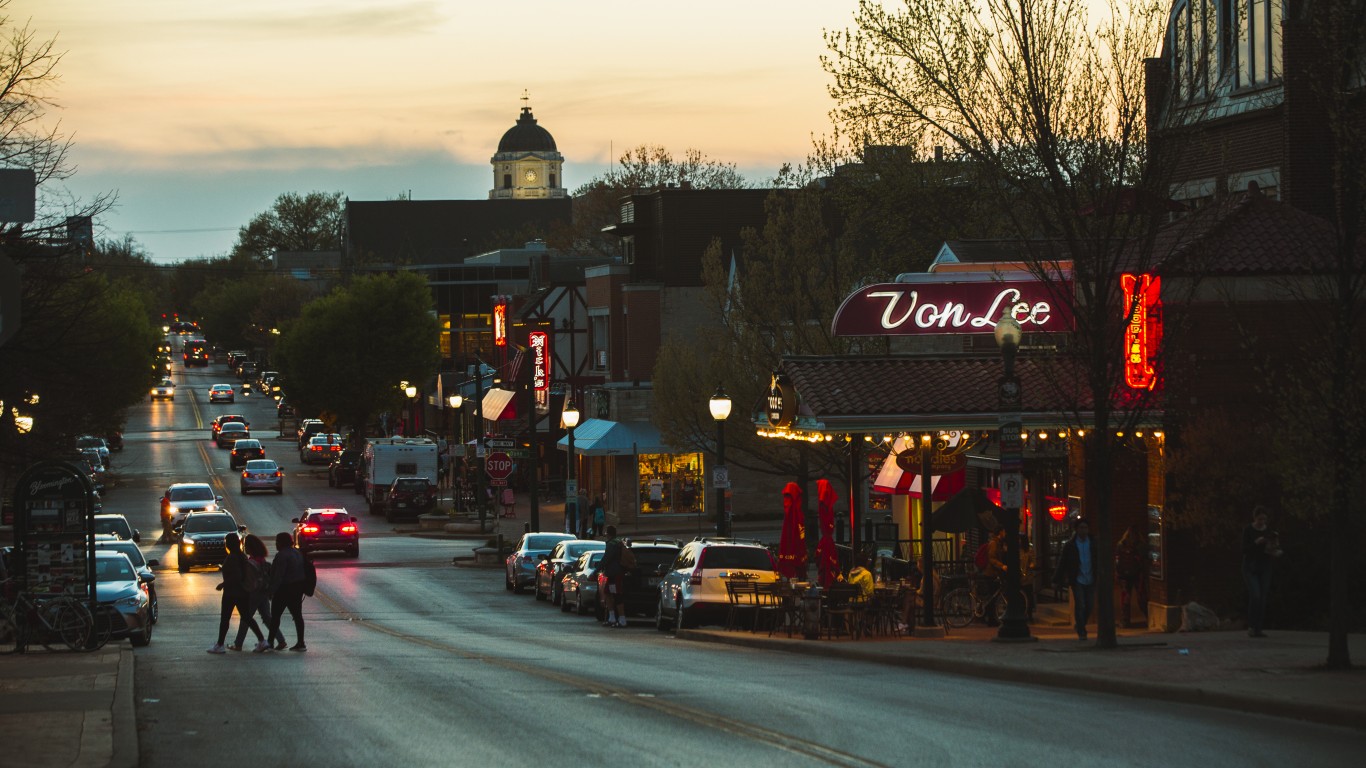
Indiana: Bloomington
> Cost of living in Bloomington: 8.5% less expensive than U.S. avg.
> Cost of living in Indiana: 11.3% less expensive than U.S. avg.
> Poverty rate: 20.9% (state: 11.9%)
> Median household income: $52,526 (state: $57,603)
[in-text-ad-2]
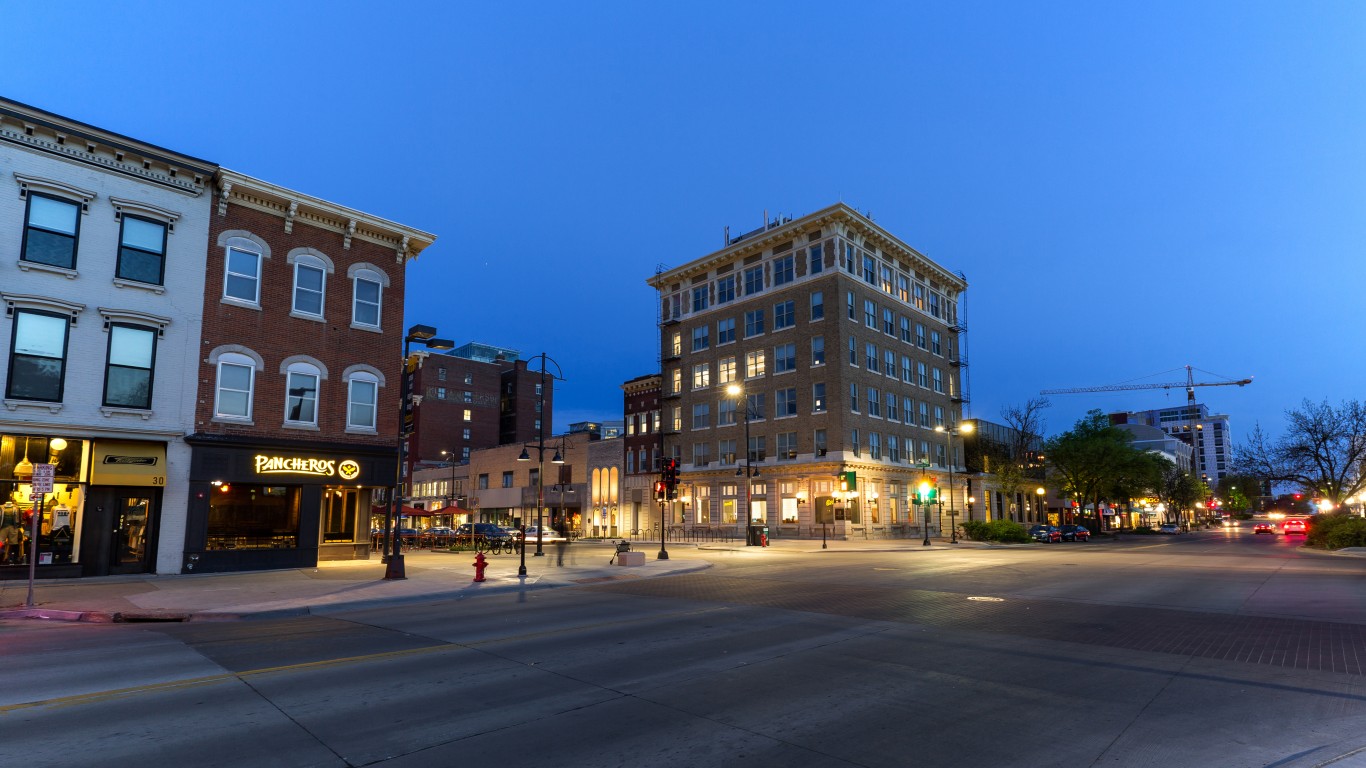
Iowa: Iowa City
> Cost of living in Iowa City: 7.1% less expensive than U.S. avg.
> Cost of living in Iowa: 11.0% less expensive than U.S. avg.
> Poverty rate: 16.2% (state: 11.2%)
> Median household income: $63,761 (state: $61,691)
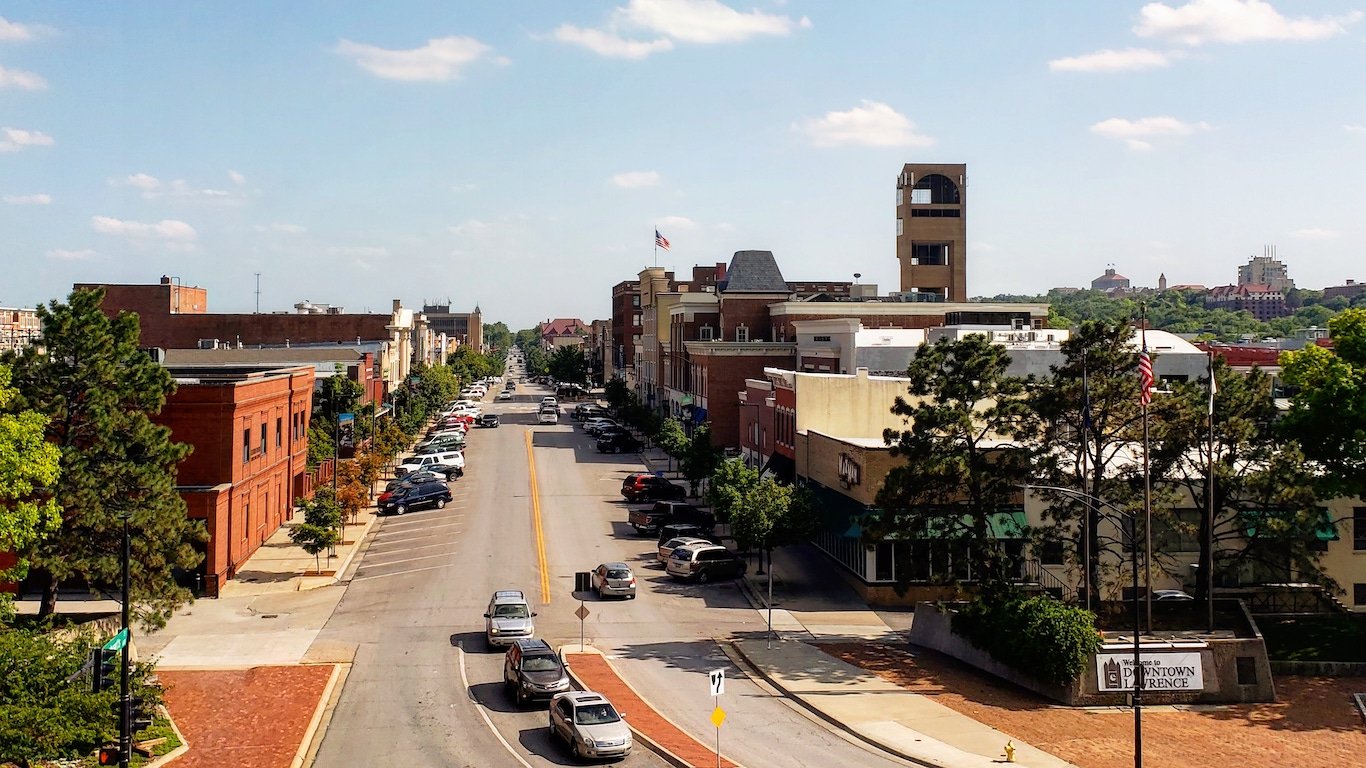
Kansas: Lawrence
> Cost of living in Lawrence: 8.9% less expensive than U.S. avg.
> Cost of living in Kansas: 10.8% less expensive than U.S. avg.
> Poverty rate: 15.7% (state: 11.4%)
> Median household income: $64,233 (state: $62,087)
[in-text-ad]

Kentucky: Lexington-Fayette
> Cost of living in Lexington-Fayette: 9.4% less expensive than U.S. avg.
> Cost of living in Kentucky: 12.6% less expensive than U.S. avg.
> Poverty rate: 13.3% (state: 16.3%)
> Median household income: $60,492 (state: $52,295)
[recirclink id=890721]

Louisiana: New Orleans-Metairie
> Cost of living in New Orleans-Metairie: 6.9% less expensive than U.S. avg.
> Cost of living in Louisiana: 12.1% less expensive than U.S. avg.
> Poverty rate: 16.4% (state: 19.0%)
> Median household income: $55,710 (state: $51,073)
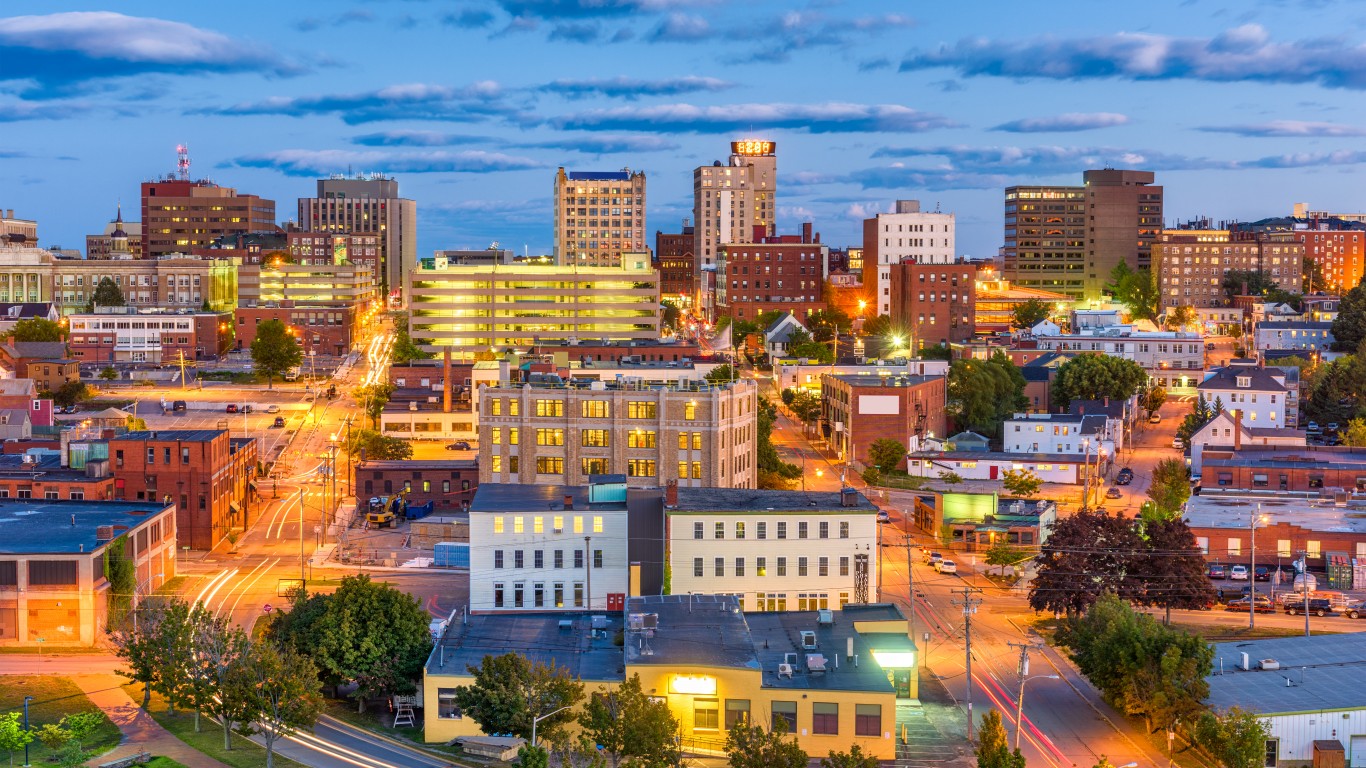
Maine: Portland-South Portland
> Cost of living in Portland-South Portland: 3.7% more expensive than U.S. avg.
> Cost of living in Maine: 0.7% less expensive than U.S. avg.
> Poverty rate: 7.7% (state: 10.9%)
> Median household income: $71,913 (state: $58,924)
[in-text-ad-2]

Maryland: Baltimore-Columbia-Towson
> Cost of living in Baltimore-Columbia-Towson: 5.8% more expensive than U.S. avg.
> Cost of living in Maryland: 7.7% more expensive than U.S. avg.
> Poverty rate: 9.4% (state: 9.0%)
> Median household income: $83,160 (state: $86,738)

Massachusetts: Boston-Cambridge-Newton
> Cost of living in Boston-Cambridge-Newton: 15.5% more expensive than U.S. avg.
> Cost of living in Massachusetts: 10.4% more expensive than U.S. avg.
> Poverty rate: 8.6% (state: 9.4%)
> Median household income: $94,430 (state: $85,843)
[in-text-ad]
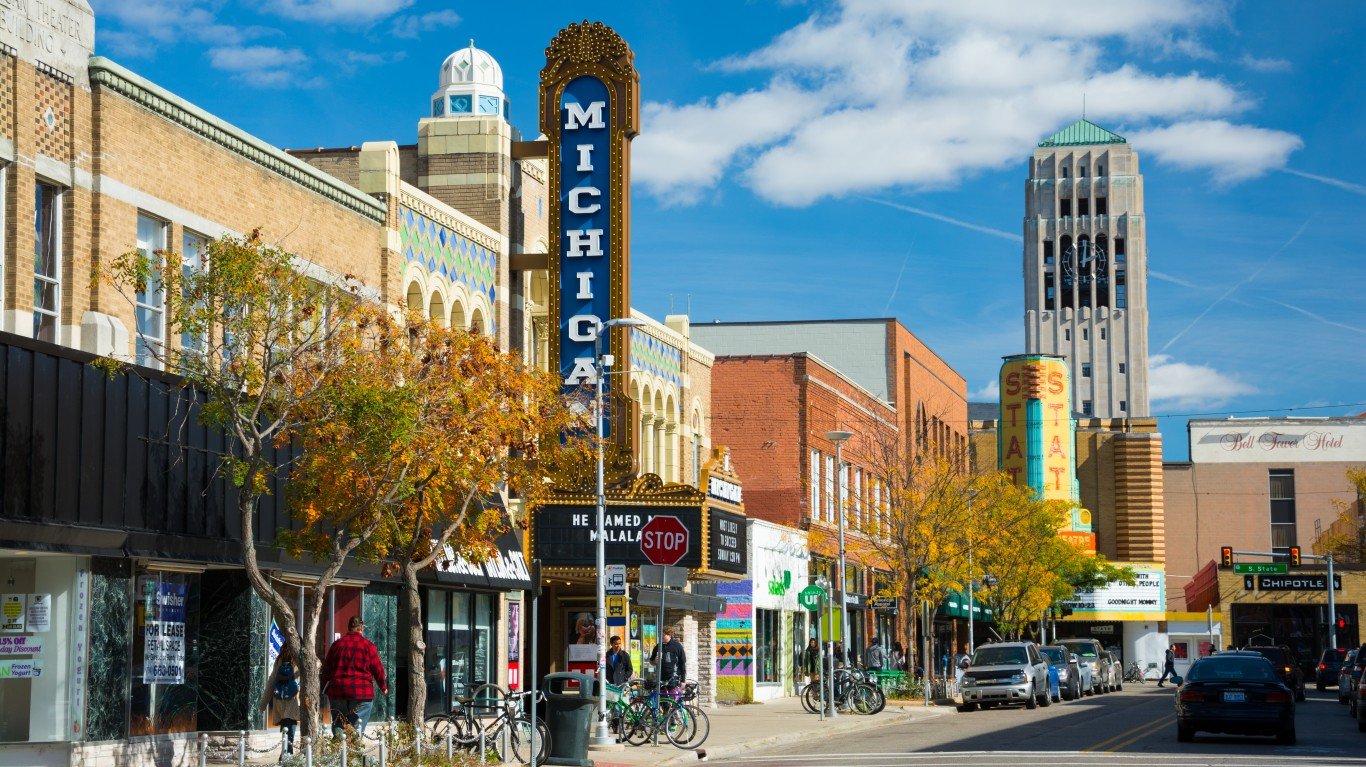
Michigan: Ann Arbor
> Cost of living in Ann Arbor: 0.6% more expensive than U.S. avg.
> Cost of living in Michigan: 7.7% less expensive than U.S. avg.
> Poverty rate: 13.4% (state: 13.0%)
> Median household income: $76,576 (state: $59,584)
[recirclink id=926147]
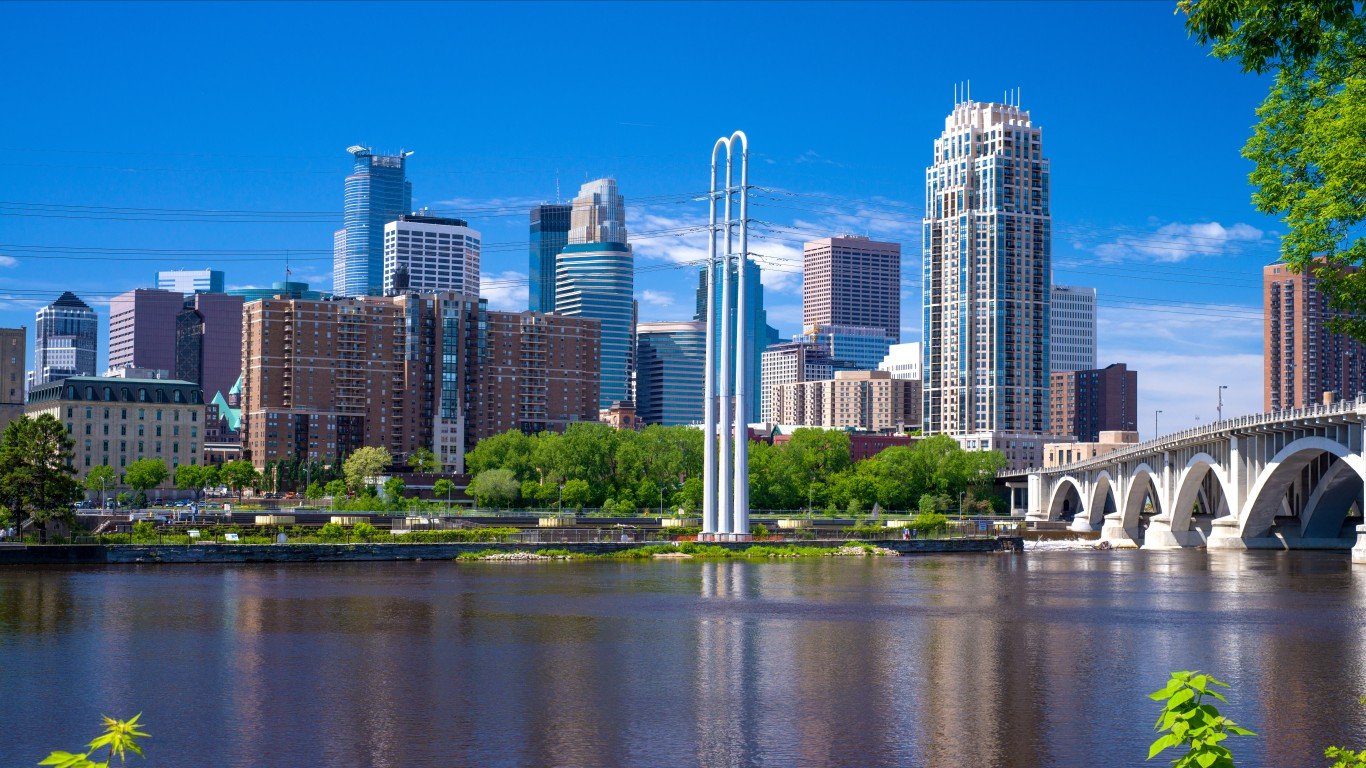
Minnesota: Minneapolis-St. Paul-Bloomington
> Cost of living in Minneapolis-St. Paul-Bloomington: 2.9% more expensive than U.S. avg.
> Cost of living in Minnesota: 2.0% less expensive than U.S. avg.
> Poverty rate: 8.2% (state: 9.0%)
> Median household income: $83,698 (state: $74,593)

Mississippi: Jackson
> Cost of living in Jackson: 12.3% less expensive than U.S. avg.
> Cost of living in Mississippi: 15.6% less expensive than U.S. avg.
> Poverty rate: 15.5% (state: 19.6%)
> Median household income: $52,426 (state: $45,792)
[in-text-ad-2]
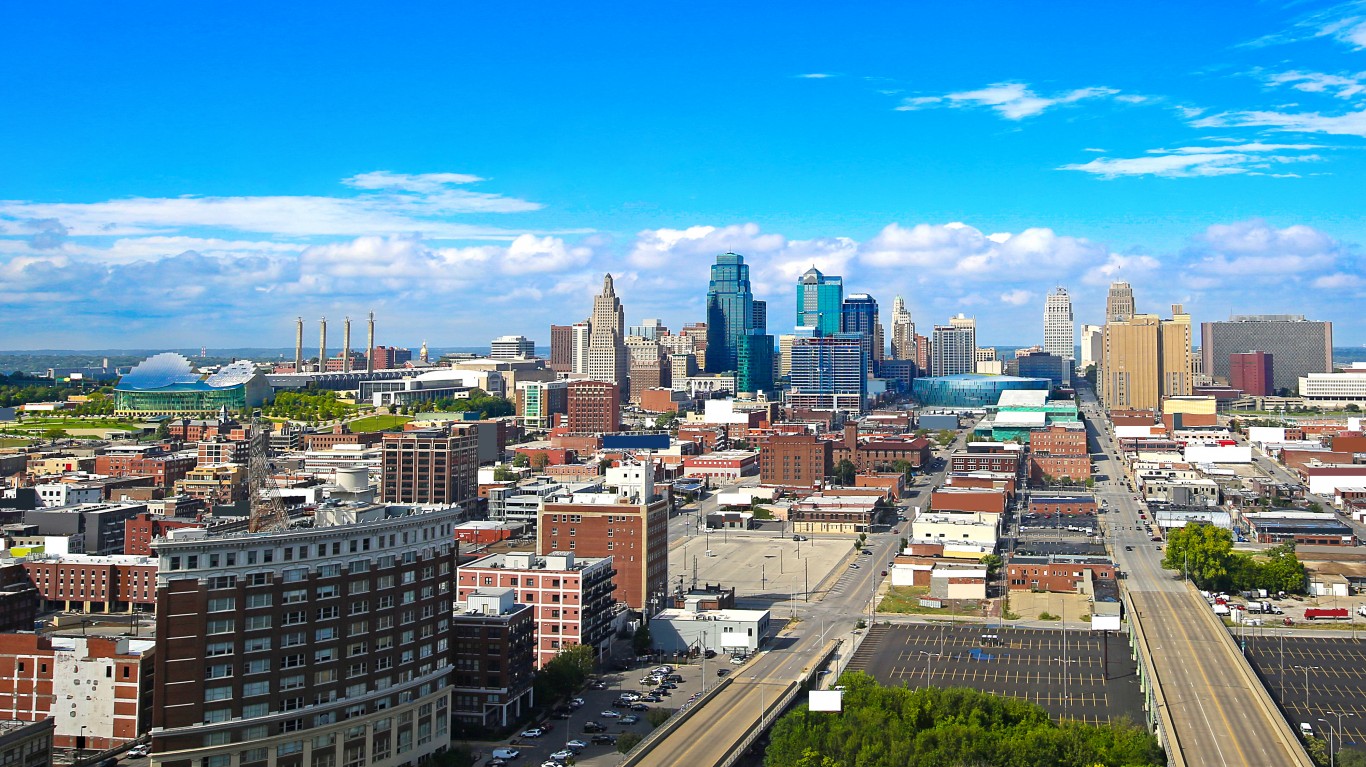
Missouri: Kansas City
> Cost of living in Kansas City: 7.2% less expensive than U.S. avg.
> Cost of living in Missouri: 11.3% less expensive than U.S. avg.
> Poverty rate: 10.3% (state: 12.9%)
> Median household income: $70,215 (state: $57,409)
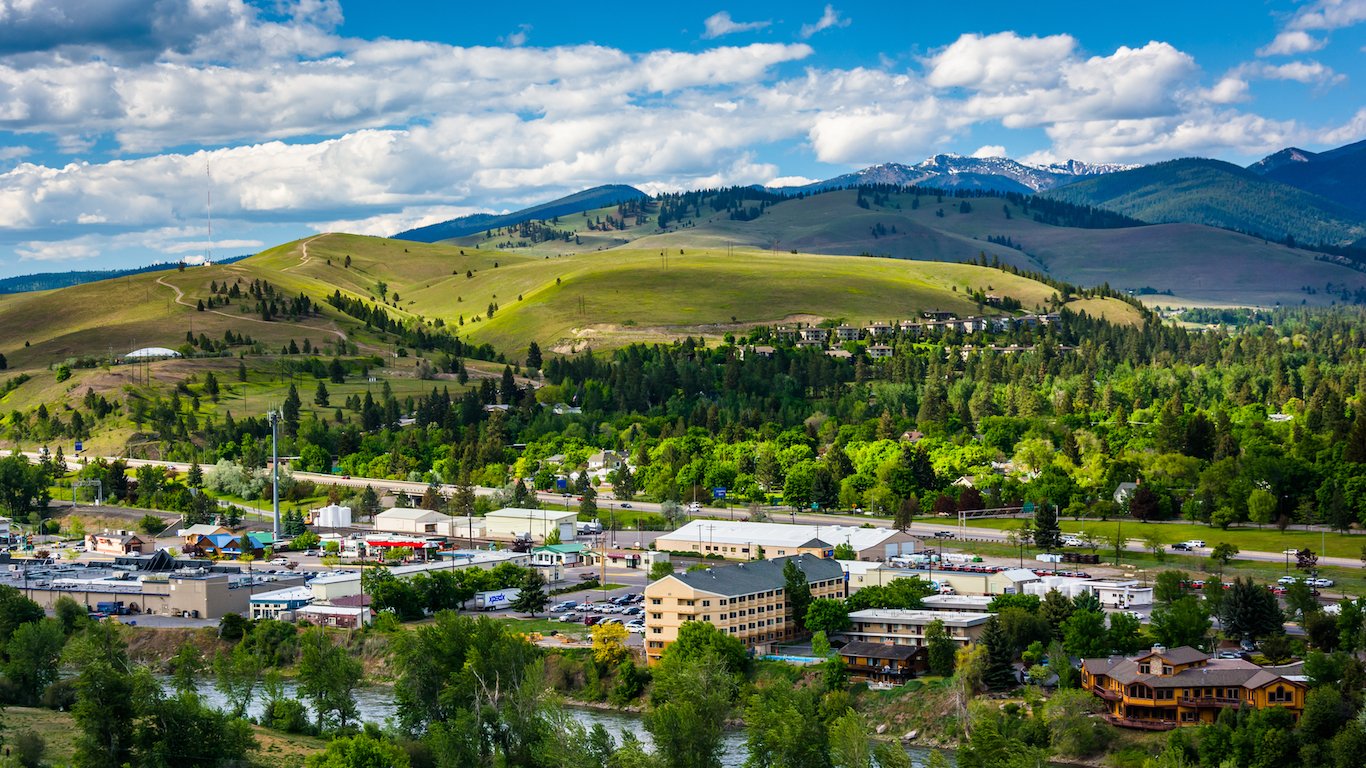
Montana: Missoula
> Cost of living in Missoula: 4.6% less expensive than U.S. avg.
> Cost of living in Montana: 6.5% less expensive than U.S. avg.
> Poverty rate: 11.5% (state: 12.6%)
> Median household income: $57,347 (state: $57,153)
[in-text-ad]
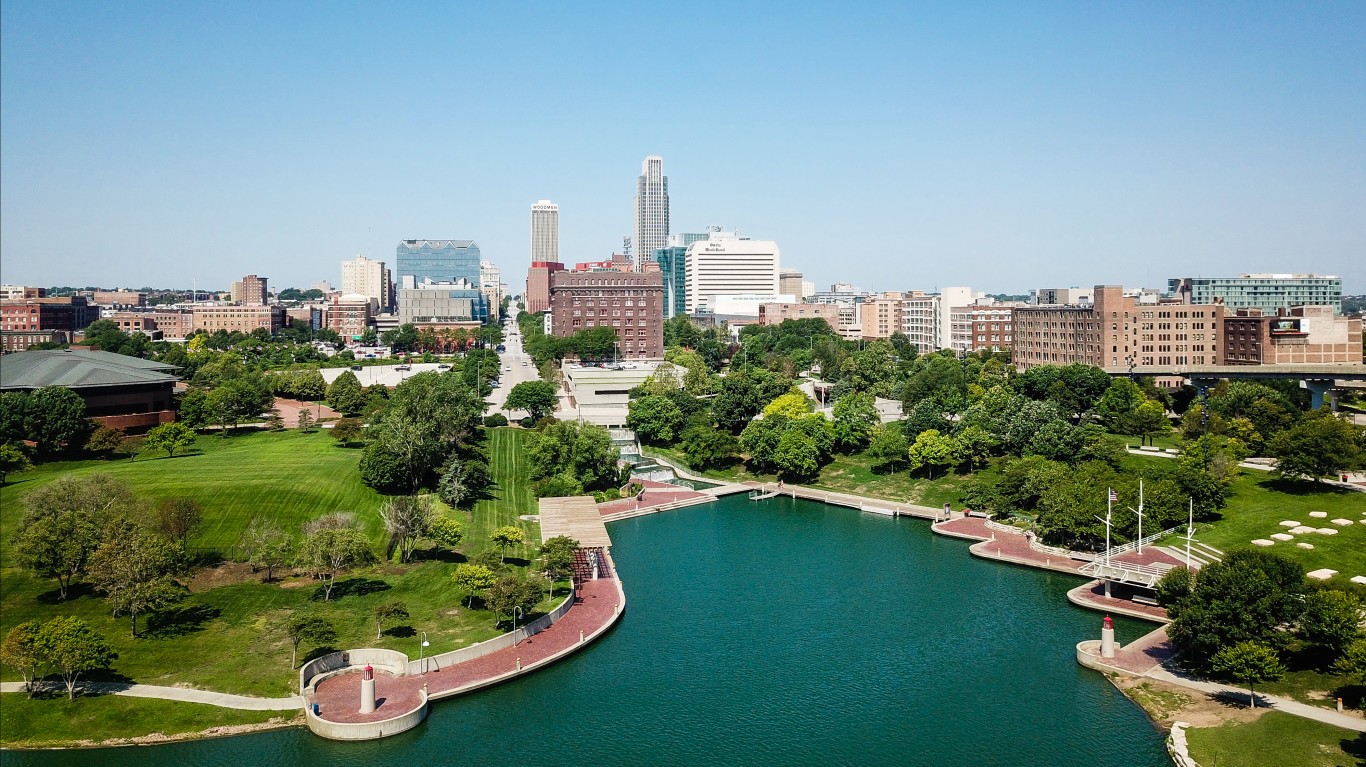
Nebraska: Omaha-Council Bluffs
> Cost of living in Omaha-Council Bluffs: 8.3% less expensive than U.S. avg.
> Cost of living in Nebraska: 10.5% less expensive than U.S. avg.
> Poverty rate: 9.1% (state: 9.9%)
> Median household income: $70,373 (state: $63,229)
[recirclink id=915429]
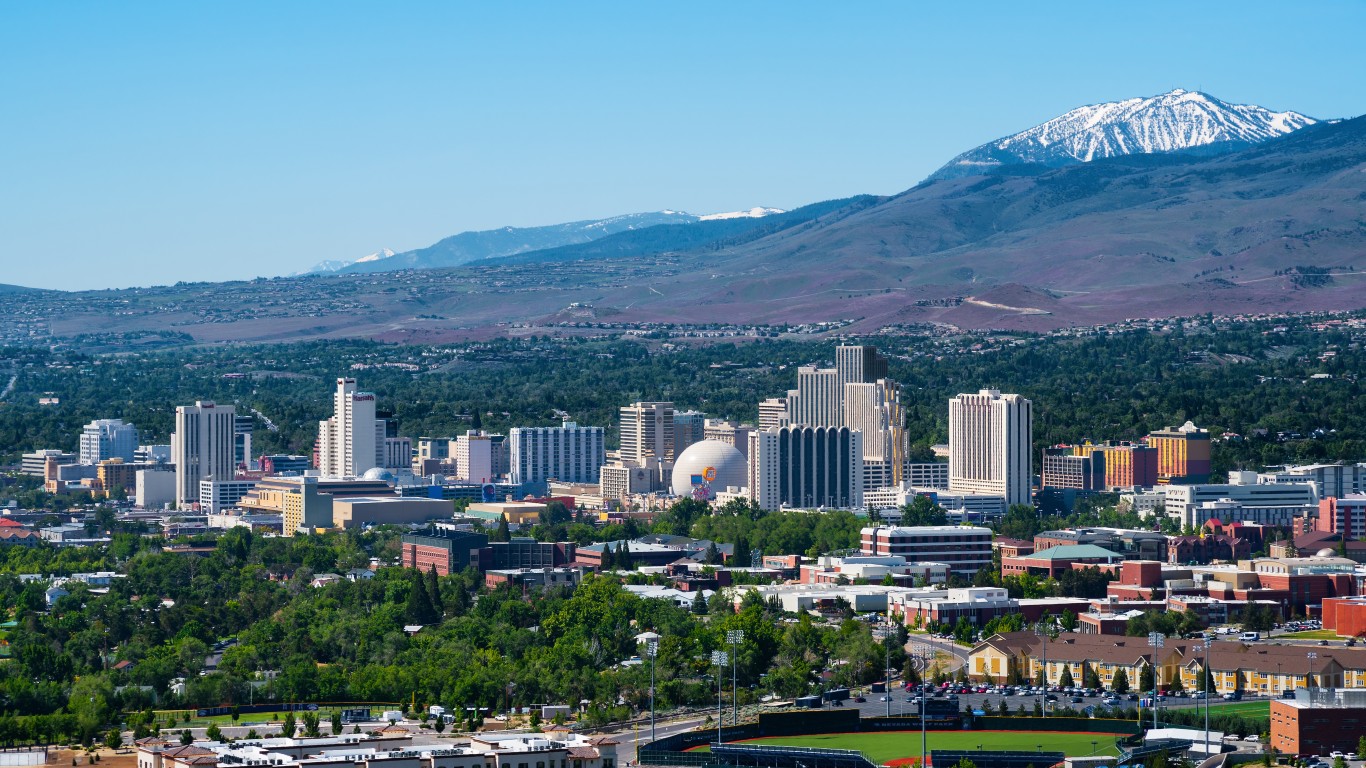
Nevada: Reno
> Cost of living in Reno: 1.6% less expensive than U.S. avg.
> Cost of living in Nevada: 2.6% less expensive than U.S. avg.
> Poverty rate: 10.4% (state: 12.5%)
> Median household income: $72,132 (state: $63,276)

New Hampshire: Manchester-Nashua
> Cost of living in Manchester-Nashua: 7.6% more expensive than U.S. avg.
> Cost of living in New Hampshire: 6.5% more expensive than U.S. avg.
> Poverty rate: 7.3% (state: 7.3%)
> Median household income: $83,626 (state: $77,933)
[in-text-ad-2]
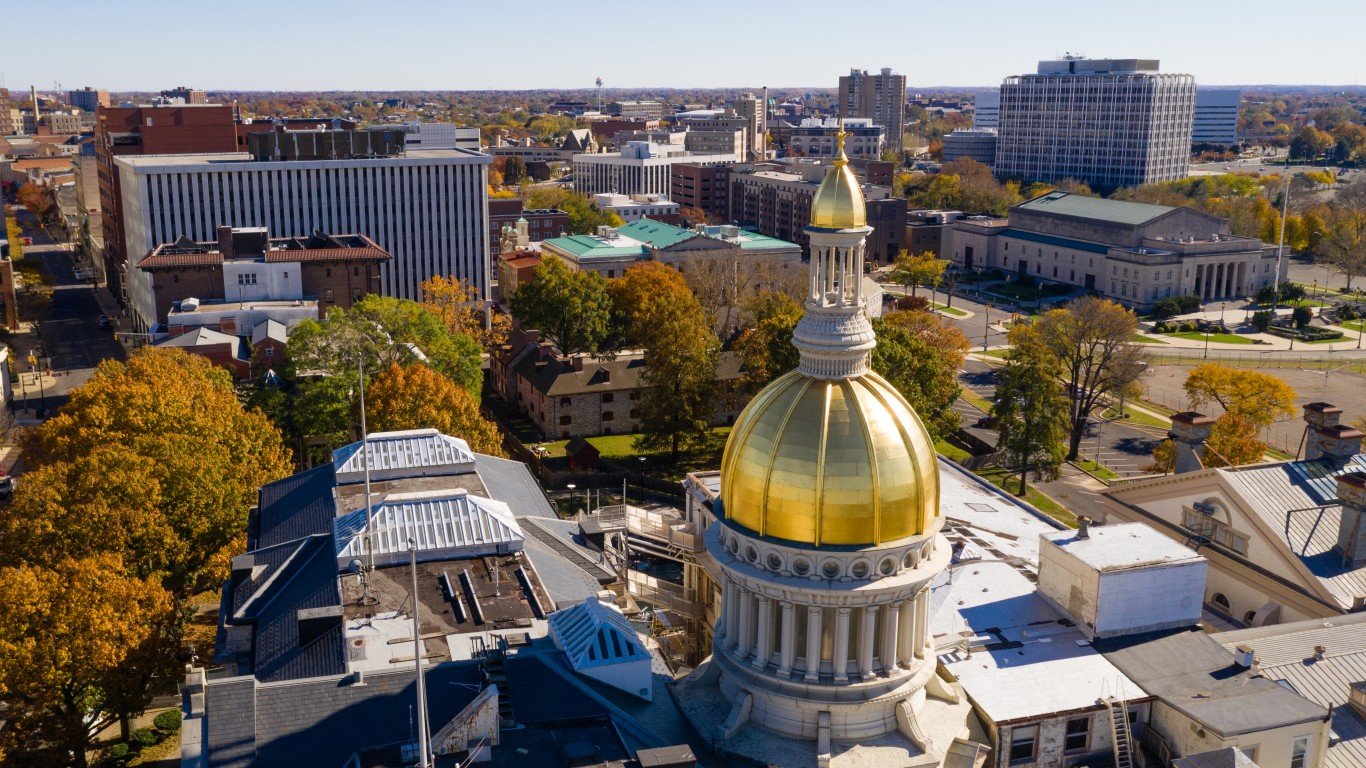
New Jersey: Trenton-Princeton
> Cost of living in Trenton-Princeton: 6.2% more expensive than U.S. avg.
> Cost of living in New Jersey: 16.0% more expensive than U.S. avg.
> Poverty rate: 12.8% (state: 9.2%)
> Median household income: $79,492 (state: $85,751)
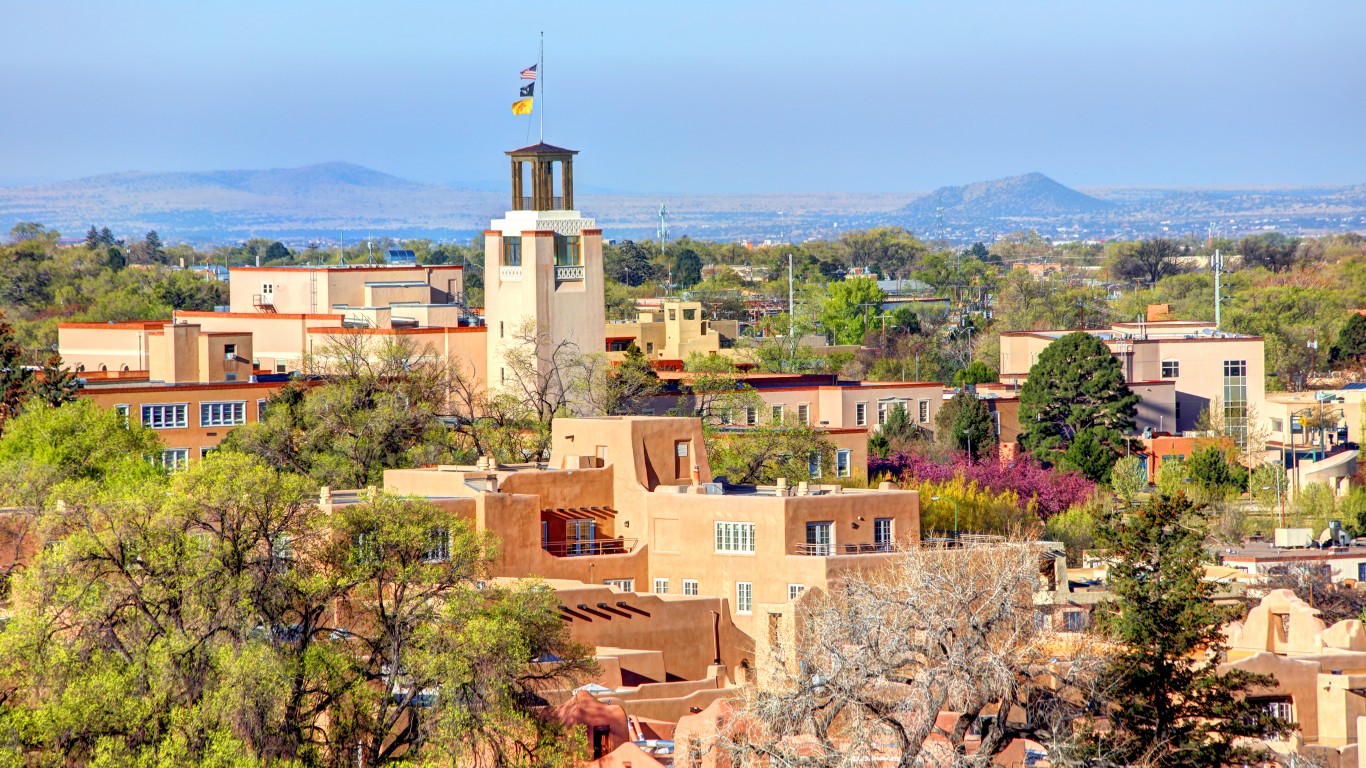
New Mexico: Santa Fe
> Cost of living in Santa Fe: 3.0% less expensive than U.S. avg.
> Cost of living in New Mexico: 8.9% less expensive than U.S. avg.
> Poverty rate: 13.0% (state: 18.2%)
> Median household income: $61,298 (state: $51,945)
[in-text-ad]

New York: New York-Newark-Jersey City
> Cost of living in New York-Newark-Jersey City: 25.7% more expensive than U.S. avg.
> Cost of living in New York: 16.3% more expensive than U.S. avg.
> Poverty rate: 11.6% (state: 13.0%)
> Median household income: $83,160 (state: $72,108)
[recirclink id=886163]

North Carolina: Raleigh-Cary
> Cost of living in Raleigh-Cary: 3.9% less expensive than U.S. avg.
> Cost of living in North Carolina: 8.3% less expensive than U.S. avg.
> Poverty rate: 8.9% (state: 13.6%)
> Median household income: $80,096 (state: $57,341)

North Dakota: Bismarck
> Cost of living in Bismarck: 8.1% less expensive than U.S. avg.
> Cost of living in North Dakota: 10.7% less expensive than U.S. avg.
> Poverty rate: 5.9% (state: 10.6%)
> Median household income: $70,979 (state: $64,577)
[in-text-ad-2]

Ohio: Columbus
> Cost of living in Columbus: 8.4% less expensive than U.S. avg.
> Cost of living in Ohio: 11.6% less expensive than U.S. avg.
> Poverty rate: 11.5% (state: 13.1%)
> Median household income: $67,207 (state: $58,642)

Oklahoma: Oklahoma City
> Cost of living in Oklahoma City: 10.2% less expensive than U.S. avg.
> Cost of living in Oklahoma: 12.8% less expensive than U.S. avg.
> Poverty rate: 13.1% (state: 15.2%)
> Median household income: $60,605 (state: $54,449)
[in-text-ad]

Oregon: Portland-Vancouver-Hillsboro
> Cost of living in Portland-Vancouver-Hillsboro: 5.0% more expensive than U.S. avg.
> Cost of living in Oregon: 2.2% more expensive than U.S. avg.
> Poverty rate: 9.6% (state: 11.4%)
> Median household income: $78,439 (state: $67,058)
[recirclink id=890721]

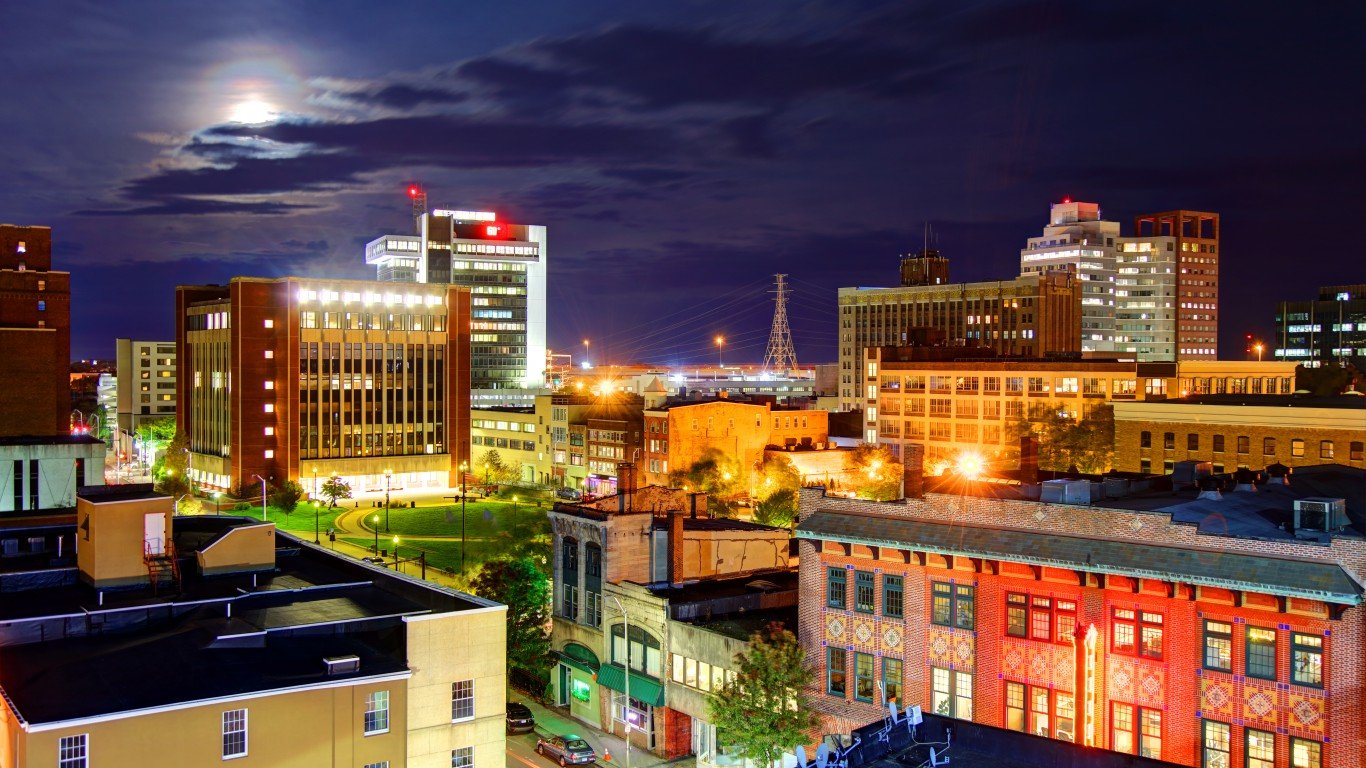
Pennsylvania: Philadelphia-Camden-Wilmington
> Cost of living in Philadelphia-Camden-Wilmington: 5.3% more expensive than U.S. avg.
> Cost of living in Pennsylvania: 3.0% less expensive than U.S. avg.
> Poverty rate: 11.8% (state: 12.0%)
> Median household income: $74,533 (state: $63,463)

Rhode Island: Providence-Warwick
> Cost of living in Providence-Warwick: 0.3% more expensive than U.S. avg.
> Cost of living in Rhode Island: 1.3% more expensive than U.S. avg.
> Poverty rate: 11.0% (state: 10.8%)
> Median household income: $70,967 (state: $71,169)
[in-text-ad-2]
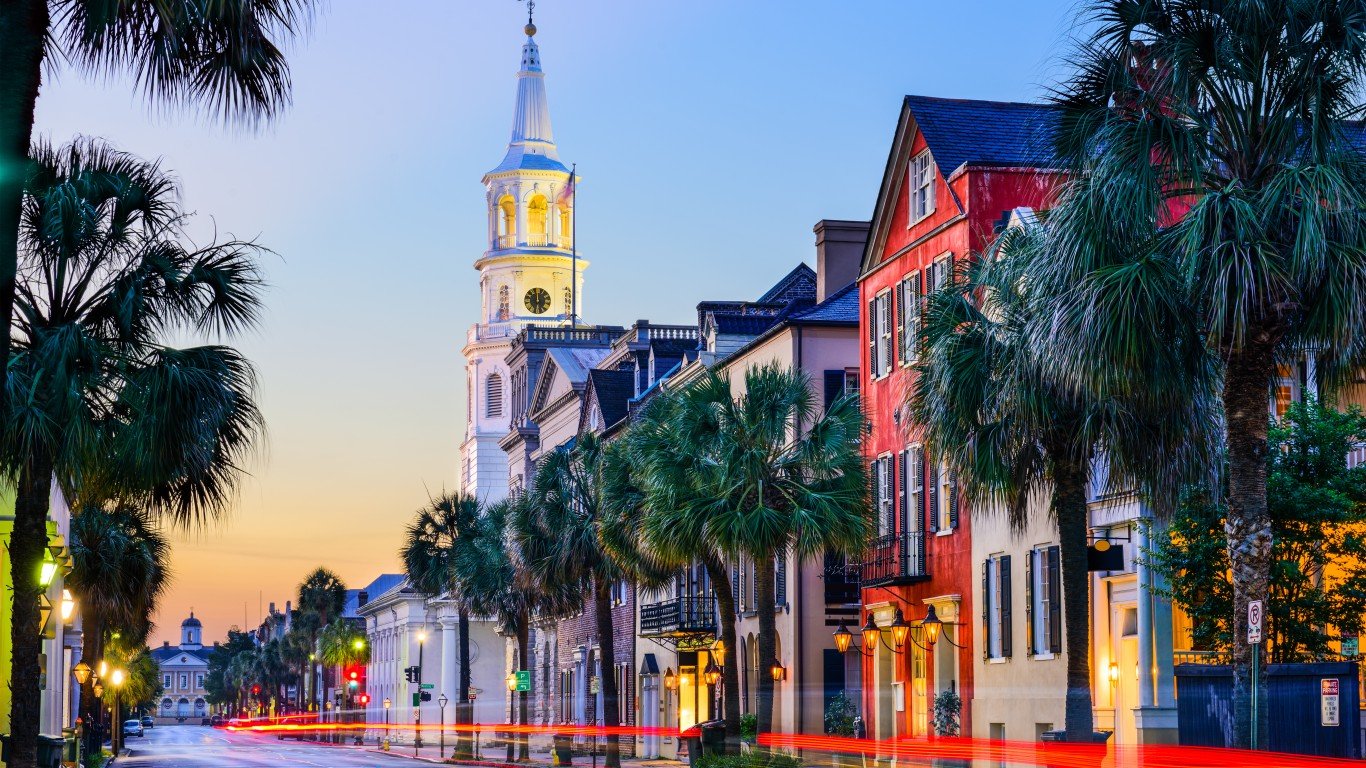
South Carolina: Charleston-North Charleston
> Cost of living in Charleston-North Charleston: 2.9% less expensive than U.S. avg.
> Cost of living in South Carolina: 8.5% less expensive than U.S. avg.
> Poverty rate: 10.7% (state: 13.8%)
> Median household income: $70,505 (state: $56,227)

South Dakota: Sioux Falls
> Cost of living in Sioux Falls: 8.8% less expensive than U.S. avg.
> Cost of living in South Dakota: 12.2% less expensive than U.S. avg.
> Poverty rate: 7.7% (state: 11.9%)
> Median household income: $65,566 (state: $59,533)
[in-text-ad]

Tennessee: Nashville-Davidson–Murfreesboro–Franklin
> Cost of living in Nashville-Davidson–Murfreesboro–Franklin: 5.6% less expensive than U.S. avg.
> Cost of living in Tennessee: 10.3% less expensive than U.S. avg.
> Poverty rate: 10.0% (state: 13.9%)
> Median household income: $70,262 (state: $56,071)
[recirclink id=926147]
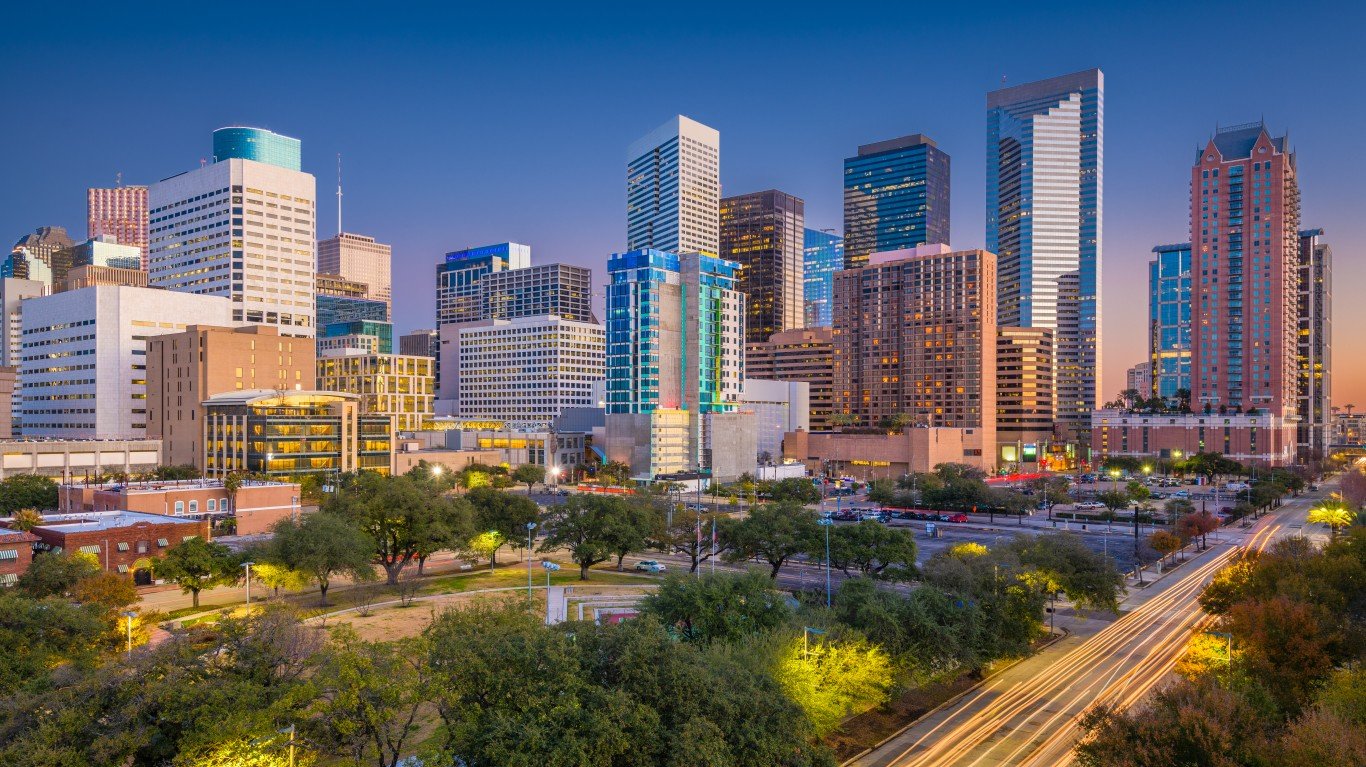
Texas: Houston-The Woodlands-Sugar Land
> Cost of living in Houston-The Woodlands-Sugar Land: 1.7% more expensive than U.S. avg.
> Cost of living in Texas: 3.5% less expensive than U.S. avg.
> Poverty rate: 12.9% (state: 13.6%)
> Median household income: $69,193 (state: $64,034)

Utah: Salt Lake City
> Cost of living in Salt Lake City: 1.4% less expensive than U.S. avg.
> Cost of living in Utah: 3.5% less expensive than U.S. avg.
> Poverty rate: 8.6% (state: 8.9%)
> Median household income: $80,196 (state: $75,780)
[in-text-ad-2]
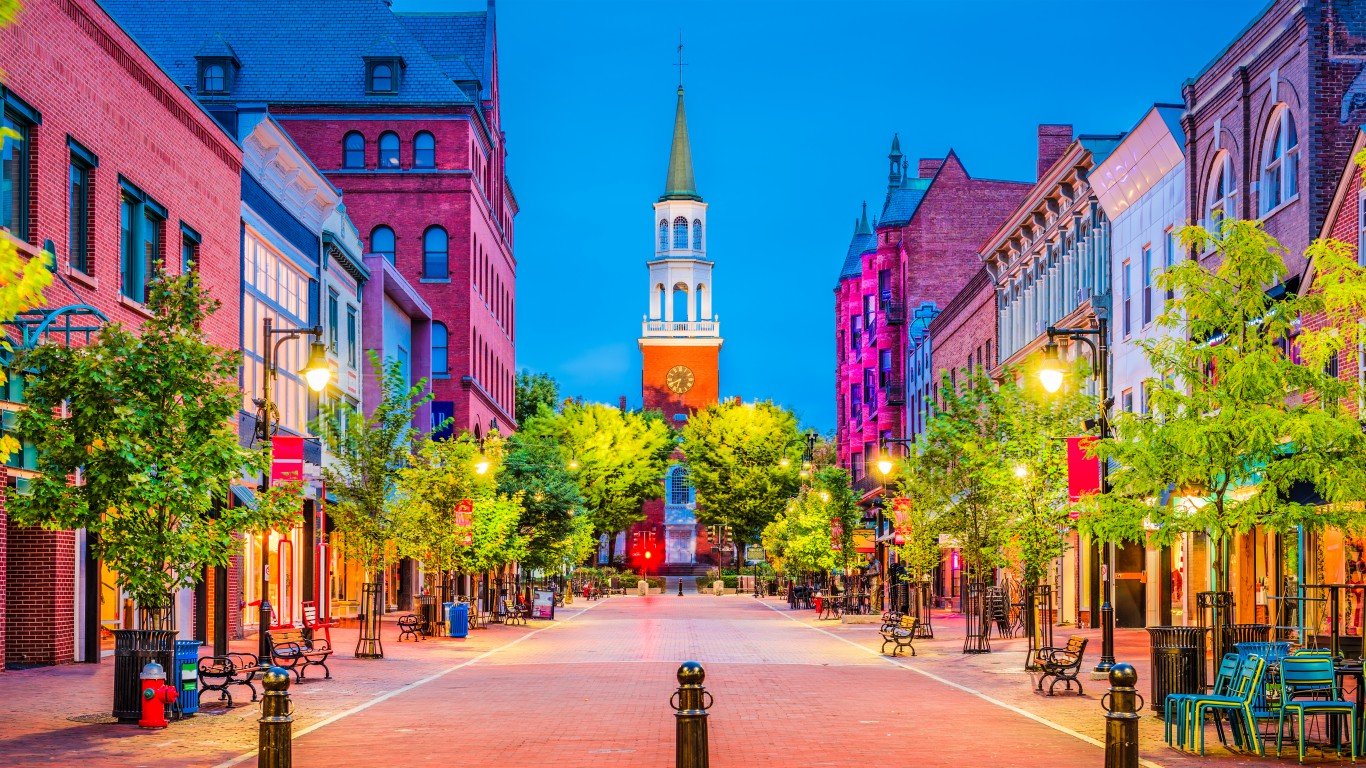
Vermont: Burlington-South Burlington
> Cost of living in Burlington-South Burlington: 6.2% more expensive than U.S. avg.
> Cost of living in Vermont: 3.1% more expensive than U.S. avg.
> Poverty rate: 11.4% (state: 10.2%)
> Median household income: $74,909 (state: $63,001)
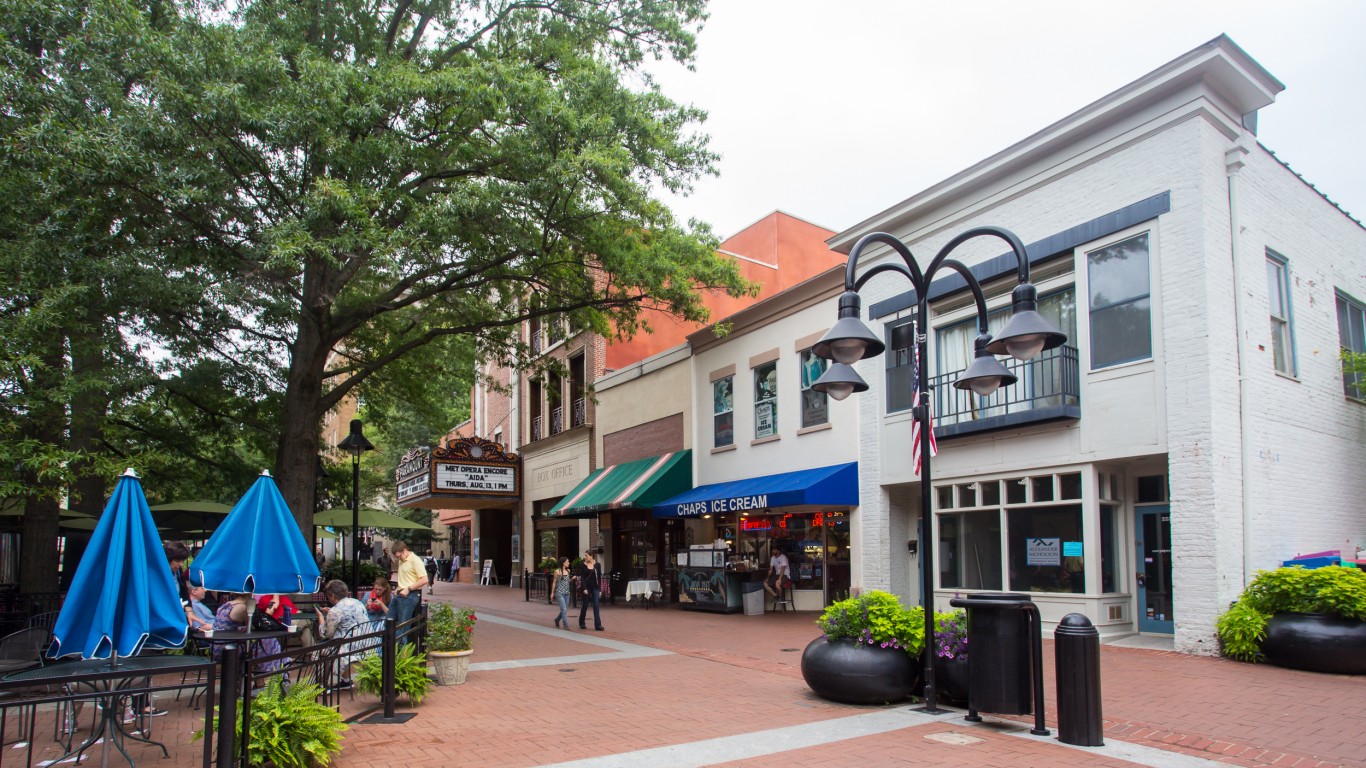
Virginia: Charlottesville
> Cost of living in Charlottesville: 1.2% less expensive than U.S. avg.
> Cost of living in Virginia: 1.3% more expensive than U.S. avg.
> Poverty rate: 11.2% (state: 9.9%)
> Median household income: $75,907 (state: $76,456)
[in-text-ad]

Washington: Seattle-Tacoma-Bellevue
> Cost of living in Seattle-Tacoma-Bellevue: 14.5% more expensive than U.S. avg.
> Cost of living in Washington: 8.4% more expensive than U.S. avg.
> Poverty rate: 7.8% (state: 9.8%)
> Median household income: $94,027 (state: $78,687)
[recirclink id=915429]
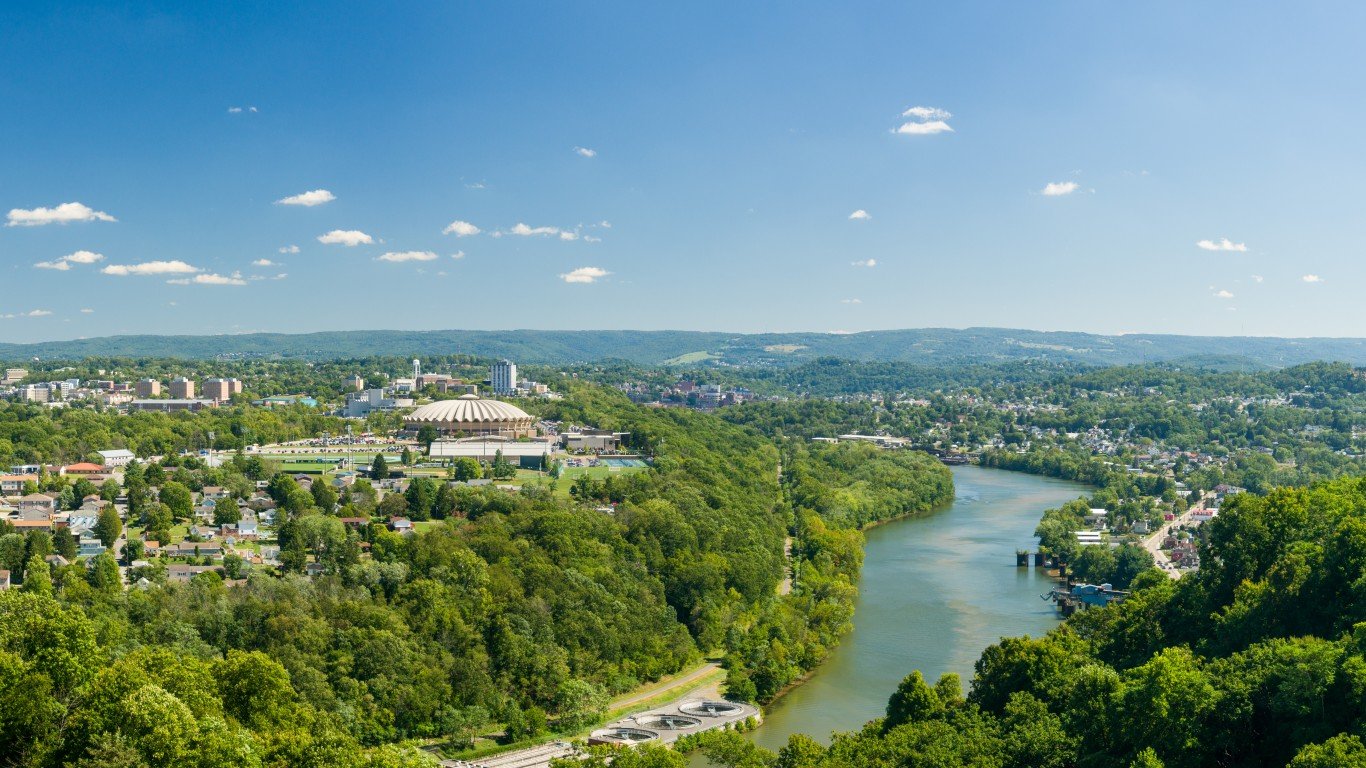
West Virginia: Morgantown
> Cost of living in Morgantown: 10.2% less expensive than U.S. avg.
> Cost of living in West Virginia: 12.9% less expensive than U.S. avg.
> Poverty rate: 20.1% (state: 16.0%)
> Median household income: $56,395 (state: $48,850)
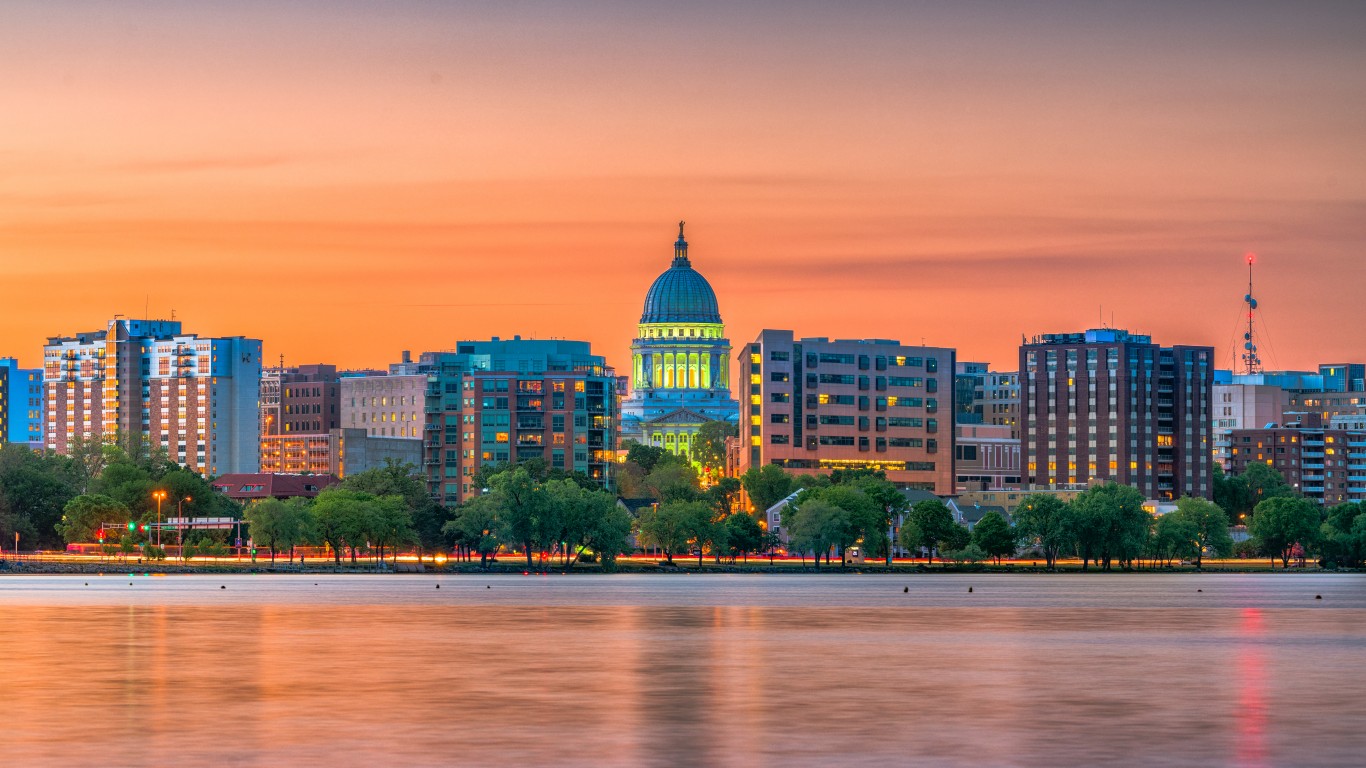
Wisconsin: Madison
> Cost of living in Madison: 3.6% less expensive than U.S. avg.
> Cost of living in Wisconsin: 8.1% less expensive than U.S. avg.
> Poverty rate: 8.9% (state: 10.4%)
> Median household income: $75,545 (state: $64,168)
[in-text-ad-2]

Wyoming: Casper
> Cost of living in Casper: 7.0% less expensive than U.S. avg.
> Cost of living in Wyoming: 7.2% less expensive than U.S. avg.
> Poverty rate: 8.6% (state: 10.1%)
> Median household income: $65,034 (state: $65,003)
Contact [email protected] for any questions or corrections.