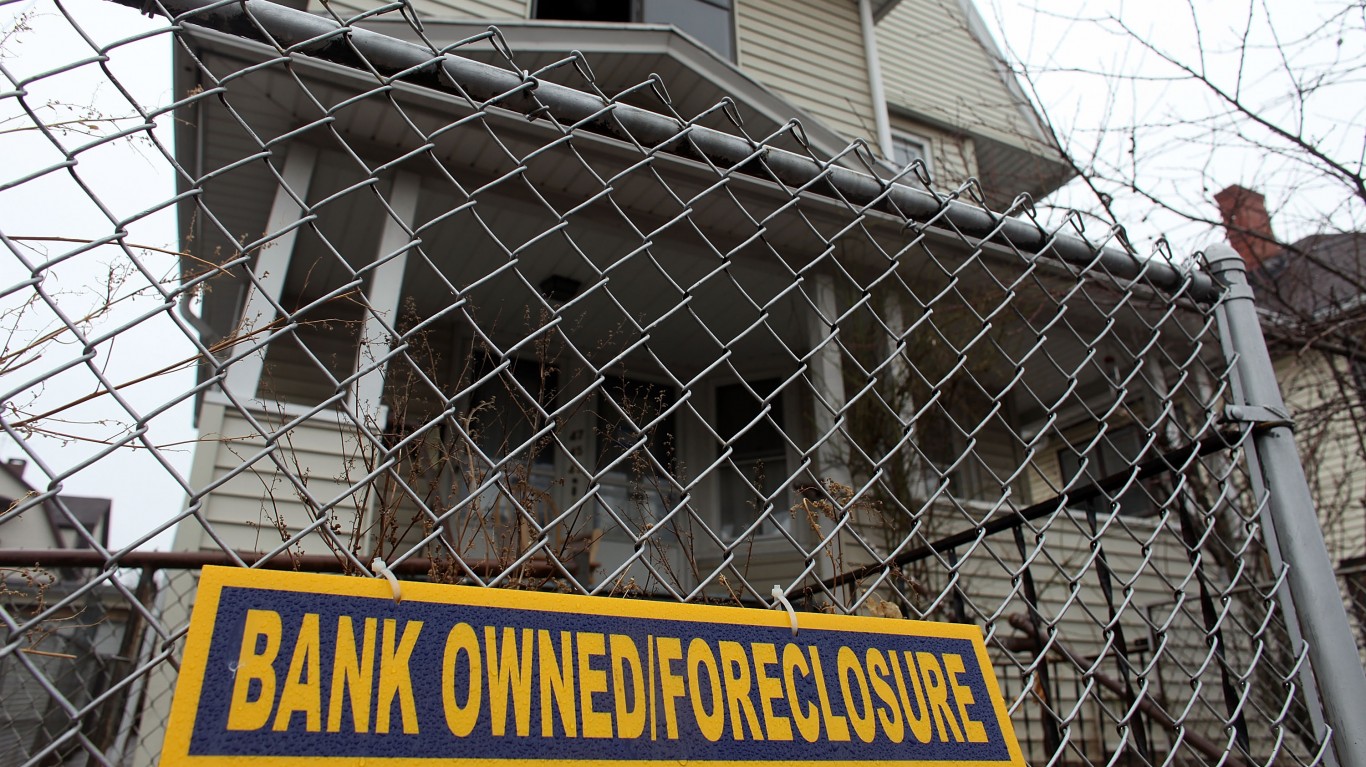
Since COVID-19 reached the United States in early 2020, the financial situation of millions of Americans has deteriorated, even as a number of the nation’s wealthiest saw their fortunes increase by billions of dollars.
When census data covering the period affected by the pandemic is released, the U.S. poverty rate, which was 12.3% in 2019, would likely be higher. In some historically impoverished metropolitan areas that were reportedly affected disproportionately by the virus, the poverty rate is likely to rise even more. This may also mean that wealthier cities may have weathered the crisis better than the nation as a whole would not see as significant an increase, if at all, in their poverty rates.
To determine the metro with the highest poverty rate in every state, 24/7 Wall St. reviewed one-year estimates of the percentage of people who live below the poverty line in each metropolitan area from the U.S. Census Bureau’s 2019 American Community Survey. It should be noted that a number of states only have one metropolitan area, so that metro ranks on this list by default only. In 2019, 12.3% of Americans had incomes below the poverty line. Of the 50 metro areas on this list, 27 had poverty rates below 10%.
For reference, the U.S. Department of Health and Human services sets the official poverty threshold at an annual income of no more than approximately $26,000 for a family of four.
Relative affluence can be found all across the country. Still, in some states, even the metro area that struggles the least with poverty has a higher poverty rate than the U.S. as a whole. In Mississippi, for example, the metropolitan area with the lowest poverty rate — Jackson — has a poverty rate of 15.5%, compared to the national poverty rate of 12.3%. Generally speaking, the metro areas on this list with higher poverty rates are in states with relatively high poverty as well. Mississippi has the highest poverty rate of any state, at 19.6%.
Click here to see the metro in every state where the fewest people live below the poverty line.
Click here to see our detailed methodology.

Alabama: Daphne-Fairhope-Foley
> Poverty rate: 10.1% (Alabama: 15.5%)
> Number of people living below poverty line: 22,140 (Alabama: 739,108)
> Households receiving SNAP benefits: 6.5% (Alabama: 13.0%)
> Median household income: $56,439 (Alabama: $51,734)
[in-text-ad]

Alaska: Anchorage*
> Poverty rate: 10.0% (Alaska: 10.1%)
> Number of people living below poverty line: 38,789 (Alaska: 71,938)
> Households receiving SNAP benefits: 9.3% (Alaska: 10.3%)
> Median household income: $80,676 (Alaska: $75,463)
*Because Anchorage is the only eligible metro in Alaska, it is the metro with the lowest poverty rate by default.
[recirclink id=887395]

Arizona: Prescott Valley-Prescott
> Poverty rate: 12.0% (Arizona: 13.5%)
> Number of people living below poverty line: 27,568 (Arizona: 958,442)
> Households receiving SNAP benefits: 7.3% (Arizona: 9.4%)
> Median household income: $53,816 (Arizona: $62,055)

Arkansas: Fayetteville-Springdale-Rogers
> Poverty rate: 12.6% (Arkansas: 16.2%)
> Number of people living below poverty line: 65,911 (Arkansas: 474,739)
> Households receiving SNAP benefits: 5.4% (Arkansas: 11.0%)
> Median household income: $61,674 (Arkansas: $48,952)
[in-text-ad-2]

California: San Jose-Sunnyvale-Santa Clara
> Poverty rate: 6.3% (California: 11.8%)
> Number of people living below poverty line: 123,477 (California: 4,552,837)
> Households receiving SNAP benefits: 3.9% (California: 8.4%)
> Median household income: $130,865 (California: $80,440)

Colorado: Greeley
> Poverty rate: 7.9% (Colorado: 9.3%)
> Number of people living below poverty line: 24,966 (Colorado: 526,979)
> Households receiving SNAP benefits: 5.2% (Colorado: 6.9%)
> Median household income: $78,615 (Colorado: $77,127)
[in-text-ad]

Connecticut: Norwich-New London
> Poverty rate: 7.2% (Connecticut: 10.0%)
> Number of people living below poverty line: 18,349 (Connecticut: 347,149)
> Households receiving SNAP benefits: 10.9% (Connecticut: 11.1%)
> Median household income: $75,633 (Connecticut: $78,833)
[recirclink id=887395]

Delaware: Dover*
> Poverty rate: 13.0% (Delaware: 11.3%)
> Number of people living below poverty line: 22,573 (Delaware: 106,383)
> Households receiving SNAP benefits: 14.0% (Delaware: 10.1%)
> Median household income: $58,001 (Delaware: $70,176)
*Because Dover is the only eligible metro in Delaware, it is the metro with the lowest poverty rate by default.
Florida: Palm Bay-Melbourne-Titusville
> Poverty rate: 8.7% (Florida: 12.7%)
> Number of people living below poverty line: 51,942 (Florida: 2,664,772)
> Households receiving SNAP benefits: 8.6% (Florida: 11.8%)
> Median household income: $57,305 (Florida: $59,227)
[in-text-ad-2]

Georgia: Atlanta-Sandy Springs-Alpharetta
> Poverty rate: 10.5% (Georgia: 13.3%)
> Number of people living below poverty line: 623,646 (Georgia: 1,373,909)
> Households receiving SNAP benefits: 9.1% (Georgia: 11.2%)
> Median household income: $71,742 (Georgia: $61,980)

Hawaii: Urban Honolulu
> Poverty rate: 8.1% (Hawaii: 9.3%)
> Number of people living below poverty line: 76,644 (Hawaii: 128,722)
> Households receiving SNAP benefits: 9.0% (Hawaii: 10.4%)
> Median household income: $87,470 (Hawaii: $83,102)
[in-text-ad]

Idaho: Idaho Falls
> Poverty rate: 8.5% (Idaho: 11.2%)
> Number of people living below poverty line: 12,845 (Idaho: 195,984)
> Households receiving SNAP benefits: 8.0% (Idaho: 8.3%)
> Median household income: $63,616 (Idaho: $60,999)
[recirclink id=889166]

Illinois: Chicago-Naperville-Elgin
> Poverty rate: 10.6% (Illinois: 11.5%)
> Number of people living below poverty line: 981,876 (Illinois: 1,420,542)
> Households receiving SNAP benefits: 10.8% (Illinois: 11.8%)
> Median household income: $75,379 (Illinois: $69,187)

Indiana: Elkhart-Goshen
> Poverty rate: 9.2% (Indiana: 11.9%)
> Number of people living below poverty line: 18,484 (Indiana: 775,823)
> Households receiving SNAP benefits: 6.3% (Indiana: 8.5%)
> Median household income: $54,531 (Indiana: $57,603)
[in-text-ad-2]

Iowa: Des Moines-West Des Moines
> Poverty rate: 8.7% (Iowa: 11.2%)
> Number of people living below poverty line: 59,509 (Iowa: 341,613)
> Households receiving SNAP benefits: 9.6% (Iowa: 9.5%)
> Median household income: $71,164 (Iowa: $61,691)

Kansas: Topeka
> Poverty rate: 9.6% (Kansas: 11.4%)
> Number of people living below poverty line: 21,814 (Kansas: 323,189)
> Households receiving SNAP benefits: 7.4% (Kansas: 7.0%)
> Median household income: $59,567 (Kansas: $62,087)
[in-text-ad]

Kentucky: Elizabethtown-Fort Knox
> Poverty rate: 11.1% (Kentucky: 16.3%)
> Number of people living below poverty line: 16,622 (Kentucky: 703,627)
> Households receiving SNAP benefits: 8.6% (Kentucky: 11.9%)
> Median household income: $55,246 (Kentucky: $52,295)
[recirclink id=887395]

Louisiana: Baton Rouge
> Poverty rate: 15.0% (Louisiana: 19.0%)
> Number of people living below poverty line: 125,069 (Louisiana: 857,894)
> Households receiving SNAP benefits: 11.5% (Louisiana: 14.4%)
> Median household income: $60,746 (Louisiana: $51,073)

Maine: Portland-South Portland
> Poverty rate: 7.7% (Maine: 10.9%)
> Number of people living below poverty line: 40,468 (Maine: 141,803)
> Households receiving SNAP benefits: 8.3% (Maine: 12.3%)
> Median household income: $71,913 (Maine: $58,924)
[in-text-ad-2]

Maryland: Baltimore-Columbia-Towson
> Poverty rate: 9.4% (Maryland: 9.0%)
> Number of people living below poverty line: 258,075 (Maryland: 532,241)
> Households receiving SNAP benefits: 10.6% (Maryland: 9.8%)
> Median household income: $83,160 (Maryland: $86,738)

Massachusetts: Barnstable Town
> Poverty rate: 5.2% (Massachusetts: 9.4%)
> Number of people living below poverty line: 10,948 (Massachusetts: 625,763)
> Households receiving SNAP benefits: 5.2% (Massachusetts: 11.2%)
> Median household income: $85,042 (Massachusetts: $85,843)
[in-text-ad]

Michigan: Midland
> Poverty rate: 9.3% (Michigan: 13.0%)
> Number of people living below poverty line: 7,657 (Michigan: 1,269,062)
> Households receiving SNAP benefits: 10.6% (Michigan: 11.7%)
> Median household income: $69,872 (Michigan: $59,584)
[recirclink id=887395]

Minnesota: Rochester
> Poverty rate: 6.9% (Minnesota: 9.0%)
> Number of people living below poverty line: 15,066 (Minnesota: 494,683)
> Households receiving SNAP benefits: 6.2% (Minnesota: 7.4%)
> Median household income: $75,926 (Minnesota: $74,593)

Mississippi: Jackson
> Poverty rate: 15.5% (Mississippi: 19.6%)
> Number of people living below poverty line: 88,296 (Mississippi: 564,192)
> Households receiving SNAP benefits: 11.6% (Mississippi: 13.5%)
> Median household income: $52,426 (Mississippi: $45,792)
[in-text-ad-2]

Missouri: St. Louis
> Poverty rate: 9.9% (Missouri: 12.9%)
> Number of people living below poverty line: 272,601 (Missouri: 770,175)
> Households receiving SNAP benefits: 9.5% (Missouri: 10.2%)
> Median household income: $66,417 (Missouri: $57,409)

Montana: Missoula
> Poverty rate: 11.5% (Montana: 12.6%)
> Number of people living below poverty line: 13,463 (Montana: 131,882)
> Households receiving SNAP benefits: 6.9% (Montana: 8.7%)
> Median household income: $57,347 (Montana: $57,153)
[in-text-ad]

Nebraska: Omaha-Council Bluffs
> Poverty rate: 9.1% (Nebraska: 9.9%)
> Number of people living below poverty line: 84,979 (Nebraska: 185,761)
> Households receiving SNAP benefits: 7.9% (Nebraska: 7.6%)
> Median household income: $70,373 (Nebraska: $63,229)
[recirclink id=889166]

Nevada: Reno
> Poverty rate: 10.4% (Nevada: 12.5%)
> Number of people living below poverty line: 48,858 (Nevada: 379,564)
> Households receiving SNAP benefits: 9.3% (Nevada: 10.5%)
> Median household income: $72,132 (Nevada: $63,276)

New Hampshire: Manchester-Nashua*
> Poverty rate: 7.3% (New Hampshire: 7.3%)
> Number of people living below poverty line: 29,991 (New Hampshire: 95,711)
> Households receiving SNAP benefits: 6.2% (New Hampshire: 6.0%)
> Median household income: $83,626 (New Hampshire: $77,933)
*Because Manchester-Nashua is the only eligible metro in New Hampshire, it is the metro with the lowest poverty rate by default.
[in-text-ad-2]

New Jersey: Atlantic City-Hammonton
> Poverty rate: 11.1% (New Jersey: 9.2%)
> Number of people living below poverty line: 28,609 (New Jersey: 798,262)
> Households receiving SNAP benefits: 11.1% (New Jersey: 7.4%)
> Median household income: $63,389 (New Jersey: $85,751)

New Mexico: Santa Fe
> Poverty rate: 13.0% (New Mexico: 18.2%)
> Number of people living below poverty line: 19,220 (New Mexico: 373,230)
> Households receiving SNAP benefits: 11.1% (New Mexico: 16.4%)
> Median household income: $61,298 (New Mexico: $51,945)
[in-text-ad]

New York: Albany-Schenectady-Troy
> Poverty rate: 10.2% (New York: 13.0%)
> Number of people living below poverty line: 87,059 (New York: 2,467,006)
> Households receiving SNAP benefits: 9.5% (New York: 14.1%)
> Median household income: $73,398 (New York: $72,108)
[recirclink id=887395]

North Carolina: Raleigh-Cary
> Poverty rate: 8.9% (North Carolina: 13.6%)
> Number of people living below poverty line: 121,022 (North Carolina: 1,386,122)
> Households receiving SNAP benefits: 7.3% (North Carolina: 11.6%)
> Median household income: $80,096 (North Carolina: $57,341)
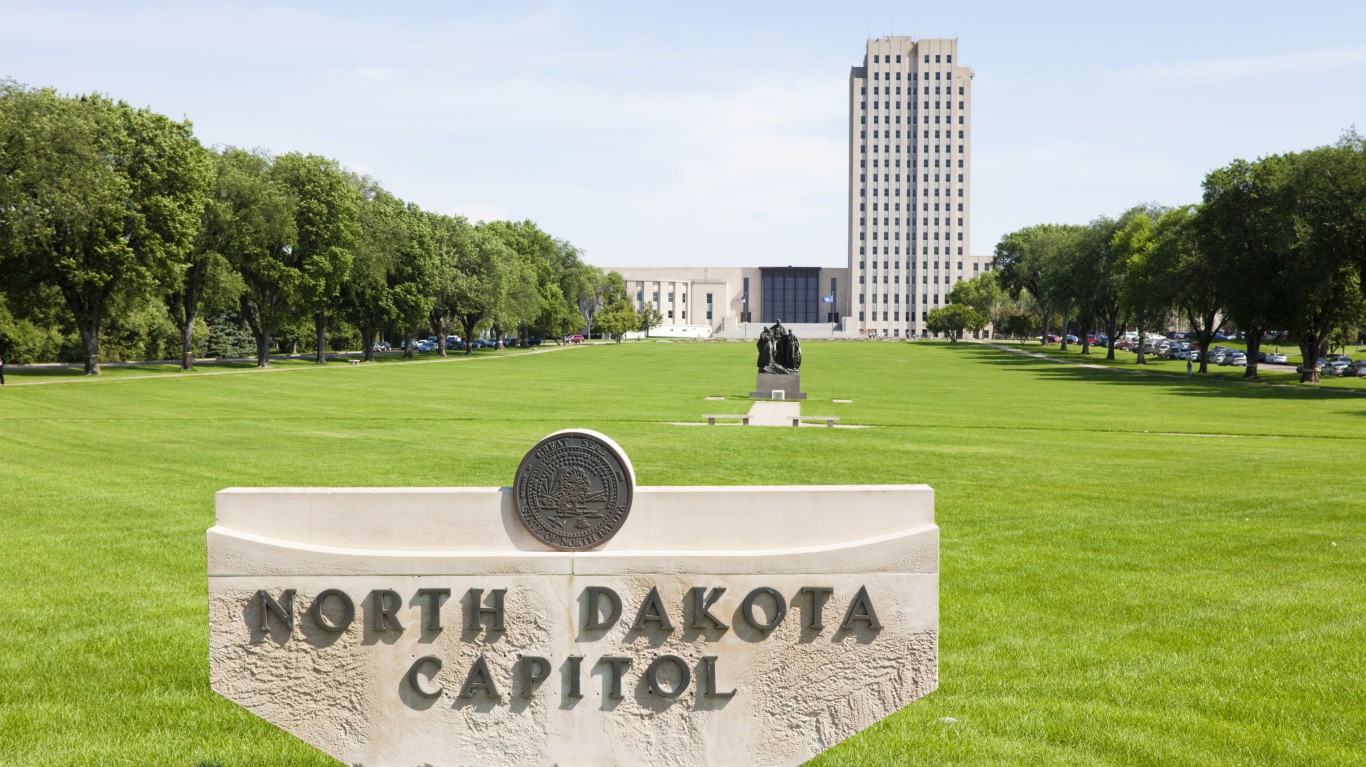
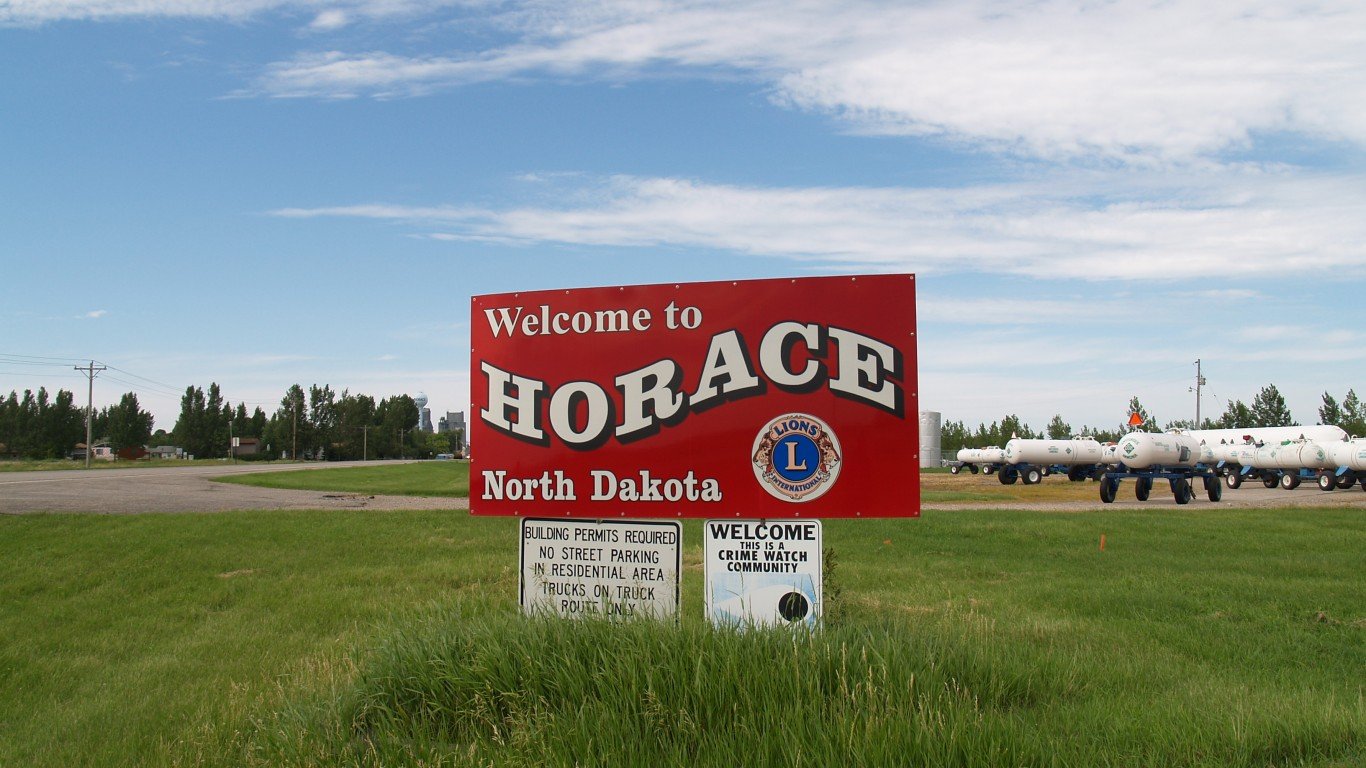
North Dakota: Bismarck
> Poverty rate: 5.9% (North Dakota: 10.6%)
> Number of people living below poverty line: 7,395 (North Dakota: 78,112)
> Households receiving SNAP benefits: 5.2% (North Dakota: 6.9%)
> Median household income: $70,979 (North Dakota: $64,577)
[in-text-ad-2]

Ohio: Cincinnati
> Poverty rate: 11.3% (Ohio: 13.1%)
> Number of people living below poverty line: 245,500 (Ohio: 1,484,862)
> Households receiving SNAP benefits: 8.0% (Ohio: 12.0%)
> Median household income: $66,825 (Ohio: $58,642)

Oklahoma: Oklahoma City
> Poverty rate: 13.1% (Oklahoma: 15.2%)
> Number of people living below poverty line: 181,062 (Oklahoma: 583,029)
> Households receiving SNAP benefits: 10.1% (Oklahoma: 12.0%)
> Median household income: $60,605 (Oklahoma: $54,449)
[in-text-ad]

Oregon: Portland-Vancouver-Hillsboro
> Poverty rate: 9.6% (Oregon: 11.4%)
> Number of people living below poverty line: 236,844 (Oregon: 470,643)
> Households receiving SNAP benefits: 10.0% (Oregon: 13.4%)
> Median household income: $78,439 (Oregon: $67,058)
[recirclink id=887395]

Pennsylvania: Gettysburg
> Poverty rate: 7.2% (Pennsylvania: 12.0%)
> Number of people living below poverty line: 7,066 (Pennsylvania: 1,489,333)
> Households receiving SNAP benefits: 6.9% (Pennsylvania: 13.5%)
> Median household income: $67,715 (Pennsylvania: $63,463)

Rhode Island: Providence-Warwick*
> Poverty rate: 11.0% (Rhode Island: 10.8%)
> Number of people living below poverty line: 173,218 (Rhode Island: 110,244)
> Households receiving SNAP benefits: 14.7% (Rhode Island: 14.5%)
> Median household income: $70,967 (Rhode Island: $71,169)
*Because Providence-Warwick is the only eligible metro in Rhode Island, it is the metro with the lowest poverty rate by default.
[in-text-ad-2]

South Carolina: Charleston-North Charleston
> Poverty rate: 10.7% (South Carolina: 13.8%)
> Number of people living below poverty line: 83,348 (South Carolina: 692,744)
> Households receiving SNAP benefits: 6.8% (South Carolina: 9.9%)
> Median household income: $70,505 (South Carolina: $56,227)

South Dakota: Sioux Falls
> Poverty rate: 7.7% (South Dakota: 11.9%)
> Number of people living below poverty line: 20,123 (South Dakota: 101,946)
> Households receiving SNAP benefits: 9.1% (South Dakota: 8.7%)
> Median household income: $65,566 (South Dakota: $59,533)
[in-text-ad]

Tennessee: Nashville-Davidson–Murfreesboro–Franklin
> Poverty rate: 10.0% (Tennessee: 13.9%)
> Number of people living below poverty line: 189,007 (Tennessee: 922,176)
> Households receiving SNAP benefits: 7.4% (Tennessee: 11.4%)
> Median household income: $70,262 (Tennessee: $56,071)
[recirclink id=889166]

Texas: Austin-Round Rock-Georgetown
> Poverty rate: 10.1% (Texas: 13.6%)
> Number of people living below poverty line: 221,105 (Texas: 3,865,010)
> Households receiving SNAP benefits: 6.4% (Texas: 10.8%)
> Median household income: $80,954 (Texas: $64,034)

Utah: Ogden-Clearfield
> Poverty rate: 5.6% (Utah: 8.9%)
> Number of people living below poverty line: 37,708 (Utah: 281,279)
> Households receiving SNAP benefits: 5.8% (Utah: 5.5%)
> Median household income: $79,251 (Utah: $75,780)
[in-text-ad-2]

Vermont: Burlington-South Burlington*
> Poverty rate: 11.4% (Vermont: 10.2%)
> Number of people living below poverty line: 23,934 (Vermont: 60,897)
> Households receiving SNAP benefits: 7.9% (Vermont: 10.0%)
> Median household income: $74,909 (Vermont: $63,001)
*Because Burlington-South Burlington is the only eligible metro in Vermont, it is the metro with the lowest poverty rate by default.

Virginia: Staunton
> Poverty rate: 7.3% (Virginia: 9.9%)
> Number of people living below poverty line: 8,530 (Virginia: 822,775)
> Households receiving SNAP benefits: 10.0% (Virginia: 7.8%)
> Median household income: $57,844 (Virginia: $76,456)
[in-text-ad]

Washington: Bremerton-Silverdale-Port Orchard
> Poverty rate: 6.9% (Washington: 9.8%)
> Number of people living below poverty line: 18,090 (Washington: 730,240)
> Households receiving SNAP benefits: 7.8% (Washington: 10.6%)
> Median household income: $79,624 (Washington: $78,687)
[recirclink id=887395]

West Virginia: Wheeling
> Poverty rate: 11.4% (West Virginia: 16.0%)
> Number of people living below poverty line: 15,111 (West Virginia: 278,734)
> Households receiving SNAP benefits: 11.8% (West Virginia: 16.9%)
> Median household income: $50,440 (West Virginia: $48,850)

Wisconsin: Fond du Lac
> Poverty rate: 6.2% (Wisconsin: 10.4%)
> Number of people living below poverty line: 6,191 (Wisconsin: 591,486)
> Households receiving SNAP benefits: 7.2% (Wisconsin: 9.4%)
> Median household income: $65,329 (Wisconsin: $64,168)
[in-text-ad-2]

Wyoming: Cheyenne*
> Poverty rate: 9.8% (Wyoming: 10.1%)
> Number of people living below poverty line: 9,469 (Wyoming: 56,945)
> Households receiving SNAP benefits: 6.8% (Wyoming: 4.7%)
> Median household income: $70,567 (Wyoming: $65,003)
*Because Cheyenne is the only eligible metro in Wyoming, it is the metro with the lowest poverty rate by default.
Methodology
To determine the metro with the lowest poverty rate in every state, 24/7 Wall St. reviewed one-year estimates of the percentage of people that live below the poverty line in each metropolitan area from the U.S. Census Bureau’s 2019 American Community Survey.
We used the 384 metropolitan statistical areas as delineated by the United States Office of Management and Budget and used by the Census Bureau as our definition of metros.
Metros were excluded if the sampling error associated with a metro’s data was deemed too high.
The sampling error was defined as too high if the coefficient of variation — a statistical assessment of how reliable an estimate is — for a metro’s poverty rate was above 15% and greater than two standard deviations above the mean CV for all metros’ poverty rates. We similarly excluded metros that had a sampling error too high for their population, using the same definition.
Since many metros cross state lines, the metro was assigned to the state of its first-listed principal city. Thus, the Washington-Arlington-Alexandria, DC-VA-MD-WV metro area was excluded as it is principally in the District of Columbia.
The remaining 369 metros were ranked within their state based on their poverty rates. Additional information on the number of people living below the poverty line, median household income, and the share of households receiving SNAP benefits are also one-year estimates from the 2019 ACS.
Contact [email protected] for any questions or corrections.